Back to Journals » Nature and Science of Sleep » Volume 14
The Fingerprint-Like Pattern of Nocturnal Brain Activity Demonstrated in Young Individuals is Also Present in Senior Adulthood
Authors Eggert T ![]() , Dorn H, Danker-Hopfe H
, Dorn H, Danker-Hopfe H
Received 31 August 2021
Accepted for publication 22 December 2021
Published 21 January 2022 Volume 2022:14 Pages 109—120
DOI https://doi.org/10.2147/NSS.S336379
Checked for plagiarism Yes
Review by Single anonymous peer review
Peer reviewer comments 3
Editor who approved publication: Prof. Dr. Ahmed BaHammam
Torsten Eggert, Hans Dorn, Heidi Danker-Hopfe
Charité – Universitätsmedizin Berlin, Competence Centre of Sleep Medicine, Berlin, Germany
Correspondence: Heidi Danker-Hopfe, Email [email protected]
Purpose: The quantitative sleep EEG has been considered as electroencephalographic “fingerprint”, ie, it is stable within but differs between individuals. So far, however, almost all studies addressing this aspect have been conducted in young men. It was therefore of interest to know whether the sleep EEG fingerprint concept holds true in older samples of both sexes.
Patients and Methods: Data from three different subsamples of 30 healthy individuals each were reused for the present secondary analysis (young men (YM) = 25.6 ± 2.4 years, elderly men (EM) = 69.1 ± 5.5 years, elderly women (EW) = 67.8 ± 5.7 years). Individuals slept ten times in the sleep laboratory, resulting in a total of 900 study nights. However, to avoid misinterpretation due to intervention-related changes in sleep EEG power spectra, only the 3 sham nights without any intervention were included, reducing the datasets to 270. To determine stability of NREM sleep EEG power spectra between sham night pairs, within- and between-subject Manhattan distance measures were computed separately by sample.
Results: Regardless of subsample and sham night pair, lowest distance measures, ie, largest similarity, were observed for within-subject power spectra comparisons (range of mean distance measures for EW from 3.82 to 4.06, for EM from 3.55 to 3.63, and for YM from 3.04 to 3.62). Moreover, intraindividual similarity did not differ substantially between samples. Between-subject power spectra distance measures were considerably larger (range of mean distance measures for EW from 12.95 to 13.15, for EM from 12.21 to 12.57, and for YM from 10.33 to 10.78) and varied significantly between young and elderly individuals.
Conclusion: The present results support the view that the sleep EEG power spectrum is an individual trait-like characteristic that remains unique up until old age. This finding may help to increase the sensitivity in measuring intervention effects.
Keywords: sleep EEG power spectra, aging and sleep, heritability of sleep EEG, electroencephalographic fingerprint, trait-like quantitative EEG characteristics, individuality of sleep EEG
Introduction
Individual variability is an important issue in the science of sleep. It has been found that many sleep parameters are subject to individual differences, which in parts reflect non-replicable and thus state-dependent variations due to specific environmental or experimental circumstances; on the other hand, these differences may rather indicate a characteristic trait if they are stable within an individual.1 Corresponding individual traits have also been observed for sleep spindles, including, eg, Eggert et al,2 and for sleepiness parameters derived from pupillographic assessment.3 Traits are to some extent genetically determined. The twin method, for example, provided important insights into the role of genetic influences on human sleep.4 For example, a recent meta-analysis revealed that 46% of the variability in sleep duration (range of available standardized heritability estimates between studies: 0% to 71%) and 44% of the variability in sleep quality (range of available standardized heritability estimates between studies: 0% to 53%) could be attributed to genetic variation between individuals, which the authors considered to be indicative of a moderate to strong genetic control.5 Another study reported significant genetic influence on some variables characterizing sleep architecture.6 Furthermore, twin studies demonstrated a significant genetic impact on nocturnal brain activities measured by electroencephalography (EEG), suggesting that at least some frequency ranges in the sleep EEG are highly heritable.6–9 In one of these studies, a heritability estimate of 96% was obtained for power spectra at the 8 to 16Hz frequency range during NREM sleep,8 whereas another study focusing on the topographical distribution of sleep EEG power in this context yielded lower heritability estimates for these specific frequencies.9 The authors of this study reported heritability estimates for the power spectra in the delta to sigma bands, ranging from 12% to 20% and from 1% to 20% for NREM and REM sleep, respectively. They further observed heritability estimates ranging from 44% to 57% in the beta bands for both NREM and REM sleep.9
Trait-like characteristics of nocturnal brain signals have also been investigated in non-twins. For this purpose, the similarity of within- and between-individual quantitative EEG parameters obtained from longitudinal sleep EEG data was calculated to determine the degree of individuality. This can be done on a sleep stage-specific basis either for a single electrode site or by considering a larger topographic distribution. Studies that used this approach revealed a remarkably stable sleep EEG power across multiple nights in the same individual, with sufficient variation between individuals to distinguish them.10−19 For this reason, some authors introduced the term “fingerprint” when referring to the sleep EEG.11,12
However, as van Dongen et al1 already pointed out, previous research on the fingerprint aspect mostly studied small samples of young males. In addition, these authors mentioned that the sample selection is closely related to the extent of individual differences, as greater heterogeneity leads automatically to more pronounced variations among participants.1 One relevant source of heterogeneity in this context is aging. Not only is senescence inevitably accompanied by a wide variety of changes but also the moment when these changes occur is variable. For instance, Cabeza et al20 noted with respect to cognitive aging that while advanced adulthood is predominantly linked to cognitive decline, there are older individuals who have undergone an “optimal” aging process and, in some cases, perform as well or even better than young adults do. Similarly, the well-documented sleep changes in older adults21,22 may also differ depending on the quality of the aging process; individuals who age “optimally” may experience less impairment or may be affected at a later date.23 In their leitmotif on individual differences, van Dongen et al stressed the research need to “compare the heterogeneity of different populations with regard to the trait-specific aspects of sleep and waking functions.”1 The investigation of the fingerprint concept in study samples that are expected to show greater variability in sleep outcome parameters, such as healthy elderly individuals, therefore represents a valuable contribution to the respective literature.
To the best of these authors’ knowledge, Tan et al14 have been the only ones so far who considered this aspect not only in a small sample of young adults but also in older individuals (age range: 65.3–81.8 years) by determining the night-to-night variability of non-rapid eye movement (NREM) and rapid eye movement (REM) sleep EEG power for the frequency range of 0.3–45 Hz. They could show that spectral values were highly consistent within individuals and did not differ between young and elderly participants, indicating a trait-like stability of these measures.
Nevertheless, due to the small size of the senior sample (N=19; 11 females), uncertainty remains whether the individuality of EEG power demonstrated in young males is still characteristic for older individuals. The aim of the present analysis was therefore to provide further evidence that the sleep EEG is a physiological trait by confirming the fingerprint concept in young men and in older individuals of both sexes.
Materials and Methods
Sources and Context of Original Research Data
Information on sleep of healthy elderly male and female individuals and of healthy young male individuals has been collected in three different studies funded by the German Federal Office for Radiation Protection or by the Federal Agency for Public Safety Digital Radio. The original purpose of these randomized, double-blind experimental cross-over studies was to investigate whether an exposure to different sources of radiofrequency fields (RF-EMF) may have acute effects on the sleeping brain as well as on the waking brain in resting state and under cognitive demand. In the present analysis, only intervention-free sleep data were considered. The studies were approved by the ethics committee of the Charité – University Medicine Berlin (EA4/122/13 for both studies in elderly subjects; EA4/115/09 for the study in young males) and performed in accordance with the Declaration of Helsinki. Written informed consent was obtained from all volunteers prior to participation. A study withdrawal was possible at any time and for any reason; in any case, participants were paid an appropriate financial compensation.
Participants
To be included in the study, potential candidates, recruited primarily through the Internet and/or via word-of-mouth advertising, had to fulfill several (study-specific) enrollment criteria. These characteristics were checked at one of four different recruitment stages: telephone interview, questionnaires, medical examination, and a screening night in the sleep laboratory. All inclusion and exclusion criteria, together with the information about the stage at which they were screened, are shown in Supplementary Tables S1 and S2, respectively. The flow of participants through the recruitment process was documented for each study sample separately and has already been published elsewhere.24,25 A total of 30 individuals were enrolled in each of the three studies. Healthy elderly men were on average 69.1 (arithmetic mean) ± 5.5 (SD) years old, healthy elderly women 67.8 ± 5.7 years, and the mean age of the healthy young men was 25.6 ± 2.4 years. Additional information about the participants at the time of study enrollment are provided in Table 1. For a discussion of the differences observed between study samples at baseline, see Eggert et al.26
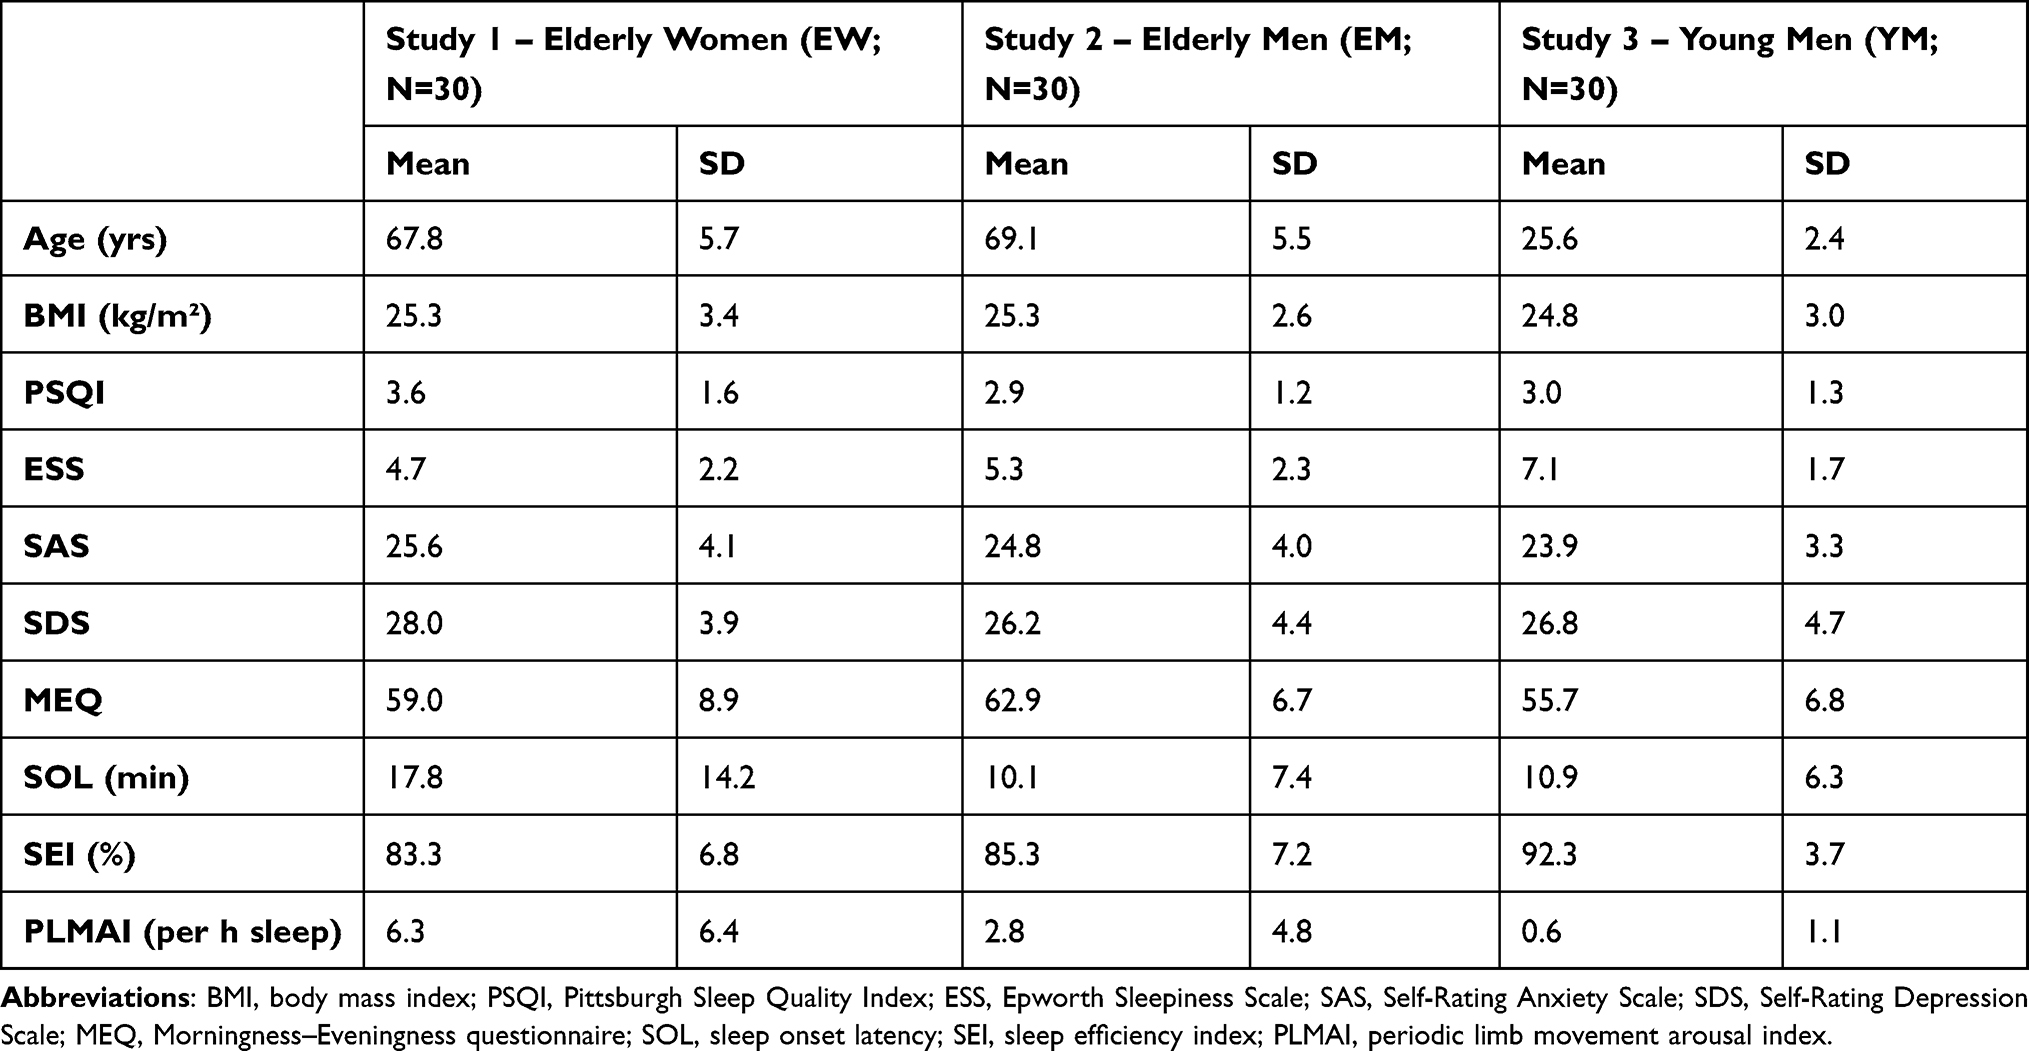 |
Table 1 Information About the Participants at the Time of Study Enrollment |
Experimental Setups
The experimental schedule and procedure were almost identical in all three studies. In short, each individual spent 10 nights in the sleep laboratory. An adaptation and screening night was followed by 9 experimental nights, of which 3 nights in each study were recorded either under one of two conditions with real RF-EMF exposure or under a condition without any RF-EMF exposure. Experimental nights were scheduled on the same day of the week for each study participant in most cases, and lights-out time was set according to the habitual bedtime at home. Moreover, participants were instructed to go to bed at normal times and to maintain a normal daily routine on the days before an experimental session. This was controlled by using actigraphy (Actiwatch Spectrum, Philips Respironics, Herrsching, Germany).
Because it is known that brain activity as measured by EEG power spectra may differ between RF-EMF exposure conditions,27 it was decided to include only information from the 3 experimental nights without any exposure (sham nights; SN) in the present analysis. The time interval between sham exposure nights ranged from 2 to 10 weeks. Detailed descriptions of the study procedures have been presented previously.24,25
Sleep Data Recording and Processing
Sleep recording during experimental nights included only those signals necessary for sleep stage assignment, ie, scalp electrodes to record EEG, outer canthi electrodes to monitor eye movements (electrooculography, EOG), and chin electrodes to register the muscle tone (electromyography, EMG). Standard EEG electrode arrangement28 was complemented by 13 additional electrodes to cover all 19 electrode positions of the international 10–20 system.29 EEG data were assessed using a Varioport-based system (Becker Meditec, Karlsruhe, Germany) and a Nihon Kohden system (Nihon Kohden, Tokyo, Japan). Differences in the recording properties of the systems were compensated for in a preprocessing step. Time in bed was set at 480 min in the study on young men and at 450 min in the studies on older men and women. Older individuals’ time in bed was set shorter than that of the younger men to account for the overall reduced sleep duration in advanced age.30 In order to still be able to compare the power spectra between the three samples, time in bed of the younger men was truncated by the last 30 min. It is important to note that by ignoring this period of time in bed, previously collected data and processes (eg, homeostatic sleep drive) are not affected. Sleep scoring was performed using a validated and FDA-approved computer‐assisted algorithm (Somnolyzer 24×7) as described in Anderer et al.31,32 This approach helps to minimize interrater variability.32 Sleep scoring followed the rules of the AASM.28
Power spectra were calculated for PSG epochs of 30s each. Welch’s method33 was used, based on 4s segments and 2s overlap, ie, 14 segments per epoch. A von-Hann taper was applied to the segments. Segments contaminated with artifacts were excluded based on two criteria: 1) a power limit in the upper frequency range to detect, eg, EMG artifacts and 2) a limit for sleep stage-specific peak-to-peak amplitudes to detect, eg, movement artifacts. As disturbances from the power frequency of 50 Hz would influence the sensitivity of the artifact detection, an appropriate notch filter was applied to all raw data. EEG signals were referenced to the averaged mastoid signals. Frequencies from 0.5 Hz to 21.75 Hz at a resolution of 0.25 Hz were included in the analysis. A more detailed description of these methodological aspects can be found in Eggert et al.26
Statistics
Following the recommendation by Gasser at al,34 the natural logarithm of the EEG power spectra was used (Note that for some illustrations untransformed power values were plotted on a logarithmic ordinate). Individuality of NREM sleep EEG signals recorded at C3 were quantified by proximity measures between all pairs of power spectra as described in Finelli et al.12 Between- and within-subject distances were determined for each of the 3 possible sham night comparisons (ie, first SN vs second SN, first SN vs third SN, and second SN vs third SN). Participants with any missing values in the datasets due to low-quality sham night recordings were completely discarded from these analyses (Specifically, one SN from one participant was affected by poor quality in study 1; one SN each from two participants as well as two SNs from a third participant were affected by poor quality in study 2; and one SN each from three participants was affected by poor quality in study 3). First, individual power spectra were z-standardized across all 86 frequency bins. Next, Manhattan distances (sum of absolute differences between all pairs of the 86 frequency bins) were calculated for all possible combinations of individual power spectra. Distance matrices were then visualized as triangular heatmaps. Finally, between-subject distances for all three SNs separately as well as within-subject distances resulting from pairwise comparisons of all 3 possible sham night combinations were tested for statistically significant differences by means of a Wilcoxon rank sum test. Differences were deemed statistically significant at an alpha below 0.05. Another possibility to visualize distances is to show the similarity between observations as a hierarchical structure, also known as dendrogram. Corresponding hierarchical cluster analyses were performed similarly to Tinguely et al,16 using Ward’s method35 for agglomerative clustering. All statistical analyses were performed with SAS 9.4 (SAS Institute, Cary NC, USA).
Results
Individuality of sleep EEG power spectra is illustrated in Figure 1 using the data of the older healthy men as an example, although the following findings also apply to the samples of elderly women and young men (data not shown). Figure 1 shows all-night power spectra for the 3 sham nights recorded at electrode position C3 during NREM sleep for each participant separately. It demonstrates that in most cases, the EEG power was quite stable within individuals (low intraindividual variation), while there was much more variability between individuals. This interindividual variation becomes even more obvious when the individual mean spectral values of the 3 nights are graphically contrasted (Figure 2 and Supplementary Figures S1 and S2). Manhattan distances between power spectra of the same and different individuals were calculated to quantify this observation. Figure 3 shows distance matrices for all three samples derived from the comparisons between first and second SNs. For the sake of consistency, corresponding comparisons between first and third SNs as well as between second and third SNs are presented in the supplement (Supplementary Figures S3 and S4, respectively) but are not further discussed here. As can be seen in Figure 3, smallest distances were measured for within-subject power spectra comparisons (diagonals in the black-framed squares) in all three samples, although the effect of greatest within-subject similarity varied slightly in magnitude among individuals. At the same time, between-subject distance measures showed rather a diffuse pattern of sometimes smaller and sometimes larger distances. Statistical analyses of between (BTW)- and within (WI)-subject distances obtained from the comparisons between first and second SNs confirmed this impression (Figure 4). In each sample, WI distance measures (mean distance measure ± SE for the sample of elderly women = 3.82 ± 0.33, elderly men = 3.59 ± 0.23, young men = 3.04 ± 0.20) were significantly smaller than the distance measures resulting from BTW comparisons (BTW first SN for the sample of elderly women = 12.95 ± 0.21, elderly men = 12.57 ± 0.25, young men = 10.33 ± 0.17; BTW second SN for the sample of elderly women = 12.97 ± 0.22, elderly men = 12.21 ± 0.23, young men = 10.39 ± 0.17. Figure 4 further shows that WI distance measure did not differ significantly between the samples. On the other hand, the average of all BTW distances resulting from first and second SN comparisons measured in young males (mean distance measure ± SE: 10.36 ± 0.12) were significantly smaller than those found for the elderly women (12.96 ± 0.15) and elderly men (12.39 ± 0.17), which is also indicated by the overall lower brightness in Figure 3. Interestingly, although the difference in distance measures between elderly men and women was marginal, it was statistically significant. The same applied to the statistical analyses of Manhattan distances of the first/second sham night pair (Supplementary Figure S5) and the second/third sham night pair (Supplementary Figure S6). The latter analysis additionally revealed that the WI distance measures of elderly women and young men differed significantly, with elderly women having slightly larger intraindividual distances than young men. Table 2 summarizes the data on distance measures for all 3 sham night comparisons and study samples.
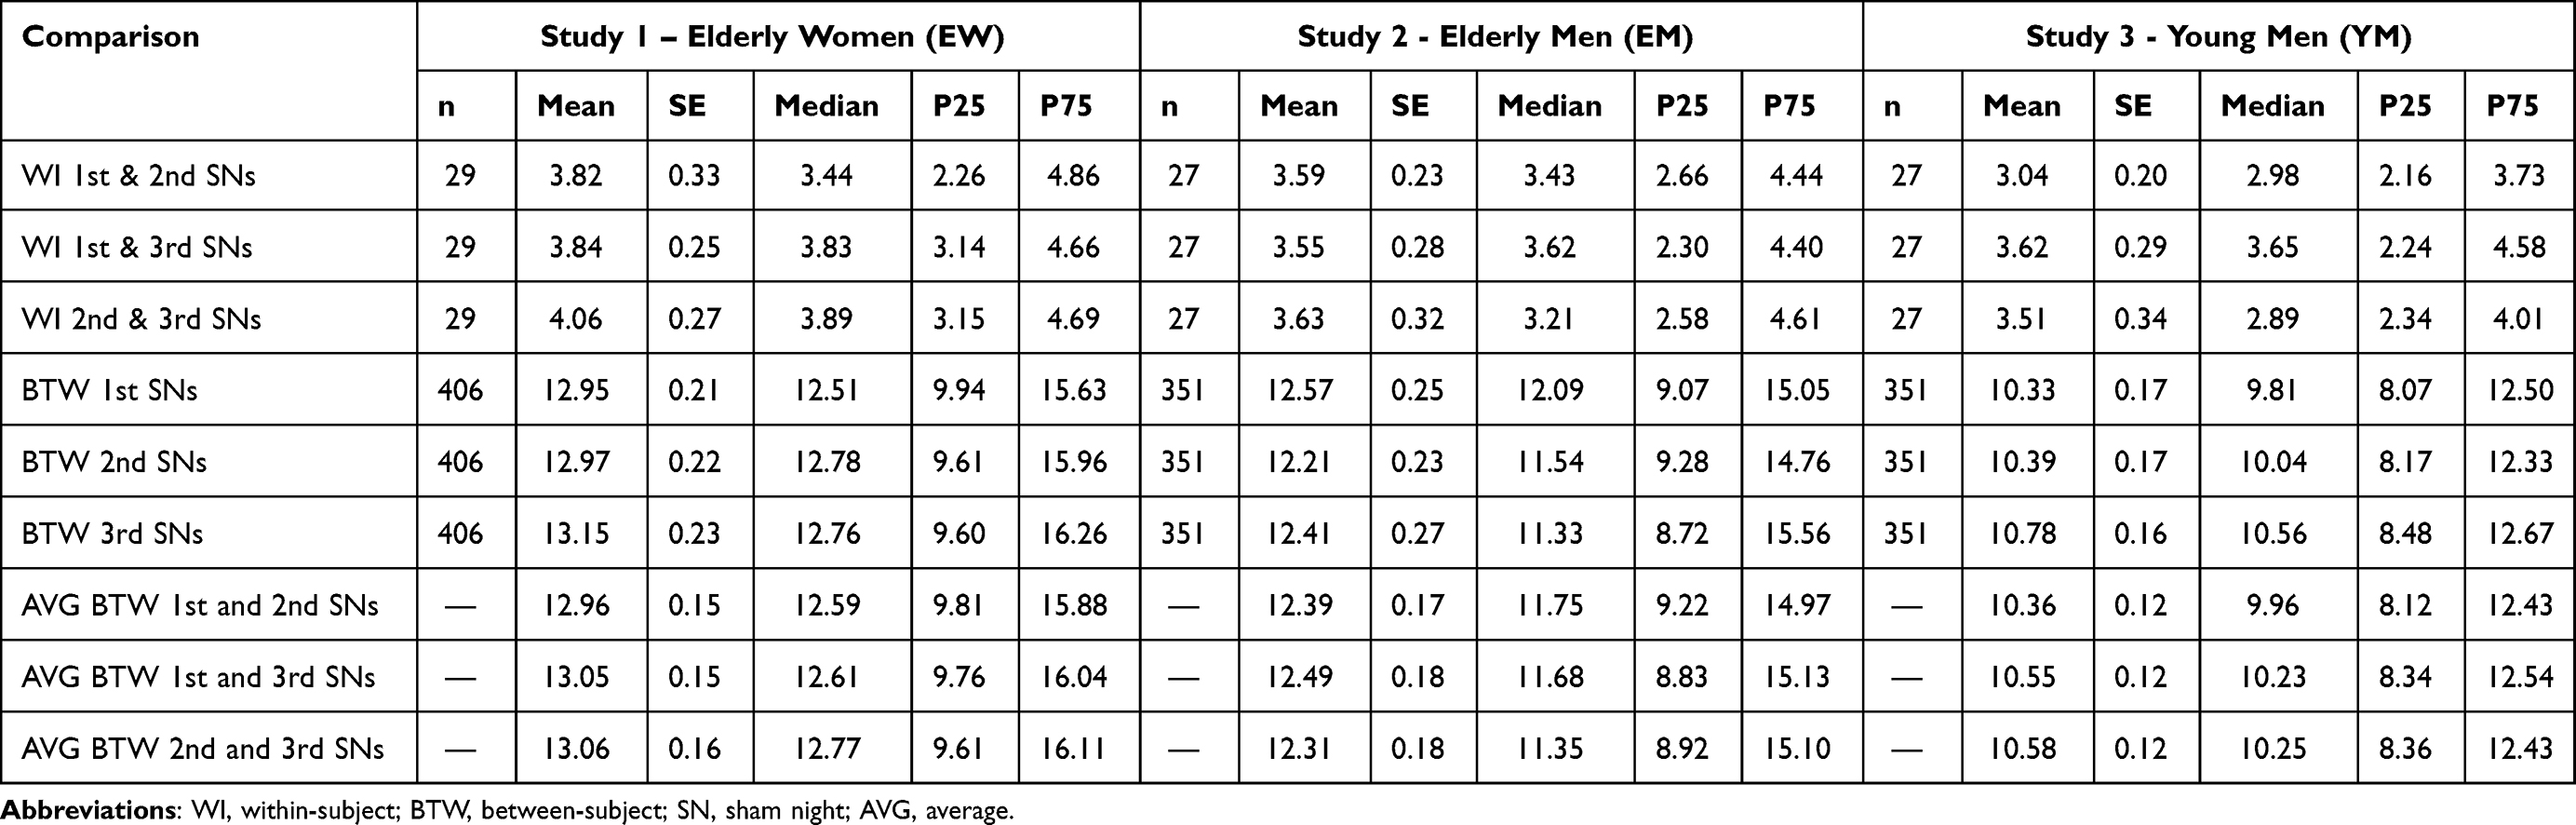 |
Table 2 Descriptive Statistics of Manhattan Distance Measures |
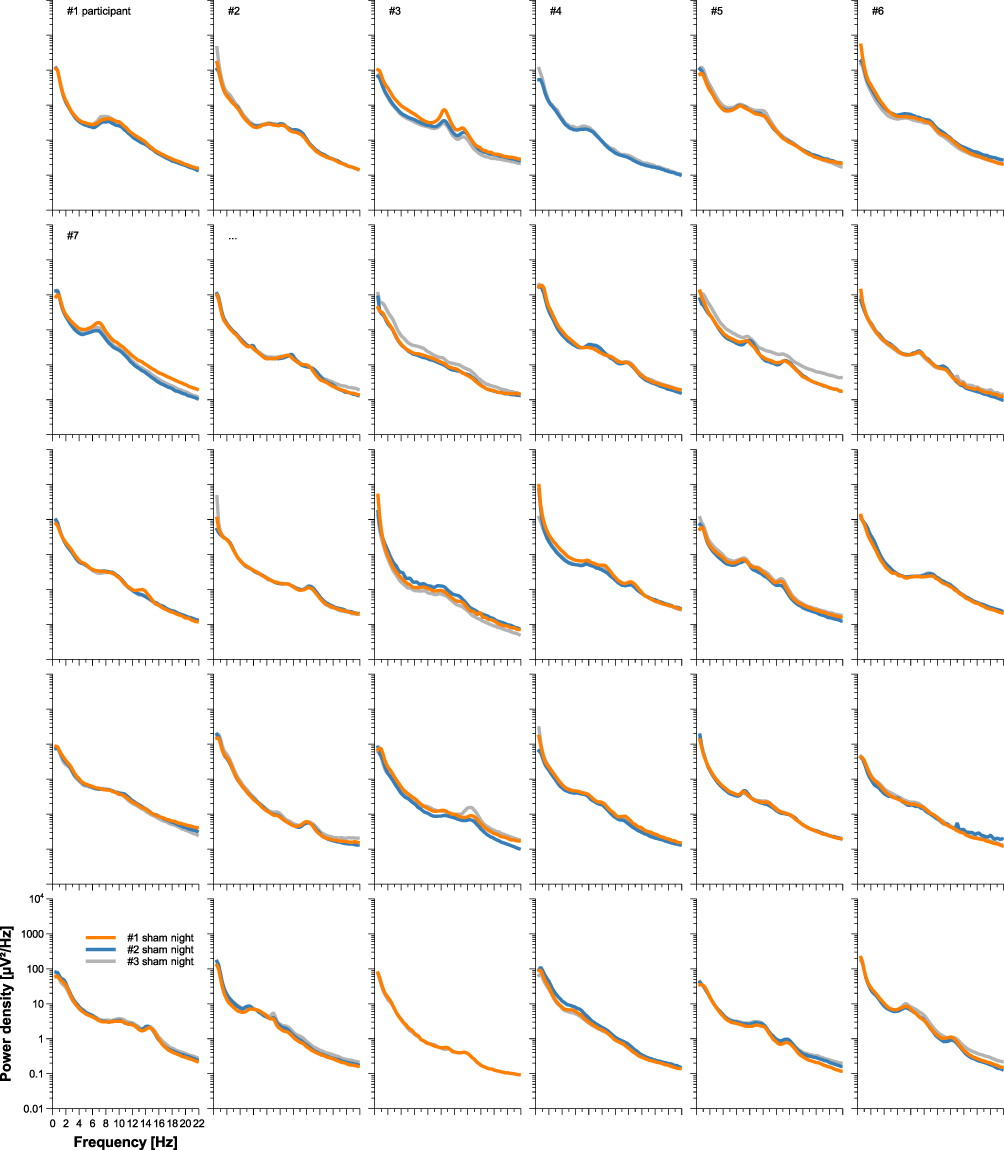 |
Figure 1 Individual sleep EEG power spectra by participant for the sample of elderly men. All-night power spectral densities from 3 different nights were plotted for all 30 participants separately. Data shown were recorded at electrode position C3 during NREM sleep. Missing spectral data, either complete or in parts, occurred in participants 2, 4 and 27. |
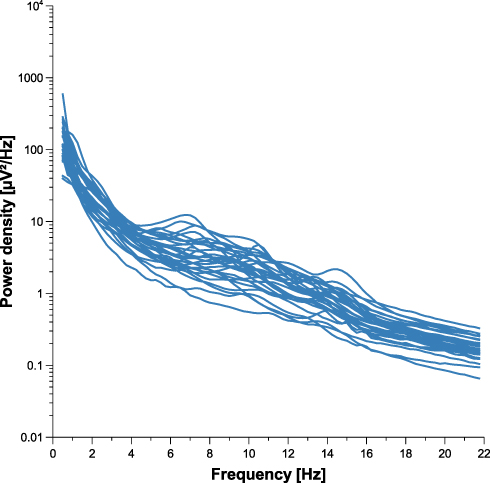 |
Figure 2 Individual means of the three sleep EEG power spectra for the sample of elderly men. The figure shows all-night power spectral densities recorded at electrode position C3 during NREM sleep averaged within participants. |
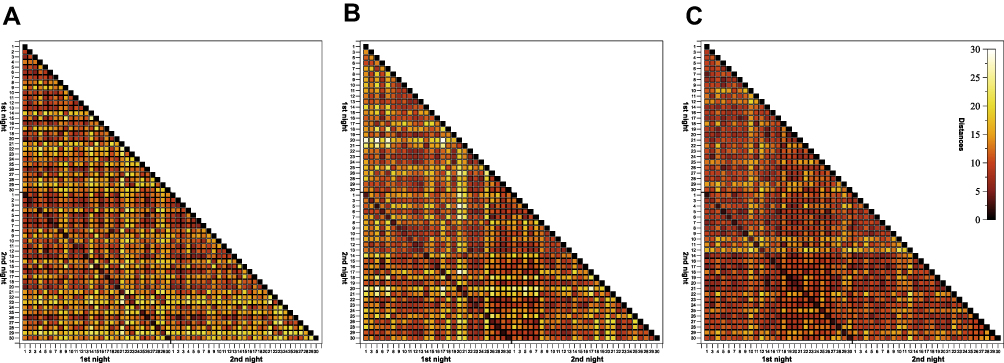 |
Figure 3 Triangular heatmaps visualizing Manhattan distances derived from the comparisons between first and second sham nights for the sample of (A) elderly women, (B) elderly men and (C) young men. Proximity measures were performed on NREM sleep EEG signals recorded at C3. The smaller the distances the darker the shading. The black-framed squares mark the area of all within- and between-individual first and second sham night comparisons. Tick labels indicate the participant number. |
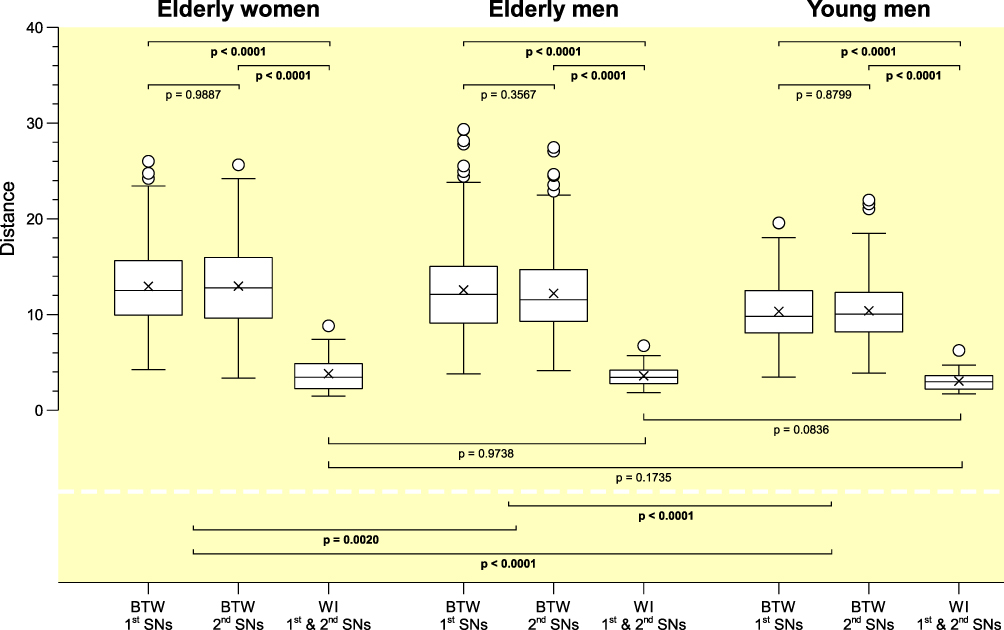 |
Figure 4 Comparisons of inter- and intraindividual Manhattan distances computed between the first and second sham nights for all three samples. For each sample, first and second box plots represent the distribution of between-subject (BTW) distances for the first and second sham nights (elderly women: n=406; elderly and young men: n=351), respectively, whereas the third box plot shows the distribution of within-subject (WI) distances between first and second sham nights (elderly women: n=29; elderly and young men: n=27). Proximity measures were performed for NREM sleep EEG signals recorded at C3. |
Agglomerative hierarchical cluster analyses revealed that clustering of within-subject pairs of NREM sleep EEG power spectra was successful in most cases (for 24 of the 29 elderly women, for 23 of the 27 elderly men, and for 24 of the 27 young men), ie, intraindividual brain activities during sleep showed so much similarity between each other that most participants could be identified as separate entity (Supplementary Figures S7-S9).
Discussion
As expected, the present analysis found that similarity distance measures between NREM sleep EEG power spectra were largest for within-subject comparisons. This observation was not only evident regardless of age but also comparable in magnitude between samples, supporting the idea of a fingerprint-like stability of individual NREM sleep EEG spectra across lifespan. Interestingly, however, between-subject NREM sleep EEG power spectra similarity was significantly smaller in the elderly than in the sample of young men.
The EEG spectrum reflects the current operation mode of the brain. For example, characteristic of the NREM sleep EEG power spectrum is a pronounced slow oscillatory and delta power as well as a clear peak in the sigma or sleep spindle frequency range.36 Although some interindividual differences may only become apparent on closer examination, the sleep EEG spectrum is unique to an individual,10−19 which is why its morphology has been considered as “fingerprint”.11,12 However, human sleep undergoes a (sex-specific) development during adulthood that could also affect the fingerprint-like characteristics of the sleep EEG. Given that ageing effects are generally subject to large interindividual variation (chronological age ≠ biological age37) the extent of age-related changes in sleep may differ between two individuals of the same age.21 If this increase in variability is further accompanied by a growing night-to-night instability in old age, it is possible that part of the individual uniqueness will be lost, even if a personalized sleep EEG pattern can still be recognized.
On the one hand, present results suggest that the individuality of NREM sleep EEG power spectra is generally preserved during lifespan, as within-subject distances of sleep EEG power spectra are lowest even in senior adults (Figures 3 and 4). This is in good agreement with the results of the study by Tan et al,14 which is the only one to date that has also examined this trait-like sleep EEG aspect in an elderly sample. These authors determined the night-to-night stability of computer measured NREM and REM frequency bands recorded in 19 young and 19 elderly individuals on four non-consecutive occasions. They observed a comparably high correlation between sleep EEG power values of different within-subject recording nights in both age groups.14 Tan et al14 further noted that this invariance occurred despite long intervals between recordings (on average about 3 weeks). In comparison, the time interval between 2 sham nights in the present study ranged from 1 to 10 weeks.
On the other hand, the present tendency towards larger between-subject distances in elderly individuals may be indicative of a somewhat more pronounced EEG power spectra diversity with increasing age. Taking the NREM sleep data of elderly men recorded at C3 as an example, Figure 2 not only illustrates that especially the characteristic peak in the sigma band is no longer as discernible as it is in young adults (Supplementary Figure S2)14 but also that the flattening of the curve in this particular frequency range varies strongly between individuals. It has been assumed that region-specific changes in brain anatomy in combination with structural alterations in thalamocortical circuitry could be responsible for the overall decreased sleep spindle activity in advanced age.38 The fact that age-related loss of brain tissue is also supposed to occur at individual rates39 may explain the heterogeneous power spectra morphology in this particular frequency range. If the present study had also explored discrete sleep spindles, it would have been possible to perform correlation analyses to prove this assumption.
Nevertheless, the present study showed that the individual brain activity signature during sleep in old age remains unique enough to be clustered almost perfectly at the participant level (Figures S2–S4). Buckelmöller et al10 also performed hierarchical cluster analysis to highlight the similarity of intraindividual NREM and REM sleep EEG power spectra and they were able to show an error-free separation of all four baseline nights into a distinct cluster for each of the eight participants. Other studies using hierarchical cluster analysis in this context achieved similar successful clustering results.16–18
The question of whether the EEG fingerprint during sleep is morphological and/or functional has not yet been resolved. In general, the EEG is determined by anatomy and biochemistry. A brain function can be viewed as the sum of rapidly changing biochemical and electrical processes. A recent review article reported that both brain structure and brain functions are heritable, with estimated heritability being greater for the former (60–80%) than for the latter (40%).40 Alternatively, longitudinal data from individuals whose brains are still undergoing neural development may contribute to a better understanding of this matter. If the fingerprint-like sleep EEG features remain stable despite cortical changes during the period of investigation, this could be indicative of a morphological characteristic. For example, one study in 9–10-year-old children and in 15–16-year-old teens showed that the individual EEG power spectrum remained relatively stable over a period of 1.5 to 3 years, as indicated by high Intraclass correlation coefficients and successful hierarchical cluster analysis.18 On the other hand, the fact that the low-frequency and sleep spindle frequency ranges may be more affected by external interventions than other ranges of the sleep EEG power spectrum may corroborate their functional relevance in this context. For example, in a recent study by Ong et al17 in 15- to 19-year-old adolescents, sleep deprivation was shown to be associated with an increase in variability, particularly in these two frequency ranges. Nevertheless, the individual trait-like characteristics of sleep EEG remained identifiable, as demonstrated by an overall successful hierarchical clustering.17
A limitation that may have influenced the present results concerns the eligibility criteria. The purpose of the RF-EMF projects was to examine possible exposure effects in medically and cognitively healthy individuals, which requires a strict selection of the study sample, especially in the cases of elderly volunteers. This, in turn, may have resulted in the enrollment of predominantly older study participants who were still in very good health and thus, on the one hand, did not adequately represent the target population and, on the other hand, lacked the degree of heterogeneity required to be clearly distinguishable from the sample of young men20 Accordingly, optimal aging might complicate the ability to distinguish the sleep of older individuals from that of younger adults, which could then reduce the significance with respect to the research need formulated by van Dongen et al.1 A further weakness is the arbitrariness in the choice of C3 and NREM as relevant electrode location and sleep stage, respectively. Within-subject sleep EEG power spectra differ across multiple nights not only between electrode positions11 but also between sleep stages. For example, Lewandowski et al13 observed largest within-subject similarity for S2 and REM sleep and lowest within-subject similarity for wake and S1 sleep. Moreover, between-subject similarity was largest for slow wave sleep.13 This implies that the individual brain activity signature could have been less stable across aging if, for example, the N1 sleep EEG power values recorded at frontal sites had been used instead. Future studies on the current topic are therefore recommended.
Conclusion
The present re-analysis was designed to determine whether the concept of the sleep EEG “fingerprint” demonstrated already several times in young adults is also present in the elderly. A significant finding to emerge from this study was a prominent invariance of sleep EEG power spectra not only in young men but also in elderly individuals of both sexes. The results of this study are consistent with the only study conducted so far in this context. They have implications for interventional studies assessing variables based on sleep EEG spectra. As intraindividual changes of the spectra are small compared to interindividual differences, the sensitivity for measuring effects of the intervention can be increased if a subject specific analysis or some type of normalization is used. The results of the present analysis have shown that this is also true for samples of elderly males and females.
Acknowledgments
The authors would like to thank all the volunteers who took the time to participate in the study.
Author Contributions
All authors made a significant contribution to the work reported, whether that is in the conception, study design, execution, acquisition of data, analysis and interpretation, or in all these areas; took part in drafting, revising or critically reviewing the article; gave final approval of the version to be published; have agreed on the journal to which the article has been submitted; and agree to be accountable for all aspects of the work.
Funding
The study in young men was sponsored by the Federal Agency for Public Safety Digital Radio (BDBOS; Project number: FM 8846), while funding for the two studies in the elderly was provided by the Federal Office for Radiation Protection (BfS; Project numbers: 3614S30012 and 3616S82430). The Sponsors (BDBOS and BFS) did not exert any influence on the study design, data analysis or on the manuscript. The manuscript reflects the opinion of the authors only.
Disclosure
The authors declare neither financial nor non-financial competing interests.
References
1. Van Dongen HP, Vitellaro KM, Dinges DF. Individual differences in adult human sleep and wakefulness: leitmotif for a research agenda. Sleep. 2005;28(4):479–496. doi:10.1093/sleep/28.4.479
2. Eggert T, Sauter C, Dorn H, et al. Individual stability of sleep spindle characteristics in healthy young males. Somnologie - Schlafforschung Und Schlafmedizin. 2015;19(1):38–45. doi:10.1007/s11818-015-0697-x
3. Eggert T, Sauter C, Dorn H, Peter A, Hansen M-L, Danker-Hopfe H. Inter- and intraindividual variability of the pupillary unrest index. Somnologie. 2017;21(3):187–192. doi:10.1007/s11818-017-0128-2
4. Barclay NL, Gregory AM. Quantitative genetic research on sleep: a review of normal sleep, sleep disturbances and associated emotional, behavioural, and health-related difficulties. Sleep Med Rev. 2013;17(1):29–40. doi:10.1016/j.smrv.2012.01.008
5. Kocevska D, Barclay NL, Bramer WM, Gehrman PR, Van Someren EJW. Heritability of sleep duration and quality: a systematic review and meta-analysis. Sleep Med Rev. 2021;59:101448. doi:10.1016/j.smrv.2021.101448
6. Ambrosius U, Lietzenmaier S, Wehrle R, et al. Heritability of sleep electroencephalogram. Biol Psychiatry. 2008;64(4):344–348. doi:10.1016/j.biopsych.2008.03.002
7. Adamczyk M, Ambrosius U, Lietzenmaier S, Wichniak A, Holsboer F, Friess E. Genetics of rapid eye movement sleep in humans. Transl Psychiatry. 2015;5:e598. doi:10.1038/tp.2015.85
8. De Gennaro L, Marzano C, Fratello F, et al. The electroencephalographic fingerprint of sleep is genetically determined: a twin study. Ann Neurol. 2008;64(4):455–460. doi:10.1002/ana.21434
9. Markovic A, Achermann P, Rusterholz T, Tarokh L. Heritability of sleep EEG topography in adolescence: results from a longitudinal twin study. Sci Rep. 2018;8(1):7334. doi:10.1038/s41598-018-25590-7
10. Buckelmuller J, Landolt HP, Stassen HH, Achermann P. Trait-like individual differences in the human sleep electroencephalogram. Neuroscience. 2006;138(1):351–356. doi:10.1016/j.neuroscience.2005.11.005
11. De Gennaro L, Ferrara M, Vecchio F, Curcio G, Bertini M. An electroencephalographic fingerprint of human sleep. Neuroimage. 2005;26(1):114–122. doi:10.1016/j.neuroimage.2005.01.020
12. Finelli LA, Achermann P, Borbely AA. Individual ‘fingerprints’ in human sleep EEG topography. Neuropsychopharmacology. 2001;25(5 Suppl):S57–62. doi:10.1016/S0893-133X(01)00320-7
13. Lewandowski A, Rosipal R, Dorffner G. On the individuality of sleep EEG spectra. J Psychophysiol. 2013;27(3):105–112. doi:10.1027/0269-8803/a000092
14. Tan X, Campbell IG, Feinberg I. Internight reliability and benchmark values for computer analyses of non-rapid eye movement (NREM) and REM EEG in normal young adult and elderly subjects. Clin Neurophysiol. 2001;112(8):1540–1552. doi:10.1016/S1388-2457(01)00570-3
15. Tan X, Campbell IG, Palagini L, Feinberg I. High internight reliability of computer-measured NREM delta, sigma, and beta: biological implications. Biol Psychiatry. 2000;48(10):1010–1019. doi:10.1016/S0006-3223(00)00873-8
16. Tinguely G, Finelli LA, Landolt HP, Borbely AA, Achermann P. Functional EEG topography in sleep and waking: state-dependent and state-independent features. Neuroimage. 2006;32(1):283–292. doi:10.1016/j.neuroimage.2006.03.017
17. Ong JL, Lo JC, Patanaik A, Chee MWL. Trait-like characteristics of sleep EEG power spectra in adolescents across sleep opportunity manipulations. J Sleep Res. 2019;28(5):e12824. doi:10.1111/jsr.12824
18. Tarokh L, Carskadon MA, Achermann P. Trait-like characteristics of the sleep EEG across adolescent development. J Neurosci. 2011;31(17):6371–6378. doi:10.1523/JNEUROSCI.5533-10.2011
19. Tarokh L, Rusterholz T, Achermann P, Van Dongen HP. The spectrum of the non-rapid eye movement sleep electroencephalogram following total sleep deprivation is trait-like. J Sleep Res. 2015;24(4):360–363. doi:10.1111/jsr.12279
20. Cabeza R, Albert M, Belleville S, et al. Maintenance, reserve and compensation: the cognitive neuroscience of healthy ageing. Nat Rev Neurosci. 2018;19(11):701–710. doi:10.1038/s41583-018-0068-2
21. Mander BA, Winer JR, Walker MP. Sleep and Human Aging. Neuron. 2017;94(1):19–36. doi:10.1016/j.neuron.2017.02.004
22. Danker-Hopfe H, Schäfer M, Dorn H, et al. Percentile reference charts for selected sleep parameters for 20- to 80-Year-Old healthy subjects from the SIESTA database. Somnologie - Schlafforschung Und Schlafmedizin. 2005;9(1):3–14. doi:10.1111/j.1439-054X.2004.00038.x
23. Vitiello MV. Recent advances in understanding sleep and sleep disturbances in older adults: growing older does not mean sleeping poorly. Curr Dir Psychol Sci. 2009;18(6):316–320. doi:10.1111/j.1467-8721.2009.01659.x
24. Danker-Hopfe H, Dorn H, Sauter C, Schmid G, Eggert T. An experimental study on effects of radiofrequency electromagnetic fields on sleep in healthy elderly males and females: gender matters! Environ Res. 2020;183:109181. doi:10.1016/j.envres.2020.109181
25. Eggert T, Dorn H, Sauter C, Schmid G, Danker-Hopfe H. RF-EMF exposure effects on sleep - Age doesn’t matter in men! Environ Res. 2020;191:110173. doi:10.1016/j.envres.2020.110173
26. Eggert T, Dorn H, Danker-Hopfe H. Nocturnal Brain activity differs with age and sex: comparisons of sleep EEG Power spectra between young and elderly men, and between 60-80-year-old men and women. Nat Sci Sleep. 2021;13:1611–1630. doi:10.2147/NSS.S327221
27. ICNIRP (International Commission on Non-Ionizing Radiation Protection). Guidelines for Limiting Exposure to Electromagnetic Fields (100 kHz to 300 GHz). Health Phys. 2020;118(5):483–524. doi:10.1097/HP.0000000000001210
28. Iber C, Ancoli-Israel S, Chesson AL
29. Jasper HH. Report of the committee on methods of clinical examination in electroencephalography (Appendix: the ten-twenty electrode system of the International Federation). Electroencephalogr Clin Neurophysiol. 1958;10(2):371–375.
30. Li J, Vitiello MV, Gooneratne NS. Sleep in normal aging. Sleep Med Clin. 2018;13(1):1–11. doi:10.1016/j.jsmc.2017.09.001
31. Anderer P, Gruber G, Parapatics S, et al. An E-health solution for automatic sleep classification according to Rechtschaffen and Kales: validation study of the Somnolyzer 24 x 7 utilizing the Siesta database. Neuropsychobiology. 2005;51(3):115–133. doi:10.1159/000085205
32. Anderer P, Moreau A, Woertz M, et al. Computer-assisted sleep classification according to the standard of the American Academy of Sleep Medicine: validation study of the AASM version of the Somnolyzer 24 x 7. Neuropsychobiology. 2010;62(4):250–264. doi:10.1159/000320864
33. Welch PD. A direct digital method of power spectrum estimation. IBM J Res Develop. 1961;5(2):141–156. doi:10.1147/rd.52.0141
34. Gasser T, Bacher P, Mocks J. Transformations towards the normal distribution of broad band spectral parameters of the EEG. Electroencephalogr Clin Neurophysiol. 1982;53(1):119–124. doi:10.1016/0013-4694(82)90112-2
35. Ward JH, Hook ME. Application of an hierarchical grouping procedure to a problem of grouping profiles. Educ Psychol Meas. 1963;23(1):69–81. doi:10.1177/001316446302300107
36. Achermann P. EEG Analysis Applied to Sleep. Epileptologie. 2009;26(SchweizerischeLiga gegen Epilepsie):28–33.
37. Muehlroth BE, Werkle-Bergner M. Understanding the interplay of sleep and aging: methodological challenges. Psychophysiology. 2020;57(3):e13523. doi:10.1111/psyp.13523
38. Clawson BC, Durkin J, Aton SJ. Form and function of sleep spindles across the lifespan. Neural Plast. 2016;2016:6936381. doi:10.1155/2016/6936381
39. Resnick SM, Pham DL, Kraut MA, Zonderman AB, Davatzikos C. Longitudinal magnetic resonance imaging studies of older adults: a shrinking brain. J Neurosci. 2003;23(8):3295–3301. doi:10.1523/JNEUROSCI.23-08-03295.2003
40. Jansen AG, Mous SE, White T, Posthuma D, Polderman TJ. What twin studies tell us about the heritability of brain development, morphology, and function: a review. Neuropsychol Rev. 2015;25(1):27–46. doi:10.1007/s11065-015-9278-9
 © 2022 The Author(s). This work is published and licensed by Dove Medical Press Limited. The
full terms of this license are available at https://www.dovepress.com/terms
and incorporate the Creative Commons Attribution
- Non Commercial (unported, 3.0) License.
By accessing the work you hereby accept the Terms. Non-commercial uses of the work are permitted
without any further permission from Dove Medical Press Limited, provided the work is properly
attributed. For permission for commercial use of this work, please see paragraphs 4.2 and 5 of our Terms.
© 2022 The Author(s). This work is published and licensed by Dove Medical Press Limited. The
full terms of this license are available at https://www.dovepress.com/terms
and incorporate the Creative Commons Attribution
- Non Commercial (unported, 3.0) License.
By accessing the work you hereby accept the Terms. Non-commercial uses of the work are permitted
without any further permission from Dove Medical Press Limited, provided the work is properly
attributed. For permission for commercial use of this work, please see paragraphs 4.2 and 5 of our Terms.