")
Back to Journals » Drug Design, Development and Therapy » Volume 17
The Efficacy and Safety of Dotinurad on Uric Acid and Renal Function in Patients with Hyperuricemia and Advanced Chronic Kidney Disease: A Single Center, Retrospective Analysis
Authors Yanai K, Hirai K , Kaneko S , Mutsuyoshi Y, Kitano T , Miyazawa H, Ito K, Ueda Y, Ookawara S, Morishita Y
Received 6 April 2023
Accepted for publication 20 October 2023
Published 3 November 2023 Volume 2023:17 Pages 3233—3248
DOI https://doi.org/10.2147/DDDT.S416025
Checked for plagiarism Yes
Review by Single anonymous peer review
Peer reviewer comments 3
Editor who approved publication: Dr Georgios Panos
Katsunori Yanai, Keiji Hirai, Shohei Kaneko, Yuko Mutsuyoshi, Taisuke Kitano, Haruhisa Miyazawa, Kiyonori Ito, Yuichiro Ueda, Susumu Ookawara, Yoshiyuki Morishita
Division of Nephrology, First Department of Integrated Medicine, Saitama Medical Center, Jichi Medical University, Saitama, Japan
Correspondence: Keiji Hirai, Division of Nephrology, First Department of Integrated Medicine, Saitama Medical Center, Jichi Medical University, 1-847 Amanuma-cho, Omiya-ku, Saitama-shi, Saitama-ken, 330-8503, Japan, Tel +81-48-647-2111, Fax +81-48-647-6831, Email [email protected]
Objective: We investigated the efficacy and safety of dotinurad, a selective urate reabsorption inhibitor, in hyperuricemic patients with advanced chronic kidney disease (CKD) (stage G3-5).
Patients and Methods: We retrospectively analyzed the cases of 34 patients (mean age, 68.6 ± 13.3 years; 17 men and 17 women) after 12 months of dotinurad treatment based on the changes in uric acid (UA) and the urine protein-to-creatinine ratio (UPCR) plus the annual change in estimated glomerular filtration rate (eGFR). Hyperuricemia (UA ≥ 6.0 mg/dL) and advanced CKD (mean eGFR: 32.0 ± 13.3 mL/min/1.73m2; stage G3, n=17; G4, n=13; G5, n=4) were present in all of the patients. The cases of 34 matched individuals with similar propensity scores (who were not taking dotinurad) were analyzed as a control group.
Results: UA values decreased significantly in the dotinurad group (7.1 ± 0.8 mg/dL to 5.9 ± 1.0 mg/dL, p< 0.05) but those did not change in the control group. UPCR did not change in either group. Low-density lipoprotein cholesterol also decreased significantly in the dotinurad group (98.8 ± 43.4 mg/dL to 82.9 ± 33.1 mg/dL, p< 0.05). With the 12-month dotinurad treatment, the annual change in the patients’ eGFR was significantly improved from − 6.0 ± 12.9 mL/min/1.73 m2/year to − 0.9 ± 4.6 mL/min/1.73 m2/year (p< 0.05), but there was no change in the control group.
Conclusion: Dotinurad can decrease UA levels and might attenuate renal function decline in individuals with hyperuricemia and advanced CKD.
Keywords: chronic kidney disease, dotinurad, hyperuricemia, uric acid, renal function
Introduction
Hyperuricemia is an important potential complication of chronic kidney disease (CKD) and is associated with the progression to end-stage renal disease worldwide.1,2 Uric acid (UA) crystals deposition in the renal tubules and interstitials due to hyperuricemia, a condition called urate nephropathy, has been considered to be the cause of the progression of CKD associated with hyperuricemia.3 UA-lowering drugs have been shown to reduce the UA level and inhibit the renal function decline in asymptomatic hyperuricemic patients with CKD.4–6 Thus, many CKD patients with gout or asymptomatic hyperuricemia are taking UA-lowering drugs.7
Dotinurad, a drug used for the treatment of gout and hyperuricemia, reduces serum UA levels by selectively inhibiting urate transporter 1.8 In a Phase III randomized controlled trial, dotinurad reduced the UA levels of hyperuricemic patients with or without gout without renal dysfunction;9 however, UA-lowering and renoprotective effects of dotinurad have not been determined in hyperuricemic individuals with advanced CKD (stage G3-5). We conducted the present investigation to evaluate dotinurad’s effects on the UA metabolism and renal function of individuals with both hyperuricemia and advanced CKD.
Patients and Methods
Ethical Approval
The Institutional Review Board of Saitama Medical Center, Jichi Medical University approved this investigation (S18-114), which was conducted in compliance with the Declaration of Helsinki’s ethical principles. The requirement of patients’ informed consent was waived because of the investigation’s retrospective nature. All of the patients whose cases were analyzed were advised of their right to opt-out. We also displayed information about the study on our institutional bulletin boards in the Medical Center’s waiting areas.
Patients
We retrospectively analyzed the cases of the patients treated at Jichi Medical University’s Saitama Medical Center during the period from September 1, 2019 to December 31, 2021. The following inclusion criteria were used: (1) age >20 years; (2) with a diagnosis of hyperuricemia (UA ≥6.0 mg/dL), with an estimated glomerular filtration rate (eGFR) ≤60 mL/min/1.73 m2; (3) taking dotinurad for at least 12 months; (4) newly initiated with dotinurad between September 1, 2020 and December 31, 2020. We excluded patients who: (1) were taking uricosuric drugs other than dotinurad; (2) had malignancy; or (3) were undergoing or had undergone renal replacement therapy such as hemodialysis, peritoneal dialysis, or renal transplantation. It has been reported that serum uric acid level greater than 6.0 mg/dL was associated with the increased risk for development of cardiovascular disease and progression to end-stage renal disease.10,11 Several recent studies have defined hyperuricemia as UA ≥6.0 mg/dL.12,13 Therefore, in this study, hyperuricemia was defined as UA ≥6.0 mg/dL. For a control group, we selected the cases of the patients at the Medical Center without dotinurad treatment during September 1, 2019 to December 31, 2021 who met the inclusion/exclusion criteria except for dotinurad administration and were matched with the dotinurad-treated patients by propensity score matching.
Study Design
We conducted a retrospective, single-center, comparative pilot study. Figure 1 illustrates the study’s design. We compared the cases of the 34 dotinurad-treated patients with the data of a control group of 34 patients whose baseline characteristics matched those of the dotinurad group. The baseline values of dotinurad-treated patients were obtained on the days when dotinurad was newly initiated (1 September 2020 to 31 December 2020). In the control group, baseline values were also obtained in the same period (1 September 2020 to 31 December 2020) when the patients visited Saitama Medical Center.
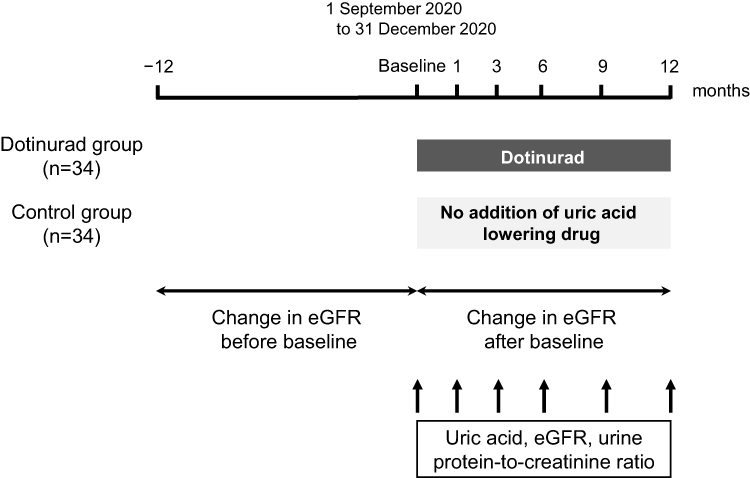 |
Figure 1 Study design. Abbreviation: eGFR, estimated glomerular filtration rate. |
Dotinurad was administered orally once each day in the morning. The initially administered dosage of dotinurad was 0.5 mg/day. The dosage of dotinurad was increased for persistent hyperuricemia. The administered dosage of dotinurad at 12 months was 0.5 mg/day in 24 patients, 1.0 mg/day in 8 patients, 2.0 mg/day in 1 patient, and 4.0 mg/day in 1 patient (Figure 2). We compared the changes in the serum levels of UA, the urine protein-to-creatinine ratio (UPCR), and the eGFR at 1, 3, 6, 9, and 12 months with those at baseline in the dotinurad and control groups. We evaluated both patient groups’ annual changes in eGFR (mL/min/1.73 m2/year) at 12 months before the baseline and 12 months after the baseline. We performed a multiple linear regression analysis in order to analyze factors that were independently associated with the changes in the eGFR, UA, and time-averaged UA during the dotinurad treatment period.
 |
Figure 2 The changes in the distribution of dotinurad doses administered to the patients. |
Laboratory Methods
The Saitama Medical Center’s Clinical Laboratory determined the blood and urinary parameters. Each patient’s eGFR was determined with the use of the Modification of Diet in Renal Disease formula (modified version) issued by the Japanese Society of Nephrology: eGFR (mL/min/1.73 m2) = 194 × age−0.287 × serum creatinine−1.094 (multiplied by 0.739 for women).14 The patient’s serum hemoglobin A1c (HbA1c) values are presented as National Glycohemoglobin Standardization Program values.
We used the following definition of hypertension: a mean systolic blood pressure ≥140 mmHg and/or mean diastolic blood pressure ≥90 mmHg, or the use of medication to lower the patient’s blood pressure. We defined diabetes mellitus as an HbA1c level ≥6.5% or the use of medication and/or insulin treatment to lower the patient’s blood glucose. To determine the eGFR’s annual changes, we used a linear regression analysis with the slope per month for each patient pre- and post-baseline. An automated arm cuff was used to measure the blood pressure with the patient at rest in a sitting position; two measurements were taken at a 1- to 2-min interval, and our analyses used the measurements’ mean.
We collected all of the patients’ UA measurements longitudinally from the time of the initiation of dotinurad treatment to 12 months later, and we used these data to calculate the time-averaged values for each individual patient, using the following formula:

where the UA values UA0, UA1, … UAn were measured at time points t0, t1, … tn.
Statistical Analyses
A propensity score-matching analysis was used to select controls who had baseline characteristics similar to those of the dotinurad-treated patients. We included age, sex, UA, and the eGFR as independent variables in the propensity model. The one-to-one matching was achieved by identifying a control who had the nearest logit-transformed propensity score to a dotinurad patient (with a 0.25 caliper width), and the subsequent analyses used the resulting score-matched pairs. UPCR, triglyceride, and β2-microglobulin were not distributed normally; however, we treated them as normally distributed in accordance with central limit theorem because the sample size of each group is above 30.15 The results are shown as the means ± standard deviations. We used Student’s t-test to compare clinical parameters between the groups of dotinurad-treated and control patients, and we used a repeated measures analysis of variance and Tukey’s test to compare the clinical parameters within the groups at the baseline and 1, 3, 6, 9, and 12 months from baseline. Paired t-tests were used to compare the eGFR’s annual changes between pre- and post-baseline in the two groups. The eGFR’s annual changes were examined by a linear regression analysis and calculated as the monthly slope for each individual. A linear regression analysis was conducted to determine correlations between two variables. The parameters that simple linear regression analyses suggested were significantly correlated with the changes in eGFR, UA, and time-averaged UA during the dotinurad treatment period (p<0.10) were included in the present multiple linear regression analysis in order to identify the parameters independently correlated with the changes in eGFR, UA, and time-averaged UA during the dotinurad treatment period. Differences with a probability (p)-value <0.05 were accepted as significant. JMP 11 software (SAS, Cary, NC, USA) was used.
Results
The Patients’ Characteristics
We identified 250 patients with hyperuricemia and an eGFR <60 mL/min/1.73 m2; 44 of the patients were taking dotinurad, and the other 206 were not. Ten of the 44 patients being treated with dotinurad did not meet all of the inclusion criteria; the dotinurad group was thus comprised of 34 patients. The propensity score individually matched 34 patients not undergoing dotinurad treatment with dotinurad group patients, and these individuals comprised the control group (Figure 3, Table S1). We thus analyzed the cases of a total of 68 patients (34 men and 34 women, mean age 68.7 ± 13.8 years).
 |
Figure 3 Patient flow diagram. |
The baseline mean eGFR levels of all 68 patients was 32.3 ± 14.2 mL/min/1.73 m2. The CKD stages of the patients were: stage G3a, n=14 (20.6%), stage G3b, n=23 (33.8%); stage G4, n=21 (30.9%); and stage G5, n=10 (14.7%). Renal replacement therapy was not initiated for any of the patients during the study period. Table 1 summarizes the baseline characteristics of all 68 patients and the dotinurad and control groups’ medications. With the exception of the high-density lipoprotein (HDL) cholesterol values and the proportion of patients taking statin, eicosapentaenoic acid, and dipeptidyl peptidase-4 (DPP-4) inhibitor, there were no significant between-group differences in clinical parameters. The percentage of patients with diabetes mellitus was 36.8%, and that of patients with hypertension was 86.8%. No other UA-lowering drugs were changed, nor was the dosage of them changed during the dotinurad treatment period in either the dotinurad-group or the control group. Medications started during the 12 months before the baseline in the dotinurad group were: antihypertensive medications in four patients, lipid-lowering medications in four patients, diuretic medications in three patients, and UA-lowering medication in one patient. Medications started during the 12 months before the baseline in the control group were: antihypertensive medications in four patients, lipid-lowering medications in two patients, and diuretic medication in one patient. During the dotinurad treatment period, antihypertensive medications were added in four patients and stopped in two patients in the dotinurad group whereas those were added in two patients in the control group.
 |
Table 1 Participants’ Characteristics and Medications at Baseline |
Effects of Dotinurad on UA Control
The dotinurad group’s UA levels fell significantly from 7.1 ± 0.8 mg/dL at their baseline to 6.1 ± 1.0 mg/dL at 1 month (p<0.05), and the levels continued to be significantly decreased to 6.0 ± 1.0 mg/dL at 3 months (p<0.05), 5.9 ± 1.2 mg/dL at 6 months (p<0.05), 6.1 ± 1.1 mg/dL at 9 months (p<0.05), and 5.9 ± 1.0 mg/dL at 12 months (p<0.05). In contrast, the control group’s UA levels at 1, 3, 6, 9, and 12 months did not differ significantly from the baseline values (Figure 4).
 |
Figure 4 Changes in uric acid (UA) values in the dotinurad and control groups. Vertical bars: standard error of the mean. *p<0.05 vs baseline; †p<0.05 vs the control group. Abbreviations: NS, not significant; UA, uric acid. |
Effects of Dotinurad on the UPCR and the eGFR’s Annual Change
In both the dotinurad and control groups, the UPCR at 1, 3, 6, 9, and 12 months did not differ significantly from the baseline values, as depicted in Figure 5. In the dotinurad-treated patients, the eGFR’s annual change significantly improved, from the pre-baseline values −6.0 ± 12.9 to −0.9 ± 4.6 mL/min/1.73 m2/year over the 12 months after the baseline measurements (p<0.05) (Figures 6 and 7). In the control group, the eGFR’s annual change declined significantly from the pre-baseline value 0.9 ± 4.7 to −3.4 ± 6.7 mL/min/1.73 m2/year over the 12-month period after the baseline measurements (p<0.05) (Figures 6 and 7).
 |
Figure 5 Changes in the urine protein-to-creatinine ratio (UPCR) in the dotinurad and control groups. Vertical bars: standard error of the mean. |
 |
Figure 6 Changes in estimated glomerular filtration rate (eGFR) in the dotinurad-treated and control patients. Vertical bars: standard error of the mean. |
 |
Figure 7 Annual eGFR change from pre- to post-baseline in the dotinurad and control groups. *p<0.05. |
Factors Associated with the Change in eGFR During the Dotinurad Treatment
As shown in Table 2, the simple linear regression analyses results disclosed that the change in eGFR during the dotinurad treatment period was marginally or significantly correlated with the following factors: HDL cholesterol, DPP-4 inhibitor use, β-blocker use, average dose of dotinurad during the 12-month treatment period, and the time-average UA values. The multiple linear regression analysis applying the factors that were marginally correlated or significantly correlated (p<0.10) with an eGFR change during the dotinurad treatment period in the simple linear regression analyses demonstrated that DPP-4 inhibitor use (standard coefficient [β] = 0.291, p=0.046) and time-averaged UA (β = −0.520, p=0.004) were both independently correlated with the eGFR change during the period of dotinurad treatment.
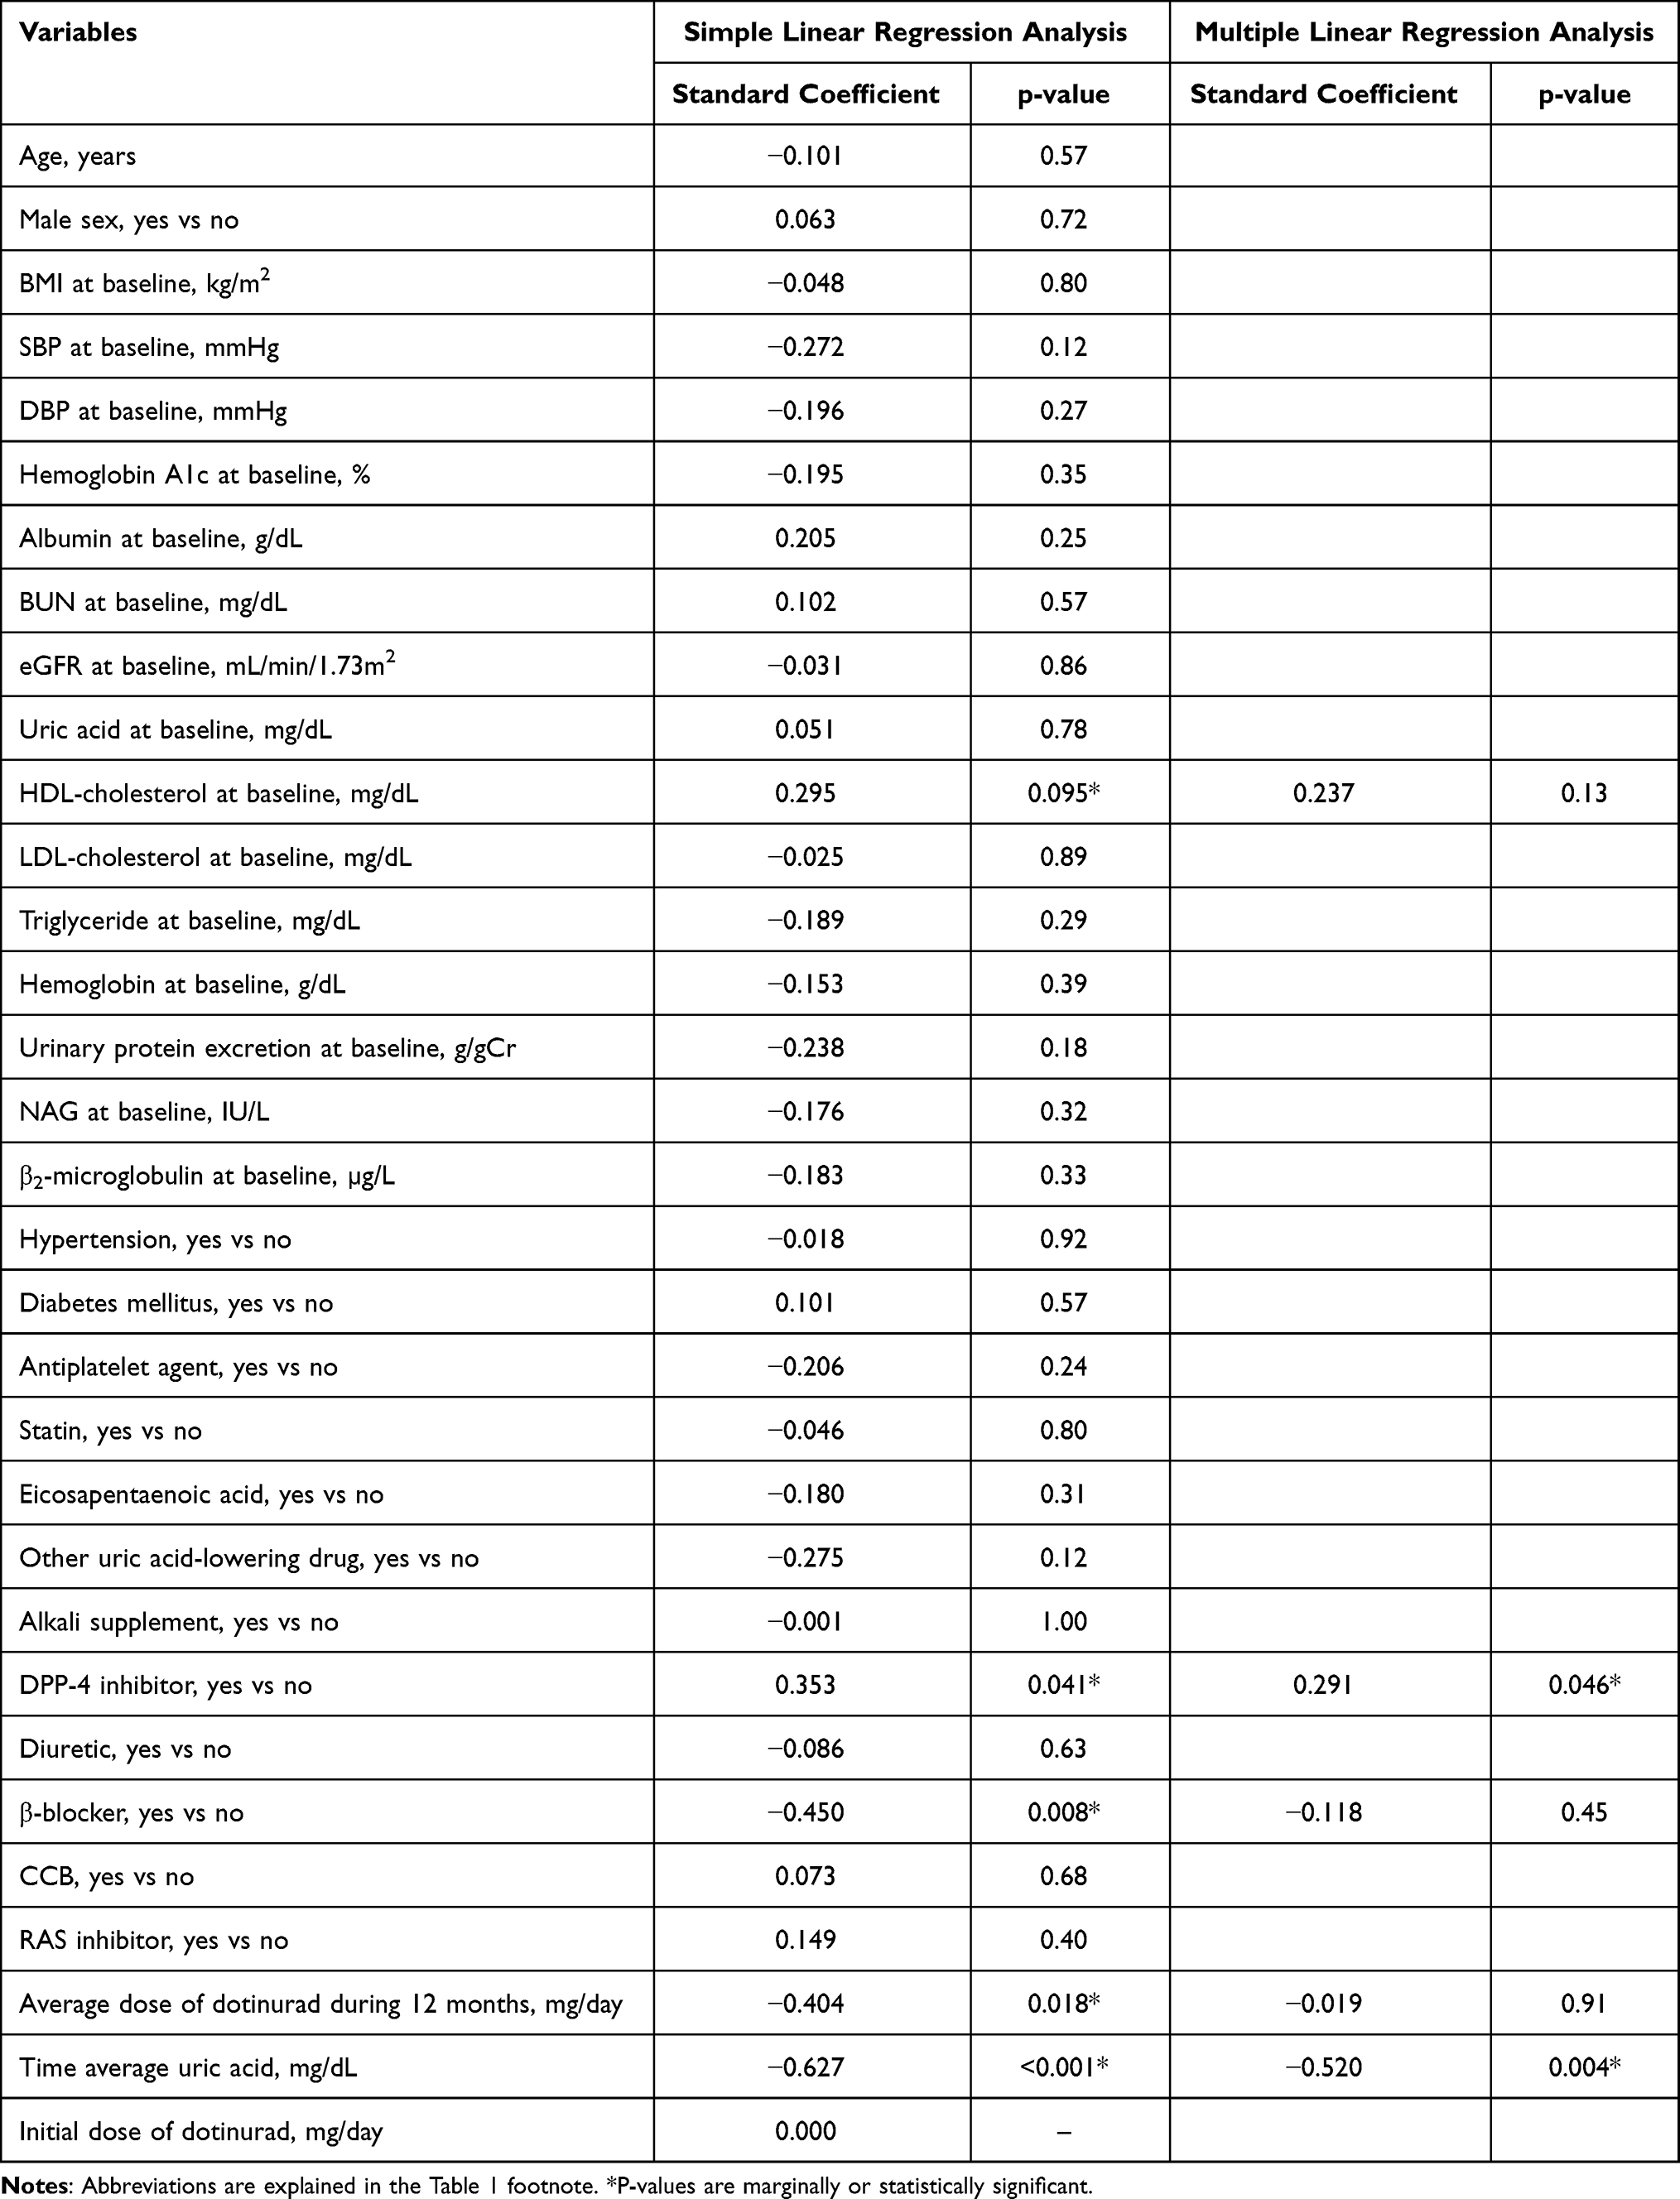 |
Table 2 Simple and Multiple Linear Regression Analyses of Variables Associated with the Change in Estimated Glomerular Filtration Rate During the Administration of Dotinurad |
Factors Associated with the Change in UA During the First 1 Month of Dotinurad Treatment
As shown by simple linear regression analyses, the UA changes during the patients’ first month of dotinurad treatment was marginally or significantly correlated with the following (Table 3): blood urea nitrogen (BUN), eGFR, UA, hemoglobin, history of diabetes mellitus, history of myocardial infarction, the use of another UA-lowering drug, alkali supplement use, and calcium channel blocker use. We also applied multiple linear regression analysis with the variables that were marginally correlated or significantly correlated (p<0.10 in the simple linear regression analyses) with a change in UA during the first 1 month of dotinurad treatment. The results showed that the UA value at baseline was independently correlated with a change in UA during the first 1 month of dotinurad treatment (β = −0.436, p=0.005).
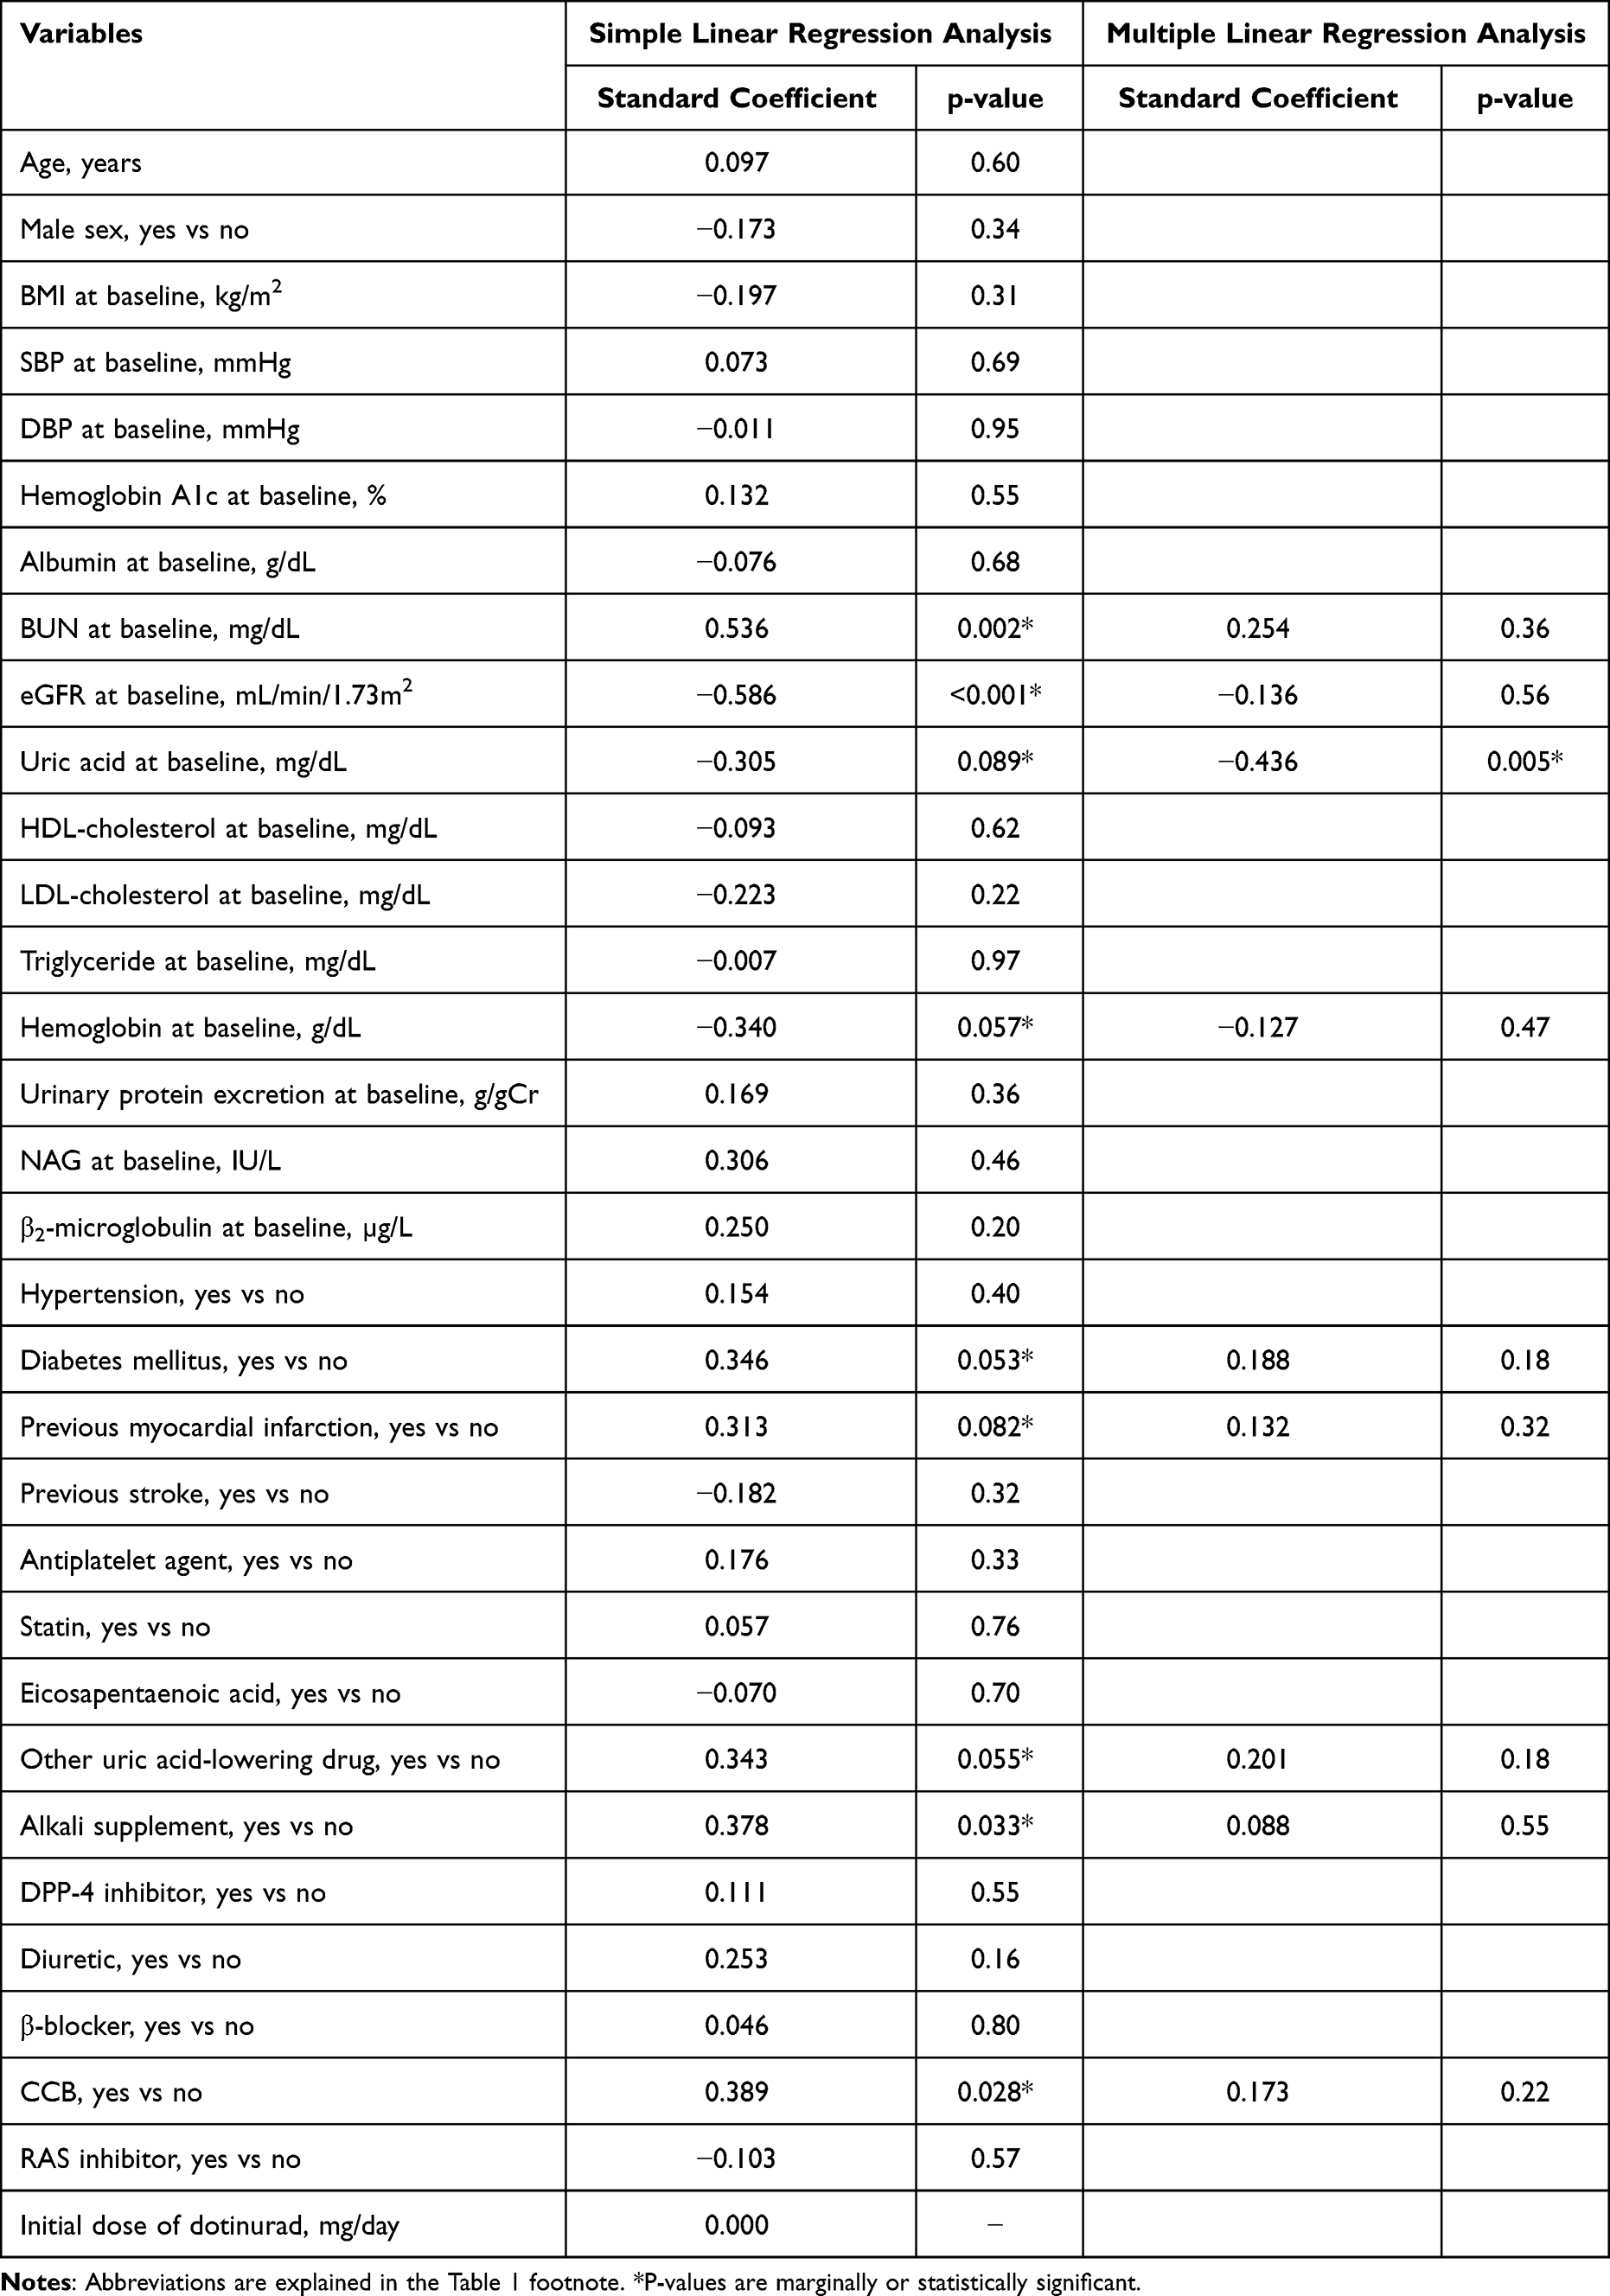 |
Table 3 Simple and Multiple Linear Regression Analyses of Variables Associated with the Change in Uric Acid During the First 1 Month of Dotinurad Administration |
Factors Associated with the Time-Averaged UA During Dotinurad Treatment
As shown in Table 4, the simple linear regression analyses revealed that the time-averaged UA values during the dotinurad treatment period were marginally or significantly correlated with the values of HbA1c, eGFR, triglyceride, and β2-microglobulin, diabetes mellitus history, use of other UA-lowering drugs, diuretic use, β-blocker use, and average dotinurad dose during the 12 months. Our subsequent multiple linear regression analysis with the variables that were marginally correlated or significantly correlated (p<0.10) with the time-averaged UA values during dotinurad treatment in the simple linear regression analyses demonstrated that the use of a β-blocker was independently correlated with the time-averaged UA during dotinurad treatment (β = 0.798, p=0.017).
 |
Table 4 Simple and Multiple Linear Regression Analyses of Variables Associated with the Time Average of Uric Acid During the Administration of Dotinurad |
Other Clinical Parameters’ Changes, and Adverse Effects
The dotinurad-treated patients’ low-density lipoprotein (LDL) cholesterol values significantly decreased from 98.8 ± 43.4 mg/dL at baseline to 82.6 ± 30.1 mg/dL at 9 months (p<0.05) and 82.9 ± 33.1 mg/dL at 12 months (p<0.05). (Figure 8). As also shown in Figure 8, the dotinurad-treated patients’ LDL cholesterol levels were significantly different from those of the control group at 6, 9, and 12 months (Figure 8). We identified no significant differences in other clinical and laboratory parameters, including body mass index, systolic blood pressure, HbA1c, HDL cholesterol, triglyceride, albumin, C-reactive protein, and hemoglobin between baseline values and those measured at 1, 3, 6, 9, and 12 months in either the dotinurad or control group (data not shown). No attack of gout was observed in either group during the study period. However, adverse effects were observed in two of the dotinurad-treated patients (fever, nausea), and their dotinurad treatment was thus discontinued.
 |
Figure 8 Changes in low-density lipoprotein (LDL) cholesterol in the dotinurad and control groups. Vertical bars: standard error of the mean. *p<0.05 vs baseline; †p<0.05 vs the control group. |
Discussion
The results of the present analyses demonstrated that the administration of the selective urate reabsorption inhibitor dotinurad to patients with both hyperuricemia and advanced CKD decreased the patients’ UA levels and attenuated the decline in their renal function, without serious adverse events. Our findings from multiple linear regression analyses also revealed that (1) the use of a DPP-4 inhibitor and the time-averaged UA values were independently correlated with the eGFR change during the dotinurad treatment; (2) the UA at baseline was independently correlated with the UA change during the first 1 month of dotinurad treatment, and (3) the use of a β-blocker was independently correlated with the time-averaged UA during the dotinurad treatment. These results imply that dotinurad has positive effects on UA metabolism and renal function in hyperuricemic patients with advanced CKD, and they indicate that dotinurad can be safely used in this patient population.
UA-lowering drugs were reported to improve CKD patients’ decline in renal function.4–6 However, dotinurad did not reduce proteinuria in this study. UA-lowering drugs may not reduce proteinuria in patients with advanced CKD. Further studies are needed to examine the antiproteinuric effects of UA-lowering drugs in patients with advanced CKD.
In this study, the annual change in eGFR improved significantly in the dotinurad group, whereas no improvement was observed in the control group. This improvement in renal function was suggested to be based on the finding that a uricosuric drug prevented the progression of glomerulosclerosis.16 In another study, UA-lowering therapy blocked the RAS, leading to a decrease in glomerular hypertension; this decrease may preserve the eGFR.17 As shown in Table 2, in this study, the change in renal function was not associated with changes in either urinary protein or blood pressure. The effect of dotinurad on renal function may not be affected by urinary protein or blood pressure.
As shown in Table 2, the renal function’s decline from baseline to 12 months was significantly associated with the use of DPP-4 inhibitor medication; the inhibition of DPP-4 upregulates the renal production of cyclic adenosine monophosphate (cAMP) via an elevation of the circulatory system’s stromal cell-derived factor-1α, which may explain this finding.18 An increased cAMP value exerts antioxidative effects and reduces reactive oxygen species, which are suspected to be a major cause of CKD progression. It has also been speculated that a DPP-4 inhibitor elevates the level of active glucagon-like peptide-1, which upregulates cAMP and reduces oxidative stress.18
As can be seen by the data in Table 3, the decline in the patients’ UA from baseline to +1 month was associated with the baseline UA. Recent study reported that higher baseline serum UA was associated with greater decrease in serum UA during the first four weeks of UA-lowering drug use.19 Our present findings indicate that the higher a patient’s baseline UA is, the higher the degree of UA decrease from baseline to +1 month will be, which is consistent with the previous report.19
We also observed that the time-averaged UA level was associated with the use of a β-blocker (see Table 4), which is consistent with other reports.20–22 A suspected mechanism is that a β-blocker activates the pentose phosphate pathway, leading to the production of UA.21 However, the question of whether or not β-blockers independently contribute to hyperuricemia remains to be investigated.20
As shown in Figure 8, the dotinurad treatment decreased the patients’ level of LDL cholesterol. UA-lowering compounds were reported to decrease the serum LDL cholesterol levels of patients with hyperlipidemia.23–25 The mechanisms underlying the regulation of serum LDL cholesterol by a lowering of UA are not known, but it is possible that lowering the UA may regulate LDL cholesterol through antioxidant and anti-inflammatory mechanisms.23 However, in this study, approximately 70% of the patients in the dotinurad group were treated with statins, which may have affected the study results. Further studies are needed to investigate the LDL cholesterol-lowering effect of dotinurad in hyperuricemic patients with advanced CKD.
An observational study reported that serum uric acid level greater than 6.0 mg/dL was associated with the increased risk for progression to end-stage renal disease in patients with moderate to severe CKD.11 In the present study, dotinurad attenuated decline in renal function in patients with hyperuricemia (UA ≥6.0 mg/dL) and advanced CKD. These findings suggest that UA-lowering therapy might have a beneficial effect on renal function in patients with hyperuricemia (UA ≥6.0 mg/dL) and advanced CKD. Larger-scale, longer-term investigations are necessary to further clarify the renoprotective effects of dotinurad in this patient population. Our present study is the first to show that dotinurad has a renoprotective effect in hyperuricemic patients with advanced CKD, and our findings could be informative for further investigations of dotinurad treatment in advanced CKD patients.
There are several study limitations to address. Since this study was a single-center, retrospective and observational analysis, it could have included patient-selection bias; however, propensity score matching was applied to reduce selection bias among the control patients. The patient population was small (n=68), and the study was performed at a single medical center, thus limiting our results’ generalizability. The systolic blood pressure and proportion of patients with diabetes was higher in the dotinurad group. This difference between the two groups may have influenced the course of renal function. It is also possible that medications started before the initiation of dotinurad treatment may have affected the renal function and urinary protein. Almost half of the patients were taking other UA lowering medications such as allopurinol and febuxostat, but it is not likely that these medications affected our findings, as there were no significant between-group differences in the patients’ baseline characteristics (including the use of UA-lowering drugs) after the propensity-score matching; in addition, the patients’ use of UA-lowering medication including its dosage did not change during the treatment period. Long-term and larger-scale randomized clinical investigations are necessary to confirm dotinurad’s effectiveness for renoprotection in patients with advanced CKD. There might have been the confounding effect of other UA-lowering drugs, although there was no difference in the proportion of patients receiving other UA-lowering drugs between the two groups. Therefore, further prospective, large-scale, multicenter studies comparing dotinurad with other UA-lowering drug are required to confirm our findings.
In conclusion, the selective urate reabsorption inhibitor dotinurad can decrease UA levels and might attenuate decline in renal function in patients with hyperuricemia and advanced CKD, without serious adverse events.
Data Sharing Statement
All of the study’s data are included in this publication and the study’s Supplementary Information Files.
Ethical Study Approval
The present study received approval from the Saitama Medical Center Institutional Review Board, Jichi Medical University (no. S18-114) and was performed in accord with the Declaration of Helsinki’s ethical principles.
Informed Consent
The requirement for patients’ informed consent was waived based the study’s retrospective design, and an opt-out method provided.
Funding
This study did not receive any funding.
Disclosure
We declare no conflicts of interest.
References
1. Jalal DI, Chonchol M, Chen W, Targher G. Uric acid as a target of therapy in CKD. Am J Kidney Dis. 2013;61(1):134–146. doi:10.1053/j.ajkd.2012.07.021
2. Mallat SG, Al Kattar S, Tanios BY, Jurjus A. Hyperuricemia, hypertension, and chronic kidney disease: an emerging Association. Curr Hypertens Rep. 2016;18(10):74. doi:10.1007/s11906-016-0684-z
3. Abbasi MT, Asghar MR, Bashir K, Hashmi MN. Hyperuricemia in Renal patients: treat or not to treat. Arch Clin Nephrol. 2021;7(1):050–056.
4. Chou HW, Chiu HT, Tsai CW, et al. Comparative effectiveness of allopurinol, febuxostat and benzbromarone on renal function in chronic kidney disease patients with hyperuricemia: a 13-year inception cohort study. Nephrol Dial Transplant. 2018;33(9):1620–1627. doi:10.1093/ndt/gfx313
5. Fujimori S, Ooyama K, Ooyama H, Moromizato H. Efficacy of benzbromarone in hyperuricemic patients associated with chronic kidney disease. Nucleosides Nucleotides Nucleic Acids. 2011;30(12):1035–1038. doi:10.1080/15257770.2011.622732
6. Yu H, Liu X, Song Y, et al. Safety and efficacy of benzbromarone and febuxostat in hyperuricemia patients with chronic kidney disease: a prospective pilot study. Clin Exp Nephrol. 2018;22(6):1324–1330. doi:10.1007/s10157-018-1586-y
7. Jeyaruban A, Hoy W, Cameron A, et al. Hyperuricaemia, gout and allopurinol in the CKD Queensland registry. J Nephrol. 2021;34(3):753–762. doi:10.1007/s40620-020-00937-4
8. Hosoya T, Sano T, Sasaki T, Fushimi M, Ohashi T. Clinical efficacy and safety of dotinurad, a novel selective urate reabsorption inhibitor, in Japanese hyperuricemic patients with or without gout: an exploratory, randomized, multicenter, double-blind, placebo-controlled, parallel-group early Phase 2 study. Clin Exp Nephrol. 2020;24(Suppl 1):44–52. doi:10.1007/s10157-019-01802-w
9. Hosoya T, Sano T, Sasaki T, Fushimi M, Ohashi T. Dotinurad versus benzbromarone in Japanese hyperuricemic patient with or without gout: a randomized, double-blind, parallel-group, Phase 3 study. Clin Exp Nephrol. 2020;24(Suppl 1):62–70. doi:10.1007/s10157-020-01849-0
10. Bos MJ, Koudstaal PJ, Hofman A, Witteman JC, Breteler MM. Uric acid is a risk factor for myocardial infarction and stroke: the Rotterdam study. Stroke. 2006;37(6):1503–1507. doi:10.1161/01.STR.0000221716.55088.d4
11. Uchida S, Chang WX, Ota T, et al. Targeting uric acid and the inhibition of progression to end-stage renal disease–a propensity score analysis. PLoS One. 2015;10(12):e0145506. doi:10.1371/journal.pone.0145506
12. Remedios C, Shah M, Bhasker AG, Lakdawala M. Hyperuricemia: a reality in the Indian obese. Obes Surg. 2012;22(6):945–948. doi:10.1007/s11695-012-0655-7
13. Trifiro G, Morabito P, Cavagna L, et al. Epidemiology of gout and hyperuricaemia in Italy during the years 2005–2009: a nationwide population-based study. Ann Rheum Dis. 2013;72(5):694–700. doi:10.1136/annrheumdis-2011-201254
14. Matsuo S, Imai E, Horio M, et al. Revised equations for estimated GFR from serum creatinine in Japan. Am J Kidney Dis. 2009;53(6):982–992. doi:10.1053/j.ajkd.2008.12.034
15. Vrbin CM. Parametric or nonparametric statistical tests: considerations when choosing the most appropriate option for your data. Cytopathology. 2022;33(6):663–667. doi:10.1111/cyt.13174
16. Kang DH, Nakagawa T, Feng L, et al. A role for uric acid in the progression of renal disease. J Am Soc Nephrol. 2002;13(12):2888–2897. doi:10.1097/01.ASN.0000034910.58454.FD
17. Shibagaki Y, Ohno I, Hosoya T, Kimura K. Safety, efficacy and renal effect of febuxostat in patients with moderate-to-severe kidney dysfunction. Hypertens Res. 2014;37(10):919–925. doi:10.1038/hr.2014.107
18. Kim YG, Byun J, Yoon D, et al. Renal protective effect of DPP-4 inhibitors in type 2 diabetes mellitus patients: a cohort study. J Diabetes Res. 2016;2016:1423191. doi:10.1155/2016/1423191
19. Pang L, Xue X, He Y, et al. The effect of decrease in serum urate for the risk of gout flares during urate-lowering therapy initiation among Chinese male gout patients: a prospective cohort study. J Inflamm Res. 2023;16:3937–3947. doi:10.2147/JIR.S424820
20. Ueno S, Hamada T, Taniguchi S, et al. Effect of antihypertensive drugs on uric acid metabolism in patients with hypertension: cross-sectional cohort study. Drug Res. 2016;66(12):628–632. doi:10.1055/s-0042-113183
21. Juraschek SP, Appel LJ, Miller ER. Metoprolol increases uric acid and risk of gout in African Americans with chronic kidney disease attributed to hypertension. Am J Hypertens. 2017;30(9):871–875. doi:10.1093/ajh/hpx113
22. Adverse reactions to bendrofluazide and propranolol for the treatment of mild hypertension. Report of Medical Research Council Working Party on mild to moderate hypertension. Lancet. 1981;2(8246):539–543.
23. Wu J, Zhang YP, Qu Y, Jie LG, Deng JX, Yu QH. Efficacy of uric acid-lowering therapy on hypercholesterolemia and hypertriglyceridemia in gouty patients. Int J Rheum Dis. 2019;22(8):1445–1451. doi:10.1111/1756-185X.13652
24. Heikal MM, Shaaban AA, Elkashef WF, Ibrahim TM. Effect of febuxostat on biochemical parameters of hyperlipidemia induced by a high-fat diet in rabbits. Can J Physiol Pharmacol. 2019;97(7):611–622. doi:10.1139/cjpp-2018-0731
25. Marinchev L, Kunev K. Vliianie na benzbromarona vŭrkhu khiperlipidemiiata pri podagra [The effect of benzbromarone on hyperlipidemia in gout]. Vutr Boles. 1990;29(5):99–102. Spanish.
 © 2023 The Author(s). This work is published and licensed by Dove Medical Press Limited. The full terms of this license are available at https://www.dovepress.com/terms.php and incorporate the Creative Commons Attribution - Non Commercial (unported, v3.0) License.
By accessing the work you hereby accept the Terms. Non-commercial uses of the work are permitted without any further permission from Dove Medical Press Limited, provided the work is properly attributed. For permission for commercial use of this work, please see paragraphs 4.2 and 5 of our Terms.
© 2023 The Author(s). This work is published and licensed by Dove Medical Press Limited. The full terms of this license are available at https://www.dovepress.com/terms.php and incorporate the Creative Commons Attribution - Non Commercial (unported, v3.0) License.
By accessing the work you hereby accept the Terms. Non-commercial uses of the work are permitted without any further permission from Dove Medical Press Limited, provided the work is properly attributed. For permission for commercial use of this work, please see paragraphs 4.2 and 5 of our Terms.