")
Back to Journals » International Journal of Nanomedicine » Volume 10 » Issue 1
The effects of hierarchical micro/nanosurfaces decorated with TiO2 nanotubes on the bioactivity of titanium implants in vitro and in vivo
Authors Ding X , Zhou L, Wang J, Zhao Q, Lin X, Gao Y, Li S, Wu J, Rong M, Guo Z, Lai C, Lu H, Jia F
Received 25 April 2015
Accepted for publication 20 September 2015
Published 9 November 2015 Volume 2015:10(1) Pages 6955—6973
DOI https://doi.org/10.2147/IJN.S87347
Checked for plagiarism Yes
Review by Single anonymous peer review
Peer reviewer comments 2
Editor who approved publication: Professor Lei Yang
Xianglong Ding,1 Lei Zhou,1 Jingxu Wang,2 Qingxia Zhao,3 Xi Lin,1 Yan Gao,1 Shaobing Li,4 Jingyi Wu,1 Mingdeng Rong,4 Zehong Guo,1 Chunhua Lai,1 Haibin Lu,4 Fang Jia1
1Center of Oral Implantology, Guangdong Provincial Stomatological Hospital, Southern Medical University, 2Department of Stomatology, The First Affiliated Hospital of Guangzhou Medical University, 3Department of Stomatology, Nanfang Hospital, 4Department of Periodontics and Implantology, Guangdong Provincial Stomatological Hospital, Southern Medical University, Guangzhou, People’s Republic of China
Abstract: In the present work, a hierarchical hybrid micro/nanostructured titanium surface was obtained by sandblasting with large grit and acid etching (SLA), and nanotubes of different diameters (30 nm, 50 nm, and 80 nm) were superimposed by anodization. The effect of each SLA-treated surface decorated with nanotubes (SLA + 30 nm, SLA + 50 nm, and SLA + 80 nm) on osteogenesis was studied in vitro and in vivo. The human MG63 osteosarcoma cell line was used for cytocompatibility evaluation, which showed that cell adhesion and proliferation were dramatically enhanced on SLA + 30 nm. In comparison with cells grown on the other tested surfaces, those grown on SLA + 80 nm showed an enhanced expression of osteogenesis-related genes. Cell spread was also enhanced on SLA + 80 nm. A canine model was used for in vivo evaluation of bone bonding. Histological examination demonstrated that new bone was formed more rapidly on SLA-treated surfaces with nanotubes (especially SLA + 80 nm) than on those without nanotubes. All of these results indicate that SLA + 80 nm is favorable for promoting the activity of osteoblasts and early bone bonding.
Keywords: nanotopography, osseointegration, dental and orthopedic implant, titanium
Introduction
It is well known that the surface characteristics of biomedical implants influence their interactions with cells and the extracellular matrix (ECM) and are therefore key factors in determining the osseointegration of such implants.1 In the tissue engineering and biomaterials’ field, the interactions between cells and surface microtopographies have been extensively studied, and certain microscale surface topographies and related technologies have already been adopted for commercial implant products. It has been revealed that microtopographies can improve bone-to-implant contact through mechanical interlocking and the promotion of osteoblast functions.2 Some microscale surface topographies have already been used on commercial implant products, and good clinical effects have been obtained, including from sandblasting with large grit and acid etching (SLA)-treated titanium implants.3–5 Nevertheless, though they positively promote osteoblast differentiation, microscale surfaces often inhibit osteoblast proliferation, resulting in a smaller accumulation of bone mass compared with that yielded by a smooth surface.6–11
With recent progress in surface treatment technologies, researchers have the tools to achieve a variety of nanotopographies. The interactions between cells and nanotopographies are of increasing interest, as nanostructures may be more efficient in promoting desirable cell functions.12 Among the different approaches for producing nanotopographies, titania nanotubes have attracted much attention since they can be fabricated easily with precisely controlled diameters and lengths by tailoring the process parameters.13,14 Such surfaces can almost ideally be used as nanoscale spacing models for size-dependent cellular responses. Some studies have reported that titania nanotubes with suitable dimensions can improve bone cell functions,15,16 although some controversy remains.17–21 These nanotubes can also serve as carriers for drugs, such as growth factors, antibacterial agents, and genes, and show good prospects for bone–implant applications.22,23
Several studies have shown that surface structures composed of micro- and nanoscale components may provide suitable surface topographies for promoting desirable cell functions such as osteogenesis, because these materials can mimic the structure of the natural ECM.22,24 Kubo et al showed that a micropit-and-nanonodule hybrid titania topography on a titanium surface enhanced osteoblast attachment, spreading, adhesion, proliferation, and differentiation in vitro,25 while Gao et al fabricated a micro/nanostructured porous surface on titanium and observed increased formation of hydroxyapatite in simulated body fluids and faster adsorption of bovine serum albumin (BSA).13
Adding nanotubes to the surfaces of implant materials is expected to alter and likely improve their bioavailability, biocompatibility, and bioreactivity. In particular, the coexistence of micro- and nanotopographies may confer advantageous properties and functionalities to biomaterials. However, the controllable hybrid creation of nano and microstructures has been challenging. Furthermore, the biological synergies of micro and nanostructures, for example, whether further enhancement of cellular behaviors and responses can be obtained by the addition of nanotubes to microstructures without sacrificing their established advantages, and which size range of nanotube microstructures is most effective in increasing bone-to-implant contact in vivo, are largely unknown.
Therefore, in this study, hybrid micro/nanotextured surface topographies were produced on titanium by SLA to produce micropits and subsequent anodization to superimpose nanotubular layers with different nanotube diameters (30 nm, 50 nm, and 80 nm, producing the hybrid surfaces SLA + 30 nm, SLA + 50 nm, and SLA + 80 nm, respectively). We hypothesized that these topographies will enhance bioactivities such as osteogenesis and early bone bonding. First, the bioactivity of the materials was evaluated in vitro using MG63 osteoblasts. The expression of the osteogenesis-related genes runt-related transcription factor 2 (RUNX2), alkaline phosphatase (ALP), and osteocalcin (OCN) was detected using real-time polymerase chain reaction (RT-PCR). Second, the effect of each surface on osseointegration was determined in vivo using a canine model.
Materials and methods
Specimen preparation
The titanium specimens used for in vitro and in vivo tests were divided into four groups: SLA (control group without nanotubes), SLA + 30 nm, SLA + 50 nm, and SLA + 80 nm.
Before synthesis, titanium discs 15 mm in diameter and 1.5 mm thick were cut from commercially obtained pure titanium plates for cell tests, and titanium cylinder implants (schematic diagram shown in Figure S1) were made for us by a company according to our order (grade 2, Tengxing Metal Materials, Shenzhen, People’s Republic of China). All titanium surfaces were ground with silicon carbide sandpapers of 280, 360, 400, 600, 800, and 1,000 grits in series. The titanium specimens were then immersed in 10 mL of acetone (Fuyu, Tianjin, People’s Republic of China) at room temperature, ultrasonicated for 20 minutes, ultrasonicated for a further 20 minutes in 10 mL of absolute alcohol (Fuyu), and then rinsed with deionized water. Subsequently, the specimens were dried at room temperature.
The SLA surfaces were prepared according to a previously described method.26 All titanium specimens were sandblasted by 120 μm Al2O3 particles from a distance of 50 mm at an angle of 90°. The air pressure used for blasting was set to 0.45 MPa, and the procedure was conducted for 30 seconds. Subsequently, the specimens were etched using a mixture of 18% (v/v) HCl and 49% (v/v) H2SO4 at 60°C for 30 minutes and then ultrasonically cleaned in ddH2O for 15 minutes. Finally, all of the specimens were air dried at room temperature. The nanotubes were superimposed on the surface of the SLA using 0.5% (w/v) hydrofluoric acid (Fuyu) at 10 V, 15 V, and 20 V for 30 minutes to obtain nanotubular layers comprising nanotubes of different diameters to form the surfaces SLA + 30 nm, SLA + 50 nm, and SLA + 80 nm.27 A platinum electrode served as the cathode. After being anodized, the specimens were rinsed with distilled water several times, air dried at 80°C, and heat treated at 450°C for 2 hours to transform the as-anodized amorphous TiO2 nanotubes into a crystalline phase. All samples were collected, rinsed with deionized water, and sterilized by autoclaving before use.
Surface characterization
Following previously described methods,26,28 the morphology of each sample was analyzed using field emission scanning electron microscopy (FE-SEM; FEI-Quanta 400, Hillsboro, OR, USA). Water contact angle measurements were carried out using the sessile drop technique (OCA 40 Micro; DataPhysics, Filderstadt, Germany) at room temperature. Surface roughness (Ra) was measured by a profilometer (Wyko NT9300; Veeco, NY, USA).
Measurement of protein adsorption
According to a previously described method,28 the abilities of the SLA + 30 nm, SLA + 50 nm, and SLA + 80 nm surfaces to adsorb a model protein (BSA, fraction V; Sigma-Aldrich Co., St Louis, MO, USA) were compared with that of the SLA-treated surface without nanotubes. First, 300 μL of protein solution (1 mg of protein/mL of saline) was spread over each specimen using a pipette. After incubation for 1 hour, 2 hours, and 6 hours under sterile humidified conditions at 37°C, all nonadherent protein was removed, and the remaining solution was mixed with microbicinchoninic acid (Sigma-Aldrich Co.) at 37°C for 30 minutes. The protein content of the solution was quantified using a microplate reader (Model 680; Bio-Rad Laboratories Inc., Hercules, CA, USA) at 562 nm.
Cell culture
A human MG63 osteosarcoma cell line was cultured in Dulbecco’s Modified Eagle’s Medium (Hyclone, Thermo Fisher Scientific, Waltham, MA, USA) supplemented with 10% (v/v) fetal bovine serum (Hyclone) and antibiotics (penicillin [100 U/mL] and streptomycin [100 mg/mL]) at 37°C in a humidified atmosphere containing 5% CO2. At 80% confluence, the cells were detached using 0.25% (w/v) trypsin in 1 mM ethylenediamine tetraacetic acid 4Na and seeded onto the four different surfaces in 24-well plates at a density of 2.4×10⁴ cells cm−2. The culture medium was replaced on alternate days.26,28 This study was reviewed and approved by the Ethics Committee of Guangdong Provincial Stomatological Hospital, People’s Republic of China.
Cell adhesion assay
Cell attachment was initially evaluated by measuring the amount of cells attached to the titanium substrates after 30 minutes, 1 hour, and 4 hours of incubation, as described previously.26,28 At each prescribed time point, nonadherent cells were removed by gentle rinsing with phosphate-buffered saline (PBS). Adherent cells were fixed with 4% (w/v) paraformaldehyde for 30 minutes and then stained with fluorescent Hoechst 33342 dye for 5 minutes. Cell adhesion was evaluated by counting the number of stained nuclei on each sheet in the fluorescent microscopic images (100× magnification, counts performed over an area of 1,800×1,350 μm2). Values representing the mean and the standard error of the number of attached cells were calculated from ten different random fields in each disc using Image-Pro Plus 6.0 software (Media Cybernetics, Rockville, MD, USA; n=3, a total of 30 fields of view for each group).
Immunofluorescent staining
Cytoskeletal changes in the MG63 cells were observed using an immunofluorescent staining technique.26,28 After incubation of the cells for 1 hour, 3 hours, and 6 hours, the culture medium was gently removed from the wells. The cells were washed with PBS, fixed with 4% (w/v) paraformaldehyde for 20 minutes, and then washed several times with PBS. The fixed cells were treated with 0.1% (v/v) Triton™ X-100 in PBS and then blocked with 1.0% (w/v) BSA in PBS. The actin cytoskeleton was stained with phalloidin conjugated to Alexa Fluor® 488 dye (Thermo Fisher Scientific), and the nucleus was stained with Hoechst 33342 dye (Thermo Fisher Scientific). The stained cells were observed under a fluorescence microscope (IX51; Olympus Corporation, Tokyo, Japan).
Cell morphology assay
FE-SEM was used to analyze the cell morphology 3 hours and 6 hours after the MG63 cells had been seeded in the four different groups. The culture medium with unattached cells was carefully removed from the wells by a pipette, and the cells grown on the SLA, SLA + 30 nm, SLA + 50 nm, and SLA + 80 nm surfaces were then rinsed two times with PBS. Cells were fixed with 2.5% (v/v) glutaraldehyde in PBS for 1 hour and washed three times with PBS for 5 minutes at room temperature. Each sample then underwent graded dehydration with 30%, 50%, 70%, 90%, and 100% pure ethyl alcohol for 10 minutes at room temperature, after which the samples were dried for analysis by FE-SEM.26,28
Cell proliferation assay
Cell proliferation was determined by measuring cell density on culture days 1, 3, 5, and 7 using tetrazolium salt-based colorimetry (MTS; Promega Corporation, Fitchburg, WI, USA).26,28 At each prescribed time point, the specimens were gently rinsed three times with PBS and transferred to a new 24-well plate. Next, 500 μL of Dulbecco’s Modified Eagle’s Medium was added to each well and incubated with 100 μL of MTS reagent at 37°C for 4 hours. The amount of formazan product was measured using a microplate reader at 490 nm.
Osteogenesis-related genes’ expression
The expression of osteogenesis-related genes was evaluated using RT-PCR as previously described.22 The MG63 cells were seeded with 2×10⁴ cells/disc and cultured for 7 days and 14 days. The total RNA was isolated using TRIzol® reagent (Thermo Fisher Scientific). One microgram of RNA from each sample was reverse transcribed into complementary DNA using the PrimeScript™ RT reagent kit (TaKaRa Bio, Otsu, Japan). The expression levels of osteogenesis-related genes including RUNX2, ALP, and OCN were quantified using an iQ™5 Multicolor RT-PCR Detection System (Bio-Rad Laboratories Inc.) with SYBR Premix Ex™ Taq II (TaKaRa Bio). Data analysis was carried out using iQ™5 Optical System Software Version 2.0 (Bio-Rad Laboratories Inc.). The relative expression levels for each gene of interest were normalized to that of the housekeeping gene (GAPDH). The primers are listed in Table S1.
Animals and surgery
Animals
Twenty-four healthy male beagle dogs, ~15 months old and weighing 16–17 kg, were used in this study. All of the animals were housed in a temperature-controlled room with a 12 hours alternating light–dark cycle and were given water and food throughout the study. All animals were acclimatized for at least 2 weeks before the study began. The experimental protocol in this study was reviewed and approved by the Animal Care and Use Committees of Guangdong Provincial Stomatological Hospital, People’s Republic of China.
Surgical procedure
The animals were randomly divided into four groups (n=6 in each group). In each beagle dog, eight implants of one type (SLA, SLA + 30 nm, SLA + 50 nm, or SLA + 80 nm) were inserted into two tibias, and each tibia received four implants. Therefore, a total of 192 implants were inserted into the tibias of 24 beagle dogs (Figure S2). All surgical procedures were performed under general anesthesia. Su Mian Xin 2 was used as a preanesthetic (composition: 2,4-dimethylaniline thiazole, ethylenediamine tetraacetic acid, dihydroetorphine hydrochloride, and haloperidol; 0.1 mL/kg; Animal Husbandry Research Institute, Jilin, People’s Republic of China) through intramuscular administration. General anesthesia was then obtained after an intramuscular injection of 3% (w/v) pentobarbital sodium (1 mL/kg, Sigma-Aldrich Co.). Surgery was performed under sterile conditions. After hair shaving, skin exposure, and antiseptic cleaning with iodine solution at the surgical and surrounding areas, a 5 cm incision at the skin level was made. Then, a flap was retracted to expose the tibia diaphysis. Using a series of implant drills (a 2.3 mm round bur, a 2.5 mm pilot drill, a 2.8–3.2 mm reamer drill, and a 3.3 mm profile drill), four identical holes were produced from proximal to distal along the central region of the bone for implantation and were drilled at a low speed (800 rpm) under profuse cooling normal saline (0.9% [w/v] NaCl) irrigation. Four implants were inserted by press-fit. The periosteum and skin of the wound were sutured in two layers. After surgery, the animals were allowed to move freely and received antibiotics for 3 days to prevent postsurgical infection. After a healing period of 2 weeks or 4 weeks, the animals were sacrificed by overdose of 3% (w/v) sodium pentobarbital.
Histological preparation
The tibias containing implants were harvested at weeks 2 and 4 of the healing process and fixed in 10% (w/v) buffered formalin at 4°C for 2 weeks. All of the specimens were dehydrated in an ascending series of alcohol rinses and embedded in light-curing epoxy resin (Technovit 7200VLC; Heraeus Kulzer, Wehrheim, Germany) without decalcification. The specimens were cut along the long axis, and thus every section had four chambers that were used for tests. The specimens were ground to a thickness of 30 μm with a grinding system (Exakt Apparatebau, Norderstedt, Germany). The sections were stained with toluidine blue and observed by light microscopy (40× magnification).
Histomorphometry
To evaluate the response of the bone surrounding the implants, histological and histomorphometrical analyses were performed using a light microscope (BX41; Olympus Corporation), and image analysis software (Image-Pro Plus 6.0) was used for the histomorphometrical evaluation, following previously described methods.29–31 Figure S3 shows a schematic representation of the analyses, which included evaluation of the following variables:
- Bone–implant contact (BIC; %) = (sum of the length of BIC)/(circumference of the implant chamber region) ×100, where the BIC was defined as the interface where the bone tissue was located within 20 μm of the implant surface without any intervention of soft tissue;
- Bone area (BA; %) = (sum of the BA in the implant chamber region)/(area of the implant chamber region) ×100.
Statistical analysis
The data were analyzed using SPSS 13.0 software (SPSS Inc., Chicago, IL, USA). Q–Q plots were used to test the distribution of data. A one-way analysis of variance followed by a Student–Newman–Keuls post hoc test was used to determine the level of significance. Factorial analysis was used to evaluate the effects of group and time. Values of P<0.05 were considered to be significant, and values of P<0.01 were considered to be highly significant.
Results
Surface characterization of different groups
Multilevel pores characterized by 10–30 μm pits and 1–3 μm micropits were initially formed on the specimen surfaces by SLA. The surface structure consisted of relatively sharp edges (Figure 1). Next, the nanotubular layers were fabricated on the microstructured surface. After anodization at 10 V, 15 V, or 20 V and annealing at 450°C, the morphology of the resulting TiO2 nanotube array thin films was characterized using FE-SEM to ascertain the nanotube dimensions (Figure 1). The nanotubes produced at 10 V, 15 V, and 20 V were found to have 30 nm, 50 nm, and 80 nm outer diameters, respectively. The sharp edges were smoothed, and the micropits became blunt after adding the nanotubular surfaces. Nanotubes of different sizes formed on the microstructured surface and were distributed relatively uniformly.
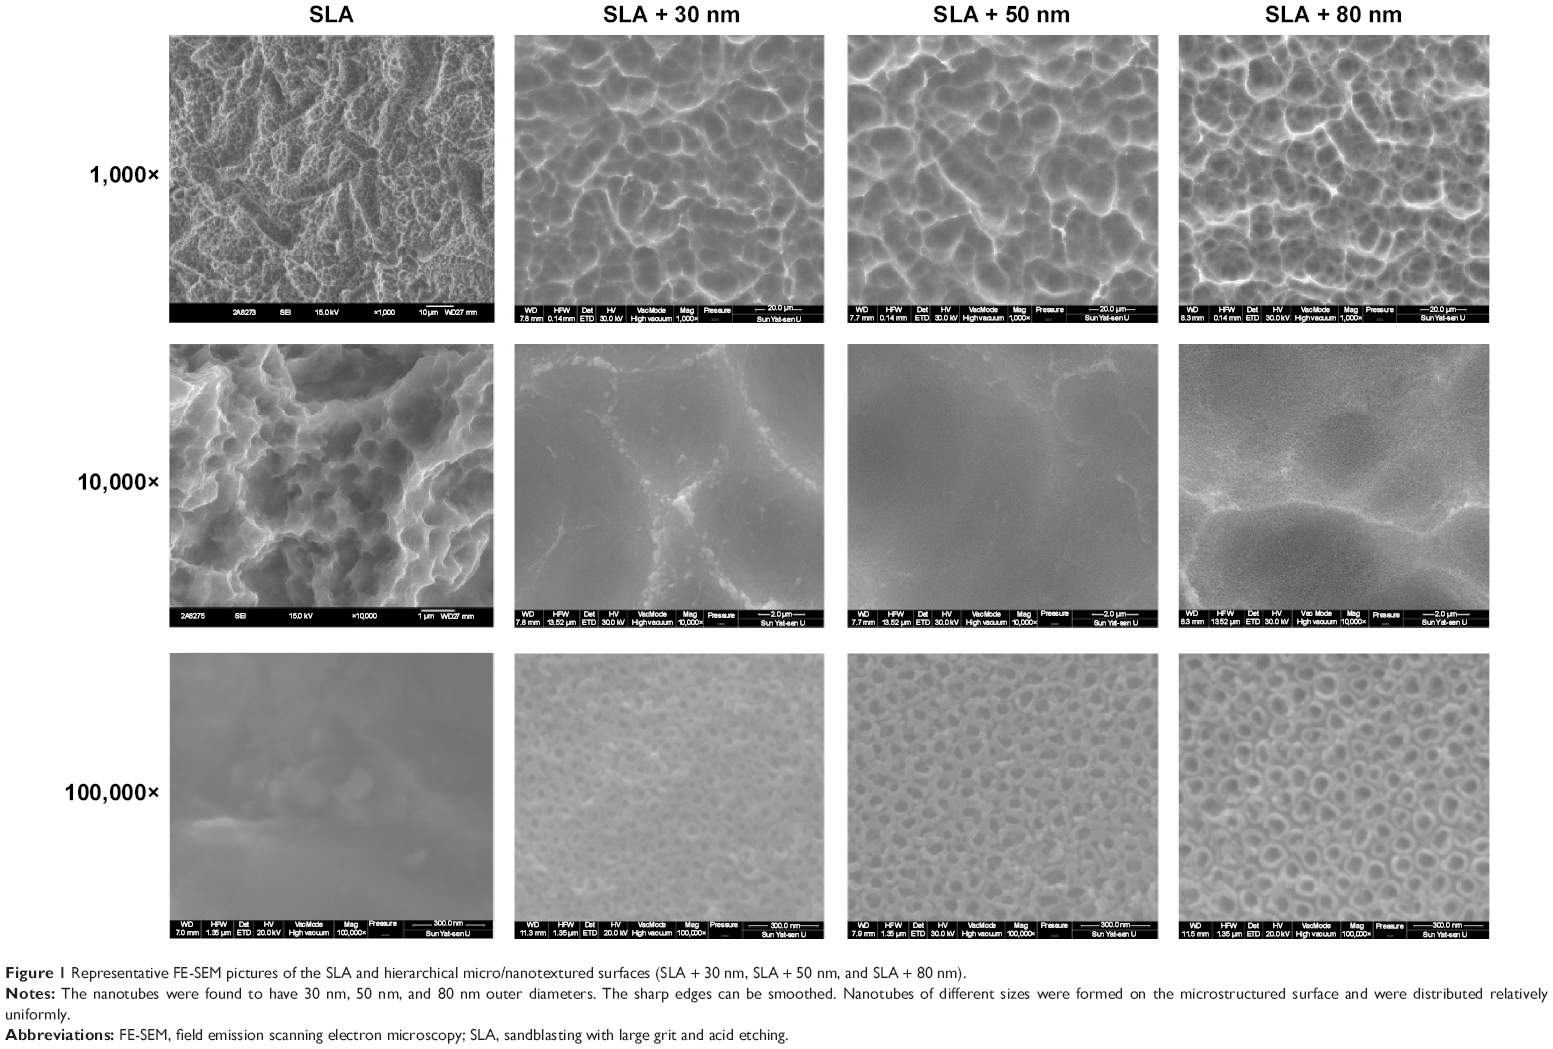 | Figure 1 Representative FE-SEM pictures of the SLA and hierarchical micro/nanotextured surfaces (SLA + 30 nm, SLA + 50 nm, and SLA + 80 nm). |
The Ra of the different groups was assayed, and the results are displayed in Figure 2. The Ra values of the SLA, SLA + 30 nm, SLA + 50 nm, and SLA + 80 nm groups were 2.06±0.13 μm, 2.87±0.21 μm, 2.74±0.20 μm, and 2.44±0.31 μm, respectively. There were no statistically significant differences in Ra between the SLA + 50 nm and SLA + 80 nm groups, but these groups had significantly higher Ra values than those of the other two groups, and the SLA + 80 nm surface was significantly rougher than that of the SLA-treated surface without nanotubes.
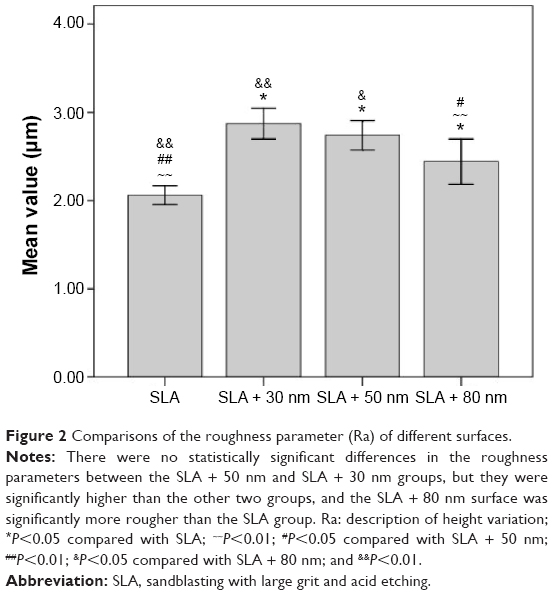 | Figure 2 Comparisons of the roughness parameter (Ra) of different surfaces. |
The contact angle measurements are shown in Figure 3. The average contact angle of the SLA surface was ~11°. The other three groups showed superhydrophilicity at a water contact angle of 0°.
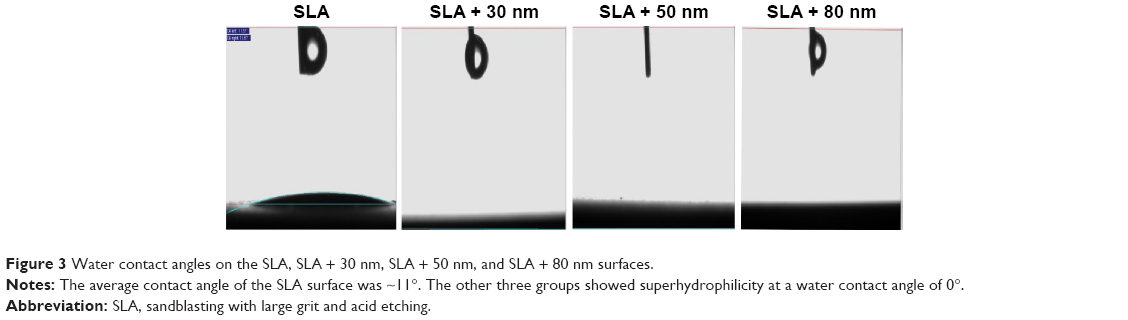 | Figure 3 Water contact angles on the SLA, SLA + 30 nm, SLA + 50 nm, and SLA + 80 nm surfaces. |
Protein adsorption
The protein adsorptive rates of the SLA, SLA + 30 nm, SLA + 50 nm, and SLA + 80 nm surfaces over different time periods were analyzed using a bicinchoninic acid assay, and the results are shown in Figure 4. The SLA + 30 nm group had the highest protein adsorption rate compared with those of the other groups, regardless of incubation time. After 1 hour of incubation, the protein adsorptive rate of the SLA + 30 nm group reached 18%, and after 6 hours of incubation, it reached ~38%. Among the other three groups, more protein was adsorbed on the SLA + 50 nm surface than on the SLA or SLA + 80 nm surfaces. The SLA group had the lowest protein adsorption rate at different incubation times, only reaching 2% after incubation for 1 hour and 15% after incubation for 6 hours.
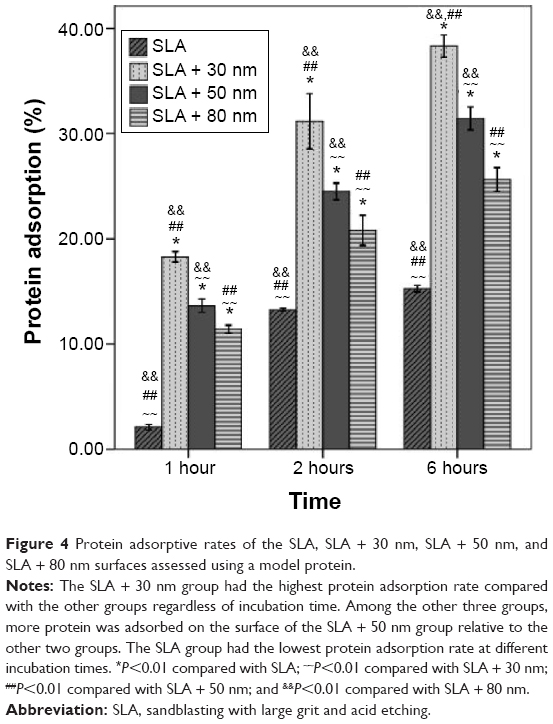 | Figure 4 Protein adsorptive rates of the SLA, SLA + 30 nm, SLA + 50 nm, and SLA + 80 nm surfaces assessed using a model protein. |
Cell adhesion
Initial cell adhesion on the SLA, SLA + 30 nm, SLA + 50 nm, and SLA + 80 nm surfaces was estimated by counting the number of MG63 cell nuclei stained with Hoechst dye as shown in Figure 5. The results were calculated using Image-Pro Plus 6.0 software and are displayed as histograms in Figure S4. At each time interval adopted in this study, the numbers of adherent cells on the three micro/nanotextured surfaces were dramatically larger than that on the SLA surface (P<0.05). The cell number on the surface of the SLA + 30 nm group was significantly higher than those on the other two groups (P<0.01). For each incubation time, the surfaces of the SLA group had the lowest number of cells among groups.
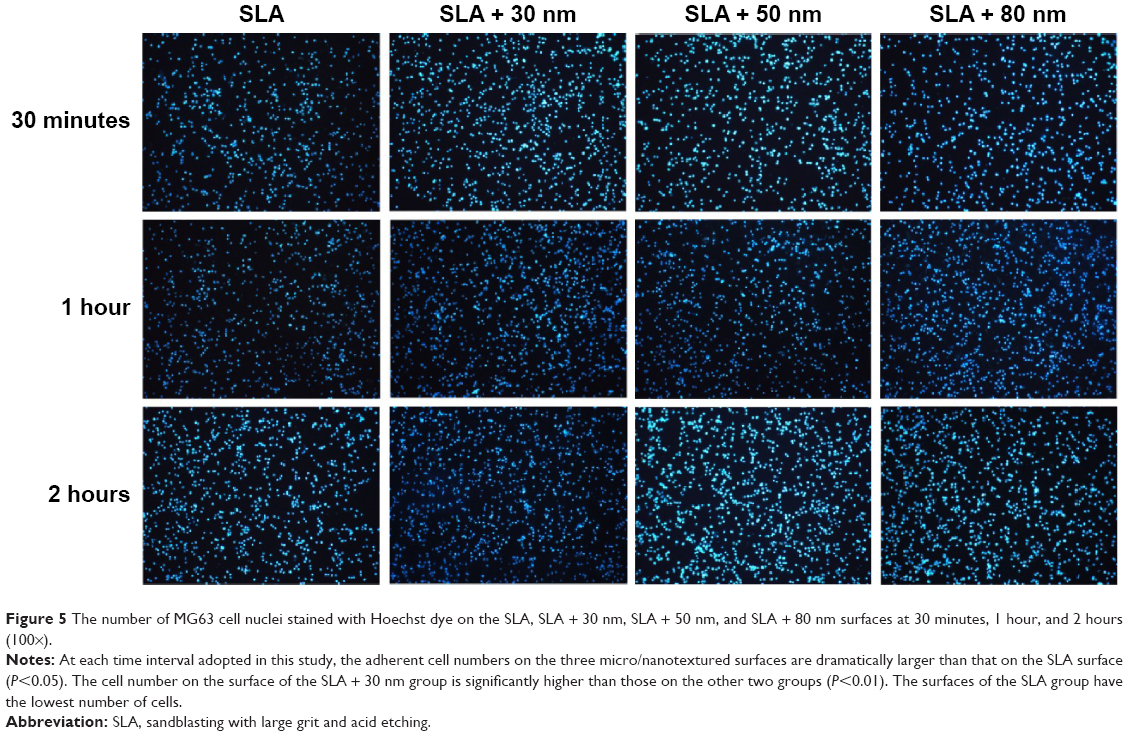 | Figure 5 The number of MG63 cell nuclei stained with Hoechst dye on the SLA, SLA + 30 nm, SLA + 50 nm, and SLA + 80 nm surfaces at 30 minutes, 1 hour, and 2 hours (100×). |
Immunofluorescent staining
MG63 cell adhesion and spreading on the SLA, SLA + 30 nm, SLA + 50 nm, and SLA + 80 nm surfaces were further investigated by immunofluorescent staining. Fluorescence images of the MG63 cells adhered to the four groups of substrates are shown in Figure 6. After 1 hour of incubation, most of the cells maintained a round shape. Actin around the blue nuclei was stained green and was not yet arranged on the different surfaces. At 3 hours after seeding, the cells had begun to spread and formed an irregular shape. Particularly on the SLA + 30 nm surface, the actin of the cells was organized along the spreading direction and had formed a number of filopodia. Interestingly, most of the cells on the surface of the SLA + 80 nm group maintained a round or oval shape, but the cells also stretched out many filopodia. In accordance with the FE-SEM results, after 6 hours of incubation, cells on the three micro/nanotextured surfaces had stretched out many filopodia and some lamellipodia. In particular, the cellular cytoskeleton of cells on the SLA + 80 nm surface achieved a more extensive and homogeneous arrangement compared with those of the other three groups. The shapes of cells grown on the SLA + 30 nm and SLA + 80 nm surfaces were clearly different. We observed that those grown on the SLA + 80 nm surface were the most irregularly shaped, while those grown on the SLA + 30 nm surfaces had relatively regular shapes.
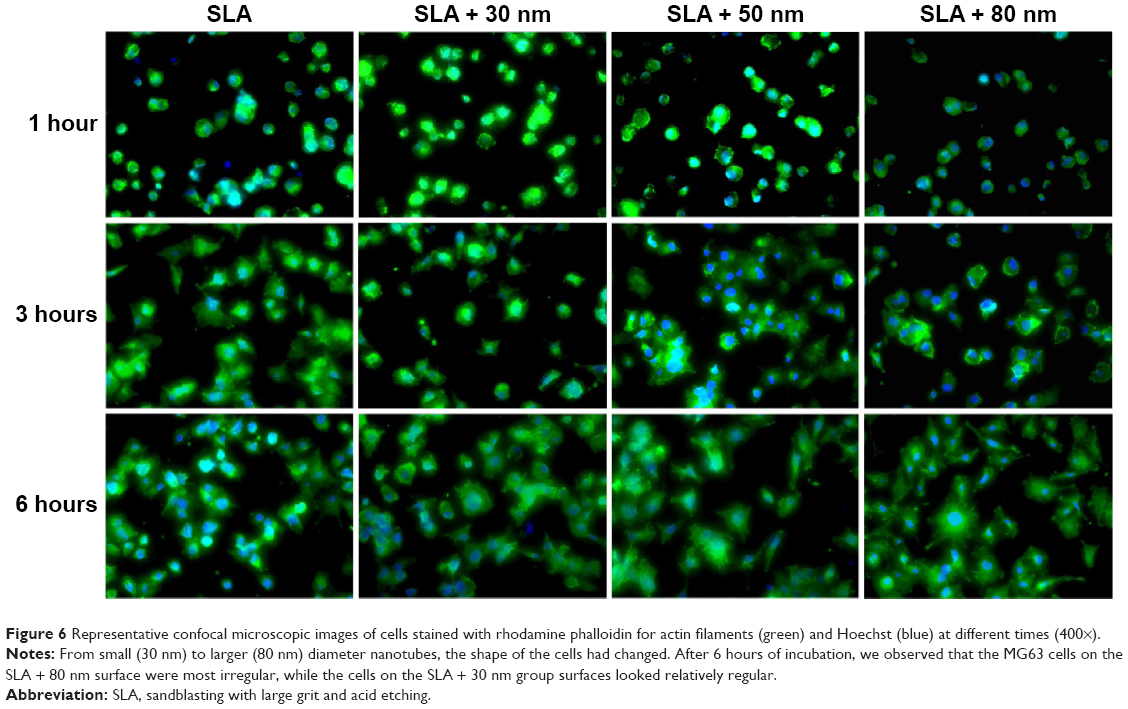 | Figure 6 Representative confocal microscopic images of cells stained with rhodamine phalloidin for actin filaments (green) and Hoechst (blue) at different times (400×). |
Cellular morphology on different surfaces
As shown in Figures 7 and 8, the morphology of the MG63 cells obviously changed over time after seeding on different surfaces. After 3 hours of incubation, MG63 cells attached to the 10–30 μm pits generated by sandblasting, especially on the surfaces of the SLA group. On the other three micro/nanotextured surfaces, the cells had more extended filopodia from their leading edges. Six hours after seeding, the cells on the micro/nanotextured surfaces still showed more extended filopodia and some lamellipodia, especially in the SLA + 80 nm group, in which the cells formed extraordinarily irregular shapes. In contrast, the MG63 cells on the SLA surface showed few extended filopodia grasping the edges of the pits. Thus, we concluded that the shape of the cells on the SLA surface was decided by the shape of the pits.
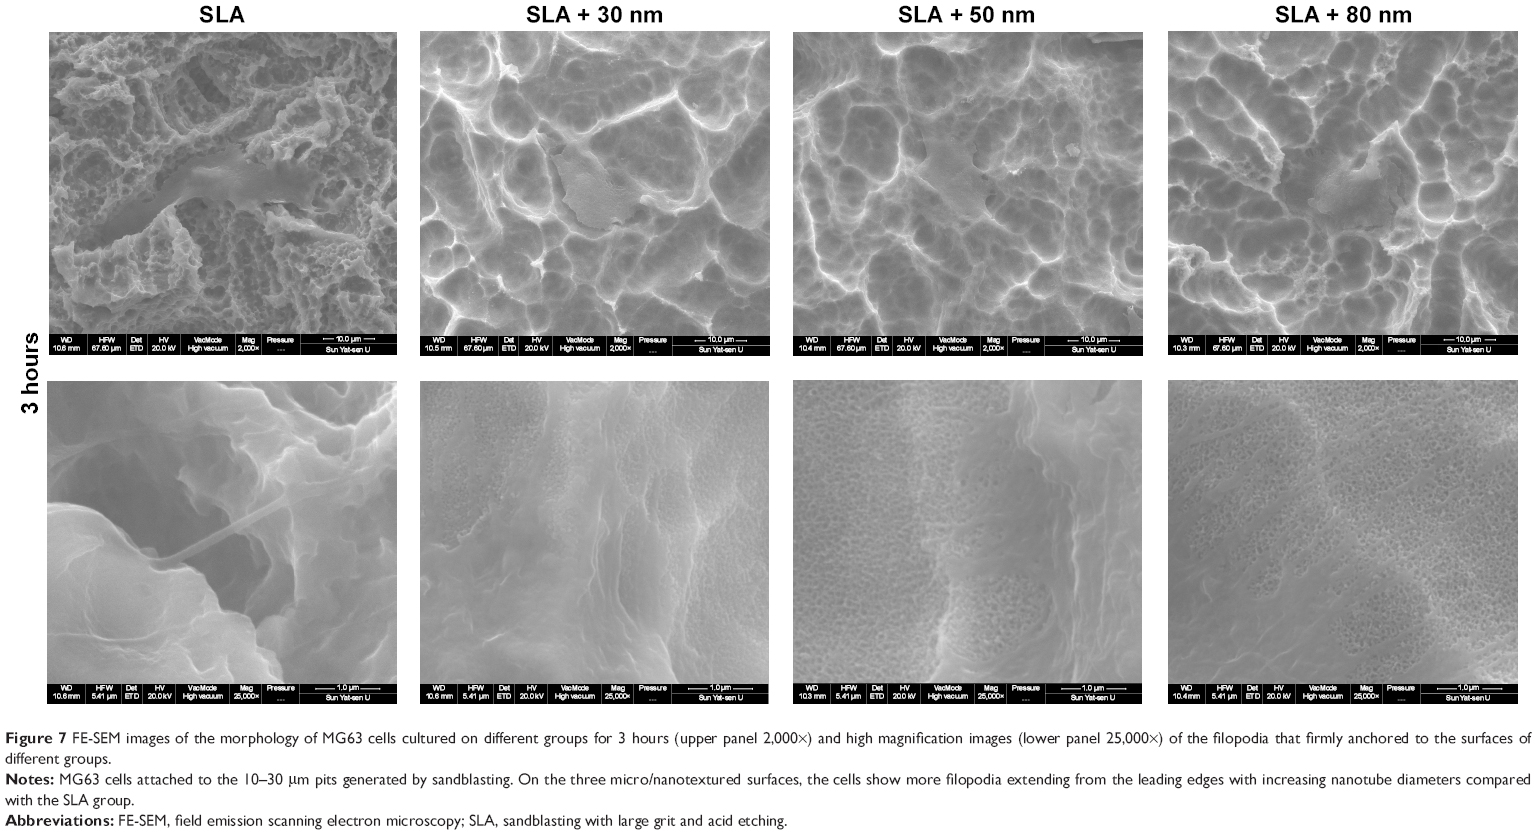 | Figure 7 FE-SEM images of the morphology of MG63 cells cultured on different groups for 3 hours (upper panel 2,000×) and high magnification images (lower panel 25,000×) of the filopodia that firmly anchored to the surfaces of different groups. |
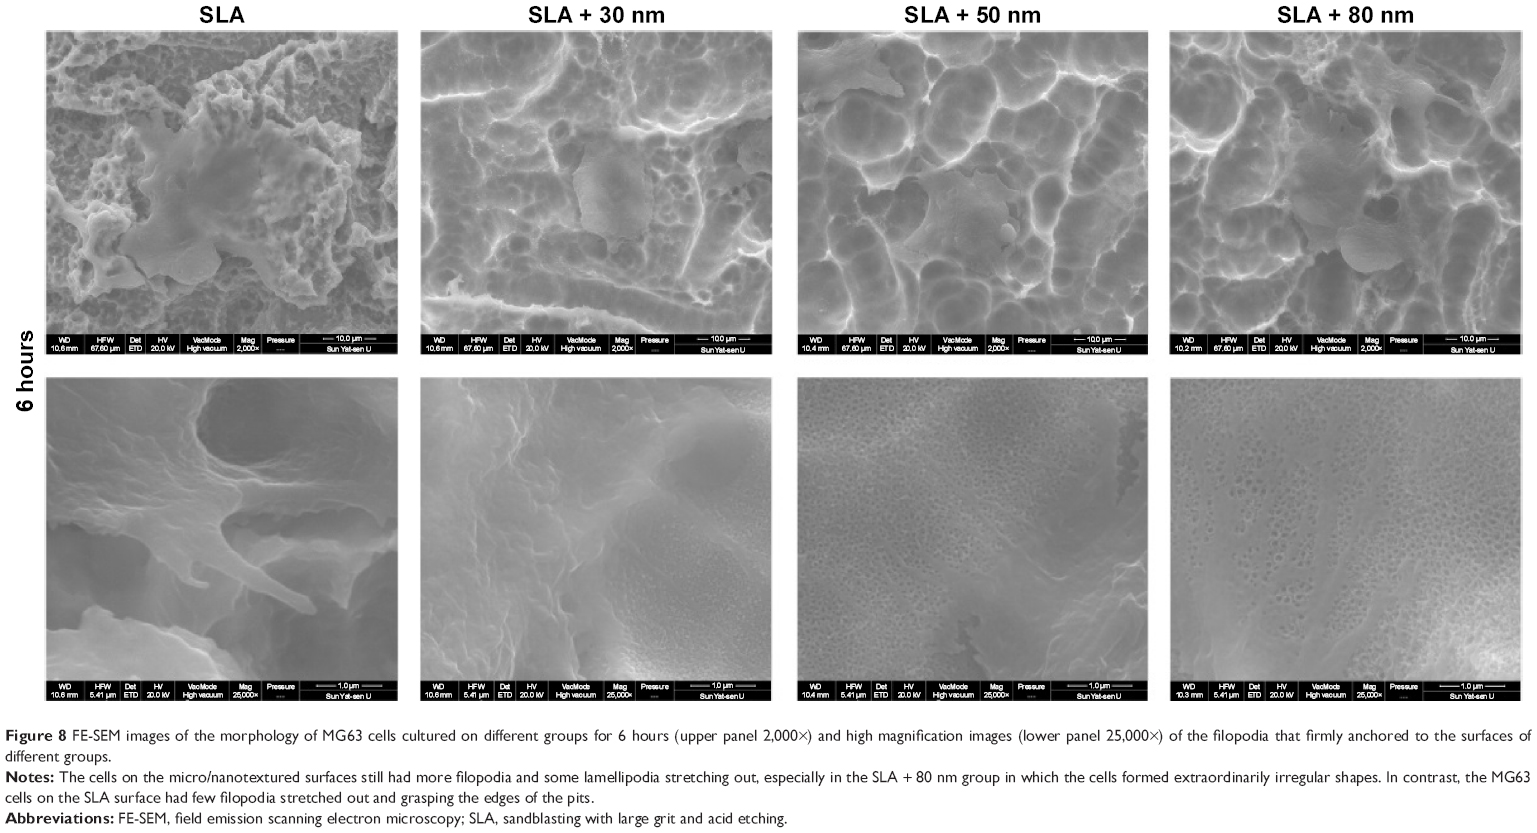 | Figure 8 FE-SEM images of the morphology of MG63 cells cultured on different groups for 6 hours (upper panel 2,000×) and high magnification images (lower panel 25,000×) of the filopodia that firmly anchored to the surfaces of different groups. |
Cell proliferation
Cell proliferation was evaluated by MTS assay as shown in Figure 9. Cell proliferation increased over time in all four groups. Cells grown on the SLA + 30 nm surface had significantly higher proliferative activity than did those on the other three surfaces, regardless of incubation time (P<0.05). No statistically significant differences were found among the other three groups.
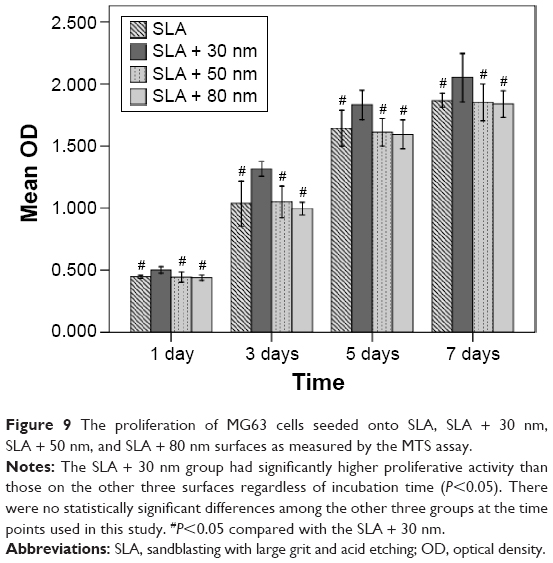 | Figure 9 The proliferation of MG63 cells seeded onto SLA, SLA + 30 nm, SLA + 50 nm, and SLA + 80 nm surfaces as measured by the MTS assay. |
Gene expression analysis
Gene expression on the titania surfaces was quantified using RT-PCR as shown in Figures 10–12. Generally speaking, ALP expression was detected at a high level at week 1 and was subsequently greatly decreased at week 2 (P<0.01). The expression level of ALP in cells grown on the SLA + 80 nm surface was higher than that in cells grown on other surfaces at all time points (P<0.01). The lowest level of ALP expression was observed in the SLA + 30 nm group, but ALP expression was not significantly different between cells grown on the SLA + 30 nm and SLA + 50 nm surfaces at week 1. RUNX2 expression was upregulated at week 1 and dropped to a low level at week 2 (P<0.01). The group showing the highest level of RUNX2 expression was SLA + 50 nm (P<0.01), followed by the SLA + 80 nm group at two time points, while SLA + 30 nm and SLA were the groups showing the lowest levels of RUNX2 expression at weeks 1 and 2, respectively. For OCN, a low level of expression was observed in all groups at week 1, followed by upregulation during week 2 (P<0.01). The groups with the highest and lowest expression levels of OCN, respectively, were the SLA + 80 nm and SLA + 30 nm groups at two time points (P<0.01).
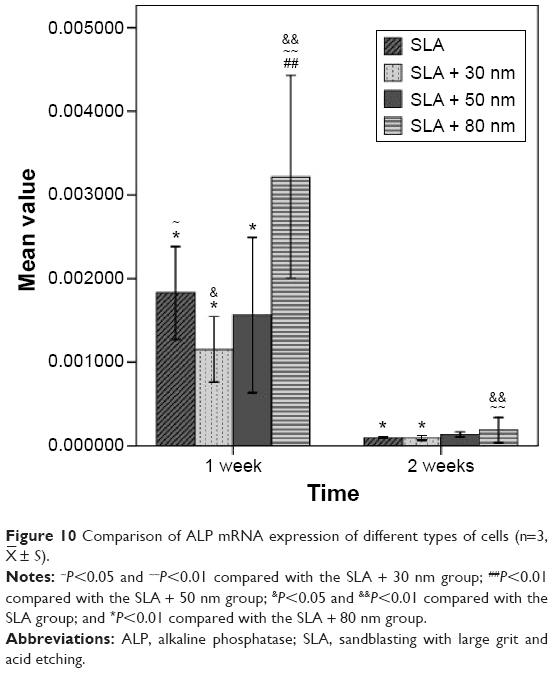 | Figure 10 Comparison of ALP mRNA expression of different types of cells (n=3, |
 ± S).
± S).
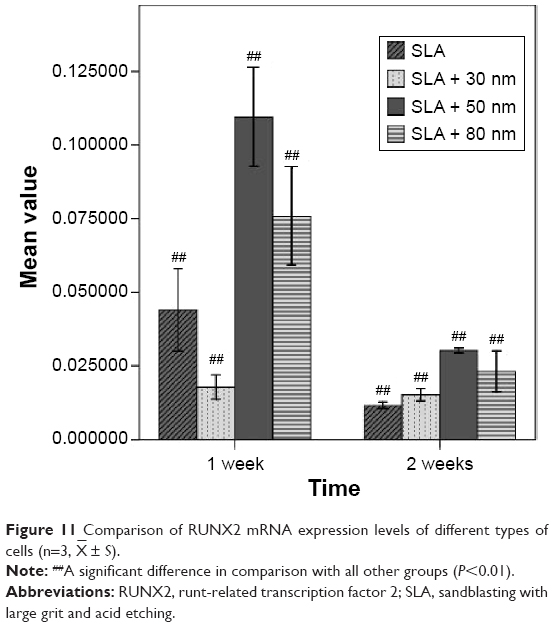 | Figure 11 Comparison of RUNX2 mRNA expression levels of different types of cells (n=3, |
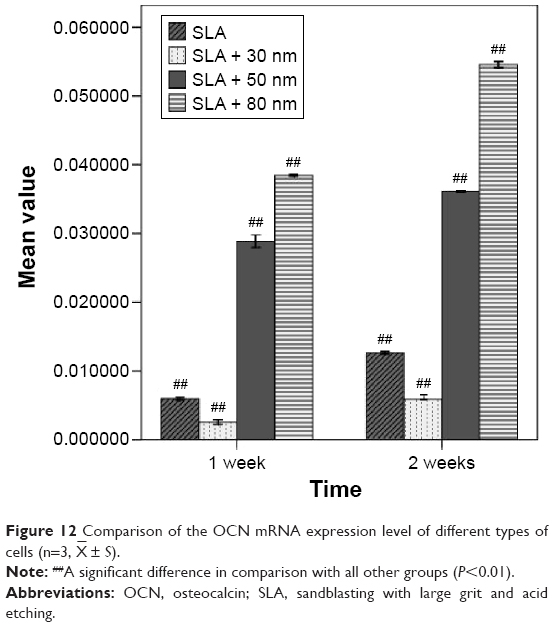 | Figure 12 Comparison of the OCN mRNA expression level of different types of cells (n=3, |
Histological observations/histomorphometrical analysis
Postoperative healing was uneventful in all dogs. No complications, such as allergic reactions, abscesses, and infections, were observed throughout the whole study period.
Two weeks and 4 weeks after the implantation, all implants in the control and test groups were histologically in direct contact with the surrounding bone, with no signs of inflammation at the bone–implant interface (Figures 13 and 14). In general, the healing chambers were partially filled with woven bone at 2 weeks in all groups. The SLA + 80 nm group had more new woven bone than the other groups, and this new bone was observed to be filling the healing chambers and in close contact with the implant surface. In the SLA group, a small amount of new bone was observed to be in contact with the implant surface and was filling the healing chambers. At 4 weeks after implantation, we observed more newly formed bone extending from the surface of the implant into the roof of the chamber, and some was in direct contact with the implant surface. Distinct demarcation lines were clearly observed between darker stained new bone and lighter stained old bone, particularly in the SLA + 80 nm group. This finding indicated that the new bone in the chambers had undergone remodeling and had become mature lamellar bone.
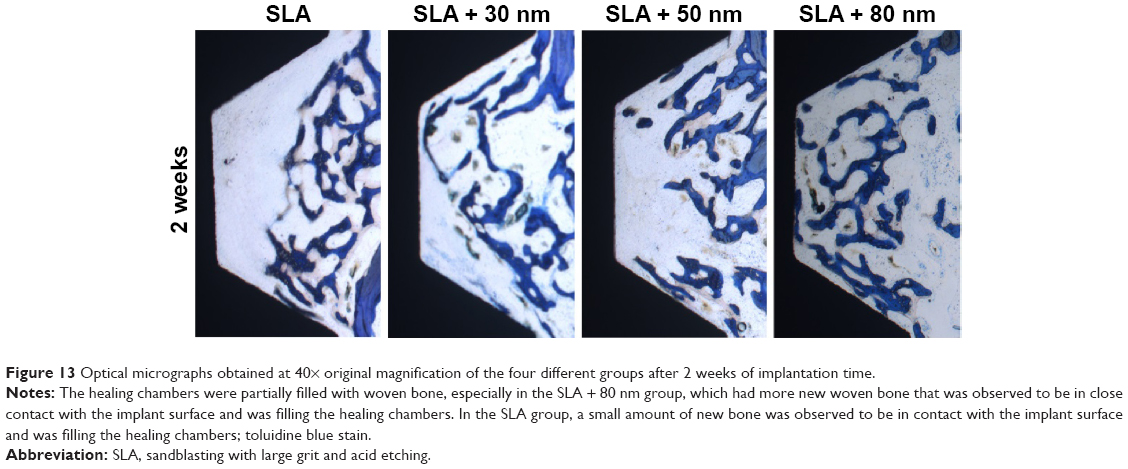 | Figure 13 Optical micrographs obtained at 40× original magnification of the four different groups after 2 weeks of implantation time. |
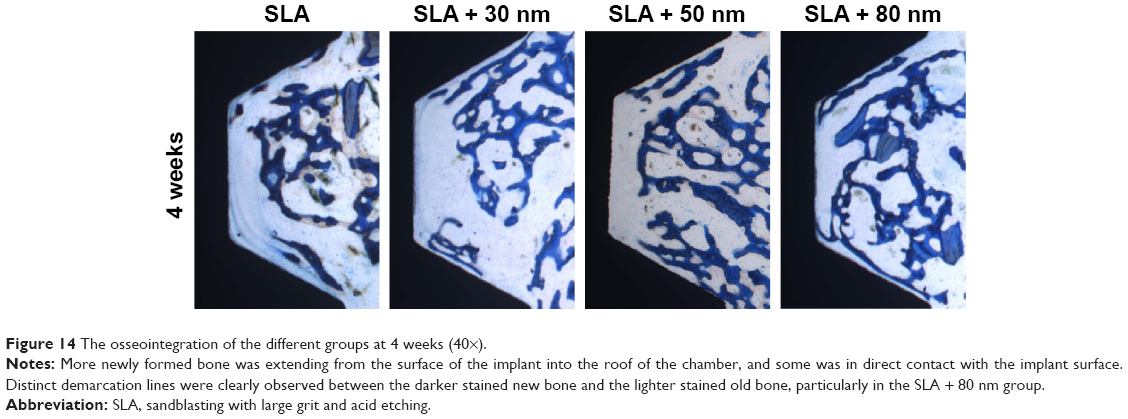 | Figure 14 The osseointegration of the different groups at 4 weeks (40×). |
At 2 weeks, the proportion of direct BIC with the SLA implants was 12.4%±0.008%. In the implants with 30 nm, 50 nm, and 80 nm TiO2 nanotube surfaces, the bone was more continuous along the implant surfaces, and the BIC values were 14.4%±0.008%, 18.3%±0.012%, and 23.3%±0.014%, respectively. The SLA + 80 nm group had the highest BIC value, and this was significantly higher than those of the other three groups (P<0.01). Group SLA + 50 nm had a higher BIC value than that of SLA + 30 nm, while the SLA group had the lowest level. The BIC values of the SLA, SLA + 30 nm, SLA + 50 nm, and SLA + 80 nm groups were 24.1%±0.007%, 32.1%±0.010%, 39.4%±0.010%, and 48.8%±0.012%, respectively, at 4 weeks after implantation. The SLA + 80 nm group still had the highest BIC level (P<0.01), followed by the SLA + 50 nm group, and the SLA remained the lowest group at 4 weeks after implantation.
The mean BAs of the SLA, SLA + 30 nm, SLA + 50 nm, and SLA + 80 nm groups were 17.3%±0.023%, 22.5%±0.023%, 25.2%±0.020%, and 31.7%±0.042%, respectively, at 2 weeks. At 4 weeks after implantation, mean BAs had increased in all groups compared with baseline values (P<0.01). Specifically, the BAs of the SLA, SLA + 30 nm, SLA + 50 nm, and SLA + 80 nm groups were 37.4%±0.03%, 42.9%±0.028%, 45.1%±0.036%, and 53.1%±0.023%, respectively. At each time interval adopted in this study, the mean BAs of the three micro/nanotextured surfaces were dramatically larger than that on the SLA surface (P<0.01), and the SLA + 80 nm group always had the highest mean BA (P<0.05). The SLA group always had the lowest mean BA at each time point.
Thus, at weeks 2 and 4, significantly higher new bone growth (as measured by BIC and BA) was observed with the TiO2 nanotube-coated implants, especially those coated with 80 nm TiO2 nanotubes (Figures S5 and S6), while the SLA group always had the lowest BIC and BA.
Discussion
In modern dental and orthopedic implant materials, microroughness, microirregularity, and microtopography have become standard surface features required for eminent mechanical fixation and clinical performance.32,33 SLA treatment is considered to be a reliable procedure for achieving a modified titanium surface with suitable topography and roughness for use in implants. It is believed that these microscale surface topographies are beneficial for the mechanical fixation of the implant by increasing the contact area with bone tissue and the in-growth of new bone. However, the early osseointegration of the implants and cell behaviors, such as proliferation, intracellular total protein synthesis, and ALP activity, as well as ECM deposition and mineralization, are obviously reduced on these rough surfaces.4–8
Nanoscale surface morphological modification has been applied to titanium-based materials.34–37 This surface possesses unique properties that influence molecular and cellular activities and alter the process of osseointegration by direct and indirect mechanisms.1,13–15 Several previous studies have demonstrated the beneficial effects of TiO2 nanotubes on osteoblast differentiation and bone formation around implants in vivo and in vitro.16–18,21 In this study, we first obtained a classical microscale surface by SLA treatment, and then nanotubes with different diameters (30 nm, 50 nm, and 80 nm) were superimposed on the micron-scale surface via simple anodization. We aimed to achieve a hybrid surface possessing the advantages of both micro- and nanostructured surfaces.
First, the protein adsorptive rates for each of the tested surfaces (SLA, SLA + 30 nm, SLA + 50 nm, and SLA + 80 nm) were analyzed because proteins are suggested to play vital roles in cell–biomaterial interactions. Our results showed that the SLA + 30 nm group had a higher protein adsorption rate than those of the SLA + 50 nm, SLA + 80 nm, and SLA groups, regardless of the duration of incubation. It is speculated that this higher protein adsorption is due largely to a higher specific surface area. Furthermore, among the various sizes of TiO2 nanotubes, the smaller dimension nanotubes of 30 nm diameter and to some extent the 50 nm diameter showed higher protein adsorption rates when compared with nanotubes of 80 nm diameter. The reason for the greatly reduced protein aggregate adsorption observed on the larger diameter nanotubes of 80 nm diameter is most likely because 30 nm-sized protein aggregates are too small to anchor onto 80 nm diameter nanotubes, which have much larger open pore spaces, because the protein aggregates initially attach only to the available surfaces of the top portion of the nanotube walls.19
The phenomenon of initial protein adsorption is very important in understanding why MG63 cells developed more irregular shapes when grown on the SLA + 80 nm nanotube surface than when grown on SLA-treated surfaces with smaller sized or no nanotubes. ECM proteins are required for cells to adhere to surfaces and spread out. During incubation with a micro- or nanostructured surface, proteins in the culture media (derived from the serum) adsorb to the surface and act as a preliminary ECM, which can help cell adhesion considerably at the earliest stages of culture before cells begin secreting ECM. MG63 cells cultured on 30 nm TiO2 nanotubes can more easily attach to the surface because of the high population of ECM proteins deposited across the specimen surface.19 However, MG63 cells cultured on SLA + 80 nm would probably have to search more widely for areas containing protein aggregates to establish initial contact due to larger spacing among protein aggregates resulting from the large pore sizes of the nanostructure. This larger spacing among aggregates also means that MG63 cells have to extend their filopodia and lamellipodia excessively and move to find proteins, thus becoming more mobile and forming more irregular shapes.
The cell adhesion and proliferation aspects were further studied to elucidate the optimum nanotube size for positively influencing the behavior of MG63 cells grown on the micro-nano-hybrid titanium surface. It is notable that MG63 cells adhered to the smallest tested nanotubes (SLA + 30 nm surface) more efficiently in the first 2 hours than after that time, probably because of the high protein population initially adsorbing to the surface. Of course, this finding also suggests that the numbers of adhered MG63 cells initially adhering onto the experimental substrata decreased almost inversely with the pore size of the TiO2 nanotubes.19 Surfaces with constructed microtopographies are known to promote osteoblast differentiation but reduce osteoblast proliferation.8,38 Park et al demonstrated that the adhesion, proliferation, migration, and differentiation of mesenchymal stem cells (MSCs) were maximally induced on 15 nm nanotubes but were prevented on 100 nm nanotubes, which induced cell death.16–18 However, some uncertainty about the broad applicability of these results persists.19–21 Our study revealed that the addition of small diameter nanotubes to a microtopographic surface (SLA + 30 nm) led to enhanced osteoblast proliferation, and these results are in agreement with the findings of Oh et al.19 In contrast, on larger diameter nanotubes (SLA + 80 nm), the proliferation of osteoblasts was found to be unaffected. This may be due to the synergistic effects of the micro and nanotopographies. Kubo et al have suggested that micro- and nanotopographies may play a synergistic role in promoting osteoblast proliferation.25
Although the interaction between cells and biomaterials is observed to be regulated by nanoscale features, the optimal size range of nanotubes on microtopographic surfaces is still poorly understood. In this study, the expression of osteogenesis-related genes (OCN, RUNX2, and ALP) by osteoblasts was studied by quantitative RT-PCR analysis after 7 days and 14 days of incubation. Our results show that the SLA + 80 nm surface generally elicited the highest osteogenic gene expression compared with the other sizes of nanotubes. It is well known that various types of physical stresses from the substrate morphology and topography can improve osteoblast differentiation.39,40 Immunofluorescent and FE-SEM images of MG63 cells on larger sizes of TiO2 nanotubes (SLA + 80 nm) showed the formation of a higher number of filopodia, lamellipodia, and cellular extensions compared with those of cells grown on surfaces coated with smaller diameter or no nanotubes. It is most probable that this elongated morphology caused higher levels of cytoskeletal tension and stress for the MG63 cells cultured on the SLA + 80 nm surface compared with those of cells grown on a surface coated with smaller diameter nanotubes. It has been reported that an extracellular stimulus can pass through the cytoskeletal components to the nucleoskeleton, resulting in alterations to the structures of the interphase chromosomes positioned inside the nucleus and changes in gene expression.41,42 Our data show a scenario similar to those described by other studies relating to the modulation of the extrusion of cellular extensions and cell differentiation by material surface properties.
To further support the RT-PCR results described above, a canine model was used to perform an in vivo evaluation to determine the optimum diameter of TiO2 nanotubes that should be superimposed on the microtopography for early osseointegration. Not surprisingly, the in vivo results further demonstrated the enhanced early osseointegration behavior of the implants with SLA + 80 nm surfaces. In native bone tissues, stem cells and osteoblasts are exposed to the surface of the implant. As the cells encounter the SLA + 80 nm surface, they are forced to elongate and stretch to search for protein aggregates, activating intracellular signaling cascades that promote their differentiation into mature osteoblasts. The in vivo results clearly demonstrated the synergistic effects of the larger diameter nanotubes (80 nm) and the microscale rough surface. Similar results were previously demonstrated by Yun et al.29 New bone tissue had apparently formed on the SLA + 80 nm surface, while only a little new bone tissue could be found on the SLA + 30 nm and SLA surfaces. However, the mean BA and BIC of the SLA + 30 nm group were higher than those of the SLA group, and overall, the effectiveness of the hybrid surfaces in promoting new bone growth exceeded our expectations. The increased new bone growth may be due to more proteins and cells being attached to the surface of the SLA + 30 nm than to the SLA surface. However, the level of osteogenic gene expression of cells grown on the SLA + 30 nm surface was the lowest of the four groups.
Developing approaches to promote the faster and firmer fixation of implants into bone have been a persistent challenge for developing implants to expand therapeutic indications, reduce patients’ morbidities, and improve the success rate of the treatments.43,44 The enhancement of multiple functions related to new bone growth of cells grown on the hierarchical micro/nanotextured surfaces compared with that of cells grown on the microstructured surface led to faster bone maturation around the implant without compromising the amount of new bone mass. Moreover, the mechanical interlocking feature of the microtopography was maintained in this micro/nanostructure. It was observed in our experiments that the microtopography itself was not excessively altered after anodization, except that sharp edges became blunter. All of the three micro/nanotextured surfaces had similar hydrophilicities, and there was no obvious correlation between Ra and their biological effects. Therefore, the hierarchical SLA + 80 nm surface described in this study may be a useful surface for implants due to yielding of improved growth of surrounding bone.
Conclusion
In this report, hierarchical hybrid micro/nanotextured titanium surface topographies were produced by simple acid etching followed by anodization with titania nanotubes of different diameters. The SLA + 30 nm surface induced enhanced protein adsorption and initial cell adhesion and proliferation of osteoblasts. On the SLA + 80 nm surface, the shape of the cells appeared more irregular and osteogenesis-related gene expression was dramatically enhanced. In the experimental in vivo model, the SLA + 80 nm surface yielded improved new bone growth and implant integration compared with those induced by the other tested surfaces, which featured smaller diameter or no nanotubes. In light of these findings, the SLA + 80 nm surface presented in this study represents a pivotal advancement and appears to offer advantages over the titanium surfaces currently used for orthopedic and dental implants.
Acknowledgment
This work was supported by grants from the Nature Science Foundation of China (81170998) and the Medical Science Research Foundation of Guangdong Province (A2015208).
Disclosure
The authors report no conflicts of interest in this work.
References
Anselme K. Osteoblast adhesion on biomaterials. Biomaterials. 2000;21(7):667–681. | ||
Hansson S, Norton M. The relation between surface roughness and interfacial shear strength for bone-anchored implants. A mathematical model. J Biomech. 1999;32(8):829–836. | ||
Dohan Ehrenfest DM, Coelho PG, Kang BS, Sul YT, Albrektsson T. Classification of osseointegrated implant surfaces: materials, chemistry and topography. Trends Biotechnol. 2010;28(4):198–206. | ||
Palmquist A, Omar OM, Esposito M, Lausmaa J, Thomsen P. Titanium oral implants: surface characteristics, interface biology and clinical outcome. J R Soc Interface. 2010;7(suppl 5):S515–S527. | ||
Kim H, Choi SH, Ryu JJ, Koh SY, Park JH, Lee IS. The biocompatibility of SLA-treated titanium implants. Biomed Mater. 2008;3(2):25011. | ||
Yang GL, He FM, Yang XF, Wang XX, Zhao SF. Bone responses to titanium implants surface-roughened by sandblasted and double etched treatments in a rabbit model. Oral Surg Oral Med Oral Pathol Oral Radiol Endod. 2008;106(4):516–524. | ||
Cochran DL, Buser D, ten Bruggenkate CM, et al. The use of reduced healing times on ITI implants with a sandblasted and acid-etched (SLA) surface: early results from clinical trials on ITI SLA implants. Clin Oral Implants Res. 2002;13(2):144–153. | ||
Kim MJ, Kim CW, Lim YJ, Heo SJ. Microrough titanium surface affects biologic response in MG63 osteoblast-like cells. J Biomed Mater Res A. 2006;79(4):1023–1032. | ||
Lohmann CH, Bonewald LF, Sisk MA, et al. Maturation state determines the response of osteogenic cells to surface roughness and 1,25-dihydroxyvitamin D3. J Bone Miner Res. 2000;15(6):1169–1180. | ||
Boyan BD, Lossdörfer S, Wang L, et al. Osteoblasts generate an osteogenic microenvironment when grown on surfaces with rough microtopographies. Eur Cell Mater. 2003;6:22–27. | ||
Schwartz Z, Olivares-Navarrete R, Wieland M, Cochran DL, Boyan BD. Mechanisms regulating increased production of osteoprotegerin by osteoblasts cultured on microstructured titanium surfaces. Biomaterials. 2009;30(20):3390–3396. | ||
Liu H, Webster TJ. Nanomedicine for implants: a review of studies and necessary experimental tools. Biomaterials. 2007;28(2):354–369. | ||
Gao L, Feng B, Wang J, et al. Micro/nanostructural porous surface on titanium and bioactivity. J Biomed Mater Res B Appl Biomater. 2009;89(2):335–341. | ||
Fan H, Chen P, Qi R, et al. Greatly improved blood compatibility by microscopic multiscale design of surface architectures. Small. 2009;5(19):2144–2148. | ||
Bjursten LM, Rasmusson L, Oh S, Smith GC, Brammer KS, Jin S. Titanium dioxide nanotubes enhance bone bonding in vivo. J Biomed Mater Res A. 2010;92(3):1218–1224. | ||
Park J, Bauer S, von der Mark K, Schmuki P. Nanosize and vitality: TiO2 nanotube diameter directs cell fate. Nano Lett. 2007;7(6):1686–1691. | ||
Park J, Bauer S, Schmuki P, von der Mark K. Narrow window in nanoscale dependent activation of endothelial cell growth and differentiation on TiO2 nanotube surfaces. Nano Lett. 2009;9(9):3157–3164. | ||
Park J, Bauer S, Schlegel KA, Neukam FW, von der Mark K, Schmuki P. TiO2 nanotube surfaces: 15 nm – an optimal length scale of surface topography for cell adhesion and differentiation. Small. 2009;5(6):666–671. | ||
Oh S, Brammer KS, Li YS, et al. Stem cell fate dictated solely by altered nanotube dimension. Proc Natl Acad Sci U S A. 2009;106(7):2130–2135. | ||
Brammer KS, Oh S, Cobb CJ, Bjursten LM, van der Heyde H, Jin S. Improved bone-forming functionality on diameter-controlled TiO2 nanotube surface. Acta Biomater. 2009;5(8):3215–3223. | ||
Brammer KS, Oh S, Gallagher JO, Jin S. Enhanced cellular mobility guided by TiO2 nanotube surfaces. Nano Lett. 2008;8(3):786–793. | ||
Zhao L, Mei S, Chu PK, Zhang Y, Wu Z. The influence of hierarchical hybrid micro/nano-textured titanium surface with titania nanotubes on osteoblast functions. Biomaterials. 2010;31(19):5072–5082. | ||
Liu X, Li X, Li S, et al. An in vitro study of a titanium surface modified by simvastatin-loaded titania nanotubes-micelles. J Biomed Nanotechnol. 2014;10(2):194–204. | ||
Xiao J, Zhou H, Zhao L, et al. The effect of hierarchical micro/nanosurface titanium implant on osseointegration in ovariectomized sheep. Osteoporos Int. 2011;22(6):1907–1913. | ||
Kubo K, Tsukimura N, Iwasa F, et al. Cellular behavior on TiO2 nanonodular structures in a micro-to-nanoscale hierarchy model. Biomaterials. 2009;30(29):5319–5329. | ||
Li S, Ni J, Liu X, et al. Surface characteristics and biocompatibility of sandblasted and acid-etched titanium surface modified by ultraviolet irradiation: an in vitro study[J]. J Biomed Mater Res B Appl Biomater. 2012;100(6):1587–1598. | ||
Gong DW, Grimes CA, Varghese OK, et al. Titanium oxide nanotube arrays prepared by anodic oxidation. J Mater Res. 2001;16(12):3331–3334. | ||
Ding X, Yang X, Zhou L, et al. Titanate nanowire scaffolds decorated with anatase nanocrystals show good protein adsorption and low cell adhesion capacity. Int J Nanomedicine. 2013;8:569–579. | ||
Yun KD, Park SW, Lee KM, et al. Titanium dioxide nanotube modified implants: an animal study on bone formation. J Nanosci Nanotechnol. 2013;13(6):3864–3867. | ||
Stadlinger B, Bierbaum S, Grimmer S, et al. Increased bone formation around coated implants. J Clin Periodontol. 2009;36(8):698–704. | ||
Coelho PG, Marin C, Granato R, Giro G, Suzuki M, Bonfante EA. Biomechanical and histologic evaluation of non-washed resorbable blasting media and alumina-blasted/acid-etched surfaces. Clin Oral Implants Res. 2012;23(1):132–135. | ||
Cooper LF, Masuda T, Yliheikkila PK, Felton DA. Generalizations regarding the process and phenomenon of osseointegration. Part II. In vitro studies. Int J Oral Maxillofac Implants. 1998;13:163–174. | ||
Masuda T, Yliheikkila PK, Felton DA, Cooper LF. Generalizations regarding the process and phenomenon of osseointegration. Part I. In vivo studies. Int J Oral Maxillofac Implants. 1998;13:17–29. | ||
Wennerberg A, Albrektsson T. On implant surfaces: a review of current knowledge and opinions. Int J Oral Maxillofac Implants. 2010;25:63–74. | ||
Wennerberg A, Albrektsson T. Effects of titanium surface topography on bone integration: a systematic review. Clin Oral Implants Res. 2009;20(suppl 4):172–184. | ||
Mendonca G, Mendonca DB, Aragao FJ, Cooper LF. Advancing dental implant surface technology e from micron- to nanotopography. Biomaterials. 2008;29:3822–3835. | ||
Sato M, Webster TJ. Nanobiotechnology: implications for the future of nanotechnology in orthopedic applications. Expert Rev Med Dev. 2004;1:105–114. | ||
Saito T, Hayashi H, Kameyama T, et al. Suppressed proliferation of mouse osteoblast-like cells by a rough-surfaced substrate leads to low differentiation and mineralization. Mater Sci Eng C. 2010;30:1–7. | ||
Badami AS, Kreke MR, Thompson MS, Riffle JS, Goldstein AS. Effect of fiber diameter on spreading, proliferation, and differentiation of osteoblastic cells on electrospun poly (lactic acid) substrates. Biomaterials. 2006;27(4):596–606. | ||
Biggs MJ, Richards RG, Gadegaard N, Wilkinson CD, Dalby MJ. Regulation of implant surface cell adhesion: characterization and quantification of S◻phase primary osteoblast adhesions on biomimetic nanoscale substrates. J Orthop Res. 2007;25(2):273–282. | ||
Dalby MJ, Biggs MJ, Gadegaard N, Kalna G, Wilkinson CD, Curtis ASG. Nanotopographical stimulation of mechanotransduction and changes in interphase centromere positioning. J Cell Biochem. 2007;100:326–338. | ||
Dalby MJ, Gadegaard N, Herzyk P, et al. Nanomechanotransduction and interphase nuclear organization influence on genomic control. J Cell Biochem. 2007;102:1234–1244. | ||
Puleo DA, Nanci A. Understanding and controlling the bone–implant interface. Biomaterials. 1999;20:2311–2321. | ||
Pilliar RM. Cementless implant fixation – toward improved reliability. Orthop Clin North Am. 2005;36:113–119. |
Supplementary materials
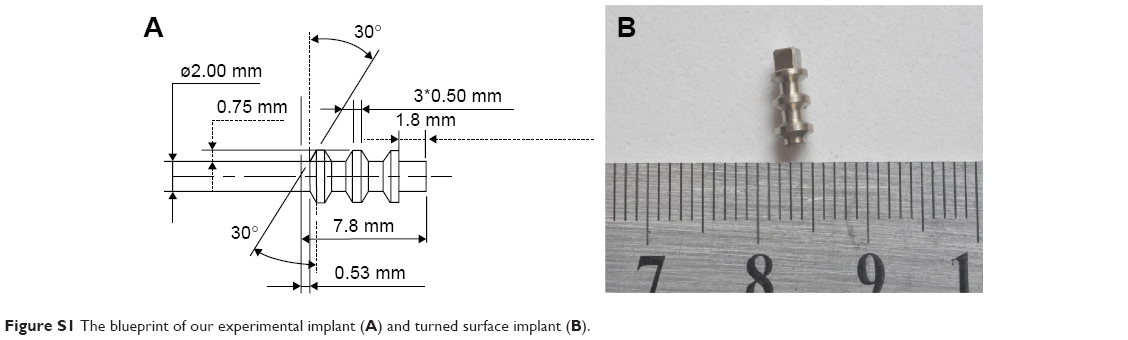 | Figure S1 The blueprint of our experimental implant (A) and turned surface implant (B). |
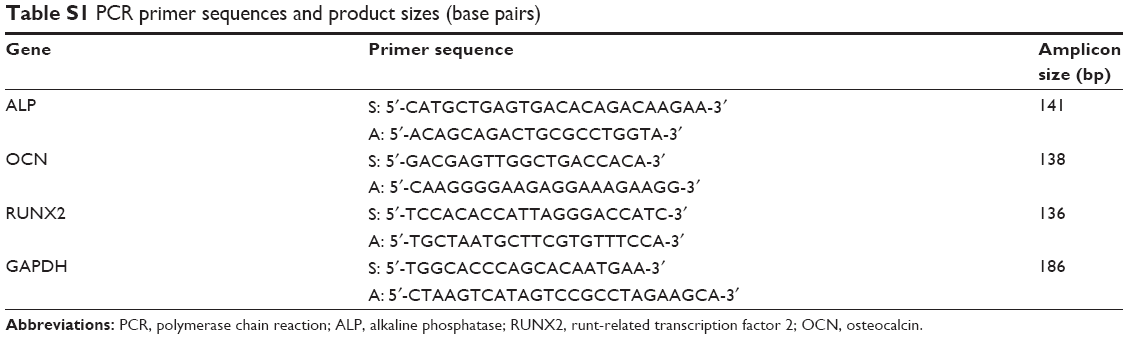 | Table S1 PCR primer sequences and product sizes (base pairs) |
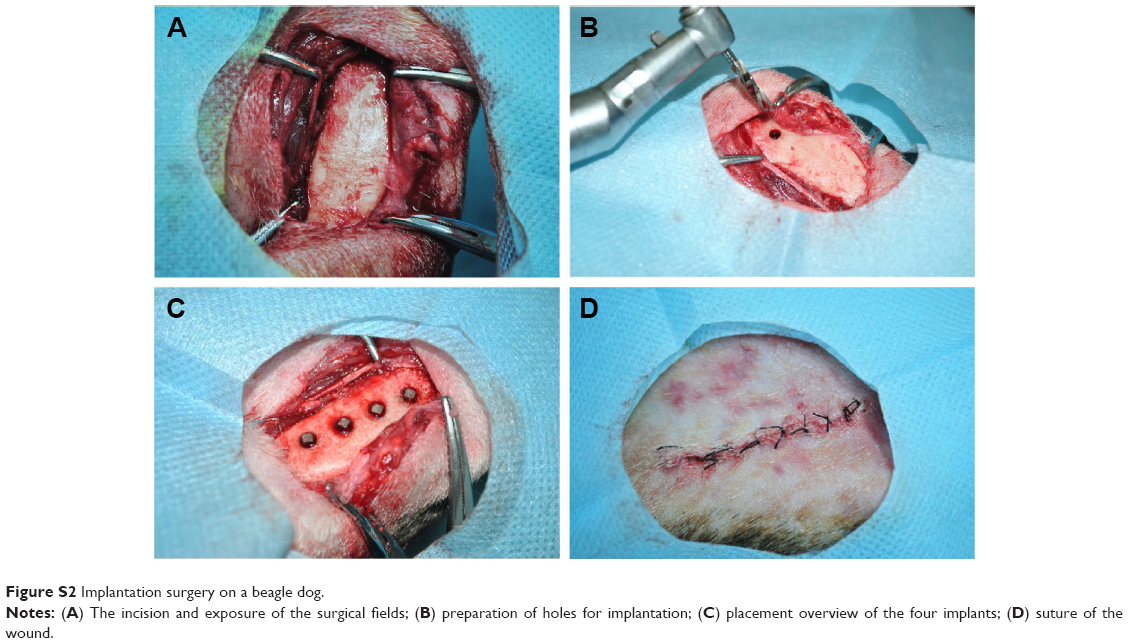 | Figure S2 Implantation surgery on a beagle dog. |
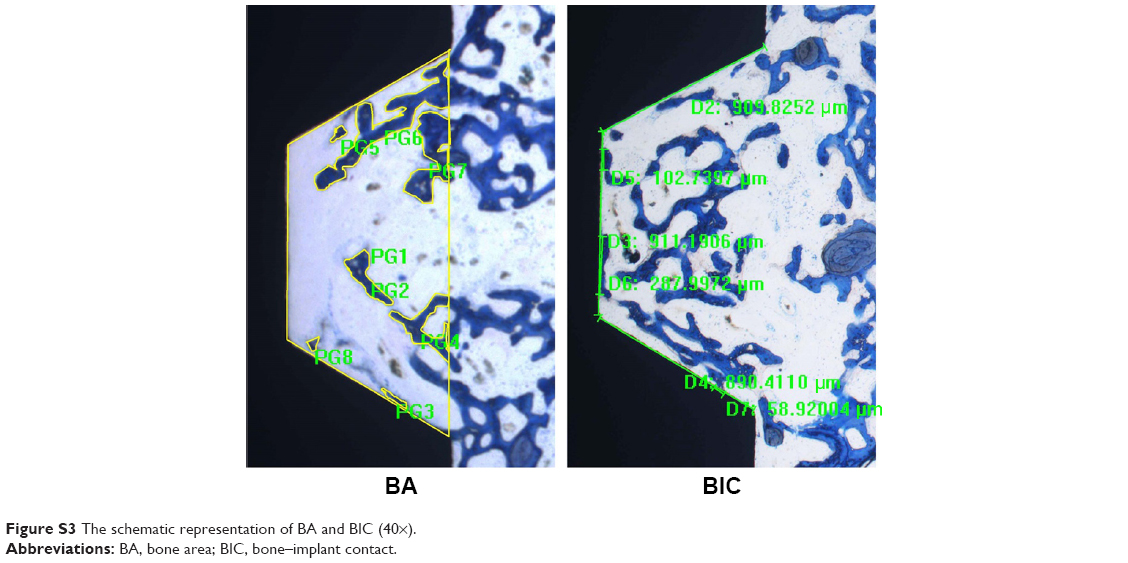 | Figure S3 The schematic representation of BA and BIC (40×). |
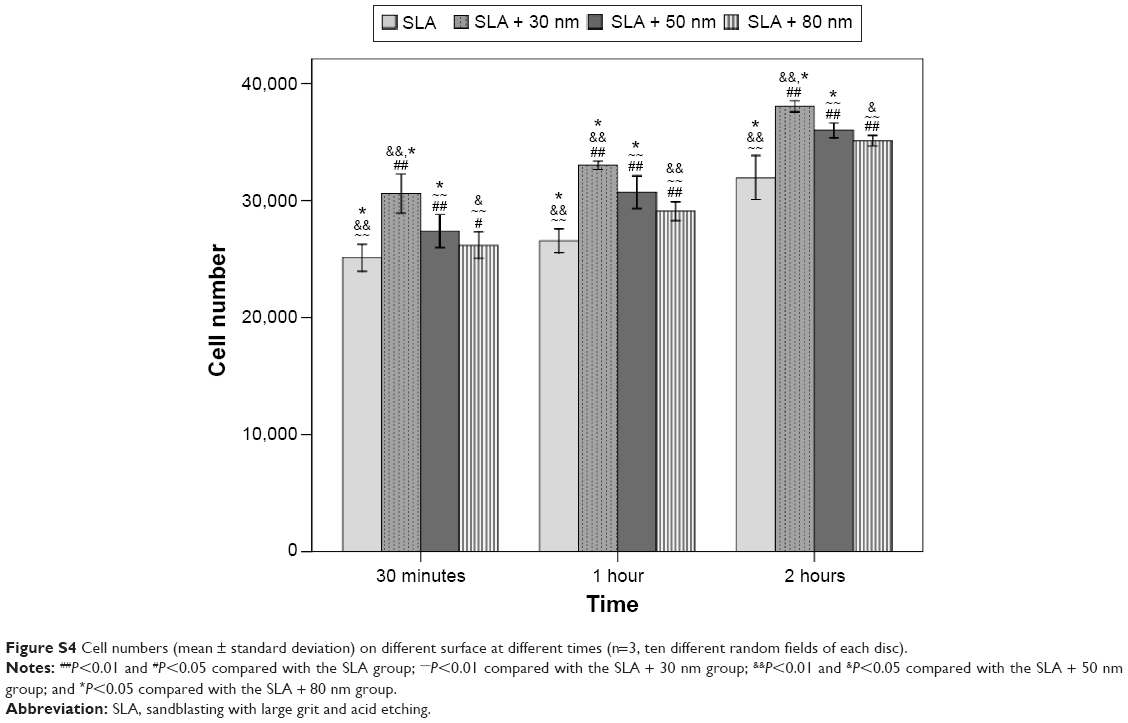 | Figure S4 Cell numbers (mean ± standard deviation) on different surface at different times (n=3, ten different random fields of each disc). |
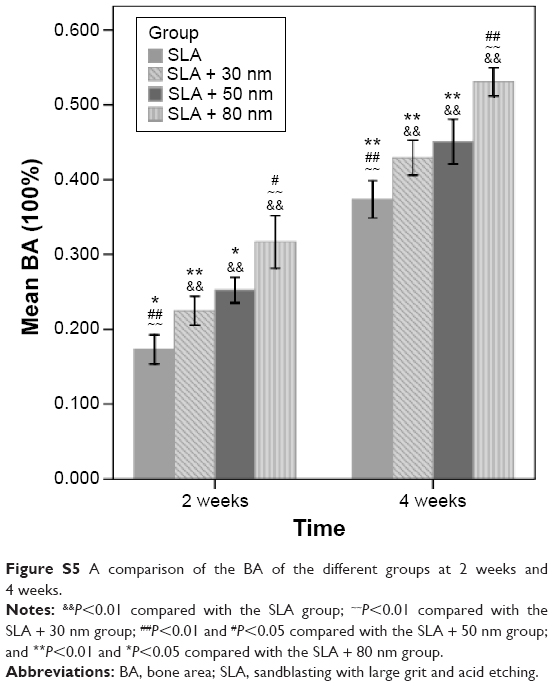 | Figure S5 A comparison of the BA of the different groups at 2 weeks and 4 weeks. |
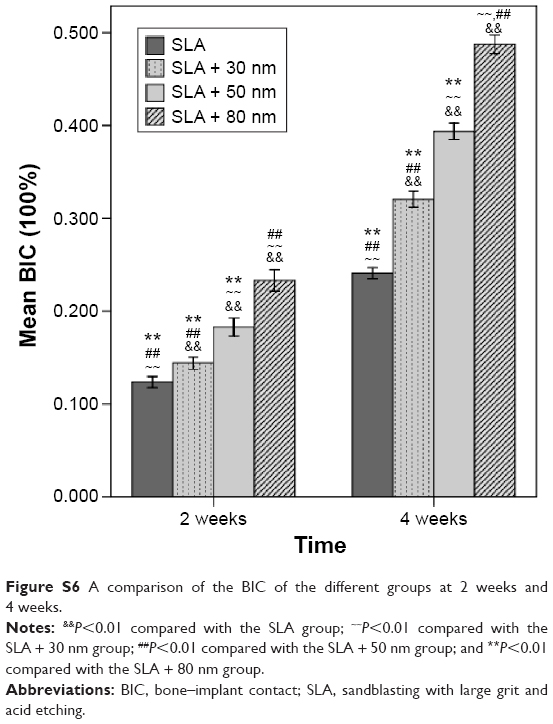 | Figure S6 A comparison of the BIC of the different groups at 2 weeks and 4 weeks. |
 © 2015 The Author(s). This work is published and licensed by Dove Medical Press Limited. The
full terms of this license are available at https://www.dovepress.com/terms.php
and incorporate the Creative Commons Attribution
- Non Commercial (unported, v3.0) License.
By accessing the work you hereby accept the Terms. Non-commercial uses of the work are permitted
without any further permission from Dove Medical Press Limited, provided the work is properly
attributed. For permission for commercial use of this work, please see paragraphs 4.2 and 5 of our Terms.
© 2015 The Author(s). This work is published and licensed by Dove Medical Press Limited. The
full terms of this license are available at https://www.dovepress.com/terms.php
and incorporate the Creative Commons Attribution
- Non Commercial (unported, v3.0) License.
By accessing the work you hereby accept the Terms. Non-commercial uses of the work are permitted
without any further permission from Dove Medical Press Limited, provided the work is properly
attributed. For permission for commercial use of this work, please see paragraphs 4.2 and 5 of our Terms.