")
Back to Journals » International Journal of Nanomedicine » Volume 18
The Effect of Sevoflurane and Fullerenol C 60 on the Liver and Kidney in Lower Extremity Ischemia-Reperfusion Injury in Mice with Streptozocin-Induced Diabetes
Authors Şengel N, Küçük A , Özdemir Ç , Sezen ŞC , Kip G, Er F, Dursun AD , Polat Y, Kavutçu M, Arslan M
Received 23 September 2023
Accepted for publication 30 November 2023
Published 12 December 2023 Volume 2023:18 Pages 7543—7557
DOI https://doi.org/10.2147/IJN.S432924
Checked for plagiarism Yes
Review by Single anonymous peer review
Peer reviewer comments 2
Editor who approved publication: Dr Kamakhya Misra
Necmiye Şengel,1 Ayşegül Küçük,2 Çağrı Özdemir,3 Şaban Cem Sezen,4 Gülay Kip,5 Fatma Er,6 Ali Doğan Dursun,7 Yücel Polat,8 Mustafa Kavutçu,6 Mustafa Arslan5,9,10
1Department of Oral and Maxillofacial Surgery, (As a Specialist in Anesthesiology and Reanimation), Gazi University Faculty of Dentistry, Ankara, Turkey; 2Department of Physiology, Kutahya Health Sciences University Faculty of Medicine, Kutahya, Turkey; 3Department of Anesthesiology and Reanimation, Mamak State Hospital, Ankara, Turkey; 4Department of Histology and Embryology, Kırıkkale University Faculty of Medicine, Kırıkkale, Turkey; 5Department of Anesthesiology and Reanimation, Gazi University Faculty of Medicine, Ankara, Turkey; 6Department of Medical Biochemistry, Gazi University Faculty of Medicine, Ankara, Turkey; 7Department of Physiology, Atılım University Faculty of Medicine, Ankara, Turkey; 8Cardiovascular Surgery, Tekirdağ Dr. Ismail Fehmi Cumalıoğlu City Hospital, Tekirdağ, Turkey; 9Life Sciences Application and Research Center, Gazi University, Ankara, Turkey; 10Laboratory Animal Breeding and Experimental Researches Center (GÜDAM), Gazi University, Ankara, Turkey
Correspondence: Mustafa Arslan, Department of Anesthesiology and Reanimation, Gazi University Faculty of Medicine, Ankara, 06510, Turkey, Tel +90 533 422 85 77, Email [email protected]
Objective: This study aimed to demonstrate whether fullerenol C60, sevoflurane anesthesia, or a combination of both had protective effects on the liver and kidneys in lower extremity ischemia-reperfusion injury (IRI) in mice with streptozocin-induced diabetes.
Methods: A total of 46 Swiss albino mice were divided into six groups as follows: control group (group C, n=7), diabetes group (group D, n=7), diabetes-ischemia/reperfusion (group DIR, n=8), diabetes-ischemia/reperfusion-fullerenol C60 (group DIR-FC60, n=8), diabetes-ischemia/reperfusion-sevoflurane (group DIR-S, n=8), and the diabetes-ischemia/reperfusion-fullerenol C60-sevoflurane (group DIR-S-FC60, n=8). Fullerenol C60 (100mg/kg) was administered intraperitoneally 30 min before the ischemia-reperfusion procedure to the fullerenol groups (DIR-FC60 and DIR-S-FC60). In the DIR groups, 2 hours (h) ischemia-2h reperfusion periods were performed. In the sevoflurane groups, sevoflurane was applied during the ischemia-reperfusion period with 100% O2. Liver and kidney tissues were removed at the end of the reperfusion procedure for biochemical and histopathological examinations.
Results: In liver tissue, hydropic degeneration, sinusoidal dilatation, pycnotic nuclei, prenecrotic cells, and mononuclear cell infiltration in parenchyma were significantly more frequent in group DIR than in groups D and group C. In terms of the histopathologic criteria examined, more positive results were seen in group DIR-FC60, and when group DIR-FC60 was compared with group DIR, the difference was significant. The best results in AST, ALT, glucose, TBARS levels, and SOD enzyme activities in liver tissue were in group DIR-FC60 compared with group DIR, followed by groups DIR-S-FC60 and DIR-S, respectively. Regarding TBARS levels and SOD enzyme activities in kidney tissue, the best results were in groups DIR-FC60, DIR-S-FC60, and DIR-S, respectively.
Conclusion: According to our findings, it is clear that fullerenol C60 administered intraperitoneally 30 min before ischemia, alone or together with sevoflurane, reduces oxidative stress in distant organ damage caused by lower extremity IRI, and reduces liver and kidney tissue damage in histopathologic examinations.
Keywords: lower extremity, ischemia-reperfusion, diabetes, fullerenol C60, sevoflurane, kidney, liver, mice
Introduction
Lower extremity ischemia-reperfusion injury (IRI) may occur in clinical conditions, such as acute arterial occlusion, which may result from thrombosis or embolism,1 traumatic artery injury, and abdominal aortic aneurysm surgery.2 Inhibition of arterial blood flow in ischemia causes tissue hypoxia, mitochondrial electron transport chain dysfunction, and an increase in reactive oxygen species (ROS) that exceeds intracellular antioxidant mechanisms. The decrease in adenosine triphosphate (ATP) production by inducing anaerobic metabolism in mitochondria causes dysfunction of the sodium-potassium pumps (Na+-K+-ATPase pumps) on the cell surface and calcium pumps (Ca2+-ATPase pumps) in the endoplasmic reticulum, retention of Na+ in the cell, and an increase of K+ outside of the cell. Increased Na+ also leads to a decrease in sodium-hydrogen exchanger pump (Na+-H– pump) activity on the cell surface. Na+, H–, and Ca2+ accumulated in the cell cause hyperosmolality and cell swelling with the flow of water into the cell. With anaerobic metabolism, lactic acid increases, and H– accumulation causes metabolic acidosis in the cell. Thus, protein synthesis by the dissociation of ribosomes, cell enzymes, and the nuclear structure is affected. Oxidative stress caused by increased ROS results in endothelial dysfunction, DNA damage, and an increased inflammatory response.3
The basic therapeutic approach for ischemia is revascularization and restoration of blood flow as soon as possible. However, it is known that reperfusion may exacerbate pathogenic processes in ischemic tissue and damage distant organs through mediators released into the systemic circulation by restoring blood flow.4
Diabetes mellitus (DM) is a metabolic disease that can develop with impaired insulin secretion, impaired function of existing insulin in the body, or a combination of both.5 It has become the metabolic disease of our age, brought about by a sedentary lifestyle and obesity. The International Diabetes Federation (IDF) states that approximately 382 million adults in the world have diabetes, the prevalence of diabetes has reached epidemic proportions, and there will be 592 million diabetics by 2035.6
Chronic high blood glucose disrupts homeostasis, triggers an immune response by causing increased oxidant stress, increases microvessel and nerve damage, and causes tissue and organ damage.7 Therefore, IRI effects may be greater in these patients. Especially in this patient group, it is important to develop anti-inflammatory and antioxidant strategies for IRI.
Sevoflurane is a volatile anesthetic commonly used in clinical anesthesia. Various studies have shown that sevoflurane protects organs against damages caused by IRI as a result of its anti-inflammatory and antioxidative effects.8,9
In recent years, the bioactive properties of water-soluble nanomaterials have been the subject of many studies. One of these is fullerene derivatives. The large number of conjugated double pi bonds that can easily take an electron into their structure makes them effective free radical scavengers. In addition, with their hollow spherical shape, they can be used as carriers of contrast agents, radiopharmaceuticals, and drugs, allowing medical diagnosis and treatment applications.10 Previous studies have shown that fullerenol nanoparticles can protect organs from IRI damage caused by oxidative stress through their antioxidative stress activity.11–13
In the aforementioned studies, the effects of fullerenol C60 on tissues where IR was created were evaluated, and in our study, we aimed to contribute to the literature by investigating whether it has a protective effect on distant organ damage.
In the present study, we aimed to investigate whether fullerenol C60, sevoflurane anesthesia, or a combination of both had protective effects on the liver and kidney in lower extremity IRI in mice with streptozocin-induced diabetes.
Materials and Methods
Animals and Experimental Protocol
This experimental study was conducted at the Gazi University Animal Experiments Laboratory in accordance with the ARRIVE guidelines. The study protocol was approved by the Animal Research Committee of the Gazi University (G.Ü.ET—22.088), Ankara, Turkey. All the animals were maintained in accordance with the recommendations of the National Institutes of Health Guidelines for the Care and Use of Laboratory Animals.
Forty-six Swiss albino mice (20–25 g) were used. The mice were kept in daylight for 12 h and dark for 12 h. The environment temperature was adjusted to 20–21°C. The mice were free to access food until 2 h prior to anesthesia. The animals were randomly separated into six groups: control group (group C, n=7), diabetes group (group D, n=7), diabetes-ischemia/reperfusion (group DIR, n=8), diabetes-ischemia/reperfusion-fullerenol C60 (group DIR-FC60, n=8), diabetes-ischemia/reperfusion-sevoflurane (group DIR-S, n=8), and diabetes-ischemia/reperfusion-fullerenol C60-sevoflurane (group DIR-S-FC60, n=8). The groups were set up this way because the ethics committee allowed a maximum number of 46 animals.
To induce diabetes, the mice received a single intraperitoneal (IP) injection of 125 mg/kg of streptozocin (Sigma Chemical, St. Louis, MO, USA). The mice whose fasting blood glucose (FBG) exceeded 250 mg/dL by measuring blood glucose levels 72 h after streptozocin administration were considered diabetic, and animals with FBGs >250 mg/dL were assigned to the diabetic groups (group D, DIR, DIR-FC60, DIR-S). The mice were kept alive for 4 weeks after streptozocin injection, resulting in the development of chronic diabetes. After that, the IR process was applied. Before the experiment, all mice were anesthetized with 50 mg/kg intramuscular ketamine (Ketalar®; 1 mL = 50 mg; Pfizer, Istanbul, Turkey) and 10 mg/kg xylazine hydrochloride (Alfazyne® 2%; Ege Vet, Izmir, Turkey).
Group C and Group D: The mice underwent only midline laparotomy.
Group DIR: Midline laparotomy was performed, followed by a 2-h ischemia period using an atraumatic microvascular clamp in the infrarenal abdominal aorta. Then, the clamp was removed, and a 2-h reperfusion period was administered.
Group DIR-FC60: A midline laparotomy was performed 30 min after fullerenol C60 (Sigma Aldrich®, Fullerene–C60, 98%, 1G) (100 mg/kg) was administered intraperitoneally. IR was applied as in Group DIR.
Group DIR-S: IR was applied as in Group DIR. Sevoflurane was given during the IR period with 100% O2. Sevoflurane was administered for the target minimum alveolar concentration (MAC) 1, with a 2.3% concentration (Sevorane; AbbVie, Maidenhead, UK), at 4 L/min in a 40×40×70 cm transparent plastic box. The box was integrated into a semi-open anesthesia device using static hoses.
Group DIR-S-FC60: A midline laparotomy was performed 30 min after fullerenol C60 (100 mg/kg) was administered; that is, sevoflurane was administered in the same manner throughout the IR period.
To avoid hypovolemia, an hourly 3 mL/kg IP isotonic solution was administered. During the IR period, the abdomen was covered with a moistened sterile pad.
At the end of the experiment, liver and kidney tissue samples were taken from all mice for biochemical and histopathologic evaluations. At the end of the 2-h reperfusion period, all mice were sacrificed by taking blood from the abdominal aorta after intramuscular administration of ketamine (50 mg/kg). After the heartbeat and respiration ceased, the mice were monitored for a further 2 min to confirm death.
Biochemical Analysis
Tissue blood samples were taken into blood collection tubes and centrifuged. Aspartate amino transaminase (AST), alanine amino transaminase (ALT), and serum glucose levels were measured using the Abbott Architect c16000 autoanalyzer.
Liver and kidney tissues were washed with cold deionized water to purify them of blood pollution and then homogenized in a homogenizer. Thiobarbituric acid reactive substance (TBARS) analyses were performed to determine lipid peroxidation using the thiobarbituric acid method.14 The results were expressed in nmol/mg protein.
Superoxide dismutase (SOD) activity was measured using the method of Durak et al.15 The results were expressed in U/mg protein.
Histopathologic Analysis
After fixation, the muscle specimens were embedded in paraffin following routine tissue processing. Sections of 4-µm thickness were cut from paraffin blocks using a microtome (Leica RM2245, Germany) and stained with hematoxylin and eosin (H&E) for the evaluation of histopathologic changes. The histopathological assessments were performed under light microscopy at a magnification of x100 (Nikon Corporation, Tokyo, Japan). Liver and kidney tissues were evaluated as in our previous studies.16,17
Statistical Analysis
IBM SPSS Statistics for Social Sciences (IBM, Armonk, NY, USA) ver. 20.0 was used for statistical analysis. Each categorical variable was analyzed using the Kolmogorov–Smirnov test. Biochemical and histopathological parameters were tested using the Kruskal–Wallis test, Bonferroni correction test, and the Mann–Whitney U-test. A statistical value of less than 0.05 was considered significant. All values are expressed as mean ± standard error (SE).
Results
Liver Tissue Histopathological Results
Hydropic degeneration, sinusoidal dilatation, pycnotic nuclei, necrosis, and parenchymal mononuclear cell infiltration were found to be significantly different between the groups (p = 0.001, p = 0.039, p = 0.003, p = 0.014, and p = 0.042, respectively) (Table 1).
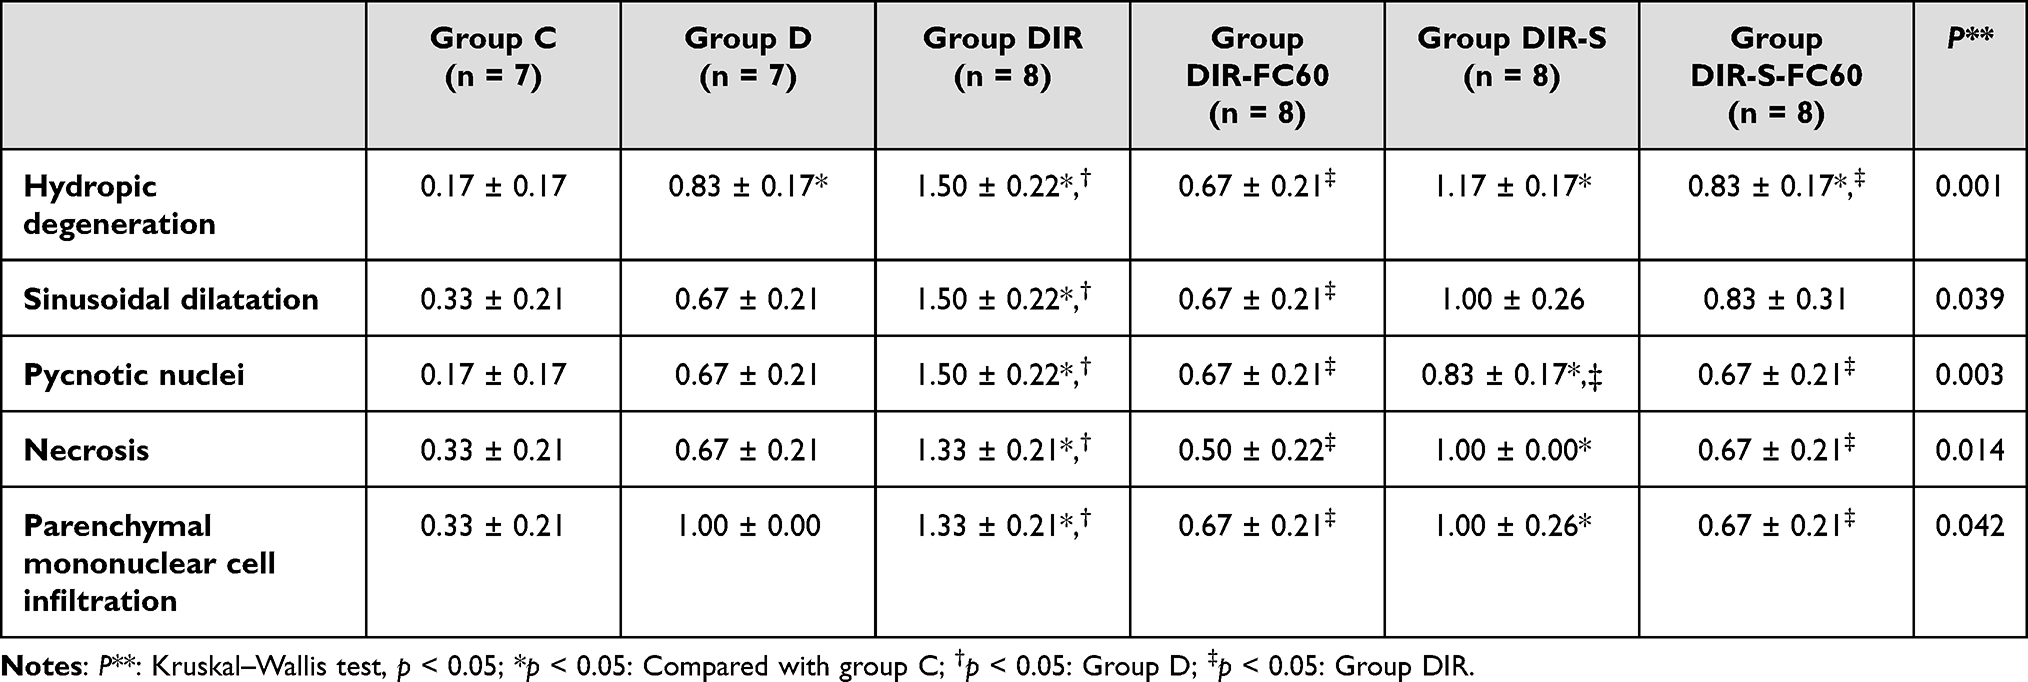 |
Table 1 Histopathologic Data of Hepatic Tissue (Mean ± SE) |
Hydropic degeneration is more common in groups D, DIR, DIR-S, and DIR-S-FC60 than in the control group (p = 0.035, p < 0.001, p < 0.001, and p = 0.035, respectively). Additionally, hydropic degeneration was more common in group DIR than in group D (p = 0.035). Significantly less hydropic degeneration was found in the DIR-FC60 and DIR-S-FC60 groups than in the DIR group (p = 0.010 and p = 0.035, respectively) (Table 1, Figures 1–6).
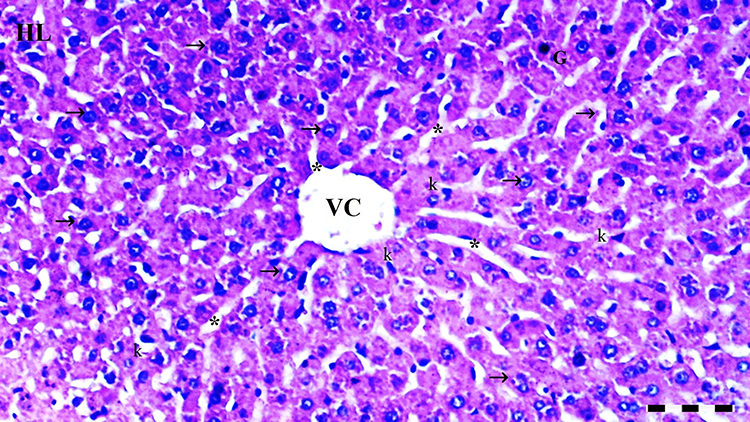 |
Figure 1 Representative light microscopy of hepatic tissue from the control group. Normal liver tissue. Scale bar 50 µm, H&Ex100. Abbreviations: HL, hepatic lobule; VC, vena centralis; k, Kupffer cells; *, sinusoid dilatation; →, hepatocyte; G, glycogen granules. |
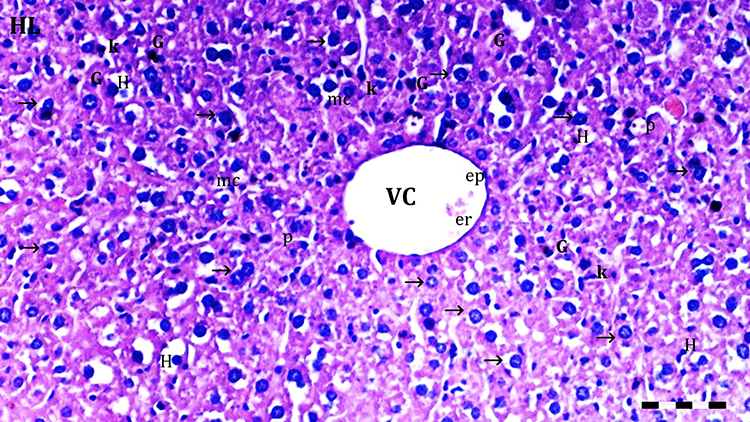 |
Figure 2 Representative light microscopy of hepatic tissue from the D group. Scale bar 50 µm, H&Ex100. Abbreviations: HL, hepatic lobule; VC, vena centralis; er, erythrocyte; →, hepatocyte; mc, minimal cellular changes; ep, epithelium; G, glycogen granules; p, pycnotic and hyperchromatic nuclei; H, hepatocyte degeneration. |
 |
Figure 3 Representative light microscopy of hepatic tissue from DIR group. Scale bar 50 µm, H&Ex100. Abbreviations: HL, hepatic lobules; VC, vena centralis; er, erythrocyte; inf, inflammation; *, sinusoid dilatation; →, hepatocyte; mc, minimal cellular changes; ep, epithelium; G, glycogen granules; p, pycnotic and hyperchromatic nuclei; H, hepatocyte degeneration; (*), necrotic and apoptotic hepatocyte; nec, necrotic and apoptotic species; v, vacuolation. |
 |
Figure 4 Representative light microscopy of hepatic tissue from DIR-FC60 group. Scale bar 50 µm, H&Ex100. Abbreviations: HL, hepatic lobules; VC, vena centralis; er, erythrocyte; inf, inflammation; *, sinusoid dilatation; →, hepatocyte; H, hepatocyte degeneration; (*), necrotic and apoptotic hepatocyte; dej, hydrophilic degeneration; v, vacuolation. |
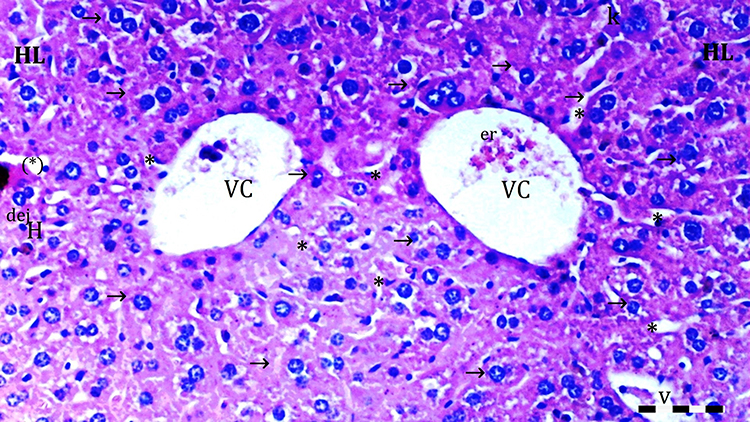 |
Figure 5 Representative light microscopy of hepatic tissue from DIR-S group. Scale bar 50 µm, H&Ex100. Abbreviations: HL, hepatic lobules; VC, vena centralis; er, erythrocyte; inf, inflammation; *, sinusoid dilatation; →, hepatocyte; H, hepatocyte degeneration; (*), necrotic and apoptotic hepatocyte; dej, hydrophilic degeneration; v, vacuolation. |
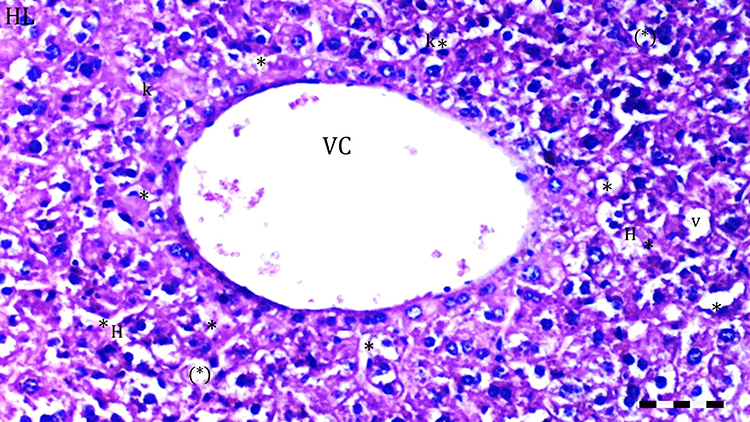 |
Figure 6 Representative light microscopy of hepatic tissue from DIR-S-FC60 group. Scale bar 50 µm, H&Ex100. Abbreviations: HL, hepatic lobules; VC, vena centralis; *, sinusoid dilatation; →, hepatocyte; H, hepatocyte degeneration; (*), necrotic and apoptotic hepatocyte; v, vacuolation. |
Sinusoidal dilatation was more common in group DIR than in the control group and group D (p = 0.001 and p = 0.016, respectively). Significantly less sinusoidal dilatation was found in group DIR-FC60 than in group DIR (p = 0.016) (Table 1, Figures 1–6).
Pycnotic nuclei were more common in groups DIR and DIR-S than in the control group (p < 0.001 and p = 0.008, respectively). Additionally, pycnotic nuclei were more common in group DIR than in group D (p = 0.008). Significantly fewer pycnotic nuclei were found in groups DIR-FC60 and DIR-S-FC60 than in group DIR (p = 0.008 and p = 0.008, respectively). Pycnotic nuclei rates were found to be similar between groups DIR-FC60 and DIR-S-FC60 (p = 0.999) (Table 1, Figures 1–6).
Necrosis was more common in the DIR and DIRS groups than in the control group (p = 0.002 and p = 0.008, respectively). Additionally, necrosis was more common in group DIR than in group D (p = 0.030). Significantly less necrosis was found in groups DIR-FC60 and DIR-S-FC60 than in group DIR (p = 0.008 and p = 0.030, respectively). Necrosis was found to be similar between groups DIR-FC60 and DIR-S-FC60 (p = 0.572) (Table 1, Figures 1–6).
Parenchymal mononuclear cell infiltration was more common in groups DIR and DIR-S than in the control group (p = 0.002 and p = 0.035, respectively). Additionally, parenchymal mononuclear cell infiltration was more common in group DIR than in group D (p = 0.035). Significantly less parenchymal mononuclear cell infiltration was seen in groups DIR-FC60 and DIR-S-FC60 than in group DIR (p = 0.010 and p = 0.010, respectively). Parenchymal mononuclear cell infiltration was found to be similar between groups DIR-FC60 and DIR-S-FC60 (p = 0.999) (Table 1, Figures 1–6).
Kidney Tissue Histopathologic Results
Under the light microscope, glomerular vacuolization (GV), tubular dilatation (TD), vascular vacuolization and hypertrophy (VVH), tubular cell degeneration and necrosis (TCDN), Bowman space dilatation (BSD), tubular hyaline cylinders (THC), lymphocyte infiltration (LI), and tubular cell shedding (TCS) levels were found to be significantly different between the groups (p = 0.009, p = 0.012, p = 0.034, p = 0.018, p = 0.005, p = 0.004, p = 0.014, and p = 0.042, respectively). GV was seen more in groups DIR, DIR-S, and DIR-S-FC60 than in the control group (p < 0.001, p = 0.008, and p = 0.031, respectively). Similarly, GV was seen more in group DIR than in group D (p = 0.043). GV was found to be significantly less in group DIR than in group DIR-FC60 (p = 0.008) (Table 2, Figures 7–12).
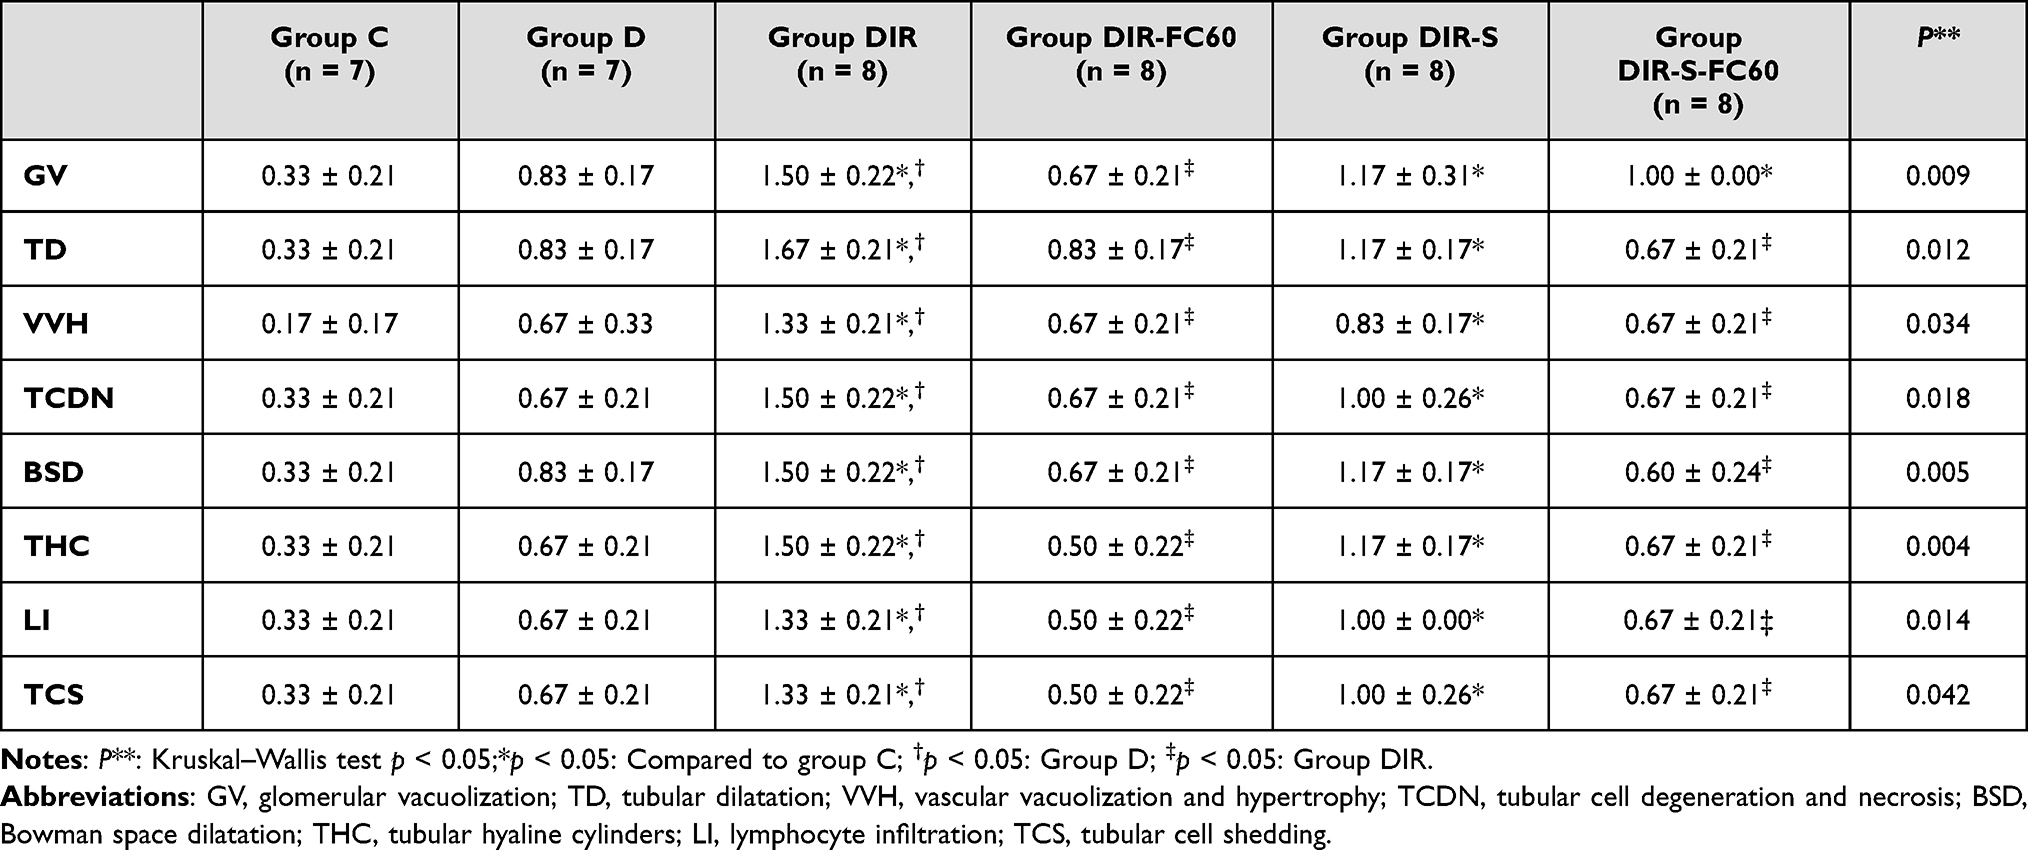 |
Table 2 Histopathologic Data of Kidney Tissue (Mean± SE) |
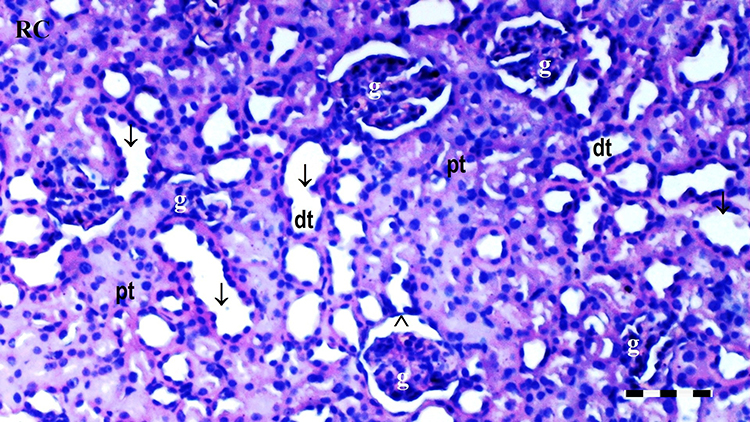 |
Figure 7 Representative light microscopy of kidney tissue from the control group. Normal kidney tissue. Scale bar 50 µm, H&Ex100. Abbreviations: RC, renal cortex; pt, proximal tubule; dt, distal tubule; g, glomerulus; ↓, dilate tubules. |
 |
Figure 8 Representative light microscopy of kidney tissue from the diabetes group. Scale bar 50 µm, H&Ex100. Abbreviations: RC, renal cortex; pt, proximal tubule; dt, distal tubule; g, glomerulus; ↓, dilate tubules; m, macula densa; inf, inflammation; *, degenerated glomeruli; ^, Bowman space; v, vacuolation. |
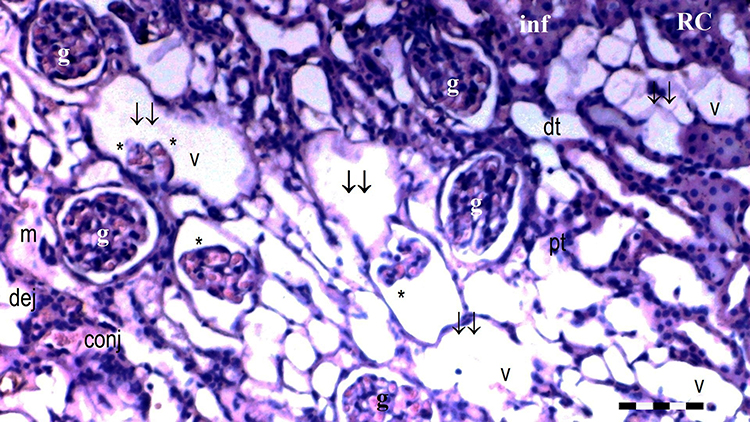 |
Figure 9 Representative light microscopy of kidney tissue from DIR group. Scale bar 50 µm, H&Ex100. Abbreviations: RC, renal cortex; pt, proximal tubule; dt, distal tubule; g, glomerulus; ↓, dilate tubules; m, macula densa; inf, inflammation; *, degenerated glomeruli; ^, Bowman space; v, vacuolation; dej, hydrophilic degeneration; conj, capillary/vascular congestion. |
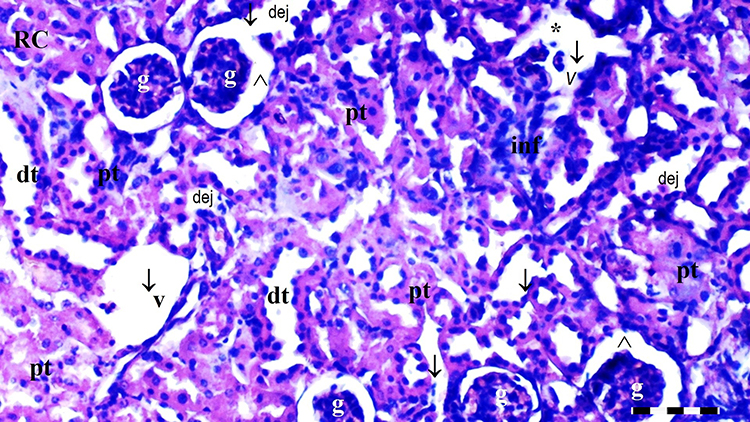 |
Figure 10 Representative light microscopy of kidney tissue from the DIR-FC60 group. Scale bar 50 µm, H&Ex100. Abbreviations: RC, renal cortex; pt, proximal tubule; dt, distal tubule; g, glomerulus; ↓, dilate tubules; m, macula densa; inf, inflammation; *, degenerated glomeruli; ^, Bowman space; v, vacuolation; dej, hydrophilic degeneration. |
 |
Figure 11 Representative light microscopy of kidney tissue from the DIR-S group. Scale bar 50 µm, H&Ex100. Abbreviations: RC, renal cortex; pt, proximal tubule; dt, distal tubule; g, glomerulus; ↓, dilate tubules; m, macula densa; inf, inflammation; *, degenerated glomeruli; ^, Bowman space; v, vacuolation. |
 |
Figure 12 Representative light microscopy of kidney tissue from the DIR-S-FC60 group. Scale bar 50 µm, H&Ex100. Abbreviations: RC, renal cortex; pt, proximal tubule; dt, distal tubule; g, glomerulus; ↓, dilate tubules; m, macula densa; inf, inflammation; *, degenerated glomeruli; ^, Bowman space; v, vacuolation; dej, hydrophilic degeneration. |
TD was seen more in groups DIR and DIR-S than in the control group (p < 0.001 and p = 0.021, respectively). In addition, TD was more common in the DIR group than in group D (p = 0.021). There was significantly less TD in groups DIR-FC60 and DIR-S-FC60 than in group DIR (p = 0.021 and p = 0.006, respectively) (Table 2, Figures 7–12).
VVH was more common in the DIR and DIRS groups than in the control group (p = 0.001 and p = 0.043, respectively). Similarly, VVH was seen more in group DIR than in group D (p = 0.043). In addition, significantly less VVH was seen in groups DIR-FC60 and DIR-S-FC60 than in group DIR (p = 0.043 and p = 0.043, respectively) (Table 2, Figures 7–12).
TCDN was more common in groups DIR and DIR-S compared with the control group (p = 0.001 and p = 0.042, respectively). Similarly, TCDN was higher in group DIR than in group D (p = 0.012). In addition, significantly less TCDN was observed in groups DIR-FC60 and DIR-S-FC60 than in group DIR (p = 0.012 and p = 0.012, respectively) (Table 2, Figures 7–12).
BSD was seen more in groups DIR and DIR-S than in the control group (p < 0.001 and p = 0.007, respectively). Similarly, BSD was more common in group DIR than in group D (p = 0.026). In addition, significantly less BSD was seen in the DIR-FC60 and DIR-S-FC60 groups than in group DIR (p = 0.007 and p = 0.005, respectively) (Table 2, Figures 7–12).
THC was more common in groups DIR and DIR-S than in the control group (p < 0.001 and p = 0.008, respectively). Similarly, THC was more frequent in group DIR than in group D (p = 0.002). In addition, there was significantly less THC in groups DIR-FC60 and DIR-S-FC60 than in group DIR (p = 0.002 and p = 0.008, respectively) (Table 2, Figures 7–12).
LI was more common in the DIR and DIR-S groups than in the control group (p = 0.001 and p = 0.022, respectively). Similarly, LI was seen more frequently in group DIR than in group D (p = 0.022). In addition, significantly less LI was seen in groups DIR-FC60 and DIR-S-FC60 than in group DIR (p = 0.005 and p = 0.022, respectively) (Table 2, Figures 7–12).
TCS was more common in the DIR and DIR-S groups than in the control group (p = 0.003 and p = 0.042, respectively). Similarly, TCS was seen at a higher rate in group DIR than in group D (p = 0.042). In addition, significantly less TCS was observed in the DIR-FC60 and DIR-S-FC60 groups than in the DIR group (p = 0.042 and p = 0.042, respectively) (Table 2, Figures 7–12).
Biochemical Results
Liver tissue TBARS levels and SOD enzyme activities showed a significant difference between the groups (p < 0.001 and p < 0.001, respectively). The TBARS level was found to be significantly higher in all groups compared with control group (p = 0.012, p < 0.001, p = 0.007, p < 0.001, and p < 0.001, respectively). Similarly, TBARS levels were found to be significantly higher in the DIR, DIR-S, and DIR-S-FC60 groups compared with group D (p < 0.001, p < 0.001, and p = 0.022, respectively). In addition, TBARS levels were found to be significantly lower in groups DIR-FC60, DIR-S, and DIR-S-FC60 compared with group DIR (p < 0.001 for all) (Table 3).
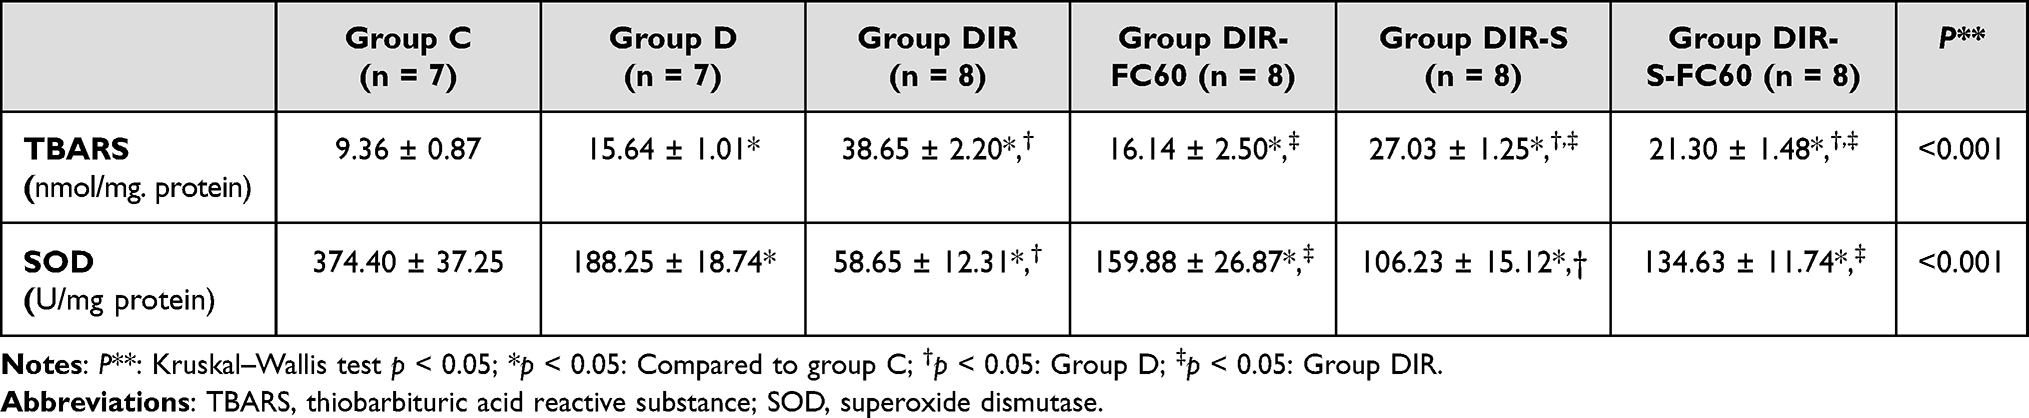 |
Table 3 Liver Tissue Oxidant Status Parameter (Mean ± SE) |
SOD enzyme activity was found to be significantly lower in all groups compared with control group (p < 0.001 for all). Similarly, SOD enzyme activity was found to be significantly lower in groups DIR and DIR-S compared with group D (p = 0.001 and p = 0.035, respectively). In addition, SOD enzyme activity was found to be significantly higher in groups DIR-FC60 and DIR-S-FC60 compared with group DIR (p = 0.010 and p = 0.049, respectively) (Table 3).
For blood glucose levels, there was a significant difference between the groups (p < 0.001). The blood glucose level was found to be significantly higher in all groups compared with control group (p < 0.001 for all). Similarly, it was found to be significantly higher in group DIR than in group D (p = 0.001). In addition, blood glucose levels were found to be significantly lower in groups DIR-FC60, DIR-S, and DIR-S-FC60 compared with group DIR (p < 0.001, p = 0.008, and p < 0.001, respectively) (Table 4).
 |
Table 4 Blood Glucose, AST, and ALT Data (Mean± SE) |
When serum AST and ALT values were compared, there was a significant difference between the groups (p < 0.001 and p < 0.001, respectively). AST levels were found to be significantly higher in groups DIR, DIR-S, and DIR-S-FC60 compared with control group (p < 0.001, p < 0.001, and p = 0.036, respectively). Similarly, AST levels were found to be significantly higher in the DIR and DIR-S groups compared with group D (p < 0.001 and p = 0.001, respectively). In addition, AST levels were found to be significantly lower in groups DIR-FC60, DIR-S, and DIR-S-FC60 compared with group DIR (p < 0.001, p = 0.002, and p < 0.001, respectively) (Table 4).
ALT levels were found to be significantly higher in groups DIR, DIR-FC60, DIR-S, and DIR-S-FC60 compared with control group (p < 0.001, p = 0.002, p < 0.001, and p = 0.001, respectively). Similarly, ALT levels were found to be significantly higher in groups DIR, DIR-S, and DIR-S-FC60 compared with group D (p < 0.001, p = 0.001, and p = 0.019, respectively). In addition, ALT levels were found to be significantly lower in groups DIR-FC60, DIR-S, and DIR-S-FC60 compared with group DIR (p < 0.001, for all) (Table 4).
Kidney tissue TBARS levels, and SOD enzyme activities showed a significant difference between the groups (p < 0.001 and p < 0.001, respectively). TBARS levels were found to be significantly higher in all groups compared with control group (p = 0.039, p < 0.001, p = 0.007, p < 0.001, and p < 0.001, respectively). Similarly, TBARS levels were found to be significantly higher in groups DIR, DIR-S, and DIR-S-FC60 compared with group D (p < 0.001, p < 0.001, and p = 0.030, respectively). In addition, TBARS levels were found to be significantly lower in groups DIR-FC60, DIR-S, and DIR-S-FC60 compared with group DIR (p < 0.001 for all) (Table 5).
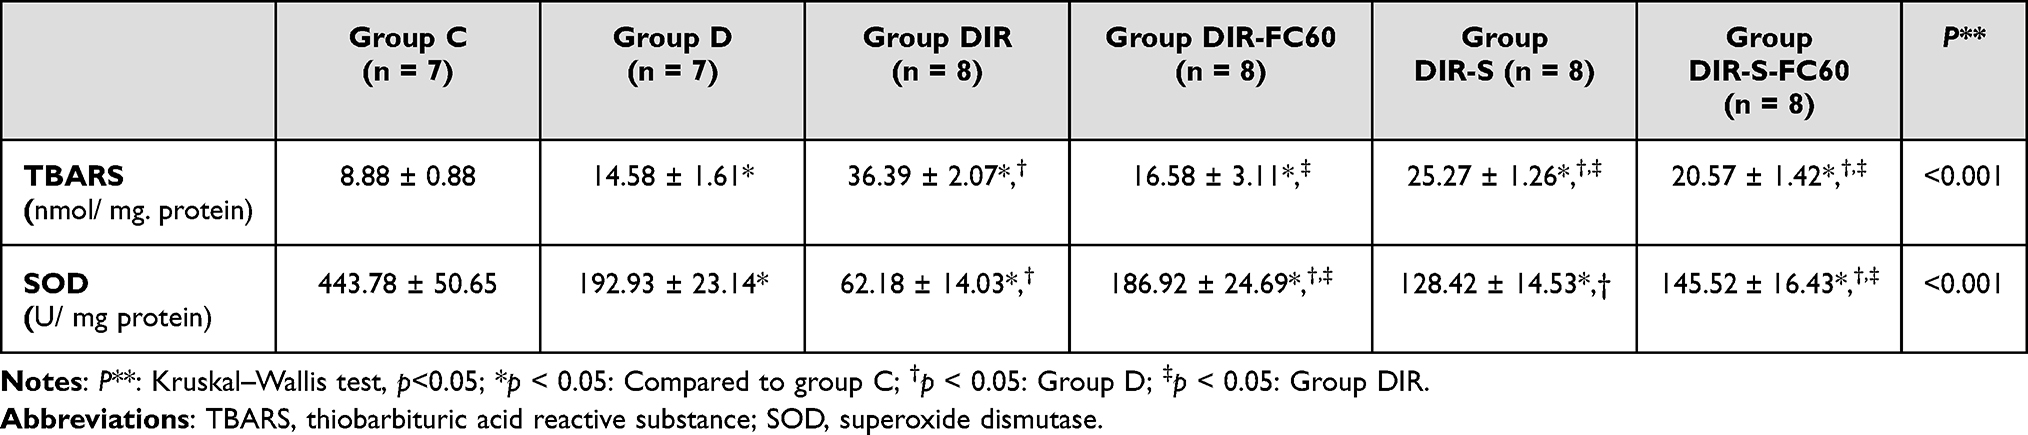 |
Table 5 Kidney Tissue Oxidant Status Parameter (Mean± SE) |
SOD enzyme activity was found to be significantly lower in all groups compared with control group (p < 0.001 for all). Similarly, SOD enzyme activity was found to be significantly lower in group DIR than in group D (p = 0.002). In addition, SOD enzyme activity was found to be significantly higher in groups DIR-FC60 and DIR-S-FC60 compared with group DIR (p = 0.003 and p = 0.037, respectively) (Table 5).
Discussion
In our study of diabetic mice, it was clear that fullerenol C60 administered IP 30 min before ischemia, alone or together with sevoflurane, reduced oxidative stress in distant organ damage caused by lower extremity IRI, reducing liver and kidney tissue damage in histopathologic examination.
IRI is a challenging clinical situation for physicians. Increased oxidative stress, lipid peroxidation, and ROS play roles in IRI.18 It is known that the IRI has negative effects on the affected organ and distant organs, such as the lung, liver, and kidney.19–21 In diabetes, mitochondrial dysfunction due to hyperglycemia causes excessive ROS production, which in turn causes an increased inflammatory response with excessive cytokine production.22 Therefore, strategies to reduce IRI damage are the subject of many studies and have become even more important in diabetes. For this reason, we used mice with streptozocin-induced diabetes to determine the effects of fullerenol and sevoflurane. Two different methods can be chosen to create streptozocin-induced diabetic models in mice. One of these is to use repeated low doses of streptozocin. Animals are given multiple low doses of streptozocin over 5 days. In this way, exposure to the toxic effects of the drug is reduced, and the onset of hyperglycemia is delayed. Another is the use of a single, high dose of streptozocin within 48 h and enables a rapid diabetes model with complete β-cell necrosis within 48 h.23,24 In our study, we preferred to use a single high dose of streptozocin (125 mg/kg single IP injection) in order to get rapid results. We did not experience any animal loss.
In our results, we saw that TBARS levels were higher and SOD enzyme activities were lower in the liver and kidney tissues in the diabetes group compared with the control group, and the difference was significant.
Liver tissue plays an important role in the body’s metabolism, detoxification, regulation of immunity, redox balance, and the production of glutathione, an important endogenous antioxidant.25 Potentiation of liver antioxidant capacity may help protect against liver damage caused by increased ROS in IRI. When acute kidney injury (AKI) occurs, supportive treatment becomes important, and the limited therapeutic approach to preventing or treating its occurrence increases the importance of preventive treatments.26,27 New preventive approaches to the prevention of distant organ effects of IRI are the subject of much research. However, very few studies have investigated fullerenol and the distant organ effects of IRI.
Sevoflurane is mainly used in clinical anesthesia, and positive effects on liver and kidney tissue have been reported in IRI due to its anti-inflammatory and anti-oxidant effects. Zhang et al used a liver IR model on rats. In the group that was administered sevoflurane for 30 min after reperfusion, there were decreased AST, ALT, MDA, nitric oxide (NO), TNF-α, IL-1β, and IL 6 levels, increased IL-10 levels and SOD enzyme activities, and decreased hepatocyte apoptosis. The authors stated that they achieved this by increasing the expression of HO–1, supporting the transport of Nrf2 from the cytoplasm to the nucleus, and decreasing the expression of miR-122 and p53.28 Wang et al reported that sevoflurane preconditioning reduced IR-induced hepatocyte apoptosis, hepatic inflammation, and the serum levels of GST, ALT, and AST. They stated that this might be related to the inhibition of the IR-mediated down-regulation of miR-124-3p.29 In another study, sevoflurane preconditioning was observed to decrease MDA and MPO levels and increase SOD and CAT activity in a kidney IR mouse model. It has been stated that this is due to the upregulation of Nrf2 expression.30
We observed an increase in AST and ALT levels in the streptozocin-treated group D, which was also shown in previous studies,31,32 and the difference was not significant compared with the control group. When we looked at the other groups, the best results in terms of AST, ALT, and glucose levels in the groups in which fullerenol C60 was applied were in group DIR-FC60, followed by groups DIR-S-FC60 and DIR-S, respectively.
Lipid peroxidation in the liver tissue was measured using a spectrophotometric assessment of TBARS.33 SOD is an enzyme that prevents the formation of OH radicals by catalyzing the conversion of superoxide (O2–) radicals to molecular oxygen (O2) or hydrogen peroxide (H2O2). It is an important antioxidant enzyme.34 In our study, the best results for TBARS levels and SOD enzyme activities in liver tissue were in group DIR-FC60 compared with group DIR, followed by groups DIR-S-FC60 and DIR-S, respectively. Although we achieved better results in group DIR-S, the difference was not significant compared with group DIR. These results seem to be compatible with histopathological liver tissue results. Hydropic degeneration, sinusoidal dilatation, pycnotic nucleus, prenecrotic cell, and mononuclear cell infiltration in the parenchyma also showed more positive results in group DIR-FC60. It may be concluded that the use of fullerenol together with sevoflurane increases the positive results compared with sevoflurane used alone.
Yavuz et al stated that in the hepatic IRI model they used on rats, the best TBARS, CAT, and GST results were in the group in which they used 100 mg/kg fullerenol, in the group in which they gave fullorenol-sevoflurane, and in the group in which they administered sevoflurane, respectively. They stated that histopathologic results were better in all three groups compared with the IR group and that fullorenol improved histopathologic results with its antioxidative effect.12 We found similar results.
Xu et al investigated the potential hepatoprotective and nephroprotective effects of fullerenol in carbon tetrachloride (CCl4)-induced hepatotoxicity–nephrotoxicity to examine oxidative stress-involved damage in rats. They found that pretreatment with fullerenol could improve serum marker levels and histopathological results by increasing antioxidant capacity.35 Şıvgın et al found that, in sevoflurane-administered rats, pretreatment with 100 mg/kg IP fullerenol before sevoflurane anesthesia decreased MDA levels and CAT enzyme activity. They showed that it reduced oxidative stress by increasing paraoxonase (PON) levels and effectively reducing histopathological kidney damage.36
In our study, when we looked at the TBARS levels and SOD enzyme activities in the kidney tissue, the best results were in groups DIR-FC60, DIR-S-FC60, and DIR-S, respectively. In terms of TBARS, the difference between all three groups and the DIR group was significant. For SOD, the difference between groups DIR-FC60 and DIR-S-FC60 was significant compared with group DIR. Again, in our histopathologic results, there was a significant difference in groups DIR-FC60 and DIR-S-FC60 in terms of GV, TD, VVH, TCDN, BSD, THC, LI, and TCS compared with the DIR group. More positive results were found in group DIR-S compared with group DIR.
In one study, the effects of fullerenol in the prevention of hepatotoxicity induced by a single high dose of doxorubicin (10 mg/kg IP) were investigated in rats, and fullerenol 50 mg/kg and fullerenol 100 mg/kg IP were administered 30 min before doxorubicin administration. Positive results were obtained in both groups in terms of the activity of catalase, superoxide dismutase, glutathione peroxidase, and glutathione reductase, and they stated that fullerenol 100 mg/kg IP significantly reduced the lipid peroxidation process and the degenerative and vascular changes caused by doxorubicin.37 Srdjenovic et al investigated the efficacy of 100 and 50 mg/kg IP fullerenol C60 administration 30 min before 10 mg/kg IP doxorubicin administration showed that 100 mg/kg fullerenol inhibited oxidative stress in rat kidneys, testicles, and lungs.38 Based on previous studies, we decided on the application route and dose of fullerenol C60.
Our study has some limitations. There were a small number of animals in each group, and we did not measure hemodynamic parameters such as arterial blood pressure or pulse.
Based on these findings, it can be concluded that fullerenol C60 administered at a dose of 100 mg/kg IP alone or in combination with sevoflurane anesthesia significantly attenuated the negative effects of lower extremity IR on distant organs, the liver, and the kidneys in diabetic mice by arranging lipid peroxidation levels and antioxidative enzyme activity. Due to its antioxidant activity, hepatoprotective and nephroprotective effects were also observed histopathologically in liver and kidney tissue. These results will become even more important in diabetics who are exposed to chronic oxidative stress. Nanoparticles, especially fullerenol C60, will continue to be the subject of many studies in the future on IRI and on preventing the negative effects of IRI in distant organs.
Acknowledgments
This study was supported by the Gazi University BAP coordination unit within the scope of this project numbered TCD-2022-8210.
Disclosure
The authors report no conflicts of interest in this work.
References
1. Apichartpiyakul P, Shinlapawittayatorn K, Rerkasem K, Chattipakorn SC, Chattipakorn N, Mai C. Mechanisms and interventions on acute lower limb ischemia/reperfusion injury: a review and insights from cell to clinical investigations. Ann Vasc Surg. 2022;86:452–481. doi:10.1016/j.avsg.2022.04.040
2. Kao MC, Yang CH, Chou WC, Sheu JR, Huang CH. Cepharanthine mitigates lung injury in lower limb ischemia-reperfusion. J Surg Res. 2015;199(2):647–656. doi:10.1016/j.jss.2015.06.041
3. Wu MY, Yiang GT, Liao WT, et al. Current mechanistic concepts in ischemia and reperfusion injury. Cell Physiol Biochem. 2018;46(4):1650–1667. doi:10.1159/0004892
4. Kalogeris T, Baines CP, Krenz M, Korthuis RJ. Cell biology of ischemia/reperfusion injury. Int Rev Cell Mol Biol. 2012;298:229–317. doi:10.1016/B978-0-12-394309-5.00006-7
5. Darenskaya MA, Kolesnikova LI, Kolesnikov SI. Oxidative stress: pathogenetic role in diabetes mellitus and its complications and therapeutic approaches to correction. Bull Exp Biol Med. 2021;171(2):179–189. doi:10.1007/s10517-021-05191-7
6. Guariguata L, Whiting DR, Hambleton I, et al. Global estimates of diabetes prevalence for 2013 and projections for 2035. Diab Res clin pract. 2014; 103(2): 137–149. doi:10.1016/j.dabres.2013.11.002
7. Xu H, Barnes GT, Yang Q, et al. Chronic inflammation in fat plays a crucial role in the development of obesity related insulin resistance. J Clin Invest. 2003;112(12):1821–1830. doi:10.1172/JCI200319451
8. Ohsumi A, Marseu K, Slinger P, et al. Sevoflurane attenuates ischemia-reperfusion injury in a rat lung transplantation model. Ann Thorac Surg. 2017;103(5):1578–1586. doi:10.1016/j.athoracsur.2016.10.062
9. Yang J, Tang L, Zhang F, et al. Sevoflurane preconditioning promotes mesenchymal stem cells to relieve myocardial ischemia/reperfusion injury via TRPC6-induced angiogenesis. Stem Cell Res Ther. 2021;12(1):584. doi:10.1186/s13287-021-02649-3
10. Grebowski J, Kazmierska P, Krokosz A. Fullerenols as a new therapeutic approach in nanomedicine. Biomed Res Int. 2013;2013:751913. doi:10.1155/2013/751913
11. Foroshani MS, Sobhani ZS, Mohammadi MT, Aryafar M. fullerenol nanoparticles decrease blood-brain barrier interruption and brain edema during cerebral ischemia-reperfusion injury probably by reduction of Interleukin-6 and Matrix Metalloproteinase-9 transcription. J Stroke Cerebrovasc Dis. 2018;27(11):3053–3065. doi:10.1016/j.jstrokecerebrovasdis.2018.06.042
12. Yavuz A, Tas Tuna A, Ozdemir C, et al. Effects of fullerenol C60 on liver tissue in liver ischemia reperfusion injury in rats undergoing sevoflurane anesthesia. Res Sq. 2023. Preprint. Version 1. Available from: https://www.researchsquare.com/article/rs-2541870/v1.
13. Kartal H, Küçük A, Kılıçarslan A, et al. The effect of fullerenol C60 on skeletal muscle after lower limb ischemia reperfusion injury in streptozotocin-induced diabetic rats. J Surg Med. 2020;4(6):451–455.
14. Van Ye TM, Roza A, Pieper GM, et al. Inhibition of intestinal lipid peroxidation does not minimize morphologic damage. J Surg Res. 1993;55(5):553–558. doi:10.1006/jsre.1993.1183
15. Durak I, Canbolat O, Kavutcu M, Ozturk HS, Yurtarslani Z. Activities of total, cytoplasmic, and mitochondrial superoxide dismutase enzymes in sera and pleural fluids from patients with lung cancer. J Clin Lab Anal. 1996;10(1):17–20. doi:10.1002/(SICI)1098-2825(1996)10:1<17::AIDJCLA4>3.0.CO;2-I
16. Gobut H, Kucuk A, Şengel N, et al. Effects of cerium oxide (CeO2) on liver tissue in liver ischemia-reperfusion injury in rats undergoing desflurane anesthesia. BMC Anesthesiol. 2023;23(1):40. doi:10.1186/s12871-023-01999-0
17. Erbatur ME, Sezen ŞC, Bayraktar AC, Arslan M, Kavutçu M, Aydın ME. Effects of dexmedetomidine on renal tissue after lower limb ischemia reperfusion injury in streptozotocin induced diabetic rats. Libyan J Med. 2017;12(1):1270021. doi:10.1080/19932820.2017.1270021
18. Francischetti I, Moreno JB, Scholz M, Yoshida WB. Leukocytes and the inflammatory response in ischemia-reperfusion injury. Rev Bras Cir Cardiovasc. 2010;25(4):575–584. doi:10.1590/s0102-76382010000400023
19. Fan J, Lv H, Li J, et al. Roles of Nrf2/HO-1 and HIF-1α/VEGF in lung tissue injury and repair following cerebral ischemia/reperfusion injury. J Cell Physiol. 2019;234(6):7695–7707. doi:10.1002/jcp.27767
20. Wen S, Li X, Ling Y, et al. HMGB1-associated necroptosis and Kupffer cells M1 polarization underlies remote liver injury induced by intestinal ischemia/reperfusion in rats. FASEB J. 2020;34(3):4384–4402. doi:10.1096/fj.201900817R
21. Lai HJ, Zhan YQ, Qiu YX, et al. HMGB1 signaling-regulated endoplasmic reticulum stress mediates intestinal ischemia/reperfusion-induced acute renal damage. Surgery. 2021;170(1):239–248. doi:10.1016/j.surg.2021.01.042
22. Qiu Z, Lei S, Zhao B, et al. NLRP3 Inflammasome activation-mediated proptosis aggravates myocardial ischemia/reperfusion injury in diabetic rats. Oxid Med Cell Longev. 2017;2017:743280. doi:10.1155/2017/9743280
23. Furman BL. Streptozotocin-induced diabetic models in mice and rats. Curr Protoc. 2021;1(4):e78. doi:10.1002/cpz1.78
24. O’Brien PD, Sakowski SA, Feldman EL. Mouse models of diabetic neuropathy. ILAR J. 2014;54(3):259–272. doi:10.1093/ilar/ilt052
25. Shang Y, Hewage SM, Wijerathne CUB, Siow YL, Isaak CK. Kidney ischemia-reperfusion elicits acute liver injury and inflammatory response. Front Med. 2020;7:201. doi:10.3389/fmed.2020.00201
26. Kumar AB, Suneja M, Riou B. Cardiopulmonary bypass-associated Acute Kidney Injury. Anesthesiology. 2011;114(4):964–970. doi:10.1097/ALN.0b013e318210f86a
27. Şengel N, Köksal Z, Dursun AD, et al. Effects of dexmedetomidine administered through different routes on kidney tissue in rats with spinal cord ischaemia–reperfusion injury. Drug Des Devel Ther. 2022;16:2229–2239. doi:10.2147/DDDT.S361618
28. Zhang K, Xu X, Hu L. Sevoflurane attenuates hepatic ischemia reperfusion injury by the miR-122/Nrf2 pathway. Ann Transl Med. 2022;10(6):350. doi:10.21037/atm-22-115
29. Wang YL, Zhang Y, Cai DS. Hepatoprotective effects of sevoflurane against hepatic ischemia-reperfusion injury by regulating microRNA-124-3p-mediated TRAF3/CREB axis. Cell Death Discov. 2022;8(1):105. doi:10.1038/s41420-021-00784-7
30. Wang WX, Zhao ZR, Bai Y, Li YX, Gao XN, Zhang S. Sevoflurane preconditioning prevents acute renal injury caused by ischemia-reperfusion in mice via activation of the Nrf2 signaling pathway. Exp Ther Med. 2022;23(4):303. doi:10.3892/etm.2022.11232
31. Kim JM, Shin JS, Min BH, et al. Induction, management, and complications of streptozotocin-induced diabetes mellitus in rhesus monkeys. Xenotransplantation. 2016;23(6):472–478. doi:10.1111/xen.12266
32. Kartal S, Şen A, Tümkaya L, Erdivanlı B, Mercantepe T, Yılmaz A. The effect of dexmedetomidine on liver injury secondary to lower extremity ischemia reperfusion in a diabetic rat model. Clin Exp Hypertens. 2021;43(7):677–682. doi:10.1080/10641963.2021.1937204
33. Nedzvetsky V, Andrievsky G, Chachibaia T, Tykhomyrov A. Differences in antioxidant/protective efficacy of hydrated C60 fullerene nanostructures in liver and brain of rats with streptozotocin-induced diabetes. J Diabetes Metab. 2012;3(08):8. doi:10.4172/2155-6156.1000215
34. Cannistrà M, Ruggiero M, Zullo A, et al. Hepatic ischemia reperfusion injury: a systematic review of literature and the role of current drugs and biomarkers. Int J Surg. 2016;33:57–70. doi:10.1016/j.ijsu.2016.05.050
35. Xu JY, Su YY, Cheng JS, et al. Protective effects of fullerenol on carbon tetrachloride-induced acute hepatotoxicity and nephrotoxicity in rats. Carbon. 2010;48(5):1388–1396. doi:10.1016/j.carbon.2009.12.029
36. Sivgin V, Yalcin G, Kucuk A, Sezen SC, Afandiyeva N, Arslan M. Effects of fullerenol nanoparticles on kidney tissue in sevoflurane‑treated rats. Bratisl Lek Listy. 2020;121(2):117–121. doi:10.4149/BLL_2020_015
37. Jacevic V, Djordjevic A, Srdjenovic B, et al. Fullerenol nanoparticles prevents doxorubicin-induced acute hepatotoxicity in rats. Exp Mol Pathol. 2017;102(2):360–369. doi:10.1016/j.yexmp.2017.03.005
38. Srdjenovic B, Milic-Torres V, Grujic N, Stankov K, Djordjevic A, Vasovic V. Antioxidant properties of fullerenol C60(OH)24 in rat kidneys, testes, and lungs treated with doxorubicin. Toxicol Mech Methods. 2010;20(6):298–305. doi:10.3109/15376516.2010.485622
 © 2023 The Author(s). This work is published and licensed by Dove Medical Press Limited. The full terms of this license are available at https://www.dovepress.com/terms.php and incorporate the Creative Commons Attribution - Non Commercial (unported, v3.0) License.
By accessing the work you hereby accept the Terms. Non-commercial uses of the work are permitted without any further permission from Dove Medical Press Limited, provided the work is properly attributed. For permission for commercial use of this work, please see paragraphs 4.2 and 5 of our Terms.
© 2023 The Author(s). This work is published and licensed by Dove Medical Press Limited. The full terms of this license are available at https://www.dovepress.com/terms.php and incorporate the Creative Commons Attribution - Non Commercial (unported, v3.0) License.
By accessing the work you hereby accept the Terms. Non-commercial uses of the work are permitted without any further permission from Dove Medical Press Limited, provided the work is properly attributed. For permission for commercial use of this work, please see paragraphs 4.2 and 5 of our Terms.