")
Back to Journals » OncoTargets and Therapy » Volume 11
The effect of piperlongumine on endothelial and lung adenocarcinoma cells with regulated expression of profilin-1
Authors Gagat M , Hałas-Wiśniewska M , Zielińska W , Izdebska M , Grzanka D , Grzanka A
Received 8 August 2018
Accepted for publication 16 October 2018
Published 22 November 2018 Volume 2018:11 Pages 8275—8292
DOI https://doi.org/10.2147/OTT.S183191
Checked for plagiarism Yes
Review by Single anonymous peer review
Peer reviewer comments 2
Editor who approved publication: Dr Tohru Yamada
Maciej Gagat,1 Marta Hałas-Wiśniewska,1 Wioletta Zielińska,1 Magdalena Izdebska,1 Dariusz Grzanka,2 Alina Grzanka1
1Department of Histology and Embryology, Faculty of Medicine, Nicolaus Copernicus University in Toruń, Collegium Medicum in Bydgoszcz, Bydgoszcz, Poland; 2Department of Clinical Pathomorphology, Faculty of Medicine, Nicolaus Copernicus University in Toruń, Collegium Medicum in Bydgoszcz, Bydgoszcz, Poland
Purpose: The aim of the study was to evaluate the effect of piperlongumine (2 and 4 µM) on endothelial EA.hy926 and lung adenocarcinoma A549 cells with regulated expression of profilin-1 (PFN1).
Material and methods: The cytotoxicity of alkaloid was evaluated by MTT assay, while cell death was assessed using double staining with annexin V and propidium iodide. Subsequently, the level of PFN1 1) upregulation in EA.hy926 endothelial cells and 2) downregulation in A549 lung adenocarcinoma cells. The next step was the analysis of the effect of PFN1 manipulation on cytoskeletal proteins.
Results: The results showed that piperlongumine may inhibit proliferation of EA.hy926 and A549 cell lines and also induce cell death in a dose-dependent manner. Furthermore, endothelial cells with PFN1 overexpression showed lower sensitivity to alkaloid and strengthening of cell–cell interactions. In the case of A549 cells, loss of PFN1 expression resulted in a lower percentage of early apoptotic cells, reorganization of F-actin and vimentin network, and reduction of migratory potential.
Conclusion: We suggest that upregulation of PFN1 in endothelial cell line may stabilize the cell junctions. In turn, PFN1 downregulation in A549 cells probably suppresses cell migration and sensitizes cells to anticancer agents.
Keywords: profilin-1, piperlongumine, lung cancer, endothelial cell, F-actin, lung adenocarcinoma
Introduction
Actin, microtubules, and intermediate filaments are main cytoskeletal proteins, the alterations of which may lead to the disturbances of homeostasis and as a consequence contribute to oncogenesis. There are numerous literature reports on the subject of cytoskeleton essential roles in the regulation of major cellular processes including proliferation, differentiation, death, and migration. Therefore, many studies have implicated that the cytoskeletal proteins may be constituted an attractive target in cancer therapy.1,2 Many research groups focused their attention mostly on the actin network, due to its involvement in basic cellular processes in both, cancer and normal cells.3–5 Furthermore, in the recent years, there is also an increase of interests in actin-binding proteins (ABPs) in the different types of cells, especially in the context of cell death, migration, or cell junction stabilization.6–8 ABPs family is the group of various proteins involved in the regulation of actin filaments’ stability, growth and disassembly (polymerization and depolymerization).9,10 One of the examples of ABPs is profilin-1 (PFN1), the protein involved in actin assembly through the exchange of ADP for ATP on G-actin and transport of profilin–actin complex to barbed ends of actin filaments. The protein also contributes to the stabilization of actin monomer.11 It has been shown that PFN1 may play a role in the modulation of the migration ability of different cell types.12 The manipulation of the expression of ABPs may be an alternative solution in basic but also clinical studies.
Currently, the search for new compounds with therapeutic potential and the development of successive combination regimens is part of the effort to improve treatment programs for drug-resistant cancers and reduce the risk of new cancer cell foci. A promising group of anticancer agents has become alkaloids that can inhibit growth and/or cause the death of cancer cells and limit their migration or invasion. One of them, piperlongumine (PL/PPLGM) is a natural alkaloid originated from fruits of long pepper plants (Piper longum L.). Several studies indicated the anticancer prosperities of this substance, with minimal effect on normal cells.13 Mechanism of PL action is related to induction of reactive oxidative species (ROS), DNA damage, cell cycle arrest, autophagy, apoptosis, and inhibition of angiogenesis process.14–16 Furthermore, PL is able to inhibit cell proliferation and migration in a different type of cells.17–19
Expression of PFN1 in lung adenocarcinoma and/or endothelial cells (ECs), and its functional significance are yet to be elucidated. The study is the first report on the effect of natural alkaloid, PL, on the basal cellular processes in ECs EA.hy926 and drug-resistant non-small cell lung carcinoma (NSCLC) A549 cell lines in the context of F-actin reorganization at the different levels of PFN1 expression.
Material and methods
Cell culture, treatment, and transfection
The immortalized human endothelial EA.hy926 (ATCC CRL-2922, Manassas, VA, USA) and NSCLC A549 cell lines (ATCC CL 185, Manassas, VA, USA) were cultured in DMEM (Sigma-Aldrich, St Louis, MO, USA) supplemented with 10% fetal bovine serum (Sigma-Aldrich) and antibiotics (50 μg/mL of gentamycin; Sigma-Aldrich). The cells were grown in 6- and 12-well plates or culture flask as a monolayer at 37°C under a 5% CO2 humidified atmosphere. After reaching 70%–80% confluence, the cells were treated with natural alkaloids – PL (Abcam, Cambridge, UK) – at concentrations of 2 and 4 μM for 24 hours. The control cells were grown under the same conditions without the PL addition.
In order to upregulate (EA.hy926) and downregulate (A549) the level of PFN1 expression, the cells were transfected using expression plasmid with cloned cDNA of PFN1 (OriGene, Rockville, MD, USA) and siRNA against PFN1 (Qiagen, Hilden, Germany), respectively. For determining the unspecific effect of the overexpression and loss of PFN1, the cells were transfected with empty control plasmid vector (OriGene). Furthermore, we used the SE and SF Cell Line 4D-Nucleofector® X kit (Lonza, Basel, Switzerland) and electroporated using 4D-Nucleofector, according to the manufacturer’s instructions and conditions as described previously.20 Following 72 hours, transfection efficiency was examined by the analysis of green fluorescent protein (GFP) fluorescence intensity in the cells transfected with the pmaxGFP control vector (Lonza) using Nikon Eclipse E800 fluorescence microscope and NIS-Elements 4.0 software and Tali image-based cytometer (ThermoFisher, Carlsbad, CA, USA).
MTT assay
The cytotoxicity of PL was evaluated by an MTT assay (Sigma-Aldrich). The EA.hy926 and A549 cells were cultivated in 12-well plates and treated with distinct concentrations of PL (1, 2, 4, 6, and 8 μM). After 24 hours, the freshly prepared MTT solution in DMEM without phenol red (at the ratio 1:9; Lonza) was added to cells and incubated for 3 hours at 37°C under a 5% CO2 humidified atmosphere in the dark. Next, the visible purple formazan crystals were dissolved in isopropanol (10 minutes, 37°C) and centrifuged at 13,000 g for 2 minutes. Finally, the cell viability was analyzed using a spectrophotometer (Spectra Academy, K-MAC, Korea) at the 570 nm wavelength. The absorbance of untreated cells was assumed as 100%. The results obtained from MTT assay allowed to estimate the half maximal inhibitory concentration (IC50) using CompuSyn software.21
Cell death analysis
The cell death in both cell lines was investigated using Guava easyCyte 6HT-2L Benchtop Flow Cytometer (Merck Millipore, Darmstadt, Germany) and double staining with Annexin V Alexa Fluor 488 (AV)/propidium iodide (PI; ThermoFisher). The cells were cultured in 6-well plates and treated with PL for 24 hours. The next day, after trypsinization and centrifugation, cells were suspended in actin binding buffer (ABB; ThermoFisher). Subsequently, experimental materials were incubated with Annexin V Alexa Fluor 488 for 20 minutes (room temperature [RT], in the dark) and next centrifuged in 300 g ×5 minutes. Then, EA.hy926 and A549 cells were washed with ABB, and stained with PI for 5 minutes (RT, in the dark) and analyzed by cytometer. The data obtained in cell death analysis were examined using FlowJo 10.4.2 software (FlowJo, LCC, Ashland, OR, USA). This assay was also repeated for EA.hy926 and A549 cells after manipulation of PFN1 expression and the treatment with PL.
Fluorescence staining of proteins (F-actin, ZO-1, β-catenin, PFN1, vimentin)
The effect of PL on EA.hy926 and A549 cell lines with different levels of PFN1 expression in the context of cytoskeletal and cell junction proteins was evaluated using fluorescence staining. The cells were grown on glass sterile coverslips in 12-well plates and treated with PL for 24 hours. In order to examine F-actin, vimentin, ZO-1, β-catenin, and PFN1, the cells were fixed with 4% paraformaldehyde (Serva, Heidelberg, Germany) for 20 minutes at room temperature and washed with PBS. The following steps were performed: permeabilization of cells membranes by 0.25% Triton X-100 (5 minutes, RT) and blocking with 1% bovine serum albumin (Sigma-Aldrich; 30 minutes, RT). For F-actin labeling Alexa Fluor 488 conjugated with phalloidin was used (1:40, 20 minutes, RT). In turn, for ZO-1, β-catenin, and PFN1, the appropriate primary antibodies were used: mouse anti-ZO-1 (1:100, 1 hour, RT, ThermoFisher), rabbit anti-β-catenin (1:100, 1 hour, RT, Sigma-Aldrich), and mouse anti-profilin-1 (1:100, 1 hour, RT, Sigma-Aldrich). For labeling of the abovementioned proteins, anti-mouse Alexa Fluor 488 (1:100, 1 hour, RT, ThermoFisher) and anti-rabbit Alexa Fluor 555 (1:500, 1 hour, RT, ThermoFisher) were used as the secondary antibodies. The cell nuclei were stained using DAPI (1:20,000, 10 minutes, RT, Sigma Aldrich). The slides were mounted in Aqua-Poly/Mount (Polysciences, Warrington, PA, USA) and examined using Nikon Eclipse E800 fluorescence microscope and NIS-Elements 4.0 software (Nikon, Tokyo, Japan).
The next step was the analysis of fluorescence intensity of F-actin and PFN1 in A549 cells with normal and lower level of PFN1 and F-actin, PFN1, ZO-1, and β-catenin in EA.hy926 control group (normal level) and with PFN1 overexpression. The measurements were performed on the fluorescence images from confocal microscope, executed using the ImageJ software (Ver.1.51j8, National Institute of Health, Bethesda, MD, USA) and evaluated by GraphPad Prism 6.0 (GraphPad Software, Inc., La Jolla, CA, USA).
Wound healing assay
The monolayer of A549 cells, before and after manipulation of PFN1, was subjected to a mechanical scratch-wound created with 100 μL sterile pipette tip. Then the cells were cultured for an additional period of 36 hours in the presence or absence of PL at the concentrations of 2 and 4 μM. The process of reducing the wound area was observed and photographed under phase-contrast optics using a TE100-U inverted microscope and CCD camera (Nikon). The injury area was measured using the ImageJ software (Ver.1.51j8, National Institute of Health) at the 0, 6, 12, 24, 30, and36 hour time points after PL treatment and analyzed using GraphPad Prism 6.0 (GraphPad Software, Inc.). The wound healing assay was also performed in EA.hy926 and A549 cells after transfection and treatment with PL.
Statistical analysis of publicly available data sets
In order to evaluate PFN1 mRNA expression in adenocarcinoma, we obtained data from an online database Kaplan–Meier plotter.22 The GraphPad Prism 6 was used to analyze overall survival (OS; GraphPad Software, Inc.).
Statistical analysis of obtained data
The results are presented as means and were considered significant at P<0.05. The statistical analysis was carried out using GraphPad Prism 6 (GraphPad Software, Inc.). The MTT was analyzed by the Wilcoxon signed rank test as it compares the mean with hypothetical value (control=100%). The cell death, fluorescent intensity of chosen cytoskeletal proteins, and wound healing assay results were evaluated by two-way ANOVA test. Statistically significant differences were marked by “*” for a compared group of cells without and with overexpression or decreased level of PFN1, “#” for compared data from a control group of cells, and “$” for statistically significant results in a group of PFN1-transfected cells. In the case of statistical analysis of transfection efficiency, the nonparametric Mann–Whitney U test was used, and the statistically significant differences were marked by “^”.
Results
PL inhibits proliferation of EA.hy926 and A549 cells
To determine the effect of PL on endothelial EA.hy926 and lung adenocarcinoma A549 cells with a naïve expression of PFN1, the cells were treated with different concentrations (1–8 μM) of alkaloid for 24 hours and then the viability was evaluated using MTT assay. Treatment with PL resulted in a dose-dependent decrease in cell viability (Figure 1). In the case of EA.hy926 cells, we observed a reduction in the percentage of viable cells from 92.95% (1 μM) to 59.28% (8 μM). Moreover, the obtained data allowed to select two doses used in the further studies – 2 μM (82.71%) and 4 μM (77.96%; Figure 1A). In turn, the A549 cells were less sensitive to alkaloid action than EA.hy926 cells. The MTT assay analysis showed a statistically significant decrease in viability of A549 cells from 96.60% (2 μM), up to 50.07% (8 μM; Figure 1B). Additionally, the half maximal inhibitory concentration of PL was calculated hypothetically using CompuSyn software21 and amounted to 7.77 μM for endothelial EA.hy926 cells and 10.64 μM for A549 cell line.
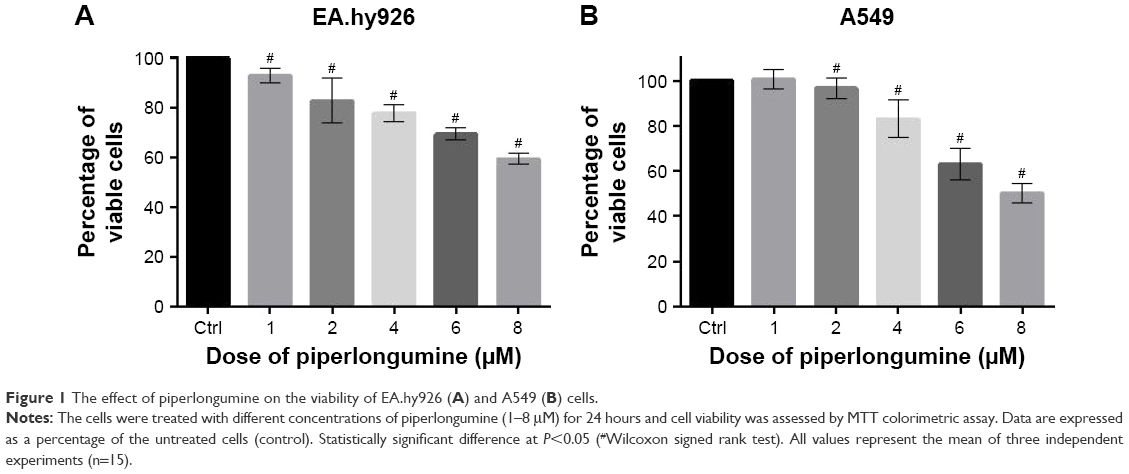 | Figure 1 The effect of piperlongumine on the viability of EA.hy926 (A) and A549 (B) cells. |
Transfection efficiency of PFN1 expression in EA.hy926 and A549 cell lines
In order to evaluate the transfection efficiency, the lung adenocarcinoma A549 cells and endothelial EA.hy926 cells were transfected with the pmaxGFP control vector and analyzed using Tali Image-based cytometer (Figures 2 and 3). The obtained results showed that the average transfection efficiency comprised to 87.7% for A549 and 95.6% for EA.hy926 cells (Figures 2A and 3A). The representative cells with a positive GFP signal were photographed and are presented in Figures 2B and 3B. Additionally, the transfection efficiency was investigated using fluorescence staining followed by the measurement of the fluorescence intensity of PFN1 in both types of cells. In the case of A549 cancer cell line after downregulation of PFN1, we noticed a 1.4-fold decrease in PFN1 fluorescent intensity in comparison to that observed in cells with a naïve expression of PFN1 (Figure 2C and D). Simultaneously, the data obtained for EA.hy926 with PFN1 overexpression showed a 2.4-fold increase in fluorescent intensity, when compared with the control (Figure 3C and D).
 | Figure 2 Transfection efficiency of A549 cell line. |
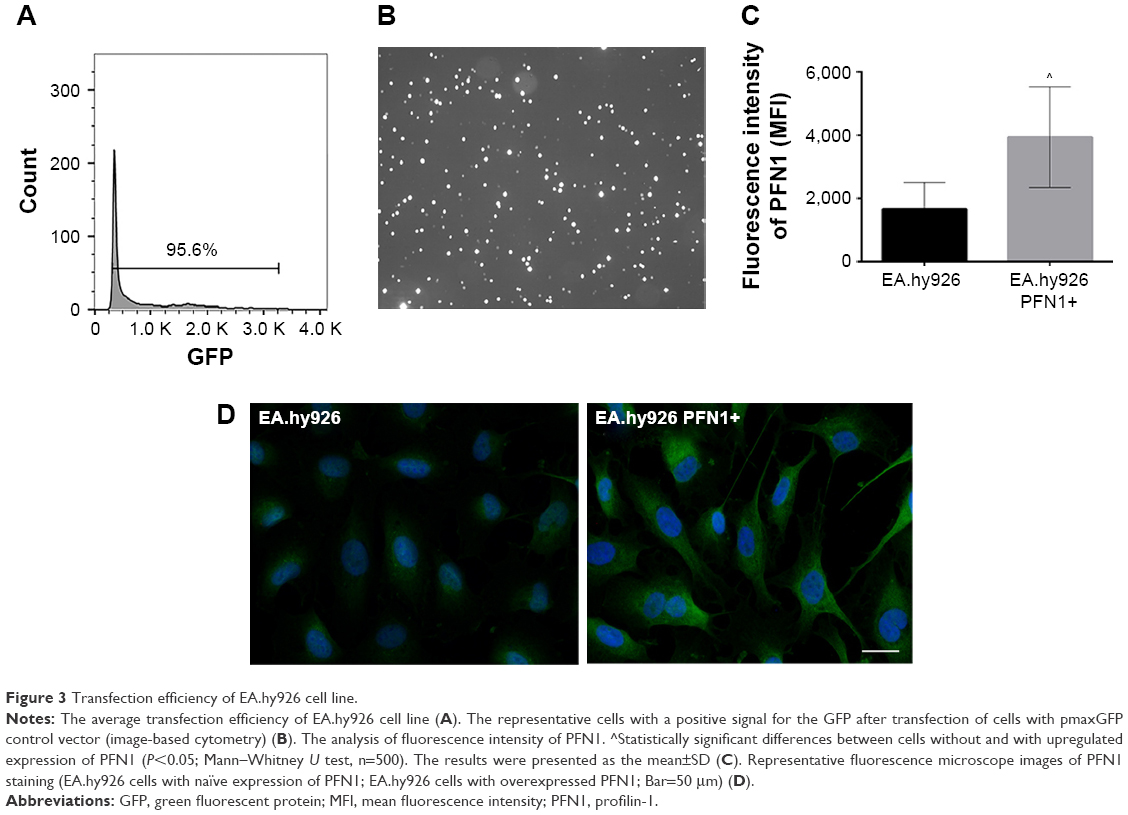 | Figure 3 Transfection efficiency of EA.hy926 cell line. |
The effect of PL on death of EA.hy926 cells without and after regulation of PFN1
After 24 hours incubation with 2 and 4 μM of PL, cell death was assessed. In the case of endothelial EA.hy926 cells with normal PFN1 expression, the double staining with Annexin V Alexa Fluor 488 (AV) and PI showed the decrease in the percentage of live cells, identified as AV and PI double negative (AV−/PI−), from 93.84% for untreated cells to 86.78% and 81.05% for 2 and 4 μM concentrations of PL, respectively. In comparison, a little impact of the same concentrations of PL was observed in ECs with PFN1 overexpression. Moreover, we noticed a decrease in population of AV−/PI− cells from 96.65% for control cells to 91.38% and 90.83% for 2 and 4 μM of alkaloid, respectively (Figure 4A). The next populations were specified as early (AV+/PI−) and late apoptotic cells (AV+/PI+). In ECs with a naïve PFN1 expression, the treatment with PL caused the increase in early apoptotic cells (from 3.65% for untreated cells to 6.97% and 9.3% for 2 and 4 μM of PL, respectively). In the case of EA.hy926 cells with PFN1 overexpression, the treatment with PL resulted in statistically significant differences in apoptotic cells compared with untreated cells and ranged from 0.67% (CTRL PFN1+) to 2.56% (2 μM PL PFN1+) and 3.43% (4 μM PL PFN1+; Figure 4B). In the case of a late apoptotic cells with normal PFN1 expression, we observed an increase from 2.42% for control cells to 6.37% for 2 μM and 8% for 4 μM. However, EA.hy926 with PFN1 overexpression showed a dose-dependent increase from 0.70% for untreated group to 2.59% and 3.68% for 2 and 4 μM doses of PL, respectively (Figure 4C). The last group of necrotic cells (PI+/AV−) was 1.11% for control cells, 2.64% and 3.18% for PL at concentrations of 2 and 4 μM, whereas the necrotic rates in transfected EA.hy926 cells ranged from 2.7% (Ctrl PFN+) to 1.75% (2 μM PFN1+) and 2.16% (4 μM PFN1+; Figure 4D).
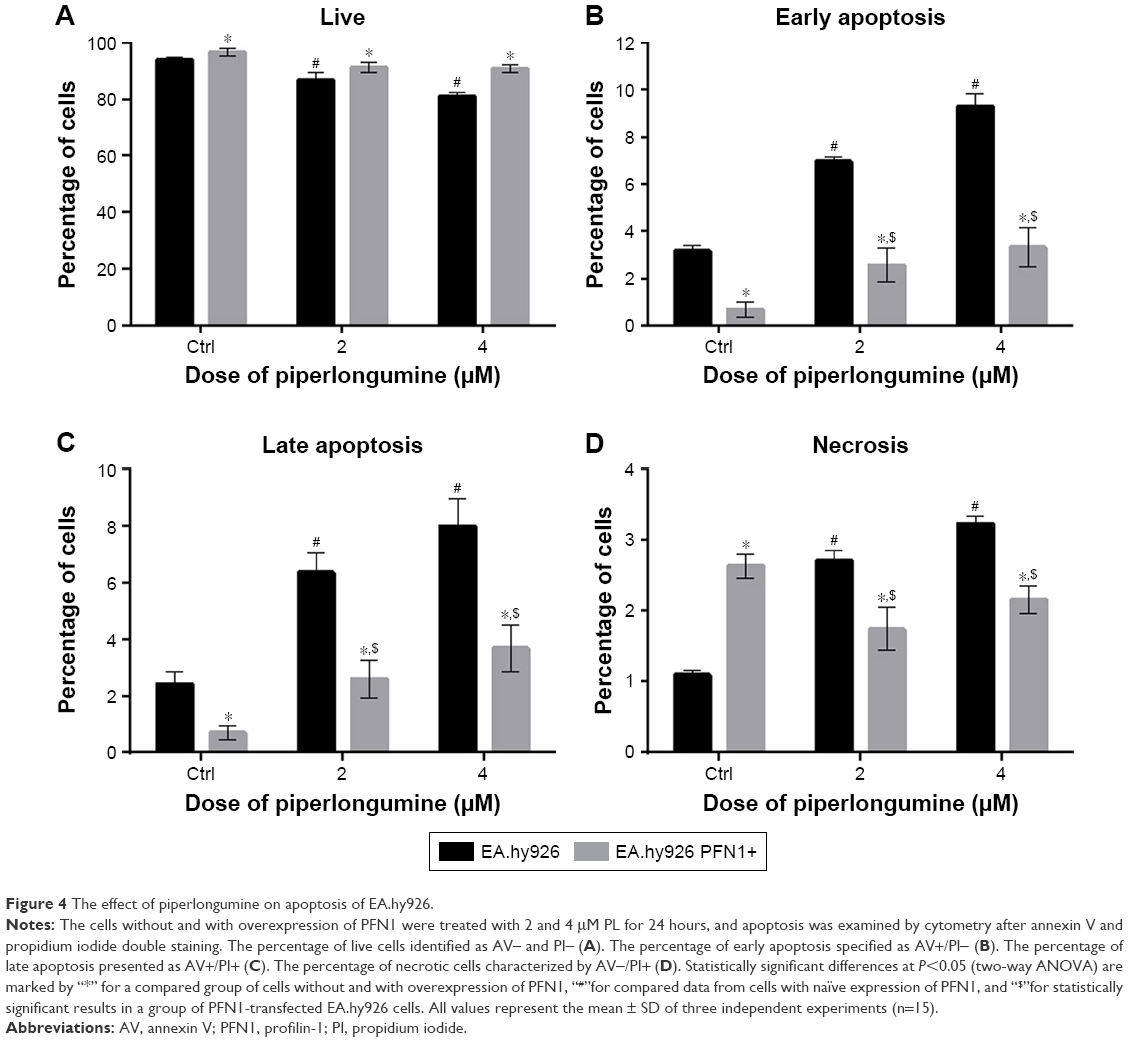 | Figure 4 The effect of piperlongumine on apoptosis of EA.hy926. |
The effect of PL on death of A549 cells without and after manipulation of PFN1 expression
The second part of the investigation was the comparison of the data obtained from cell death analysis in A549 with normal level and loss of PFN1. We observed that PL induced a statistically significant decrease in the percentage of live cells from 93.62% for untreated cells to 83.8% and 73.18% for 2 and 4 μM PL, respectively. In turn, A549 cells with loss of PFN1 were characterized by the lower level of viable cells in comparison to the population without PFN1 manipulation. Furthermore, we observed a decrease in AV-/PI- cells from 88.4% in control group to 81.6% for 2 μM PL and 69.24% for the highest concentration of alkaloid (Figure 5A). Additionally, we noticed a dose-dependent increase in the percentage of early apoptotic cells (AV+/PI−), which ranged from 2.26% (Ctrl) to 3.80% (2 μM) and 7.19% (4 μM) for A549 cells and 9.02% (Ctrl PFN1−) to 14.43% (2 μM PFN1−) and 18.2% (4 μM PFN1−) for cells with the lower level of PFN1 (Figure 5B). In the case of late apoptosis, treatment with PL resulted in a statistically significant increase from 2.46% for untreated cells to 6.46% and 10.09% for 2 and 4 μM PL, respectively. Similarly, A549 cells after PFN1 downregulation also showed increase in the percentage of late apoptotic cells. However, the differences were smaller and ranged from 1.99% (Ctrl PFN1−) to 2.62% (2 μM, PFN1−) and 7.01% (4 μM, PFN1−; Figure 5C). The last step was the analysis of necrosis. In this case, we observed an increase in the percentage of necrotic cells for A549 without loss of PFN1 (2.98% Ctrl; 6.07% for 2 μM; 9.08% for 4 μM). Moreover, in transfected lung adenocarcinoma cells, the percentage of necrotic cells was lower in comparison to the cells with normal PFN1 expression and reached 1.64% for control, 1.64% for 2 μM, and 3.65% for 4 μM PL (Figure 5D).
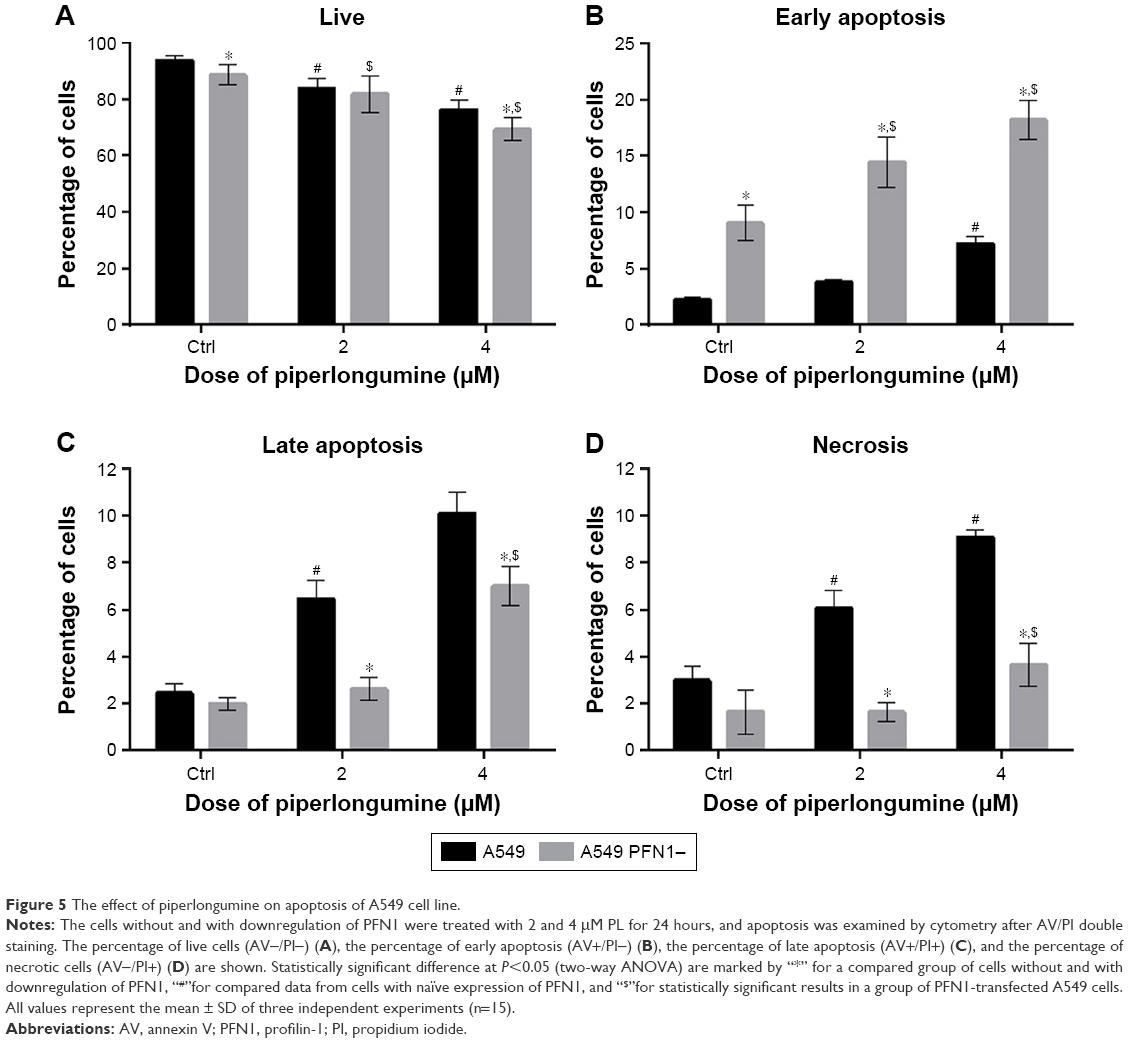 | Figure 5 The effect of piperlongumine on apoptosis of A549 cell line. |
The influence of PL on cytoskeletal proteins of EA.hy926 cells without and after manipulation of PFN1 expression
Due to the fact that PFN1 is a member of the ABPs family, we decided to evaluate the alterations in F-actin and other proteins involved in maintaining cell–cell contacts, such as ZO-1 and β-catenin. Additionally, the fluorescent staining was performed to localize and evaluate the level of PFN1 expression in EA.hy926 cells, with and without upregulation of this protein.
Based on the results of our previous studies,20,23 we decided to check whether overexpression of other protein involved in F-actin stabilization will result in enhanced cell–cell contact and reduce the effect of the drug in EA.hy926 cells (Figure 6Aa–f). After treatment with PL, we observed the presence of stress fibers and cells with hallmarks typical for mitotic catastrophe, especially at the highest dose of the alkaloid. Additionally, the giant cells were characterized by the accumulation of F-actin fibers in the peripheral region. We also observed the decrease in fluorescence intensity of F-actin at the cell–cell area in a dose-dependent manner (Figure 6Ab and c). In turn, after PFN1 upregulation, we noticed an increase in the number of cell protrusions and the fluorescence intensity of F-actin involved in cell–cell contact. Furthermore, the lesser amount of stress fibers and a decrease in the number of cells characterized by mitotic catastrophe or apoptosis in comparison to the untreated group were visible (Figure 6Ad–f). The measurement of F-actin mean fluorescence intensity increased from MFI =2,728.74 (Ctrl) to MFI =4,226.49 (Ctrl PFN1+), MFI =2,185.29 (2 μM PL) to MFI =4,744.71 (2 μM PL PFN1+), and MFI =1,936.44 (4 μM PL) to MFI=4,344.8 (4 μM PL PFN1+; Figure 6B).
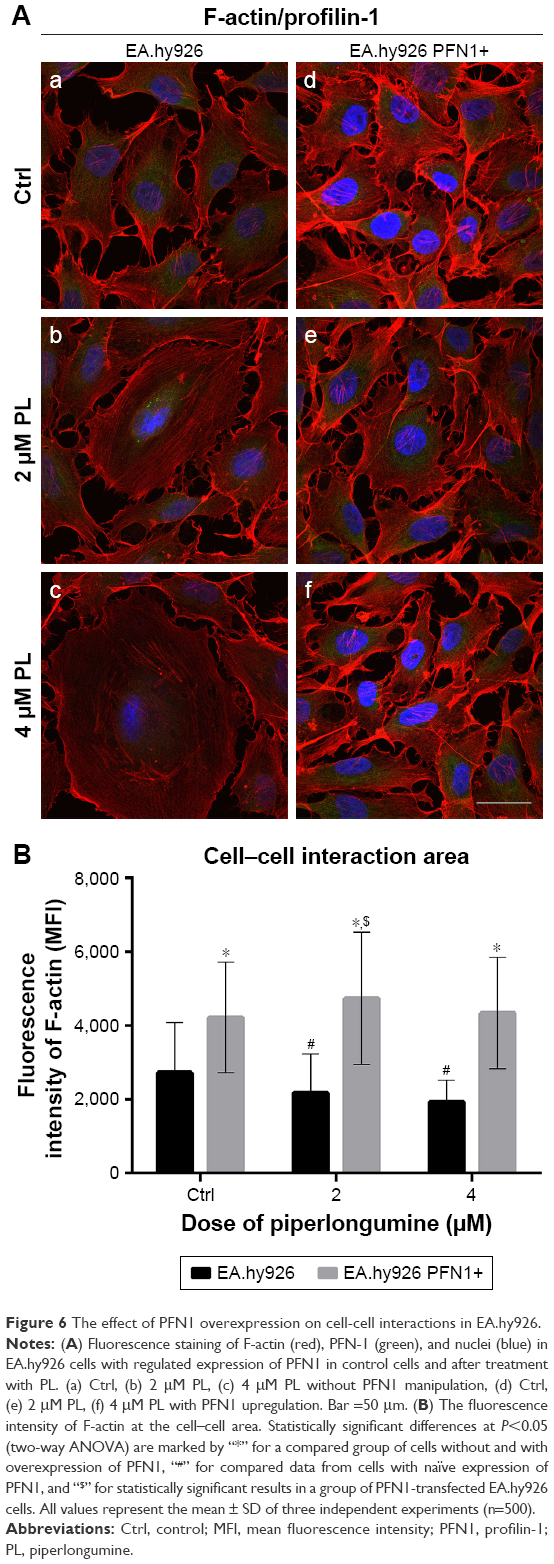 | Figure 6 The effect of PFN1 overexpression on cell-cell interactions in EA.hy926. |
The next part of our study was the analysis of PFN1. As previously mentioned, this fluorescent staining allowed us to confirm the transfection efficiency. Images from confocal microscope showed the statistically significant increase in the mean fluorescence intensity of PFN1 after transfection of EA.hy926 with expression plasmid with cloned cDNA of PFN1, as compared to the control (from MFI=1,666.67 to MFI=3,934.78, respectively) (Figure 3C and D). Furthermore, in PL-treated ECs, a normal level of PFN1 accumulation of this protein near the nucleus area was observed, especially in giant cells (Figure 7b). At the higher doses of alkaloid, we observed a decrease in the PFN1 fluorescence signal (Figure 7c). On the other hand, upregulation of PFN1 resulted in an enhanced signal after fluorescent staining in the whole cells and in the cell–cell interaction area (Figure 7d and e).
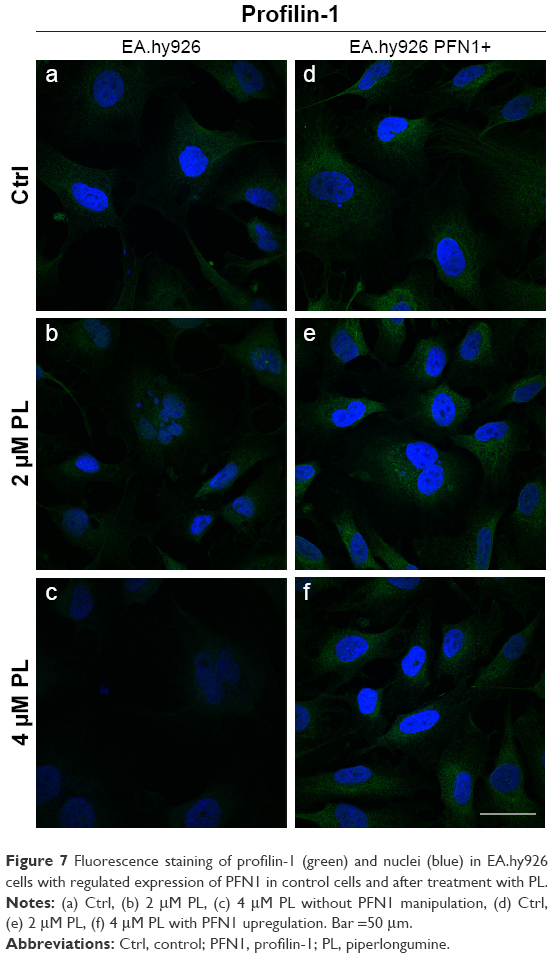 | Figure 7 Fluorescence staining of profilin-1 (green) and nuclei (blue) in EA.hy926 cells with regulated expression of PFN1 in control cells and after treatment with PL. |
The next purpose of our investigation was evaluation of the β-catenin. In EA.hy926 without PFN1 manipulation, the low-level expression of β-catenin in both whole cell and cell–cell junction areas was seen. Following treatment with PL, the presence of multinucleated and giant cells was also observed. A decrease in the mean fluorescence intensity of β-catenin in a dose-dependent manner was seen (Figure 8Aa–c). On the other hand, the overexpression of PFN1 resulted in an accumulation of β-catenin in cell–cell regions compared to the population of EA.hy926 cells with a naïve level of PFN1. Moreover, the results showed an accumulation of β-catenin around the nucleus in ECs with upregulated expression of PFN1 (Figure 8Ad–f). The level of β-catenin mean fluorescence intensity in untreated cells showed MFI=774.79 for Ctrl, MFI=687.72 for 2 μM PL, and MFI=608.13 for 4 μM PL. Whereas, an increase in fluorescence intensity in cell–cell interaction regions in PFN1 upregulated EA.hy926 was observed (MFI=1,356 for Ctrl PFN1+; MFI=1,335.02 for 2 μM PFN1+; and MFI=1,326.01 for 4 μM PFN1+; Figure 8B).
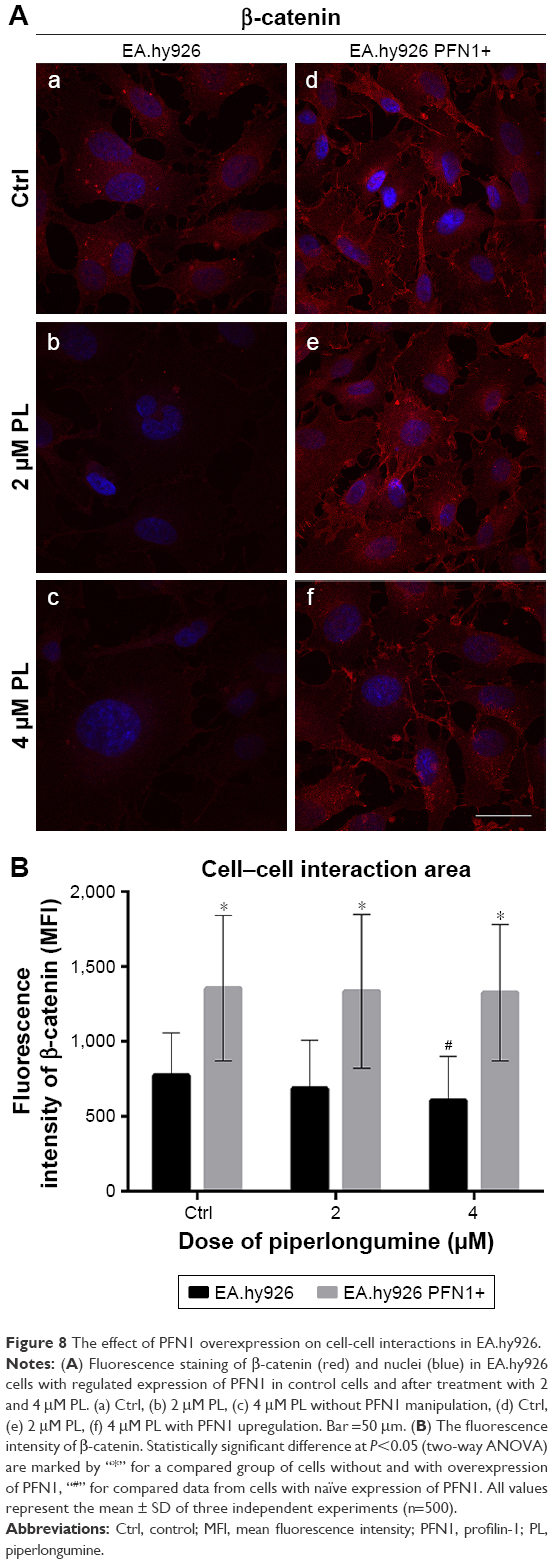 | Figure 8 The effect of PFN1 overexpression on cell-cell interactions in EA.hy926. |
Fluorescent staining of ZO-1 in EA.hy926 revealed a decrease in the expression level of ZO-1 with the increasing doses of PL in EA.hy926 cells with a naïve expression of PFN1 (Figure 9Aa–f). The weakest fluorescence intensity of ZO-1 was observed after treatment with 4 μM PL (Figure 9Ac). By contrast, the population of EA.hy926 with PFN1 overexpression and after treatment with PL was characterized by an increase in fluorescence signal for ZO-1 localized at the cell–cell interactions area (Figure 9Ad–f). The statistical analysis indicated the significant differences in the fluorescence intensity of ZO-1 between the ECs with different levels of PFN1. We observed an increase in the mean fluorescence intensity of ZO-1 from MFI=967.49 to MFI=1,830.11 (Ctrl), from MFI=819.02 (2 μM PL) to MFI=1,734.53 (2 μM PL PFN+), and from MFI=798.31 (4 μM PL) to MFI=1,641.58 (4 μM PL PFN1+; Figure 9B). Moreover, in all cases, the extracellular spaces were reduced in size following overexpression of PFN1, when compared with the EA.hy926 cells with a naïve expression of PFN1. Furthermore, we observed an increase in the number of cells protrusions in PFN1-overexpressed cells, which was confirmed by enhanced interactions between cells (Figures 6–9).
 | Figure 9 The effect of PFN1 overexpression on cell-cell interactions in EA.hy926. |
The influence of PL on cytoskeletal proteins of A549 cells without and after manipulation of PFN1 expression
In order to assess cells’ migratory potential, we evaluated the fluorescence of two proteins involved in this process, vimentin and F-actin, in lung adenocarcinoma A549 cells. Additionally, the fluorescence labeling was performed to localize and evaluate the level of PFN1 expression in both, cells after downregulation of the protein and also in control cells with normal PFN1 expression.
In the A549 cells with a naïve expression of PNF1 and treated with PL, the fluorescent analysis of F-actin showed a decrease in the fluorescence intensity of this protein in a dose-dependent manner. Furthermore, the alterations in microfilamentous network accompanying cell death were observed in response to PL. Some of the cells displayed hallmarks typical for apoptosis, such as apoptotic bodies, shrunken nucleus, and depolymerization of F-actin, although mostly, giant multinucleated cells with F-actin short fibers or small punctuate accumulations were observed, especially following treatment with 4 μM (Figure 10a–c). The rearrangement of F-actin was also noticed after downregulation of PFN1 expression. These cells were characterized by a significant decrease in the density of F-actin network and its visible remodeling. Moreover, the cells were observed with hallmarks of apoptosis and mitotic catastrophe in comparison to A549 cells with a naïve expression of PFN1. Furthermore, as shown in Figure 10, in response to PL treatment, changes in the cell shape were seen. The PFN1-downregulated A549 cells were circular in comparison to untreated cells (Figure 10d and e).
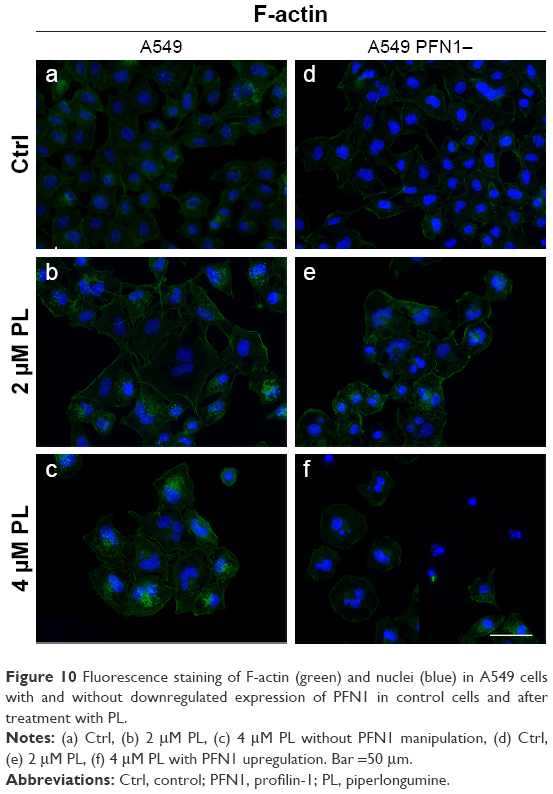 | Figure 10 Fluorescence staining of F-actin (green) and nuclei (blue) in A549 cells with and without downregulated expression of PFN1 in control cells and after treatment with PL. |
PL also had a visible effect on the rearrangement of vimentin cytoskeleton in A549 cells with a naïve and reduced levels of PFN1. In the first case, vimentin in the untreated cells was characterized by a well-organized network (Figure 11a). Exposure to the doses of PL led to a gradual decrease in the density of vimentin network. We also observed single cells with vimentin filaments characterized by a lower level of fluorescence in comparison to control (Figure 11b). In turn, PL-treated A549 cells were characterized by distributed vimentin network or single filaments and visible foci located at the nucleus region especially at higher concentration (Figure 11c). The vimentin immunostaining following PL treatment in cells with downregulated expression of PFN1 revealed a similar distribution to that described above. The control population of PFN1-downregulated cells had a spindle shape and visible vimentin cytoskeleton (Figure 11d). In the case of the lowest doses of PL, the shrunken cells with disarrangement of vimentin were noticed, whereas, in the multinucleated cells, the vimentin cytoskeleton had a form of a spread network. Similar to A549 with a naïve PFN1 level, the treatment with the highest concentration of PL resulted in F-actin in the form of dot-like structures localized in the central regions of the cytoplasm. However, the visible signal in PFN1-downregulated cells was weaker (Figure 11e and f).
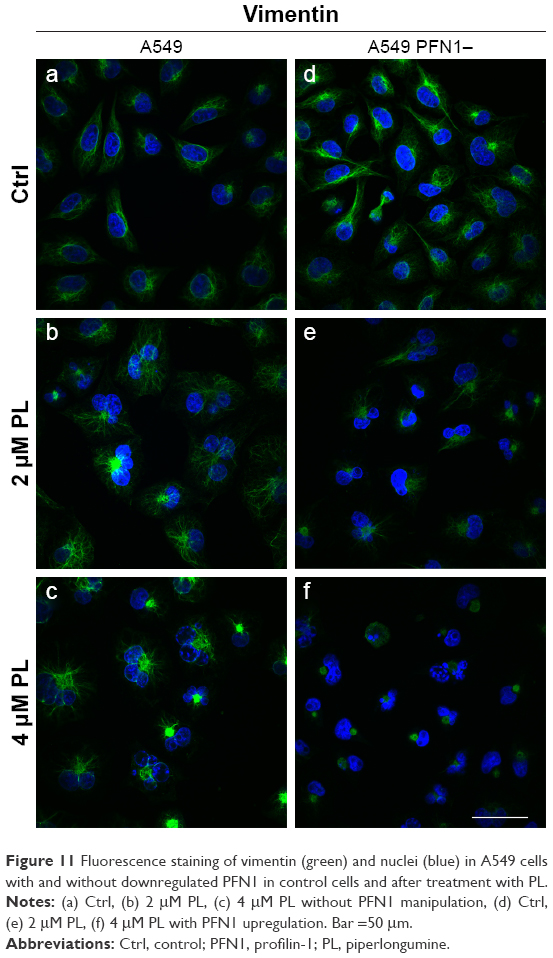 | Figure 11 Fluorescence staining of vimentin (green) and nuclei (blue) in A549 cells with and without downregulated PFN1 in control cells and after treatment with PL. |
The fluorescence analysis of PFN1 allowed us to confirm the different levels of its expression between A549 cells with a naïve expression of PFN1 and transfected with siRNA against PFN1 (Figure 12). The analysis of fluorescence intensity showed a statistically significant decrease in the MFI of PFN1 after its downregulation (Figures 2C and DZ 3A and D). Furthermore, after treatment with PL, we observed cells with accumulation of PFN1 signal in the form of dot-like structures (Figure 12b and c). Furthermore, in an A549 population with downregulated expression of PFN1, the visible signal of this ABP was weaker in comparison to a group of A549 with a naïve expression of PFN1. Furthermore, after treatment with PL, we also noticed the cells with some PFN1 foci in the central region of cells (Figure 12e and f).
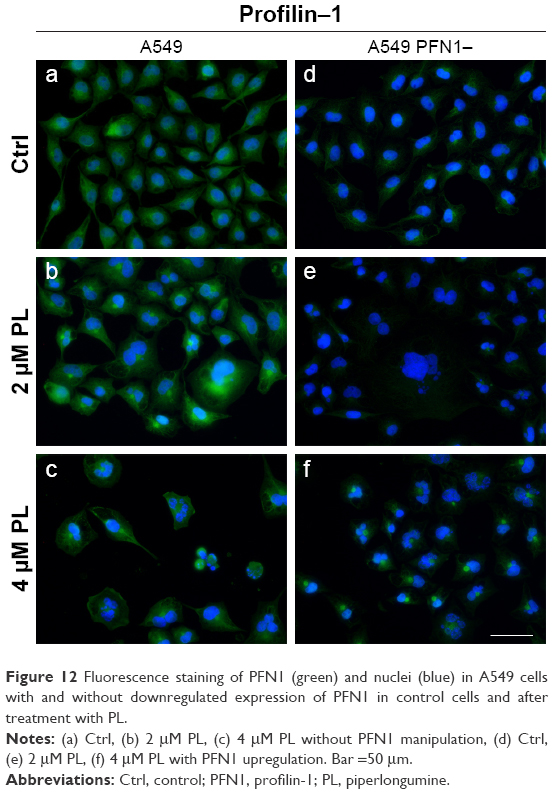 | Figure 12 Fluorescence staining of PFN1 (green) and nuclei (blue) in A549 cells with and without downregulated expression of PFN1 in control cells and after treatment with PL. |
The impact of PL on migration of A549 cells without and after manipulation of PFN1 expression
To verify whether PL treatment and manipulation of PFN1 expression can inhibit the migration of A549 cells, we performed the wound healing assay. In the case of A549 cells with a naïve PFN1 expression, the time that was necessary to close wound area was significantly decreased. After 24 hours, the wound was repaired in 91.47% in the control, while in PL-treated cells, in 60.44% and 50.56% for 2 and 4 μM PL, respectively. The obtained data revealed that both doses of alkaloid decreased the migratory potential in comparison to untreated cells (Figure 13A).
 | Figure 13 The effect of piperlongumine on the motility of A549 cells. |
Differently, in PFN1-downregulated cells treated with PL, the wound closure was much slower when compared with the control (Figure 13B). After 24 hours from the scratch, we still observed gaps in the monolayer in both treated and untreated cells. After 24 hours incubation, the scratch was repaired in 65.62% in the control, while only in 52.76% and 43.67% after treatment with PL at concentrations of 2 and 4 μM, respectively. Similarly, PL inhibited also the migration of A549 cells with downregulated expression of PFN1 in a dose-dependent manner. However, in the control of downregulated cells, the wound area was completely repaired after 36 hours, while in A549 cells with a naïve expression of PFN1, after 28 hours. Figure 13C shows the comparison of wound area as the percentage of a control cell in both groups after 24 hours from the wound formation.
Statistical analysis of publicly available data sets in adenocarcinoma
An online database (http://kmplot.com/analysis/) was used to determine the relevance of individual PFN1 mRNA expression to the OS of NSCLC patients. The data showed significant differences between patients with low and high PFN1 mRNA expression in a long-time perspective. We observed that NSCLC patients with lower level of PFN1 expression were characterized by better prognosis and higher survival rates than patients with higher level of PFN1 mRNA (Figure 14A). The effect was comparable for lung adenocarcinoma patients (Figure 14B), but not for squamous cell carcinoma (data not shown). Similar results were noticed after the division of available data into smokers and never smoked patients. The analysis also suggested that the higher PFN1 mRNA level correlates with worse prognosis among smokers (Figure 14C). Moreover, expression of PFN1 did not affect OS of never smoked patients (Figure 14D).
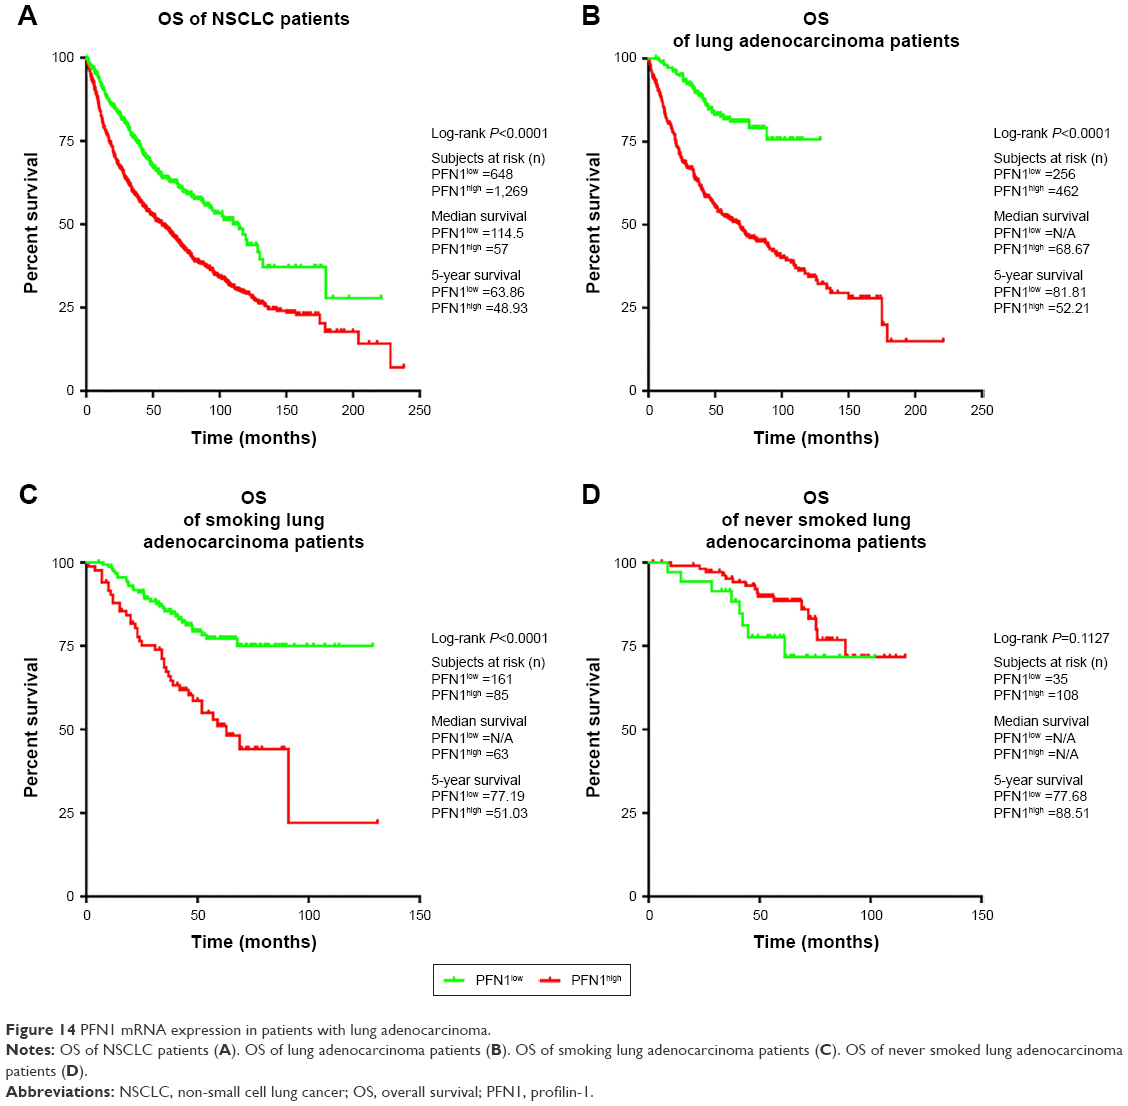 | Figure 14 PFN1 mRNA expression in patients with lung adenocarcinoma. |
Discussion
In the presented work we evaluated the hypothesis that 1) the upregulation of PFN1 expression level induces stabilization of cell junctions in ECs; 2) the downregulation of PFN1 level results in a decrease in the migration ability of A549 cell line; and 3) the PL has an impact on the basic cellular processes in two types of cells: endothelial EA.hy926 and lung adenocarcinoma A549 cell lines. Furthermore, in accordance with our knowledge, this is the first work demonstrating the effect of PL on the EA.hy926 and A549 cells with regulated levels of PFN1.
Civilization diseases are a significant problem of aging societies. Thus, the choice of research material was not accidental. The first type of cells used in our study was EA.hy926 as cell culture model useful in endothelial-based studies.24,25 In turn, the model of cancer cells constituted the NSCLC cell line, which is the most common cause of cancer-related death in the world.26
Actin is described as a very important structure in many processes including cell mortality, mitosis, cytokinesis, intracellular transport, endocytosis, and secretion.27,28 Many studies have focused their attention on the correlation between F-actin reorganization and a group of ABPs.29 This family is responsible for actin remodeling processes such as assembly and disassembly. Our previous investigations confirmed that upregulation of one such protein, tropomyosin-1, may stabilize F-actin network and cell–cell junctions but also protect cells against cigarette smoke extract or L-homocysteine.20,23 Based on our previous results, we decided to elucidate how the upregulation of the other representative of ABPs may affect EA.hy926 cells. Here, we chose PFN1. This G-actin-binding protein is involved in stabilization and regulation of F-actin assembly through the growth of actin filaments only at their barbed ends, the exchange of ADP to ATP and inhibition of filaments nucleation.30,31 Numerous studies have implicated the effect of manipulation of PFN1 level in the different types of cells. Finkel et al have reported that the elevated level of PFN1 expression in CHO cells caused stabilization of F-actin network.32 Likewise, here we demonstrated that overexpression of PFN1 resulted in the higher fluorescence intensity of junctional ZO-1 and β-catenin as the effect of an enhanced cell–cell contact in transfected control in comparison to untreated EA.hy926 cells with naïve expression of PFN1. However, obtained data showed that the increase in cell–cell contacts is smaller than those documented in our previous studies based on tropomyosin-1 overexpression.20 The observed differences are probably connected with varied types and roles of both ABPs.
Additionally, in order to assess the effect of PFN1 overexpression on the capability to stabilize actin network and protect the cells, we used PL – a natural alkaloid originated from fruits of long pepper plants (P. longum L.). Literature has reported that this alkaloid exhibits potential anticancer features, but in the context of EA.hy926, the more important property of PL was the ability to induce oxidative stress and to inhibit angiogenesis. Numerous studies have implicated that the PL’s mechanism of action is associated with ROS and the blockage of new blood vessels formation.16,33–36 It is known that oxidative stress is a factor that results in cellular damage and promotes the disturbances of cellular functions in several cell types.37 Clearly, literature has documented evidence on the effect of ROS on ECs manifested by induction of leucocytes adhesion, alterations in endothelial permeability, and change in levels of activator protein-1 and nuclear factor-kB.38,39 Our results indicated that PL may inhibit proliferation of EA.hy926, especially at the higher concentration (4 μM). The cell death analysis showed that PL induced a dose-dependent increase in the apoptotic and necrotic population of ECs. Furthermore, fluorescent observation revealed the presence of cells with morphology typical for mitotic catastrophe. We suggested that these results may be associated not only with excessive ROS production but also with the loss of cell–cell contact and cell adhesion. On the other hand, EA.hy926 cells with upregulated PFN1 showed less sensitiveness to PL than those with naïve PFN1 expression. These results were manifested by the lower percentage of apoptotic and necrotic cells and the higher number of live cell population, characterized by the higher junctional proteins fluorescence intensity at the cell junction regions following PL treatment. Moreover, the presence of numerous cell protrusions was noticed. The findings mentioned above have suggested that the overexpression of PFN1 may also stabilize the actin filaments, and as a result, decrease the effect of alkaloid probably through strengthening of the cell–cell contact. Similar observations were previously reported by Moldovan et al in 1997. The authors revealed that overexpression of PFN1 in ECs resulted in redistribution of F-actin network and as a consequence, the enhancement of ECs’ capability of cell–cell and cell–matrix adhesions.40 Additionally, the manipulation of PFN1 level in ECs was investigated in the context of other cellular processes. Ding et al have shown that reduction of PFN1 level in human umbilical vein endothelial cells resulted in migration and morphogenesis inhibition through decreased F-actin assembly and cell–cell adhesion.41 These results are consistent with those reported by Tang and Tan who also revealed that silencing of the PFN1 caused a reduction of the actin stress fibers amount in ECs.42 It is worth mentioning that the angiogenesis is a very important process in both normal and cancer cells in the context of tumorigenesis, cell development, and metastasis.43,44 This process is necessary for tumor nutrition and also provides a route for creating new inflammatory foci of diseases.45 Thus, based on our previous studies, we propose that overexpression of ABPs may probably stabilize cytoskeleton of ECs and, as a consequence, maintain a barrier to prevent mesenchymal cells migration. Furthermore, the stabilization of ECs through overexpression of ABPs including tropomyosin-1 or PFN1 may be useful in cardiovascular procedures and lead to the protection of cells against different focal injuries. Additionally, the treatment with PL may result in reduced tumor vasculature via a decrease in ECs number and inhibition of angiogenesis.
Nowadays, the clinical problems, such as cancer metastasis and invasion, are an important goal in the search for new and effective methods in oncology.46–48 For instance, currently, lung cancer is the most common cause of cancer-related death in the world. The high mortality is associated, among others, with limitations of chemotherapy, high aggressiveness, and the capacity of the cells to create metastasis.49,50 Traditionally, lung cancers have been perceived as an aggressive and extremely progressive disease with few therapeutic options.51 The data obtained from worldwide literature and analysis of the level of PFN1 expression in different tissues and cell types attracted our attention to manipulation of this protein in the case of the lung adenocarcinoma A549 cell line. Our statistical analysis of publicly available datasets directory and online database Kaplan–Meier plotter revealed that adenocarcinoma patients with a lower level of PFN1 mRNA were characterized by higher and better survival rates compared with patients with high PFN1 mRNA level. Interestingly, the analysis of PFN1 profile in another type of lung cancer H1299 cell line indicated that in both low and high levels of PFN1 mRNA, a decrease in survival rate occurred (data not shown). All these observations led to the conclusion that decreases in the level of PFN1 may inhibit migration and increase the effect of anticancer agents on the model of a major subtype of NSCLC – A549 cell line – and as a consequence may improve survival rate in patients.52 In order to investigate this hypothesis, we applied downregulation of PFN1 in combination with PL treatment.
Here we showed a dose-dependent decrease in A549 cell viability after treatment with PL. In addition, our data obtained in MTT assay indicated that lung adenocarcinoma A549 cells are less sensitive to PL, when compared with endothelial EA.hy926 cells. Our results are consistent with those reported by others researches, who also described the effect of PL on A549 cells.16,53,54 Moreover, as presented in this article, double staining of cells with Annexin V Alexa Fluor 488 and PI revealed a statistically significant increase in the number of early and late apoptotic cells in a dose-dependent manner. Wang et al have obtained similar results with PL and proposed that this compound can promote apoptosis and autophagy in A549 cells by inhibition of PI3K/Akt/mTOR pathway.36 In turn, Zheng et al have shown that PL inhibits cell proliferation and induces cell death through the alterations in nuclear factor kappa B.53 On the other hand, it has been shown that PL can also reduce cell viability and promote cell death in various types of cancer, including gastric, breast, ovarian, and pancreatic cancer.55–58 Here, the cell death analysis showed that silencing of PFN1 in A549 cells PL treatment resulted in a decrease in live, late apoptotic, and necrotic cells and an increase in the percentage of early apoptotic cells, when compared with cells with naïve expression of PFN1. This observation was confirmed by fluorescence analysis, where the high number of cells characterized by hallmarks typical for apoptosis was visible. Furthermore, the fluorescent staining of F-actin and vimentin showed that PL treatment induced alterations in the structures of this protein in A549 cells, both with naïve and reduced expression of PFN1. Liu et al have revealed that treatment with PL resulted in an F-actin disorganizing in bladder cancer.19 Likewise, Chen et al have reported that the oral cancer cells after PL treatment were characterized by a decrease in the vimentin expression level.18 In our study, the cells with lower level of PFN1 presented a strong reorganization of vimentin network and changes in the F-actin levels which were connected with alteration of PFN1 expression. In the case of cancer cells with a high degree of aggressiveness, the changes in morphology, cell adhesion, and the cytoskeletal proteins are very important in the context of cell migration. It is known that vimentin and F-actin are necessary for cell movements.59 Additionally, vimentin and other proteins such as E-cadherin and N-cadherin are known as metastasis markers.60–62 Here, in PFN1-downregulated cells, we observed the disappearance of vimentin fibers and the decrease in F-actin and vimentin MFI. Furthermore, we decided to analyze the effect of PFN1 level on migratory potential of A549 cells following PL treatment. We used the scratch wound-healing assay, a method that is commonly accepted to measure cell migration.63,64 Our data evidenced that following treatment with PL in A549 cells with downregulated expression of PFN1, the wound grew more slowly when compared with the control group. Literature have reported that PL suppresses migration in a different type of cancer including oral cancer, bladder, glioma, and hepatocellular carcinomas.18,19,65,66 Our results clearly showed that the downregulation of PFN1 expression in lung adenocarcinoma A549 cells inhibited their migration. Moreover, the treatment with PL enhanced this effect, what is confirmed by the fact that transfected cells without PL covered the scratch wound slower than untreated A549 cells with a naïve level of PFN1. We did not find studies that have implicated the effect of PFN1 loss in lung cancer. However, we noticed a few reports on manipulation of other protein from profilin family – profilin-2 (PFN2) – in different cancer cell lines. Tang et al have reported that downregulation of PFN2 led to a reduction of metastasis in lung cancer. Authors also suggested a correlation between PFN1 and PFN2 in the context of cancer metastasis.67 A similar effect was noticed by Yan et al in the case of PFN2 downregulation in different types of lung cancer (A549, NcI-H520, 95D). The hypothesis of the study was the correlation between high invasiveness and level of PFN2. The mentioned authors have shown that low level of this protein in NSCLC cells resulted in a decrease of vimentin and N-cadherin and an increase in E-cadherin expression in comparison to control group.68 On the contrary, Zou et al have reported that silencing PFN1 in breast cancer induced motility and invasiveness.69 The results, published by the same group of researches a few years later, explained a possible mechanism of this dependence. They suggested that the decrease of PFN1 expression may enhance breast cancer cells’ capability of invasion and metastasis via activation of Ena/VASP protein.70 On the other hand, in 2010, Zou et al extended their studies to PFN1 analysis of the effect of protein overexpression in MDA-MB-231 breast cancer. Obtained data showed that high level of PFN1 resulted in inhibition of proliferation.71 In turn, Ding et al have reported that the impact of PFN1 level correlates with stage of breast cancer metastasis. They implicated that downregulation of PFN1 may also suppress metastatic outgrowth of disseminated breast cancer cells.72 Likewise, as Mouneimne et al and Ding et al, we also suggested that the abovementioned differences may be closely related to the type, stage, and aggressiveness of cancer.12,73 The described results indicated that it is necessary to expand the researches and explain the PFN1 mechanism of action in the context of cancer metastasis, including lung adenocarcinoma. The latest literature does not provide information about the correlation between PFN1 and PL in the context of intermolecular or interprotein relativity. It would be worth considering this aspect in the next studies. However, it its known that PL is the alkaloid characterized by the presence of two reactive olefins, C2–C3 and C7–C8, which are responsible for a broad spectrum of this compound properties.74 On the other hand, molecular mechanism of PL may be related with influence on GSTP1, ROS-JNK-ERK, or the phosphorylation of JAK1,2/STAT3 signaling pathway.15,74,75
Conclusion
In conclusion, to our knowledge, this is the first report showing the effect of PL on endothelial and lung cancer cells in a regulated level of PFN1. Based on the obtained results, we propose that PFN1 overexpression in EC line may stabilize the cell junctions. This process may be useful in cardiovascular procedures and protect cells against different focal injuries. On the other hand, it may be important in the context of metastasis and tumor vascularization. Downregulation of PFN1 in lung adenocarcinoma A549 cells suppresses cell migration and sensitizes A549 cells to anticancer agents. We also suggest that treatment with PL induces cell death and inhibits cell metastasis, especially in cells with downregulated PFN1. Furthermore, our results confirm the potential of PL as an anticancer agent. We propose that downregulation of proteins involved in cell motility may lead to limitation of cancer cell metastatic potential and constitute an interesting way of anticancer therapy.
Disclosure
The authors report no conflicts of interest in this work.
References
Fife CM, Mccarroll JA, Kavallaris M. Movers and shakers: cell cytoskeleton in cancer metastasis. Br J Pharmacol. 2014;171(24):5507–5523. | ||
Cardama GA, Gonzalez N, Maggio J, Menna PL, Gomez DE. Rho GTPases as therapeutic targets in cancer (Review). Int J Oncol. 2017;51(4):1025–1034. | ||
Dominguez R, Holmes KC. Actin structure and function. Annu Rev Biophys. 2011;40:169–186. | ||
Franklin-Tong VE, Gourlay CW. A role for actin in regulating apoptosis/programmed cell death: evidence spanning yeast, plants and animals. Biochem J. 2008;413(3):389–404. | ||
Grzanka D, Gagat M, Izdebska M. Actin is required for cellular death. Acta Histochem. 2013;115(8):775–782. | ||
Rao J, Li N. Microfilament actin remodeling as a potential target for cancer drug development. Curr Cancer Drug Targets. 2004;4(4):345–354. | ||
Foerster F, Braig S, Moser C, et al. Targeting the actin cytoskeleton: selective antitumor action via trapping PKCε. Cell Death Dis. 2014;5(8):e1398. | ||
Izdebska M, Zielińska W, Grzanka D, Gagat M. The role of actin dynamics and actin-binding proteins expression in epithelial-to-mesenchymal transition and its association with cancer progression and evaluation of possible therapeutic targets. Biomed Res Int. 2018;2018:4578373. | ||
Winder SJ, Ayscough KR. Actin-binding proteins. J Cell Sci. 2005;118(Pt 4):651–654. | ||
Dominguez R. Actin-binding proteins – a unifying hypothesis. Trends Biochem Sci. 2004;29(11):572–578. | ||
Witke W, Sutherland JD, Sharpe A, Arai M, Kwiatkowski DJ. Profilin I is essential for cell survival and cell division in early mouse development. Proc Natl Acad Sci U S A. 2001;98(7):3832–3836. | ||
Ding Z, Bae YH, Roy P. Molecular insights on context-specific role of profilin-1 in cell migration. Cell Adh Migr. 2012;6(5):442–449. | ||
Raj L, Ide T, Gurkar AU, et al. Selective killing of cancer cells by a small molecule targeting the stress response to ROS. Nature. 2011;475(7355):231–234. | ||
Dhillon H, Chikara S, Reindl KM. Piperlongumine induces pancreatic cancer cell death by enhancing reactive oxygen species and DNA damage. Toxicol Rep. 2014;1:309–318. | ||
Thongsom S, Suginta W, Lee KJ, Choe H, Talabnin C. Piperlongumine induces G2/M phase arrest and apoptosis in cholangiocarcinoma cells through the ROS-JNK-ERK signaling pathway. Apoptosis. 2017;22(11):1473–1484. | ||
Karki K, Hedrick E, Kasiappan R, Jin UH, Safe S. Piperlongumine induces reactive oxygen species (ROS)-dependent downregulation of specificity protein transcription factors. Cancer Prev Res. 2017;10(8):467–477. | ||
Xu S, Xiao Y, Zeng S, et al. Piperlongumine inhibits the proliferation, migration and invasion of fibroblast-like synoviocytes from patients with rheumatoid arthritis. Inflamm Res. 2018;67(3):233–243. | ||
Chen YJ, Kuo CC, Ting LL, et al. Piperlongumine inhibits cancer stem cell properties and regulates multiple malignant phenotypes in oral cancer. Oncol Lett. 2018;15(2):1789–1798. | ||
Liu D, Qiu XY, Wu X, et al. Piperlongumine suppresses bladder cancer invasion via inhibiting epithelial mesenchymal transition and F-actin reorganization. Biochem Biophys Res Commun. 2017;494(1–2):165–172. | ||
Gagat M, Grzanka D, Izdebska M, Grzanka A. Effect of L-homocysteine on endothelial cell-cell junctions following F-actin stabilization through tropomyosin-1 overexpression. Int J Mol Med. 2013;32(1):115–129. | ||
Chou TC, Martin N. CompuSyn software for drug combinations and for general dose-effect analysis, and user’s guide. 2007. Paramus, NJ: ComboSyn INC. | ||
Győrffy B, Surowiak P, Budczies J, Lánczky A. Online survival analysis software to assess the prognostic value of biomarkers using transcriptomic data in non-small-cell lung cancer. PLoS One. 2013;8(12):e82241. | ||
Gagat M, Grzanka D, Izdebska M, Sroka WD, Hałas-Wiśniewska M, Grzanka A. Tropomyosin-1 protects transformed alveolar epithelial cells against cigaret smoke extract through the stabilization of F-actin-dependent cell-cell junctions. Acta Histochem. 2016;118(3):225–235. | ||
Edgell CJ, Reisner HM, Graham JB. Endothelial cell hybrids and the suspension of factor VIII related antigen expression. Br J Haematol. 1980;46(4):613–620. | ||
Vrekoussis T, Stathopoulos EN, de Giorgi U, et al. Modulation of vascular endothelium by imatinib: a study on the EA.hy 926 endothelial cell line. J Chemother. 2006;18(1):56–65. | ||
Kim EK, Kim KA, Lee CY, Shim HS. The frequency and clinical impact of HER2 alterations in lung adenocarcinoma. PLoS One. 2017;12(2):e0171280. | ||
Pollard TD, Blanchoin L, Mullins RD. Molecular mechanisms controlling actin filament dynamics in nonmuscle cells. Annu Rev Biophys Biomol Struct. 2000;29:545–576. | ||
Desouza M, Gunning PW, Stehn JR. The actin cytoskeleton as a sensor and mediator of apoptosis. Bioarchitecture. 2012;2(3):75–87. | ||
Pawlak G, Helfman DM. Cytoskeletal changes in cell transformation and tumorigenesis. Curr Opin Genet Dev. 2001;11(1):41–47. | ||
Pollard TD, Borisy GG. Cellular motility driven by assembly and disassembly of actin filaments. Cell. 2003;112(4):453–465. | ||
Kovar DR, Harris ES, Mahaffy R, Higgs HN, Pollard TD. Control of the assembly of ATP- and ADP-actin by formins and profilin. Cell. 2006;124(2):423–435. | ||
Finkel T, Theriot JA, Dise KR, Tomaselli GF, Goldschmidt-Clermont PJ. Dynamic actin structures stabilized by profilin. Proc Natl Acad Sci U S A. 1994;91(4):1510–1514. | ||
Möhler H, Pfirrmann RW, Frei K. Redox-directed cancer therapeutics: taurolidine and piperlongumine as broadly effective antineoplastic agents (review). Int J Oncol. 2014;45(4):1329–1336. | ||
Roh JL, Kim EH, Park JY, Kim JW, Kwon M, Lee BH. Piperlongumine selectively kills cancer cells and increases cisplatin antitumor activity in head and neck cancer. Oncotarget. 2014;5(19):9227–9238. | ||
Li J, Sharkey CC, King MR. Piperlongumine and immune cytokine TRAIL synergize to promote tumor death. Sci Rep. 2015;5:9987. | ||
Wang F, Mao Y, You Q, Hua D, Cai D. Piperlongumine induces apoptosis and autophagy in human lung cancer cells through inhibition of PI3K/Akt/mTOR pathway. Int J Immunopathol Pharmacol. 2015;28(3):362–373. | ||
Montorfano I, Becerra A, Cerro R, et al. Oxidative stress mediates the conversion of endothelial cells into myofibroblasts via a TGF-β1 and TGF-β2-dependent pathway. Lab Invest. 2014;94(10):1068–1082. | ||
Lum H, Roebuck KA. Oxidant stress and endothelial cell dysfunction. Am J Physiol Cell Physiol. 2001;280(4):C719–C741. | ||
Incalza MA, D’Oria R, Natalicchio A, Perrini S, Laviola L, Giorgino F. Oxidative stress and reactive oxygen species in endothelial dysfunction associated with cardiovascular and metabolic diseases. Vascul Pharmacol. 2018;100:1–19. | ||
Moldovan NI, Milliken EE, Irani K, et al. Regulation of endothelial cell adhesion by profilin. Curr Biol. 1997;7(1):24–30. | ||
Ding Z, Lambrechts A, Parepally M, Roy P. Silencing profilin-1 inhibits endothelial cell proliferation, migration and cord morphogenesis. J Cell Sci. 2006;119(Pt 19):4127–4137. | ||
Tang DD, Tan J. Downregulation of profilin with antisense oligodeoxynucleotides inhibits force development during stimulation of smooth muscle. Am J Physiol Heart Circ Physiol. 2003;285(4):H1528–H1536. | ||
Banyś A, Bułaś L, Długosz E, Szulc-Musiał B, Jankowski A. Angiogeneza w chorobie nowotworowej. Patofizjologia. 2009;65:247–250. | ||
Sacewicz I, Wiktorska M, Wysocki T, Niewiarowska J. Mechanisms of cancer angiogenesis. Postepy Hig Med Dosw. 2009;17:159–168. | ||
Jiang WG, Sanders AJ, Katoh M, et al. Tissue invasion and metastasis: molecular, biological and clinical perspectives. Semin Cancer Biol. 2015;35(Suppl):S244–S275. | ||
Levin EG. Cancer therapy through control of cell migration. Curr Cancer Drug Targets. 2005;5(7):505–518. | ||
Chambers AF, Werb Z. Invasion and metastasis – recent advances and future challenges. J Mol Med. 2015;93(4):361–368. | ||
Popper HH. Progression and metastasis of lung cancer. Cancer Metastasis Rev. 2016;35(1):75–91. | ||
Jones LW, Hornsby WE, Goetzinger A, et al. Prognostic significance of functional capacity and exercise behavior in patients with metastatic non-small cell lung cancer. Lung Cancer. 2012;76(2):248–252. | ||
Nguyen DM, Desai S, Chen A, Weiser TS, Schrump DS. Modulation of metastasis phenotypes of non-small cell lung cancer cells by 17-allylamino 17-demethoxy geldanamycin. Ann Thorac Surg. 2000;70(6):1853–1860. | ||
Cagle PT, Dacic S. Lung cancer and the future of pathology. Arch Pathol Lab Med. 2011;135(3):293–295. | ||
Lin C, Song H, Huang C, et al. Alveolar type II cells possess the capability of initiating lung tumor development. PLoS One. 2012;7(12):e53817. | ||
Zheng J, Son DJ, Gu SM, et al. Piperlongumine inhibits lung tumor growth via inhibition of nuclear factor kappa B signaling pathway. Sci Rep. 2016;6:26357. | ||
Seok JS, Jeong CH, Petriello MC, et al. Piperlongumine decreases cell proliferation and the expression of cell cycle-associated proteins by inhibiting Akt pathway in human lung cancer cells. Food Chem Toxicol. 2018;111:9–18. | ||
Zou P, Xia Y, Ji J, et al. Piperlongumine as a direct TrxR1 inhibitor with suppressive activity against gastric cancer. Cancer Lett. 2016;375(1):114–126. | ||
Jin HO, Park JA, Kim HA, et al. Piperlongumine downregulates the expression of HER family in breast cancer cells. Biochem Biophys Res Commun. 2017;486(4):1083–1089. | ||
Gong LH, Chen XX, Wang H, et al. Piperlongumine induces apoptosis and synergizes with cisplatin or paclitaxel in human ovarian cancer cells. Oxid Med Cell Longev. 2014;2014:906804–906810. | ||
Yamaguchi Y, Kasukabe T, Kumakura S. Piperlongumine rapidly induces the death of human pancreatic cancer cells mainly through the induction of ferroptosis. Int J Oncol. 2018;52(3):1011–1022. | ||
Mendez MG, Kojima S, Goldman RD. Vimentin induces changes in cell shape, motility, and adhesion during the epithelial to mesenchymal transition. FASEB J. 2010;24(6):1838–1851. | ||
Dauphin M, Barbe C, Lemaire S, et al. Vimentin expression predicts the occurrence of metastases in non small cell lung carcinomas. Lung Cancer. 2013;81(1):117–122. | ||
Satelli A, Li S. Vimentin in cancer and its potential as a molecular target for cancer therapy. Cell Mol Life Sci. 2011;68(18):3033–3046. | ||
Chin D, Boyle GM, Kane AJ, et al. Invasion and metastasis markers in cancers. Br J Plast Surg. 2005;58(4):466–474. | ||
Rodriguez LG, Wu X, Guan JL. Wound-healing assay. Methods Mol Biol. 2005;294:23–29. | ||
Jonkman JE, Cathcart JA, Xu F, et al. An introduction to the wound healing assay using live-cell microscopy. Cell Adh Migr. 2014;8(5):440–451. | ||
Liu QR, Liu JM, Chen Y, et al. Piperlongumine inhibits migration of glioblastoma cells via activation of ROS-dependent p38 and JNK signaling pathways. Oxid Med Cell Longev. 2014;2014:653732. | ||
Chen Y, Liu JM, Xiong XX, et al. Piperlongumine selectively kills hepatocellular carcinoma cells and preferentially inhibits their invasion via ROS-ER-MAPKs-CHOP. Oncotarget. 2015;6(8):6406–6421. | ||
Tang YN, Ding WQ, Guo XJ, Yuan XW, Wang DM, Song JG. Epigenetic regulation of Smad2 and Smad3 by profilin-2 promotes lung cancer growth and metastasis. Nat Commun. 2015;6:8230. | ||
Yan J, Ma C, Gao Y. MicroRNA-30a-5p suppresses epithelial-mesenchymal transition by targeting profilin-2 in high invasive non-small cell lung cancer cell lines. Oncol Rep. 2017;37(5):3146–3154. | ||
Zou L, Jaramillo M, Whaley D, et al. Profilin-1 is a negative regulator of mammary carcinoma aggressiveness. Br J Cancer. 2007;97(10):1361–1371. | ||
Bae YH, Ding Z, Zou L, Wells A, Gertler F, Roy P. Loss of profilin-1 expression enhances breast cancer cell motility by Ena/VASP proteins. J Cell Physiol. 2009;219(2):354–364. | ||
Zou L, Ding Z, Roy P. Profilin-1 overexpression inhibits proliferation of MDA-MB-231 breast cancer cells partly through p27kip1 upregulation. J Cell Physiol. 2010;223(3):623–629. | ||
Ding Z, Joy M, Bhargava R, et al. Profilin-1 downregulation has contrasting effects on early vs late steps of breast cancer metastasis. Oncogene. 2014;33(16):2065–2074. | ||
Mouneimne G, Hansen SD, Selfors LM, et al. Differential remodeling of actin cytoskeleton architecture by profilin isoforms leads to distinct effects on cell migration and invasion. Cancer Cell. 2012;22(5):615–630. | ||
Harshbarger W, Gondi S, Ficarro SB, et al. Structural and biochemical analyses reveal the mechanism of glutathione S-Transferase Pi 1 inhibition by the anti-cancer compound piperlongumine. J Biol Chem. 2017;292(1):112–120. | ||
Song B, Zhan H, Bian Q, Gu J. Piperlongumine inhibits gastric cancer cells via suppression of the JAK1, 2/STAT3 signaling pathway. Mol Med Rep. 2016;13(5):4475–4480. |
 © 2018 The Author(s). This work is published and licensed by Dove Medical Press Limited. The full terms of this license are available at https://www.dovepress.com/terms.php and incorporate the Creative Commons Attribution - Non Commercial (unported, v3.0) License.
By accessing the work you hereby accept the Terms. Non-commercial uses of the work are permitted without any further permission from Dove Medical Press Limited, provided the work is properly attributed. For permission for commercial use of this work, please see paragraphs 4.2 and 5 of our Terms.
© 2018 The Author(s). This work is published and licensed by Dove Medical Press Limited. The full terms of this license are available at https://www.dovepress.com/terms.php and incorporate the Creative Commons Attribution - Non Commercial (unported, v3.0) License.
By accessing the work you hereby accept the Terms. Non-commercial uses of the work are permitted without any further permission from Dove Medical Press Limited, provided the work is properly attributed. For permission for commercial use of this work, please see paragraphs 4.2 and 5 of our Terms.