")
Back to Journals » Neuropsychiatric Disease and Treatment » Volume 16
The Effect of Oral L-cysteine on Breast Milk and Plasma Cysteine Concentrations
Authors Dowlati Y, Maheux M , Meyer JH
Received 24 March 2020
Accepted for publication 19 September 2020
Published 21 December 2020 Volume 2020:16 Pages 3163—3172
DOI https://doi.org/10.2147/NDT.S255205
Checked for plagiarism Yes
Review by Single anonymous peer review
Peer reviewer comments 3
Editor who approved publication: Dr Roger Pinder
Yekta Dowlati,1,2 Maxim Maheux,3 Jeffrey H Meyer1,2
1CAMH Research Imaging Centre and Campbell Family Mental Health Research Institute, Centre for Addiction and Mental Health, Toronto, ON M5T 1R8, Canada; 2Department of Psychiatry, University of Toronto, Toronto, ON M5T 1R8, Canada; 3TransBioTech, Levis, QC G6v 6Z3, Canada
Correspondence: Jeffrey H Meyer
Centre for Addiction and Mental Health, 250 College Street, Toronto, ON M5T 1R8, Canada
Tel +1 416-535-8501 x34007
Fax +1 416-260-4188
Email [email protected]
Purpose: Greater oxidative signaling is implicated in major depressive disorder; hence, there is considerable interest in developing oral supplements with anti-oxidant properties to prevent or treat mood disorders, such as postpartum depression. L-cysteine is a precursor for glutathione, an important antioxidant in the brain. So, developing L-cysteine as a dietary supplement may be useful, provided oral supplementation substantially raises its concentration in blood plasma yet does not affect its total concentration in breast milk. This study assessed the effect of oral L-cysteine on its concentration in breast milk and blood plasma of breastfeeding mothers.
Participants and Methods: Twenty-four health breastfeeding women were randomly assigned to 0, 1.5, or 3 g of oral L-cysteine. Free and total cysteine in breast milk; and free cysteine in plasma were measured. While breast milk is the gold standard, measurement of infant formulas provides indices of nutritional intake considered safe. Therefore, free cysteine was also measured in six different formulas.
Results: Total cysteine in breast milk was not affected by oral L-cysteine (Repeated Measures of ANOVA (rANOVA), intervention effect: p=0.75). Free cysteine levels in breast milk did rise (rANOVA, intervention effect: p=0.017), but were within the range of common infant formulas. There was no significant effect of L-cysteine supplementation on free cysteine levels in plasma (rANOVA, intervention effect: p=0.25), although a post hoc analysis found a trend towards greater plasma cysteine 30 minutes after oral supplementation (t(14)=− 1.69, p=0.11, 3g versus no-dose).
Conclusion: The negligible effect of oral cysteine administration on its total concentration in breast milk was favorable, but the minimal effect on its blood plasma concentration more strongly argues against further development of oral L-cysteine in postpartum, as well as other conditions.
Keywords: cysteine, breast milk, postpartum depression, antioxidant
Introduction
Greater oxidative stress in bodily organs is implicated in the vulnerability and/or pathogenesis of many illnesses especially cardiovascular and neuropsychiatric diseases. Oxidative stress may be defined as an imbalance between antioxidant and pro-oxidant processes, leading to overproduction of reactive oxygen species (ROS) and their signaling, which may have harmful effects.1–4 Although normative levels of ROS are essential for many processes such as apoptosis, cellular signaling and phagocytosis; at elevated levels, it can cause oxidative modification to lipids, DNAs, proteins and ultimately lead to cell death5,6 Mood disorders is one subset of neuropsychiatric illnesses in which greater pro-oxidant states in the brain are implicated so there is an interest in developing oral anti-oxidants to reduce oxidative stress as a potential preventative strategy in conditions at high risk for mood disorders, such as early postpartum7,8 Postpartum depression is important because it affects 13% of the new mothers and it contributes to the problem that major depressive disorder is the leading cause of death and disability for women aged 15−44 worldwide.9,10
Evidence for increased oxidative stress in mood disorders derives from human postmortem studies, peripheral blood markers in humans, and depressive and/or anxiety behaviors in animals.11–20 Abnormalities of oxidative stress in postmortem prefrontal cortex of mood disorders include decreased glutathione, greater mitochondrial DNA mutations, and increased protein carbonylation.10–13,19,20 Many studies have also reported elevated markers of oxidative damage in peripheral blood samples of mood disorder patients, such as increased lipid peroxidation, and mitochondrial DNA mutations.13,14,16,18,20 Induction of oxidative stress with glutathione depletion through buthionine-S,R-sulfoximine, oral exposure to H2O2, or social defeat model through resident-intruder paradigm has been shown to be associated with anxiety and/or depressive behaviors in rodents tested with elevated plus maze, forced swim test and uncontrollable stress models.21–24 In early postpartum, there is an additional mechanism that may also contribute towards creating greater oxidative stress, since, during days 4–6 postpartum, after the 100- to 500-fold drop in estrogen levels, there is, approximately, a 40% elevation in monoamine oxidase-A (MAO-A) levels throughout all grey matter brain regions, including those that regulate affect, such as the prefrontal cortex and anterior cingulate cortex,25 MAO-A creates hydrogen peroxide when it catalyses the deamination of serotonin, dopamine, and norepinephrine.26,27
Oral L-cysteine administration shows interesting potential as a dietary supplement to increase antioxidant processes in the brain during early postpartum. L-cysteine is transported into the brain from the periphery to become a precursor for glutathione,28 so it is possible that oral L-cysteine could increase the availability of L-cysteine in blood, and subsequently its transport into the brain to increase glutathione level in the brain. Previous studies have suggested good tolerability for multiple doses of 0.5 grams and a single dose of 3 grams of L-cysteine.29,30 Moreover, Tribble et al reported more than ten-fold increase in the peak of free plasma cysteine after administering a single dose of 3g to participants taking a protein-restricted diet. On the other hand, it has been questioned as to whether oral L-cysteine can affect its level in blood due to an extensive first-pass liver metabolism. Due to this skepticism, n-acetylcysteine (NAC), which is considered more resistant to first-pass liver metabolism, has been largely investigated as a potential adjuvant in clinical trials of psychiatric disorders rather than L-cysteine.31–34 This study chose to assess L-cysteine rather than NAC because L-cysteine is naturally occurring in breast milk and therefore should not have any potential negative impact on the breastfeeding infant. NAC is not a natural compound, is not found in breast milk and oral administration of NAC would likely result in some NAC in breast milk. In contrast, L-cysteine is already in breast milk. Moreover, most of the L-cysteine in breast milk is contained within proteins so the effects of oral L-cysteine on its total level in breast milk would be expected to be minimal.
In the present study, we concurrently assessed the effect of L-cysteine on the maternal concentration of cysteine in blood plasma as well as in breast milk, anticipating effects of raising cysteine in blood plasma, but more minimal effects on total and free concentrations of cysteine in breast milk. However, there are no studies to date that have examined the effects of orally ingested L-cysteine on its concentration in breast milk. If the results show a substantial effect on raising plasma free cysteine concentration, and a minimal effect on cysteine content of breast milk, this would support further development towards its use to prevent postpartum depression (PPD).
Participants and Methods
Participants
Twenty-four breastfeeding mothers, aged 18 to 45 were enrolled through advertisement in the Greater Toronto Area (GTA), Ontario, Canada. Inclusion criteria included self-report of good physical health with no currently active medical conditions reported on a standardized health questionnaire for different organ systems, currently breastfeeding (between 2 and 24 months postpartum)35 and medication-free including not taking over the counter medication. Exclusion criteria were currently pregnant (screened with urine pregnancy test), use of any investigational medicinal product or herbal medication within the previous 8 weeks, current active psychiatric disorders as screened with the Structured Clinical Interview (SCID-I) for Diagnostic and Statistical Manual of Mental Disorders, fourth edition (DSM-IV), substance abuse (based on self-report and negative urine drug test), smoking more than 1 pack of cigarettes per day, known hypersensitivity to cysteine, and history of severe drug allergy.
This study received approval from the Research Ethics Board for Human Subjects at the Centre for Addiction and Mental Health, University of Toronto, Toronto, Canada, and the Natural Health Product Directorate of Health Canada (Protocol #: 100/2014). Written informed consents were acquired from all study participants. Participation was voluntarily and participants were free to withdraw from the study at any time point. All experiments on human participants were conducted in accordance with the Declaration of Helsinki.36
Study Protocol
Participants were randomly assigned to 1 of 3 groups within fixed blocks of six resulting in eight participants per group: Group one received no supplement. Group two received a single dose of 1.5 grams of L-cysteine. Group three received a single dose of 3 grams of L-cysteine. Otherwise, all the groups underwent the same study procedures. L-cysteine was obtained from New Roots Herbal Inc (NPN#80,025,197) and each capsule contained 500 milligrams of L-cysteine.
This study involved two visits. The first visit was a screening visit in which participants were evaluated for eligibility criteria. On the second visit, subjects came to the laboratory at 8 am and stayed for 8 hours as shown in Table 1. In order to standardize their diet, subjects were required to fast from 10 pm the night before the second visit, with the exception of water. In addition, dietary intake was identical for all participants throughout the visit. The diet during the visit included a low-protein breakfast and lunch, in order to detect the effect of different doses of L-cysteine supplements. During the second visit, mothers did not breastfeed their infants and were requested to bottle fed until their infants until after the last breast milk sample was taken.
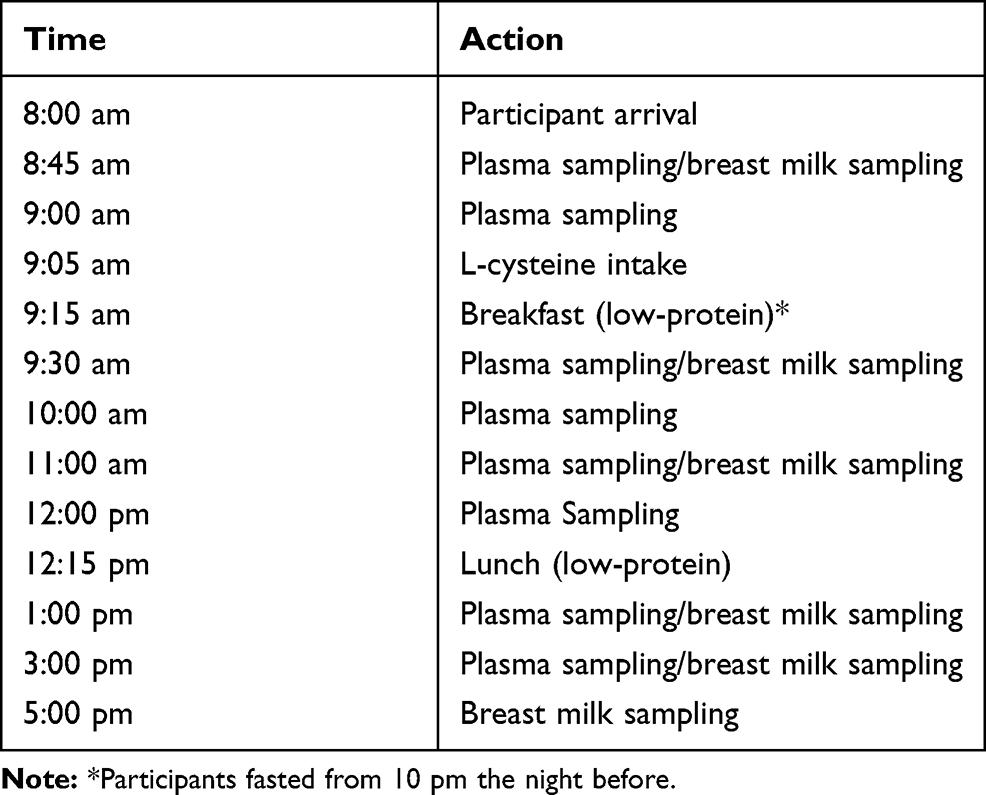 |
Table 1 Design and Timing of the L-Cysteine Experiment on the Second Study Day |
During the second visit, each participant provided 6 breast milk (30 mL each time point) and 8 blood samples (10 mL each time point) as shown in Table 1. Breast milk sampling was done as naturalistically as possible and included fore-, mid- and hindmilk. The duration of breast milk expression was between 5 and 20 minutes to collect 30 mL. Breast milk was collected from the right or left breast as per participant preference. Prior to pumping, mothers were instructed to wash their hands and clean their breasts with a moist paper towel. Breast milk samples were obtained with a hospital-grade electric pump (Medela Symphony Breast pump), then transferred into sterile polypropylene vials, coded and frozen at −80°C until analyzed. For blood draw, a one-time venipuncture and saline lock was completed first and then blood was drawn via lock afterwards. Blood samples were collected in EDTA lavender tubes, centrifuged for 15 minutes at 2000g. Afterwards, the 4 mL of plasma was pipetted and stored in Eppendorf tubes in a freezer at −80°C.
Although breast milk is considered the gold standard, but infant formulas can provide useful information about ranges in concentrations of cysteine that are safe.37,38 In order to compare the free cysteine in breast milk with what is available in infant formula; six different popular marketed North American infant formulas were chosen for comparison. Two commonly used formulas, available in the GTA were chosen from each category of non-hydrolyzed, partially hydrolyzed and extensively hydrolyzed formulas. Six different random packages with different lot numbers were analyzed from each formula brand: each sample was purchased from a different container of formula that was randomly acquired from different stores in the GTA. Formulas chosen were as follows: Parent’s Choice 0–12 months (non-hydrolyzed), Enfamil A+ 0–12 months (non-hydrolyzed), Nestle Good Start 2 (partially hydrolyzed), Enfamil Gentlease 0–12 (partially hydrolyzed), Alimentum (extensively hydrolyzed), Nutramigen A+ (extensively hydrolyzed).
Laboratory Analyses
Free Cysteine in Plasma, Breast Milk and Infant Formula Samples
Free cysteine was separated and quantified by high-pressure liquid chromatography with fluorescence detection (HPLC-FLD), adapted from an Agilent application.39 For the analysis of free cysteine, proteins were precipitated from the liquid sample directly or an aqueous preparation of a powder on ice for 30 minutes after mixing one part of sample with two parts of methanol (0.1 mL of plasma, 0.3 mL of breast milk and 0.3 mL of infant formula). The infant formula solutions were prepared with 8g of infant formula powder stirred in 60mL of water and duplicates were prepared by mixing 16g of infant formula powder stirred in 120mL of water. After centrifugation at 4000 rpm for 10 minutes, the supernatant was filtered through a 0.45-µm polytetrafluoroethylene (PTFE) membrane. The sample was then oxidized for 16 hours over ice at 4°C with 1 mL of a mixture of formic acid and hydrogen peroxide to convert cysteine to cysteic acid. This procedure was conducted according to the oxidation method of cysteine and cystine to cysteic acid.40 A fresh solution was prepared for the oxidation by mixing 4.5 mL of a 90% formic acid in water with 0.5 mL of hydrogen peroxide and 0.5 g of solid phenol. The concentration of H2O2 was 30%. Phenol prevents destruction of cysteine and methionine. It also avoids conversion of tyrosine to chlorotyrosine under hydrochloric acid hydrolysis conditions. After the oxidation process, the reaction was stopped by adding sodium metabisulfite and filtered on a 0.45-µm membrane. An excess of Na-metabisulfite was added, ensuring enough to neutralize the reagent. For the analysis of free cysteine, free cysteine and cystine in the whole sample were oxidized to cysteic acid with the formic acid, phenol and hydrogen peroxide solution. Extraction of the lipids was performed by adding an equal volume of methylene chloride. The upper aqueous phase was collected and placed in an HPLC vial. O-phthalaldehyde (OPA) was used to selectively derivatize the cysteic acid from the matrix. The OPA solution was prepared fresh each day as follows. To 0.2 mL of methanol was added 60 mg of OPA and, after dissolution, 1.2 mL of a 0.4 M pH = 10.2 tetraborate buffer and 80 µL of 2-mercaptoethanol. This solution was mixed with an equal volume of a Brij solution (1 mL of 30% Brij 35 diluted with 14 mL of tetraborate buffer pH = 10.2) to obtain the OPA derivatization solution. The HPLC injector was programmed to successively mix 2.5 µL of tetraborate buffer pH = 10.2 with 0.5 µL of OPA solution, 0.5 µL of sample and, after 2 minutes, 32 µL of a 0.2 M tetraborate buffer pH = 2.7. After mixing, this solution was injected on an Alltech Adsorbosphere OPA-HS column, 4.6 × 100 mm, 5 µm with a flow rate of 1.5 mL/min. The mobile phase was a mixture of (A) a 20 mM pH = 5.4 sodium acetate buffer and (B) methanol. The separation was done in isocratic conditions with 1.3% of B. After separation, the column was washed during 8 minutes with 95% of B and re-equilibrated during 5 minutes. For fluorescence detection, the excitation and emission wavelengths were set at 325 nm and 465 nm, respectively. The cysteic acid isoindole derivative was detected (the free cysteine and cysteine derived from cystine were both oxidized to cysteic acid and detected in fluorescence). The cysteine concentration was calculated against a cysteic acid calibration curve. The concentrations of the standards were from 0.5 mg/L to 10 mg/L of L-cysteic acid. Five standards across the whole analytical range were prepared in citrate buffer to build the calibration curve. The limit of quantitation was 0.17 mg/100mL.
Total Cysteine/Cystine in Breast Milk Samples
In breast milk, cysteine is present as a free form in solution and also bound to proteins. For the total analysis of cysteine, cystine, and cysteine within proteins, the whole sample was oxidized as mentioned above with the formic acid and hydrogen peroxide solution (0.3 mL of breast milk/infant formula; 1mL of formic acid, phenol and hydrogen solution; 0.1mL of plasma). After the oxidation, 10 mL of 6M hydrochloric acid containing 0.07% v/v of thiodiglycol was added to 0.3 mL of sample in a vacuum hydrolysis tube. The vacuum was applied for 10 minutes and hydrolysis was performed at 110°C for 4.5 hours.40 The tubes were cooled on ice and the excess of acid was neutralized using 7.5 M sodium hydroxide solution. The solution was filtered and the volume was brought to 25 mL by adding citrate buffer prior to analysis. The buffer was prepared by mixing 19.6 g of sodium citrate tribasic dehydrate, 1 g of phenol and 16.5 mL of concentrated hydrochloric acid in water. The pH was adjusted to 2.2, 5 mL of thioglycolic acid was added and the volume was brought to 1 L. Total cysteic acid was assayed with the HPLC-FLD procedure described above.
Statistical Analyses
SPSS was used for the statistical analyses. To determine whether any of the oral L-cysteine supplements had a differential effect on total cysteine concentrations in breast milk, a repeated measure analysis of variance (rANOVA) was performed with total cysteine as the dependent variable and group (no supplement, or each dose of L-cysteine) as a between-subject factor in the analysis. In addition, the effect of time and the interaction between group and time was evaluated with rANOVA. Similarly, rANOVA was performed to assess the effect of the oral L-cysteine supplements on free cysteine concentrations in breast milk and free cysteine concentrations in plasma over time.
Free cysteine concentrations in breast milk and infant formula were compared using the following data: the mean concentration of free cysteine after supplement intake for each participant; and the concentration of free cysteine in infant formulas. For the comparisons of data among participants and infant formulas, analyses were done separately with particular types of formulas (non-hydrolyzed, partially hydrolyzed, extensively hydrolyzed) since the concentration of free cysteine was not detectable or near zero across two of the formula types (non- and partially hydrolyzed). For the comparison of free cysteine among participant breast milk samples and extensively hydrolyzed formulas, an analysis of variance (ANOVA) was applied. Fisher’s Exact test was applied to compare detectable and non-detectable measurements across groups.
The power was estimated to be 80% to detect an effect of intervention group based on an effect size of f=0.5, α value equal to 0.05, 3 groups, 6 measurements and a correlation of 0.4 among the measurements.41
Results
Twenty-four participants completed the study protocol in 3 groups: no supplement, 1.5 grams of L-cysteine and 3 grams of L-cysteine. The mean age of participants was 30±4.39 and the mean postpartum age was 10.77±8.54. Both L-cysteine doses were well tolerated by all participants and no adverse effects were observed.
Total Cysteine Concentration in Breast Milk
At baseline, the mean total cysteine concentration in breast milk was 26.71±12.77 mg/100mL. There was no effect of intervention (F (2,21)=0.29, p=0.75 or time (F (2.14,44.97=0.92, p=0.41 on total cysteine concentrations in breast milk (Figure 1). Moreover, there was no time by intervention interaction (F (4.28,44.97)=0.45, p=0.78).
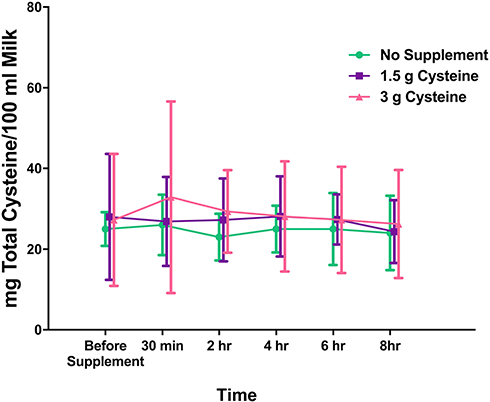 |
Figure 1 Total cysteine concentrations in breast milk after oral L-cysteine supplements. There was no time by intervention interaction (F (4.28,44.97=0.45, p=0.78)). Timing was identical for all groups. The data have been staggered for easier viewing. Data shown as mean and standard deviation. |
Free Cysteine Concentration in Breast Milk
At baseline, the mean free cysteine concentration in breast milk was 0.33±0.11 mg/100mL. There was a significant effect of intervention (F (2,21)=4.995, p=0.017) and time (F (2.33,49.002)=9.08, p<0.005) on free cysteine concentrations in breast milk (Figure 2). There was also a significant time by intervention interaction (F (4.67,49.002)=2.48, p=0.047).
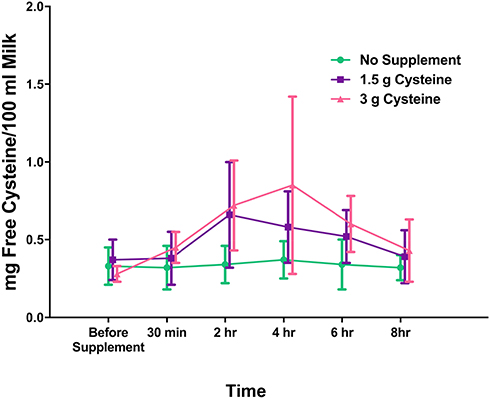 |
Figure 2 Free cysteine concentrations in breast milk after oral L-cysteine supplements. There was a significant time by intervention interaction (F (4.67,49.002)=2.48, p=0.047), reflecting the peak free cysteine levels observed at 2–4 hours after intake that differed for the 1.5 and 3g doses. Timing of supplement administration and/or measurements was identical for all groups. The data have been staggered for easier viewing. Data shown as mean and standard deviation. |
The post hoc LSD test evaluating the intervention group effect revealed that the 3 grams L-cysteine group had a significantly higher free cysteine in breast milk compared to the no supplement group (p=0.008). There were no significant differences in free cysteine levels in breast milk between the 1.5 grams L-cysteine and the groups receiving no supplement and 3 grams L-cysteine (p=0.05, p=0.36, respectively).
Free Cysteine Concentration in Plasma
At baseline, the mean free cysteine concentration in plasma was 1.3±0.53 mg/100mL. There was no effect of intervention (F (2,21)=1.49, p=0.25) or time (F (4.88,102.5)=0.68, p=0.63) on free cysteine concentrations in plasma (Figure 3). Moreover, there were no time by intervention interactions (F (9.76,102.5)=0.91, p=0.52). Given that Tribble et al reported a maximum plasma level of cysteine at approximately 30 minutes to 1 hour after a single oral cysteine administration of approximately 3g, a post hoc analysis comparing plasma cysteine between group 1 (receiving no cysteine) and group 3 (receiving 3g of cysteine) was completed and there was a trend for a greater cysteine concentration at 30 minutes and 1 hour after oral administration (30 minutes: t(14)=−1.69, p=0.11; 1 hour: t(14)=1.88, p=0.081), uncorrected for multiple comparisons. A similar comparison of plasma cysteine level at 2 hours post administration did not reach even a trend level difference.
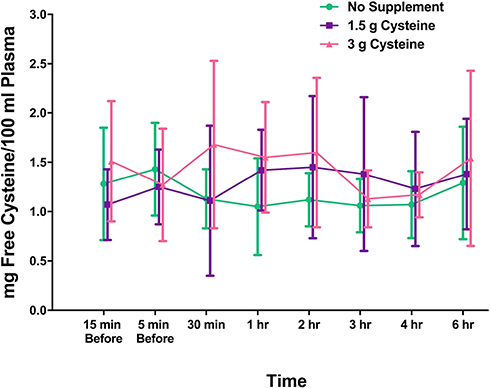 |
Figure 3 Plasma free cysteine concentrations after oral L-cysteine supplements. There was no time by intervention interaction (F (9.76,102.50)=0.911, p=0.525). Timing was identical for all groups. The data have been staggered for easier viewing. Data shown as mean and standard deviation. |
Free Cysteine Concentration in Infant Formula
Free cysteine was not detected in the non-hydrolyzed formulas (n=12 samples). Free cysteine was also not detected in one partially hydrolyzed (Enfamil Gentlease) infant formulas (n=6 samples) and it was below the limit of quantification (<0.17 mg/100mL) in another partially hydrolyzed infant formula (Good Start 2) (n=6 samples) (Figure 4). Given that free cysteine was above the limit of quantification in all participant samples, including the participants who did not receive an oral supplement, it was evident that free cysteine concentration is greater in participant breast milk as compared to non-hydrolyzed or partially hydrolyzed infant formulas. Statistically, this was demonstrable using a Fisher’s exact test evaluating quantifiability and group in a table such that all participant samples had quantifiable cysteine concentrations and samples from all non-hydrolyzed formulas were not detectable (p<0.00001). Similarly, a Fisher’s exact test evaluating quantifiability and group in a table was applied to all participant samples, all of which had quantifiable cysteine concentrations; and all samples from partially hydrolyzed samples, all of which were below the quantifiable level. This was also highly significant (p<0.00001). An ANOVA comparing breast milk free cysteine in all participant samples to free cysteine in all extensively hydrolyzed samples (from the different brands) found much higher free cysteine in the extensively hydrolyzed samples (F(1,35)=56.02, p<0.00001).
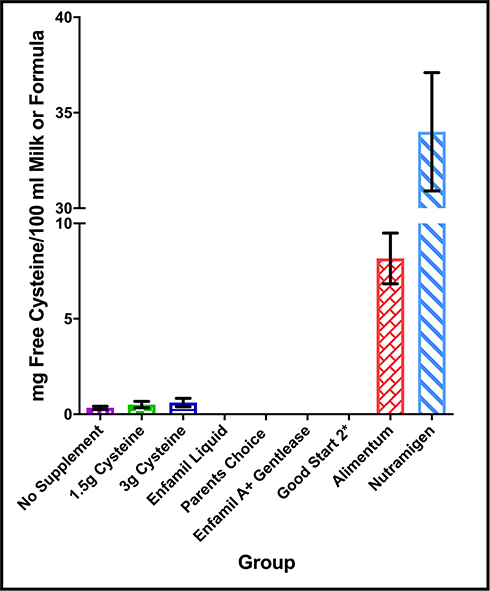 |
Figure 4 Free cysteine in common infant formulas and in breast milk after oral L-cysteine supplementation. To capture the variation in free breast milk levels, the y-axis was broken to two segments. Mean and standard deviation are presented. Free cysteine was not detected (no bar shown) in Enfamil liquid, Parents Choice and Enfamil A+ Gentlease and was below the limit of quantification in Good Start 2* (<0.17 mg/100mL). Free cysteine in breast milk even with the highest dose of 3g L-cysteine was comparable to non-hydrolyzed formulas, and significantly lower than extensively hydrolyzed formulas (Nutramigen A+ and Alimentum) (analysis of variance, post hoc comparisons, Fisher’s least significant difference (LSD), p<0.00001). An ANOVA comparing breast milk free cysteine in all participant samples to free cysteine in all extensively hydrolyzed samples (from the different brands) found much higher free cysteine in the extensively hydrolyzed samples (F(1,35)=56.02, p<0.00001). Free cysteine concentration is greater in participant breast milk as compared to non-hydrolyzed or partially hydrolyzed infant formulas shown using a Fisher’s exact test evaluating quantifiability and group in a table such that all participant samples had quantifiable cysteine concentrations and samples from all non-hydrolyzed formulas were not detectable (p<0.00001). Similarly, a Fisher’s exact test applied to all participant samples with quantifiable cysteine concentrations; and all samples from partially hydrolyzed samples was also highly significant (p<0.00001). |
Discussion and Conclusion
Discussion and Strengths of the Study
This is the first study to assess the effect of L-cysteine supplements, on cysteine concentration in breast milk and blood plasma of breastfeeding mothers. There was, at most, a minimal effect of oral L-cysteine on blood plasma cysteine level, which is a strong argument against further development of oral L-cysteine administration as a dietary supplement to prevent PPD. Overall, there was no effect of oral L-cysteine on total cysteine levels in breast milk which is consistent with effects of other amino acids on their concentration in breast milk, as it is known that 95–99% of amino acids in breast milk are contained within proteins and peptides, with only a small portion being free amino acids.42–44 Free cysteine levels in breast milk rose at a statistical level, but not to the level of extensively hydrolyzed infant formulas.
There was no statistical effect of oral L-cysteine on its overall level in blood plasma across the 6 hours after administration. This is in contrast to Tribble et al who reported that oral administration of a comparable dose was associated with an elevation in blood plasma cysteine that peaked at approximately 30 minutes to 1 hour after administration. Given the finding of Tribble et al, in the present study, a post hoc analysis was done comparing the plasma cysteine concentration between participants receiving 3g and participants receiving no supplement at 30 minutes and 1 hour post oral L-cysteine administration. There was trend level difference, uncorrected for multiple comparisons, reflecting a 10% to 30% greater cysteine level. However, this difference was not maintained thereafter. The difference between our study and Tribble et al might be accounted by the sample being different with the current study sampling breastfeeding mothers, but more likely this reflects another difference in the protocol design as Tribble et al administered a low-protein diet to participants for 5 days. Hence, their baseline L-cysteine level is relatively low even though the peak L-cysteine level is similar to the present study. The magnitude of peak change in the present study is modest as compared to oral administration of tryptophan at 2g or tyrosine at 10g to breastfeeding mothers which may achieve 600% to 700% greater free amino acid levels in the blood plasma of mothers who breastfeed.42,43 It is possible that greater effect on plasma cysteine level might have been achieved with higher dosing of cysteine, but there are limited data for tolerability of oral L-cysteine above single doses of 3g. Hence, the minimal effect of oral L-cysteine on overall cysteine levels in blood plasma argues against development of oral L-cysteine as a dietary supplement in general, at least at the dosages and formulation applied.
There was a lack of effect of oral L-cysteine on its total level in breast milk but a significant effect on its free level. The lack of effect of oral cysteine administration on its total concentration in breast milk may be attributable to the cysteine contained in proteins, which has been observed with supplementation of tryptophan at oral doses up to 4g and tyrosine at oral doses up to 10g.42,43 However, it is possible that the modest effect of oral supplementation on the plasma level of cysteine is also a factor. On the other hand, greater transfer of cysteine to breast milk from the minimally significant elevation of free cysteine level in plasma at 30 minutes is probably the best explanation for the subsequent elevation of free cysteine concentration in breast milk. Amino acid concentration in milk is believed to be influenced by the concentration of amino acids in arterial plasma, the mammillary flow rate of arterial plasma and amino acid extraction/transport into breast milk.45,46 Even though the rise in free cysteine level in breast milk after oral administration of L-cysteine was statistically significant, the magnitude was low relative to concentrations of cysteine found in hydrolyzed infant formulas, which represent a safe form of nutrition. Partially hydrolyzed and non-hydrolyzed infant formulas, which were also intended to be comparators, did not have appreciable levels of free cysteine.
Limitations
There were some limitations in this study. Participants were not blinded to condition and those allocated to group 1 did not receive any product. However, the measurement of cysteine within the individual blood plasma and breast milk samples were blinded to the group sampled. Also, the assays after oral L-cysteine administration were carried to 6 to 8 hours, but the measurements were consistently near baseline at these later time points. We also prioritized the extensively hydrolyzed infant formulas as comparators for the free concentration of cysteine in breast milk, rather than the partially or non-hydrolyzed formulas, because, in contrast to breast milk with no supplement, there was no detectable cysteine in these formulas.
Conclusion
This study found no effect of cysteine on its total concentration in breast milk and a minimal effect on its free concentration in breast milk that was low compared to extensively hydrolyzed infant formulas. However, the effect of oral cysteine on its plasma concentration was mostly non-significant, arguing against further development of L-cysteine in postpartum supplementation to prevent or reduce symptoms of PPD. The latter finding also raises the issue that oral L-cysteine supplementation does not raise its level in blood plasma much, suggesting that this should not be a major direction for new nutraceutical development.
Clinical Trial Registration Number
NCT02462746.
While we would like to share de-identified participant data, we do not have this explicit permission from the participants in our consent forms for this study. Presently, the local ethical standard is to have this included in the consent forms and we include this in our ongoing studies. However, when we did conduct the submitted study, it was not an expectation to detail this in the consent forms. However, we are bound by current standards rather than past standard. So, it will not be possible to share de-identified data.
We can share the mean and standard deviations for each main graph, and these are now included in the submitted supplemental section.
Funding
This work was supported by Centre for Addiction and Mental Health (CAMH) Foundation.
Disclosure
Dr Yekta Dowlati is developing natural health products to overcome high MAO-A state in early postpartum.
Dr Jeffrey H. Meyer has been a consultant to Mylan, Lundbeck, Takeda, in the past 5 years. He is an inventor on five patents (processed or filed) including blood markers to predict brain inflammation or to diagnose affective disorders, and a dietary supplement to reduce depressed mood post-partum. None of these companies participated in the funding, design or execution of this study or writing the manuscript. Dr Meyer is developing natural health products to treat high-risk states for MDE and is the inventor on patent applications for a dietary supplement for preventing depressed mood states.
Maxim Maheux does not have any conflict of interest. The authors report no other conflicts of interest in this work.
References
1. Durackova Z. Some current insights into oxidative stress. Physiol Res. 2010;59(4):459–469.
2. Moylan S, Berk M, Dean OM, et al. Oxidative & nitrosative stress in depression: why so much stress? Neurosci Biobehav Rev. 2014;45:46–62. doi:10.1016/j.neubiorev.2014.05.007
3. Jones DP. Redefining oxidative stress. Antioxid Redox Signal. 2006;8(9–10):1865–1879. doi:10.1089/ars.2006.8.1865
4. Sims-Robinson C, Hur J, Hayes JM, et al. The role of oxidative stress in nervous system aging. PLoS One. 2013;8(7):e68011. doi:10.1371/journal.pone.0068011
5. Maes M, Galecki P, Chang YS, Berk M. A review on the oxidative and nitrosative stress (O&NS) pathways in major depression and their possible contribution to the (neuro)degenerative processes in that illness. Prog Neuropsychopharmacol Biol Psychiatry. 2011;35(3):676–692. doi:10.1016/j.pnpbp.2010.05.004
6. Halliwell B. Biochemistry of oxidative stress. Biochem Soc Trans. 2007;35(5):1147–1150. doi:10.1042/BST0351147
7. Fraunberger EA, Scola G, Laliberte VL, Duong A, Andreazza AC. Redox modulations, antioxidants, and neuropsychiatric disorders. Oxid Med Cell Longev. 2016;2016:4729192. doi:10.1155/2016/4729192
8. Salim S. Oxidative stress and psychological disorders. Curr Neuropharmacol. 2014;12(2):140–147. doi:10.2174/1570159X11666131120230309
9. World_Health_Organization. The Global Burden of Disease: 2004 Update. Switzerland: Department of Health Statistics and Informatics, Information Evidence and Research Cluster. WHO; 2008.
10. Vavakova M, Durackova Z, Trebaticka J. Markers of oxidative stress and neuroprogression in depression disorder. Oxid Med Cell Longev. 2015;2015:898393. doi:10.1155/2015/898393
11. Gawryluk JW, Wang JF, Andreazza AC, Shao L, Young LT. Decreased levels of glutathione, the major brain antioxidant, in post-mortem prefrontal cortex from patients with psychiatric disorders. Int J Neuropsychopharmacol. 2011;14(1):123–130. doi:10.1017/S1461145710000805
12. Sequeira A, Martin MV, Rollins B, et al. Mitochondrial mutations and polymorphisms in psychiatric disorders. Front Genet. 2012;3:103. doi:10.3389/fgene.2012.00103
13. Andreazza AC, Shao L, Wang JF, Young LT. Mitochondrial complex I activity and oxidative damage to mitochondrial proteins in the prefrontal cortex of patients with bipolar disorder. Arch Gen Psychiatry. 2010;67(4):360–368. doi:10.1001/archgenpsychiatry.2010.22
14. Elvsashagen T, Zuzarte P, Westlye LT, et al. Dentate gyrus-cornu ammonis (CA) 4 volume is decreased and associated with depressive episodes and lipid peroxidation in bipolar II disorder: longitudinal and cross-sectional analyses. Bipolar Disord. 2016;18(8):657–668. doi:10.1111/bdi.12457
15. Newton DF, Naiberg MR, Andreazza AC, Scola G, Dickstein DP, Goldstein BI. Association of lipid peroxidation and brain-derived neurotrophic factor with executive function in adolescent bipolar disorder. Psychopharmacology. 2017;234(4):647–656. doi:10.1007/s00213-016-4500-x
16. Mazereeuw G, Herrmann N, Andreazza AC, Khan MM, Lanctot KL. A meta-analysis of lipid peroxidation markers in major depression. Neuropsychiatr Dis Treat. 2015;11:2479–2491.
17. Scola G, McNamara RK, Croarkin PE, et al. Lipid peroxidation biomarkers in adolescents with or at high-risk for bipolar disorder. J Affect Disord. 2016;192:176–183. doi:10.1016/j.jad.2015.12.020
18. Sarandol A, Sarandol E, Eker SS, Erdinc S, Vatansever E, Kirli S. Major depressive disorder is accompanied with oxidative stress: short-term antidepressant treatment does not alter oxidative-antioxidative systems. Hum Psychopharmacol. 2007;22(2):67–73. doi:10.1002/hup.829
19. Andreazza AC, Kauer-Sant’anna M, Frey BN, et al. Oxidative stress markers in bipolar disorder: a meta-analysis. J Affect Disord. 2008;111(2–3):135–144. doi:10.1016/j.jad.2008.04.013
20. Brown NC, Andreazza AC, Young LT. An updated meta-analysis of oxidative stress markers in bipolar disorder. Psychiatry Res. 2014;218(1–2):61–68. doi:10.1016/j.psychres.2014.04.005
21. Masood A, Nadeem A, Mustafa SJ, O’Donnell JM. Reversal of oxidative stress-induced anxiety by inhibition of phosphodiesterase-2 in mice. J Pharmacol Exp Ther. 2008;326(2):369–379. doi:10.1124/jpet.108.137208
22. Bouayed J, Soulimani R. Evidence that hydrogen peroxide, a component of oxidative stress, induces high-anxiety-related behaviour in mice. Behav Brain Res. 2019;359:292–297. doi:10.1016/j.bbr.2018.11.009
23. Bouayed J, Rammal H, Soulimani R. Oxidative stress and anxiety: relationship and cellular pathways. Oxid Med Cell Longev. 2009;2(2):63–67. doi:10.4161/oxim.2.2.7944
24. Patki G, Solanki N, Atrooz F, Allam F, Salim S. Depression, anxiety-like behavior and memory impairment are associated with increased oxidative stress and inflammation in a rat model of social stress. Brain Res. 2013;1539:73–86. doi:10.1016/j.brainres.2013.09.033
25. Sacher J, Wilson AA, Houle S, et al. Elevated brain monoamine oxidase A binding in the early postpartum period. Arch Gen Psychiatry. 2010;67(5):468–474. doi:10.1001/archgenpsychiatry.2010.32
26. Youdim MB, Edmondson D, Tipton KF. The therapeutic potential of monoamine oxidase inhibitors. Nat Rev Neurosci. 2006;7(4):295–309.
27. Ou XM, Chen K, Shih JC. Monoamine oxidase A and repressor R1 are involved in apoptotic signaling pathway. Proc Natl Acad Sci U S A. 2006;103(29):10923–10928. doi:10.1073/pnas.0601515103
28. Dringen R. Metabolism and functions of glutathione in brain. Prog Neurobiol. 2000;62(6):649–671. doi:10.1016/S0301-0082(99)00060-X
29. Tribble DL, Jones DP, Ardehali A, Feeley RM, Rudman D. Hypercysteinemia and delayed sulfur excretion in cirrhotics after oral cysteine loads. Am J Clin Nutr. 1989;50(6):1401–1406. doi:10.1093/ajcn/50.6.1401
30. Tsakiris S, Parthimos T, Parthimos N, Tsakiris T, Schulpis KH. The beneficial effect of L-cysteine supplementation on DNA oxidation induced by forced training. Pharmacol Res. 2006;53(4):386–390. doi:10.1016/j.phrs.2006.01.008
31. Aydin S, Ozaras R, Uzun H, et al. N-acetylcysteine reduced the effect of ethanol on antioxidant system in rat plasma and brain tissue. Tohoku J Exp Med. 2002;198(2):71–77. doi:10.1620/tjem.198.71
32. Farr SA, Poon HF, Dogrukol-Ak D, et al. The antioxidants alpha-lipoic acid and N-acetylcysteine reverse memory impairment and brain oxidative stress in aged SAMP8 mice. J Neurochem. 2003;84(5):1173–1183. doi:10.1046/j.1471-4159.2003.01580.x
33. Andreassen OA, Dedeoglu A, Klivenyi P, Beal MF, Bush AI. N-acetyl-L-cysteine improves survival and preserves motor performance in an animal model of familial amyotrophic lateral sclerosis. Neuroreport. 2000;11(11):2491–2493. doi:10.1097/00001756-200008030-00029
34. Ferrari G, Yan CY, Greene LA. N-acetylcysteine (D- and L-stereoisomers) prevents apoptotic death of neuronal cells. J Neurosci. 1995;15(4):2857–2866. doi:10.1523/JNEUROSCI.15-04-02857.1995
35. Pillay J, Davis TJ. Physiology, Lactation. Treasure Island (FL): StatPearls Publishing; 2020.
36. World Medical Association Declaration of Helsinki. Recommendations guiding physicians in biomedical research involving human subjects. JAMA. 1997;277(11):925–926. doi:10.1001/jama.1997.03540350075038
37. Agostoni C, Carratu B, Boniglia C, Riva E, Sanzini E. Free amino acid content in standard infant formulas: comparison with human milk. J Am Coll Nutr. 2000;19(4):434–438. doi:10.1080/07315724.2000.10718943
38. Heine W, Radke M, Wutzke KD, Peters E, Kundt G. Alpha-Lactalbumin-enriched low-protein infant formulas: a comparison to breast milk feeding. Acta Paediatr. 1996;85(9):1024–1028. doi:10.1111/j.1651-2227.1996.tb14210.x
39. Henderson JW, Ricker RD, Cliff WI. Rapid, accurate, sensitive and reproducible HPLC analysis of amino acids. Amino Acid Anal Zorbax Eclipse. 2000;1100:1.
40. Moore S. On the determination of cystine as cysteic acid. J Biol Chem. 1963;238(1):235–237.
41. Faul F, Erdfelder E, Buchner A, Lang AG. Statistical power analyses using G*Power 3.1: tests for correlation and regression analyses. Behav Res Methods. 2009;41(4):1149–1160. doi:10.3758/BRM.41.4.1149
42. Dowlati Y, Ravindran AV, Maheux M, Steiner M, Stewart DE, Meyer JH. No effect of oral tyrosine on total tyrosine levels in breast milk: implications for dietary supplementation in early postpartum. Arch Womens Ment Health. 2014;17(6):541–548. doi:10.1007/s00737-014-0441-8
43. Dowlati Y, Ravindran AV, Maheux M, Steiner M, Stewart DE, Meyer JH. No effect of oral l-tryptophan or alpha-lactalbumin on total tryptophan levels in breast milk. Eur Neuropsychopharmacol. 2015;25(6):779–787. doi:10.1016/j.euroneuro.2015.03.005
44. Svanberg U, Gebre-Medhin M, Ljungqvist B, Olsson M. Breast milk composition in Ethiopian and Swedish mothers. III. Amino acids and other nitrogenous substances. Am J Clin Nutr. 1977;30(4):499–507. doi:10.1093/ajcn/30.4.499
45. Mepham TB. Amino acid utilization by lactating mammary gland. J Dairy Sci. 1982;65(2):287–298. doi:10.3168/jds.S0022-0302(82)82191-7
46. Rezaei R, Wu Z, Hou Y, Bazer FW, Wu G. Amino acids and mammary gland development: nutritional implications for milk production and neonatal growth. J Anim Sci Biotechnol. 2016;7:20. doi:10.1186/s40104-016-0078-8
 © 2020 The Author(s). This work is published and licensed by Dove Medical Press Limited. The full terms of this license are available at https://www.dovepress.com/terms.php and incorporate the Creative Commons Attribution - Non Commercial (unported, v3.0) License.
By accessing the work you hereby accept the Terms. Non-commercial uses of the work are permitted without any further permission from Dove Medical Press Limited, provided the work is properly attributed. For permission for commercial use of this work, please see paragraphs 4.2 and 5 of our Terms.
© 2020 The Author(s). This work is published and licensed by Dove Medical Press Limited. The full terms of this license are available at https://www.dovepress.com/terms.php and incorporate the Creative Commons Attribution - Non Commercial (unported, v3.0) License.
By accessing the work you hereby accept the Terms. Non-commercial uses of the work are permitted without any further permission from Dove Medical Press Limited, provided the work is properly attributed. For permission for commercial use of this work, please see paragraphs 4.2 and 5 of our Terms.