")
Back to Journals » OncoTargets and Therapy » Volume 12
The effect of MTHFD2 on the proliferation and migration of colorectal cancer cell lines
Authors Wei Y, Liu P, Li Q, Du J, Chen Y, Wang Y, Shi H, Wang Y, Zhang H, Xue W, Gao Y, Li D , Feng Y, Yan J , Han J, Zhang J
Received 1 April 2019
Accepted for publication 22 July 2019
Published 12 August 2019 Volume 2019:12 Pages 6361—6370
DOI https://doi.org/10.2147/OTT.S210800
Checked for plagiarism Yes
Review by Single anonymous peer review
Peer reviewer comments 3
Editor who approved publication: Dr Yao Dai
Yameng Wei,1,* Pengfei Liu,2,* Qian Li,3,* Juan Du,1 Yani Chen,1 Yu Wang,1 Haiyan Shi,1 Yanfeng Wang,1 Huahua Zhang,1 Wanjuan Xue,1 Yi Gao,1 Dan Li,1 Yun Feng,1 Jing Yan,1 Jiming Han,1 Jing Zhang1
1Department of Clinical Medicine, Medical College of Yan’an University, Yan’an 716000, People’s Republic of China; 2Department of Gastroenterology, Yan’an University Affiliated Hospital, Yan’an 716000, People’s Republic of China; 3Department of Cell Biology and Genetics, School of Basic Medical Sciences, Xi’an Jiaotong University Health Science Center, Xi’an 710061, People’s Republic of China
*These authors contributed equally to this work
Purpose: Methylenetetrahydrofolate dehydrogenase 2 (MTHFD2) is a tetramethylfolate dehydrogenase enzyme involved in folate metabolism. The aim of this study is to determine the effect of MTHFD2 on the proliferation and metastasis of colorectal cancer (CRC).
Patients and methods: MTHFD2 was silenced or overexpressed in CRC cells. qRT-PCR and Western blotting were used to analyze mRNA and protein expression, respectively. The MTT assay and colony forming assay were used to detect cell proliferation and colony formation ability. The cycle and apoptosis changes were detected by flow cytometry. Transwell experiments were used to analyze the migration ability of CRC cells.
Results: The expression of MTHFD2 in 31 kinds of cancers was analyzed by bioinformatics, and MTHFD2 was found highly expressed in various cancer cells including CRC cells. Silencing the expression of MTHFD2 resulted in inhibition of the proliferation of CRC cells, weakening of the migration ability, blocking of the cell cycle in G0/G1-S phase, and promotion of the apoptosis of CRC cells. On the contrary, overexpression of MTHFD2 in CRC cells resulted in enhancement of the proliferation and migration ability, promotion of cell cycle progression and inhibition of cell apoptosis.
Conclusion: MTHFD2 is positively related with colorectal cancer and the MTHFD2 gene is a tumor promoting gene in CRC cells.
Keywords: methylenetetrahydrofolate dehydrogenase 2, colorectal cancer, oncogene
Introduction
Colorectal cancer (CRC) is one of the most common human malignancies and one of the major causes of cancer-related death worldwide.1 According to the international agency for research on cancer, the incidence and mortality for CRC are 6.1% and 9.2%, respectively.2 In 2008, there were over 1.2 million new CRC cases and 608,700 deaths caused by CRC, making CRC the third and second most common cancer in males and females, respectively.3 The development of CRC involves the activation of oncogenes and inactivation of tumor-suppressor genes.4 The incidence of CRC has been reduced and the survival rate of patients has been improved; however, at least 90% of CRC deaths are caused by metastasis rather than primary solid tumors.5 This is in part due to the facts that classic chemotherapy can only target the primary tumor mass and that the molecular events leading to tumor metastasis are only partially known. Moreover, long term chemotherapy is associated with adverse side effects and drug resistance. Oxaliplatin is a class of platinum-based drug considered to be the most promising chemotherapy reagent for liver metastatic CRC. It is rapidly absorbed by cells and ample DNA-adduct formation occurs with dose limiting toxicity.6–8 In addition, clinical trials have shown that oxaliplatin alone is less effective compared to oxaliplatin combination therapy.9 It is therefore important to develop non-toxic reagents that can delay or prevent cancer metastasis.
MTHFD2 is a methylenetetrahydrofolate dehydrogenase, a key enzyme involved in folate metabolism.10 Folate is a water-soluble B vitamin and participates in a series of physiological and biochemical reactions such as deoxythymidylate, purine nucleotide formation and amino acid inter conversion. In the absence of folate, intracellular DNA synthesis is reduced, and cell division and maturation are inhibited.11 Similarly, CRC cells have strong proliferation ability and their growth is dependent on folate metabolism and MTHFD2. It is found that the rapidly proliferating non-transformed cells, including human bronchial epithelial cells and lymphocytes, did not consume glycine.12 This finding is especially important for cancer treatment, as we may target cancer cells by inhibiting the synthesis or absorption of glycine. In the folate metabolism, the synthesis of tetrahydrofolate is inhibited after MTHFD2 suppression, thereby inhibiting the synthesis of glycine. MTHFD2 is even considered to be one of the candidate marker genes for tumor invasion, metastasis and poor prognosis.13
In this study, the expression and role of MTHFD2 in CRC cell lines were analyzed, and the underlying molecular mechanisms of MTHFD2 in CRC were also investigated. Our findings may help to identify potential targets for the diagnosis and treatment of CRC.
Materials and methods
CRC cell lines
The human CRC cell lines (HCT116, RKO, CACO-2, SW-480, and SW-620) and a normal human colon mucosal epithelial cell line (NCM-460) were purchased from ATCC and cultured in Dulbecco’s modified Eagle’s medium (DMEM, PAA Laboratories, Australia) supplemented with 10% fetal bovine serum (FBS, PAA, Australia) and 1% penicillin/streptomycin in a humidified atmosphere with 5% CO2 and 95% air at 37°C.
Plasmid construction and cell transfection
To over express MTHFD2 in SW-480 and RKO cells, the cDNAs encoding human MTHFD2 were amplified (MTHFD2-F5ʹ-GATCCTGGTTGGCGAGAATCC-3ʹ, MTHFD2-R 5ʹ-TCTGGAAGAGGCAACTGAACA-3ʹ) and cloned into the expression Vector PVM3.0 (Origene Technologies Co. Ltd., USA) to construct the PVM3.0-MTHFD2 plasmid. Empty vector PVM3.0 was used as the control in the Gain-of-Function experiments. The constructed plasmid was verified by Shanghai Genechem Co, LTD (Shanghai, China).
To silence MTHFD2 in HCT116 and CACO-2 cells, two short hairpin RNAs (si1- MTHFD2 and si2- MTHFD2) were designed based on the sequence: 5ʹ-GAGCAGUUGAAGAAACAUAUU-3ʹ. Empty control RNA sequence was used as the control in the Loss-of-Function experiments. The RNA sequences were constructed and verified by GenePharma (Shanghai, China). Western blot was used to determine the silencing efficacy.
The cells were divided into over-MTHFD2 group (transfected with PVM3.0-MTHFD2) and over-control group (transfected with PVM3.0 vector) or si1-MTHFD2 (transfected with si1-MTHFD2) and si-RNA group (transfected with control siRNA). The plasmid DNAs and RNA sequence were transfected with X-treme GENE HP DNA Transfection Reagent (Roche, USA) according to the manufacturer’s instructions, and the transfection efficiency was determined by qRT-PCR.
Quantitative real-time PCR
Total RNA was isolated from cells with TRIzol reagent (Life Technologies, USA), and cDNA was then synthesized with the PrimeScript RT Reagent Kit, according to the manufacturer’s protocol (TAKARA, Japan). Quantitative real-time PCR (qRT-PCR) was performed using SYBR Green Ex Taq™ II (TAKARA, Japan) on the IQ5 Optical System real-time PCR instrument (BIO-RAD, USA). The primer sequences were MTHFD2-F5ʹ-GATCCTGGTTGGCGAGAATCC-3ʹ, MTHFD2-R5ʹ-TCTGGAAGAGGCAACTGAACA-3ʹ; and β- actin-F5ʹ-TGAAGGTCGGAGTCAACGGATT-3ʹ, β- actin-R5ʹ CCTGGAAGATGGTGATGGGATT-3ʹ. The relative expression of genes was calculated with the 2−ΔΔCt method.14
Western blot
Total proteins were extracted with RIPA lysis buffer (Wolsen Biotech, Xi’an, China) from cells at 48 h after transfection, and separated by 10% SDS polyacrylamide gels. The proteins were then electrophoretically transferred to polyvinylidene difluoride membranes (Merck Millipore Co., MA, USA). After incubating with primary antibodies at 4°C overnight and secondary antibodies for 2 h at room temperature, the membranes were visualized with an enhanced chemiluminescence detection system (UVP, USA). The primary antibodies included: rabbit anti-human CDK4 mAb (working dilutions: 1:1000; Cat # 11026–1-AP, Proteintech, China), rabbit anti-human CDK6 mAb (working dilutions: 1:1,000; Cat # 40135, Proteintech, China), mouse anti-human CyclinD1 mAb (working dilutions: 1:1,000; Cat # 60186–1, Proteintech, China), rabbit anti-human MTHFD2 mAb (working dilutions: 1:1,000; Cat #12270–1 Proteintech, China), rabbit anti-human CyclinE1 mAb (working dilutions: 1:1000; Cat # 11554–1, Proteintech, China), and rabbit anti-human CylinA2 mAb (working dilutions: 1:1,000; Cat # 18202–1, Proteintech, China).
Cell proliferation assay
The 3-(4,5-dimethylthiazol-2-yl)-2,5-diphenyl-tetrazolium bromide (MTT) assay was performed to investigate the effect of MTHFD2 silencing in RKO and SW-480 (or MTHFD2 overexpression in HCT116 and CACO-2) on the proliferation ability. Cells were seeded at a density of 4×10³ cells/well into 96-well plates and transfected on the following day. Then, 10 μL of MTT solution (5 mg/mL) was added to each well (Sigma, USA) at 24, 48 and 72 h, and incubation was continued for another 4 h. After that, the supernatant was discarded and 150 μL of dimethyl sulfoxide (DMSO) was added to the cells. The absorbance was measured at 570 nm by a high-throughput universal microplate assay (BMG Lab Technologies, Germany).
Colony-forming assay
Stably transfected cells were seeded at a density of 1×10³ cells/well in 6-well plate and incubated for 1–2 weeks. The colorectal cells were stained with 4% paraformaldehyde for 15 mins and rinsed once with PBS. The colorectal cells were stained with 0.1% crystal violet for 30 mins, and the colonies were observed and photographed with an inverted microscope.
Cell migration assay
First, cells were transfected as described above. After 24 h, 600 μL/well of medium containing 10% FBS was added to a 24-well plate. Then, the plate was gently placed into a transwell chamber and medium with 1% FBS was used to prepare 200 μL suspension containing 40,000 cells within the chamber, which was incubated for 24–48 h. Finally, the cells were fixed with 4% paraformaldehyde, stained with 0.1% crystal violet, and washed with PBS before data collection.
Flow cytometry
To determine the cell cycle distribution of cells, the cells were cultured in 12-well plates at a density of 1×10⁵ cells/well. After 24 h, cells were transfected as described above. Twenty-four hours after transfection, cells were harvested by trypsinization, washed with PBS and fixed in 75% ice-cold ethanol overnight at 4°C. Afterwards, the cells were washed with PBS and incubated with 300 μL of staining solution (20 mg/mL propidium iodide and 10 U/mL RNase A) for 30 mins at room temperature. Cell cycle distributions were assessed by a fluorescence-activated cell sorting-based flow cytometer (Becton-Dickinson, USA).
Cell apoptosis analysis was performed with Annexin-V FITC Apoptosis Detection Kit (Life Technologies, USA), according to the manufacturer’s instructions. The cells were cultured in 12-well plates at a density of 1×10⁵ cells/well, and transfected as described above for 48 h. After that, the cells were collected and stained with the Apoptosis Detection Kit and then examined by the flow cytometer (Becton-Dickinson, USA). The right lower quadrant indicates early apoptotic cells (Annexin V-FITC+/PI−) and the right upper quadrant (Annexin V-FITC+/PI+) indicates late apoptotic cells.
Statistical analysis
PASW Statistics 18 software (SPSS Inc., Chicago, IL, USA) was used for statistical analysis. Each experiment was repeated at least three times independently. Data were presented as the mean ± standard deviation (SD). Comparison between two groups was performed with Student’s t-test. A P-value less than 0.05 was considered to be statistically significant.
Results
MTHFD2 is upregulated in CRC cell lines
The Cancer Genome Atlas project (TCGA) was used to analyze the expression of MTHFD2 in cancer tissues. Among the 31 human cancer cell lines, 25 of them (80.6%) had a higher expression of MTHFD2 in cancer tissues compared to the corresponding non-tumor tissues, including CRC (Figure 1A). TCGA database ggstatsplot analysis showed that MTHFD2 exhibited a significantly higher expression in 288 CRC tissues compared to 41 non-tumor tissues (Figure 1B). To determine whether MTHFD2 was a putative oncogene in CRC, qRT-PCR analysis was performed to detect the expression levels of MTHFD2 in CRC cell lines. As shown in Figure 1C, compared with the normal cell line NCM-460, the expression level of MTHFD2 was significantly upregulated in SW-480 cells (fold change =1.97) and was particularly significantly higher in RKO (fold change =2.98), SW-620 (fold change =3.51), CACO-2 (fold change =3.97) and HCT116 (fold change =4.32) cell lines (P<0.05). Furthermore, the expression levels of MTHFD2 in CRC cell lines were analyzed by Western blot. MTHFD2 showed the highest expression in CRC cells compared with NCM-460 cells (Figure 1D). This indicates that MTHFD2 is highly expressed in a variety of cancers and is also highly expressed in CRC cells. Based on the expression level of MTHFD2 in different cell lines, HCT116 and CACO-2 cells were used to silence MTHFD2 while RKO and SW-480 cells were used to stimulate the expression of MTHFD2, in order to further investigate the role of MTHFD2 in CRC cell lines.
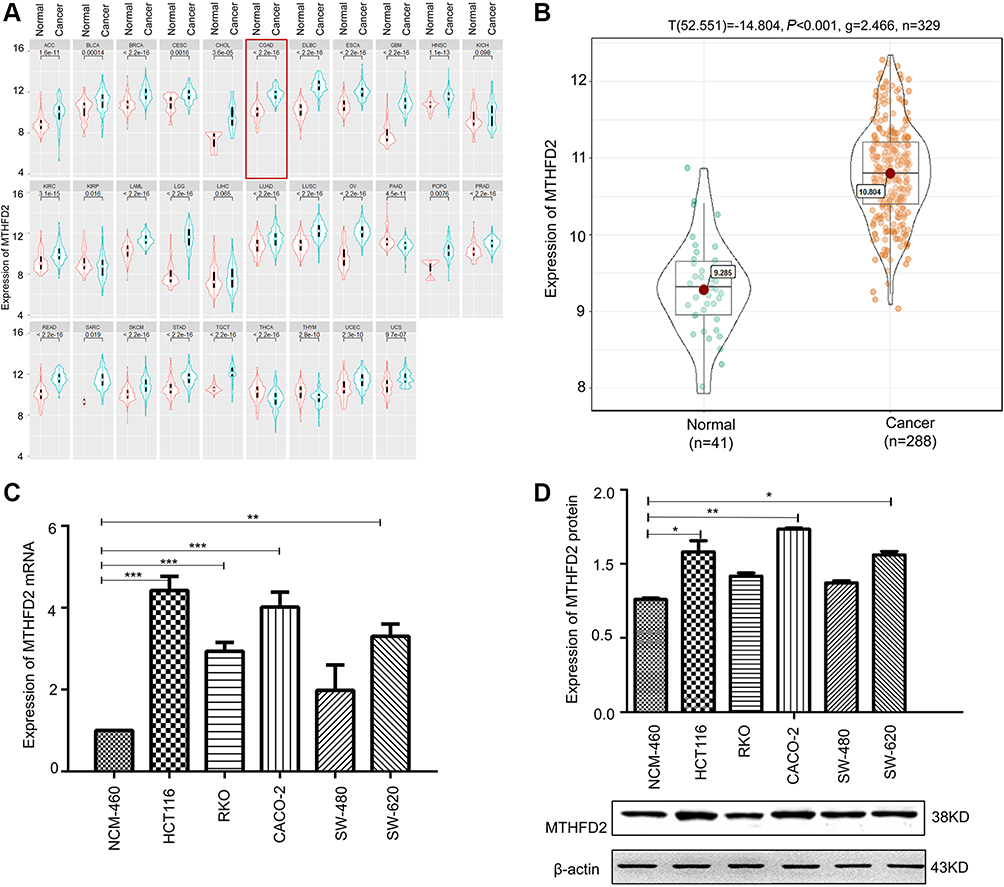 |
Figure 1 The expression of MTHFD2 in colorectal cancer (CRC) was up-regulated. (A) The expression of MTHFD2 in different types of human tumors within The Cancer Genome Atlas (TCGA). (B) The expression of MTHFD2 in CRC tissues (n=288) and normal tissues (n=35) in TCGA database. (C) The MTHFD2 mRNA and (D) protein expression levels were measured in CRC cell lines and a normal colon epithelial cell line (NCM-460). The intensity of each band was quantified, and β-actin was used as a housekeeping control (*P<0.05, **P<0.01, ***P<0.001, compared to the control group).Abbreviations: MTHFD2, Methylenetetrahydrofolate dehydrogenase 2; CRC, colorectal cancer. |
Knockdown of MTHFD2 suppresses cell proliferation and cell migration in HCT116 and CACO-2 cells
To determine the silencing efficacy of si1-MTHFD2 and si2-MTHFD2, Western blot was performed. As shown in Figure 2A, MTHFD2 expression was knocked down by si1-MTHFD2 and si2-MTHFD2 in both cell lines. However, the level of MTHFD2 after si1-MTHFD2 transfection was lower than that after si2-MTHFD2 transfection, suggesting that si1-MTHFD2 has better silencing efficacy than si2-MTHFD2. Thus, si1-MTHFD2 was used for further analysis. To investigate the effect of silencing MTHFD2 expression on cell proliferation and migration in CRC cell lines, MTT, colony-forming and transwell assays were performed. The qRT-PCR and Western blot showed that MTHFD2 was successfully silenced in both HCT116 and CACO-2 cell lines after transfection with si1-MTHFD2 (Figure 2B). HCT116 and CACO-2 transfected with si1-MTHFD2 grew more slowly than control cells (P<0.01). Silencing of MTHFD2 reduced cell clone formation (Figure 2C), cell viability (Figure 2D) and cell migration ability of HCT116 and CACO-2 (Figure 2E). These results indicate that silencing the expression of MTHFD2 could reduce cell proliferation and migration ability of HCT116 and CACO-2 cells.
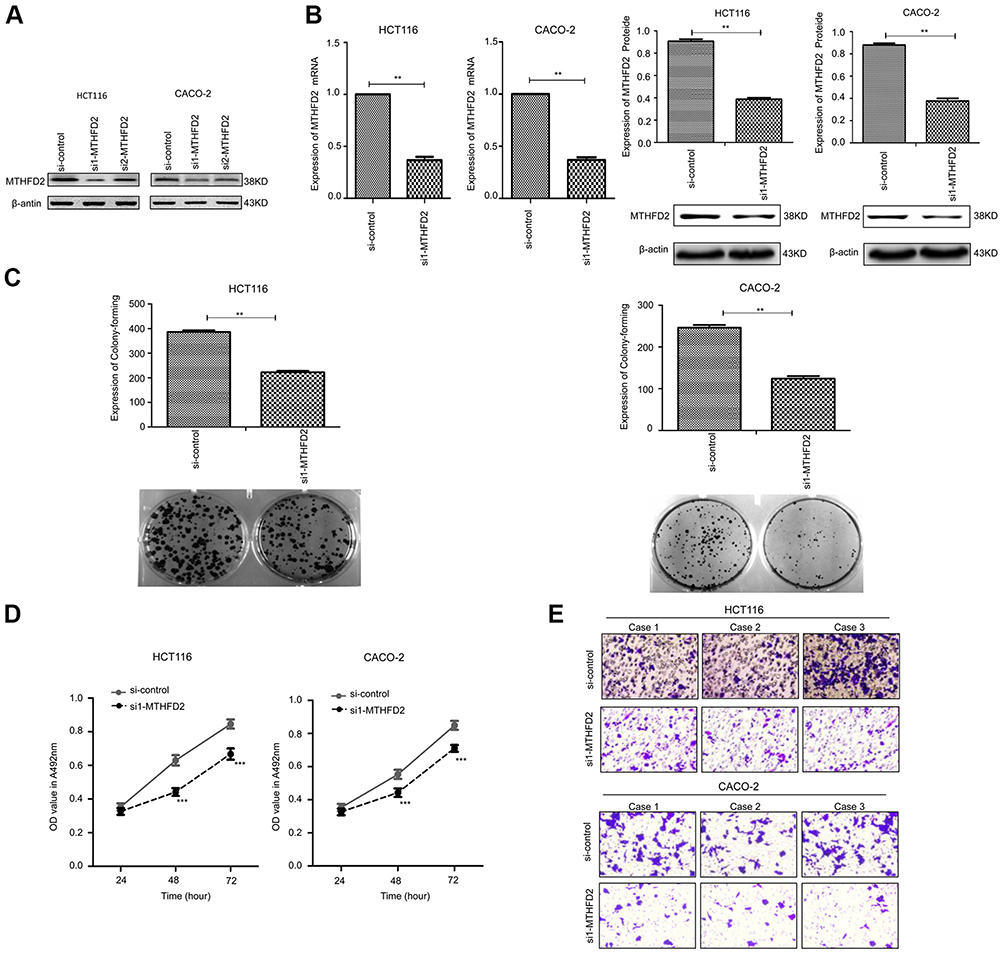 |
Figure 2 Silencing MTHFD2 in CRC cells HCT116 and CACO-2 inhibited the proliferation and migration of cells. (A) HCT116 and caco-2 were transfected with si1- MTHFD2 and si2-MTHFD2, respectively. Silencing efficacy was detected with Western blot. (B) MTHFD2 mRNA and protein expression levels were measured in HCT116 and CACO-2 cells after transfection with si1-MTHFD2. (C) Colony-forming experiment showed the cell proliferative capacity of HCT116 and CACO-2 after transfection with si1-MTHFD2. (D) MTT assay analysis showed the cell growth of HCT116 and CACO-2 after transfection with si1-MTHFD2. (E) Transwell cell migration assay showed the cell migratory ability of HCT116 and CACO-2 after transfection with si1-MTHFD2. (**P<0.01, ***P<0.001, compared to the control group).Abbreviations: MTHFD2, Methylenetetrahydrofolate dehydrogenase 2; CRC, colorectal cancer. |
Knockdown of MTHFD2 inhibits G0/G1-S phase transition and promotes cell apoptosis in HCT116 and CACO-2 cells
To further investigate the mechanisms by which MTHFD2 inhibits cell proliferation, flow cytometry was performed to analyze the cell cycle and apoptosis of CRC cell lines after transfection with si1-MTHFD2. As shown in Figure 3A, MTHFD2 knockdown resulted in a remarkable delay of G0/G1-S phase in HCT116 and CACO-2 cells, suggesting that silencing of MTHFD2 can delay G0/G1-S phase transition of HCT116 and CACO-2 cells. Consistently, Western blot showed that the expression of G0/G1-S phase-related proteins after transfection of si1-MTHFD2 was reduced (Figure 3B). Furthermore, the rates of early (Annexin V-FITC+/PI-) and late apoptosis (Annexin V-FITC+/PI+) in HCT116 and CACO-2 cells after transfection of si1-MTHFD2 were found to be higher than the control (Figure 3C), suggesting that silencing of MTHFD2 can promote apoptosis of HCT116 and CACO-2 cells.
 |
Figure 3 Silencing MTHFD2 in CRC cells HCT116 and CACO-2 blocked the cell cycle in G0/G1-S phase, and promoted apoptosis. (A) The cell cycle was analyzed by flow cytometry in HCT116 and CACO-2 after transfection with si1-MTHFD2. (B) Western blot showed the expression of G0/G1-S-related genes. (C) Cell apoptosis was analyzed by flow cytometry in HCT116 and CACO-2 after transfection with si1-MTHFD2. (*P<0.05, **P<0.01, ***P<0.001, compared to the control group).Abbreviations: MTHFD2, Methylenetetrahydrofolate dehydrogenase 2; CRC, colorectal cancer. |
Overexpression of MTHFD2 promotes cell proliferation and migration ability in RKO and SW-480 cells
The effect of MTHFD2 overexpression on cell proliferation and migration in CRC cell lines was investigated. RKO and SW-480 cells were transfected with the MTHFD2 plasmid or control. qRT-PCR and Western blot confirmed that the expression levels of MTHFD2 in both RKO and SW-480 cells after transfection with the MTHFD2 plasmid were increased (Figure 4A), indicating that MTHFD2 was successfully overexpressed in RKO and SW-480 cells. Thereafter, MTT, colony-forming and transwell assays were performed to detect cell viability and migration ability. RKO and SW-480 cells with MTHFD2 over-expression grew more rapidly than the control cells (P<0.05), and MTHFD2 over-expression promoted clone formation (Figure 4B), cell viability (Figure 4C) and cell migration (Figure 4D). These results indicate that overexpressing MTHFD2 could promote cell proliferation and migration of RKO and SW-480 cells.
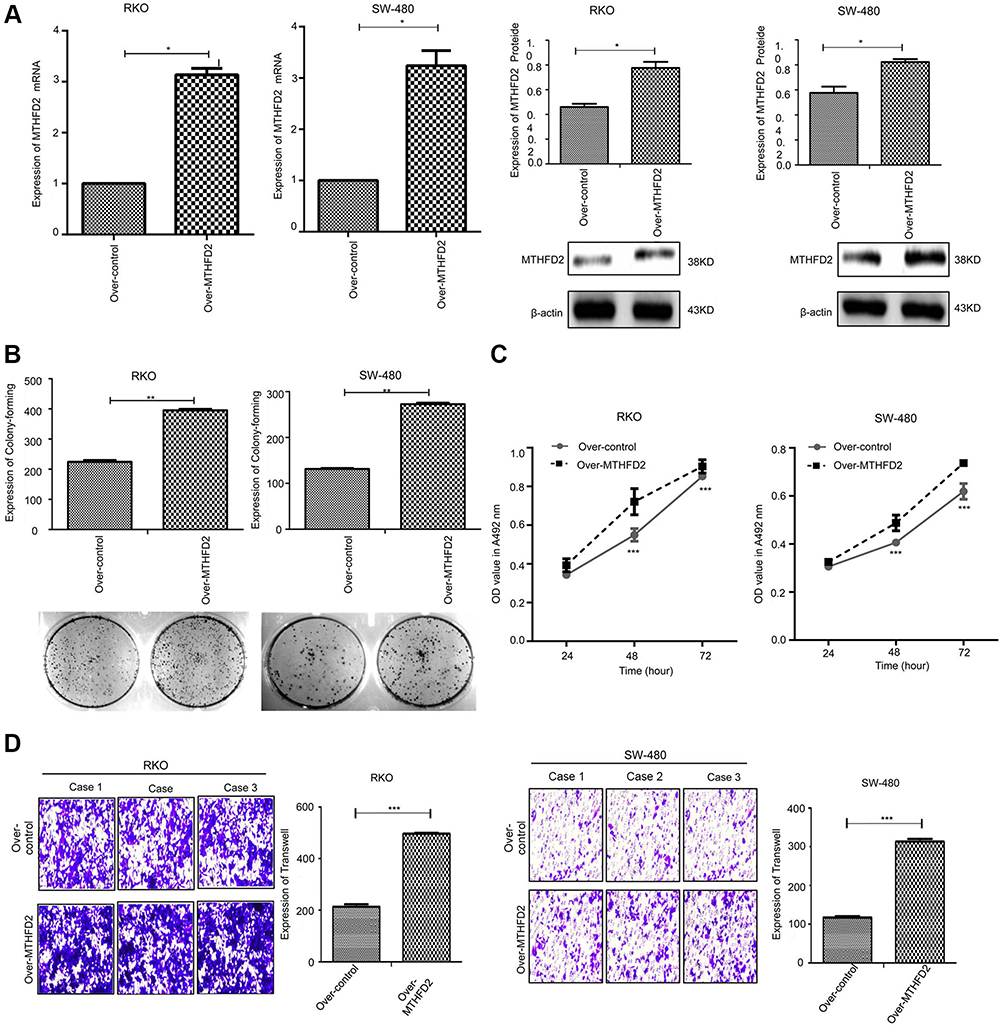 |
Figure 4 Overexpression of MTHFD2 in CRC cell RKO and SW-480 promoted cell proliferation and migration. (A) MTHFD2 mRNA and protein expression levels were measured in RKO and SW-480 cells after transfection with the MTHFD2 vector. (B) Colony-forming experiment showed the cell proliferative capacity of RKO and SW-480 cells after overexpression of MTHFD2. (C) MTT assay analysis showed the cell growth of RKO and SW-480 cells after overexpression of MTHFD2. (D) Transwell cell migration assay showed the cell migration ability of RKO and SW-480 cells after overexpression of MTHFD2. (*P<0.05, **P<0.01, ***P<0.001, compared with the control group).Abbreviations: MTHFD2, Methylenetetrahydrofolate dehydrogenase 2; CRC, colorectal cancer. |
Overexpression of MTHFD2 increases cells at M phase and inhibits cell apoptosis of RKO and SW-480 cells
Flow cytometry was used to determine cell cycle and apoptosis after MTHFD2 overexpression. As shown in Figure 5A, compared with the control group, the percentage of RKO cells in the S (P<0.05) and M (P<0.01) phase was significantly higher after overexpression of MTHFD2. The percentage of SW-480 cells in the S and M (P<0.01) phase was also significantly higher after overexpression of MTHFD2, indicating that MTHFD2 promotes cell cycle progression of RKO and SW-480 cells. The results of Western blot showed that the expression of G0/G1-S proteins (CDK4, CDK6, CyclinA2, CyclinE, CyclinD1) increased (Figure 5B), which was consistent with the results of the cell cycle. Furthermore, the rates of early (Annexin V-FITC+/PI-) and late apoptosis (Annexin V-FITC+/PI+) in RKO and SW-480 cells after overexpression of MTHFD2 were significantly lower than those in the control cells (Figure 5C), suggesting that overexpression of MTHFD2 can inhibit cell apoptosis of RKO and SW-480 cells.
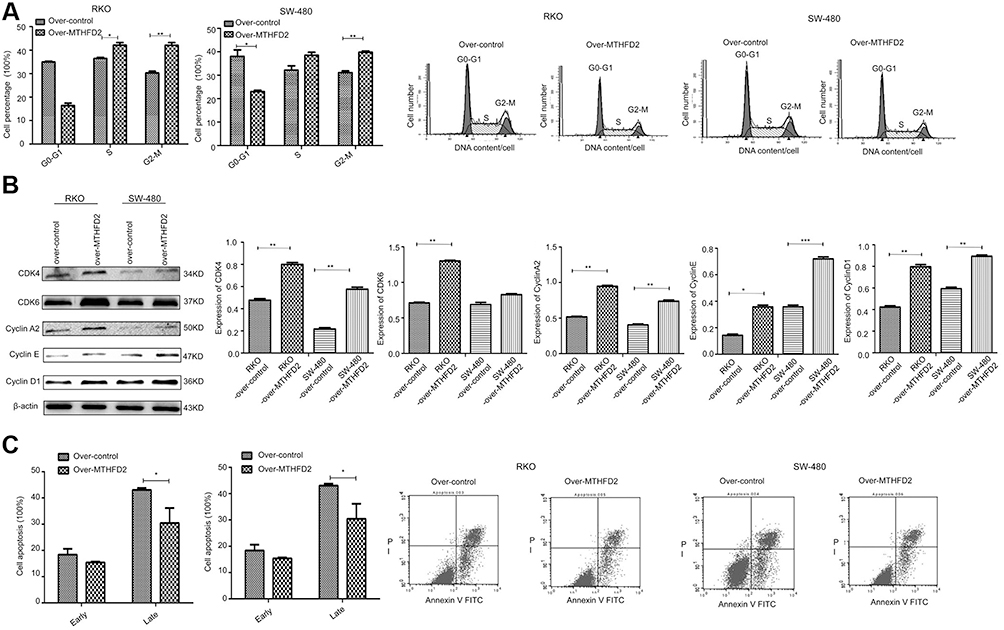 |
Figure 5 Overexpression of MTHFD2 in CRC cell RKO and SW-480 inhibited cell apoptosis, and increased the M phase of cell cycle. (A) The cell cycle was measured by flow cytometry in RKO and SW-480 cells after transfection with the MTHFD2 vector. (B) Western blot showed the expression of G0/G1-S-related genes. (C) Cell apoptosis was measured by flow cytometry in RKO and SW-480 cells after the overexpression of MTHFD2. (*P<0.05, **P<0.01, ***P<0.001, compared with the control group).Abbreviations: MTHFD2, Methylenetetrahydrofolate dehydrogenase 2; CRC, colorectal cancer. |
Discussion
CRC poses a serious threat to human health, and its incidence is increasing year by year. The current treatment methods are mainly surgical resection, chemotherapy and radiotherapy. Molecules involved in each step of cancer development are potential prognostic and therapeutic markers.15 Therefore, a better understanding of the molecular mechanisms involved in CRC development will be beneficial to the identification of novel therapeutic targets and the development of effective treatment strategies for CRC.14,16–20 Herein, we identified MTHFD2 as a candidate oncogene for CRC occurrence and development.
In this study, through bioinformatics analysis, we found that MTHFD2 was overexpressed in various cancers. Li et al found that MTHFD2 was associated with cancer.21 Angeline et al suggested that MTHFD2 was a gene that increased the risk associated with methylation metabolic variants and caused bladder cancer.22 Sophia et al showed that MTHFD2 was a candidate gene in breast cancer.23 MiR-9 displayed tumor suppressor-like activity in breast cancer cells by direct targeting MTHFD2.24 Nirmalya et al found that Ewing sarcoma (EWS)-FLI1 positively regulated the expression of the glutamine transporter SLC1A5, and two enzymes, MTHFD2 and MTHFD1L, were involved in the one-carbon cycle. Inhibition of serine-glycine biosynthesis in EWS cells affected their redox state, leading to an accumulation of reactive oxygen species, DNA damage, and apoptosis.25 Nevertheless, the role of MTHFD2 in the pathogenesis of CRC remains unclear.
Bioinformatics also found that MTHFD2 was overexpressed in various CRC cell lines. Thus, we used PCR and Western blot to compare MTHFD2 expression between colon cancer cells and normal colonic epithelial cells. The expression of MTHFD2 in CRC cells was higher than that in normal cells. It has been reported that MTHFD2 is a key enzyme in folate metabolism, participates in a series of physiological and biochemical reactions such as deoxythymidylate, purine nucleotide formation and amino acid inter conversion.11 Kinetic analysis clearly supports a role of MTHFD2 in mitochondrial NADPH production, indicating that this enzyme is likely responsible for mitochondrial production of both NADH and NADPH in rapidly proliferating cells.26 Colon cancer cells are actively dividing cells and their growth is dependent on MTHFD2. In this study, knockdown of MTHFD2 in CRC cells reduced the migration and proliferation of CRC cells, and the cell cycle was arrested at G1-S phase. On the contrary, overexpression of MTHFD2 in CRC cells promoted cell proliferation and migration. The cells at S and M phases increased, and the cell division ability enhanced. This demonstrates that MTHFD2 is associated with CRC and is a cancer-promoting gene in CRC.
Conclusion
In summary, MTHFD2 is positively related with colorectal cancer and the MTHFD2 gene is a tumor-promoting gene in CRC cells.
Abbreviations
MTHFD2, Methylenetetrahydrofolate dehydrogenase 2; CRC, colorectal cance; MTT, 3-(4,5-dimethylthiazol-2-yl)-2,5-diphenyl-tetrazolium bromide.
Data availability
The datasets used and/or analysed during the current study are available from the corresponding author on reasonable request.
Acknowledgments
We thank all the members of the Biomedical Experimental Center of Xi’an Jiaotong University for the discussion and support and for the critical reading of the manuscript. This work was supported by the National Natural Science Foundation of China (Grant No. 81660492, 81860444 and 81760510), Shaanxi Innovative Talents Promotion Plan-Science and Technology New Star Project (Grant No. 2017KJXX-20), Yan’an City Science and Technology Research Development Planning Project (No. 2016KS-06) and Scientific Research Plan Projects of Yan’an University (Grant No. YDBK2018-49, YD2015-15 and YDT2016-03).
Author contributions
All authors contributed to data analysis, drafting or revising the article, gave final approval of the version to be published, and agree to be accountable for all aspects of the work.
Disclosure
The authors report no conflicts of interest in this work.
References
1. Barker N, van Es JH, Kuipers J, et al. Identification of stem cells in small intestine and colon by marker gene Lgr5. Nature. 2007;449(7165):1003–1007. doi:10.1038/nature06196
2. Bray F, Ferlay J, Soerjomataram I, Siegel RL, Torre LA, Jemal A. Global cancer statistics 2018: GLOBOCAN estimates of incidence and mortality worldwide for 36 cancers in 185 countries. CA Cancer J Clin. 2018;68(6):394–424. doi:10.3322/caac.21492
3. Jemal A, Bray F, Center MM, Ferlay J, Ward E, Forman D. Global cancer statistics. CA Cancer J Clin. 2011;61(2):69–90. doi:10.3322/caac.20107
4. Markle B, May EJ, Majumdar APN. Do nutraceutics play a role in the prevention and treatment of colorectal cancer? Cancer Metastasis Rev. 2010;29(3):395–404. doi:10.1007/s10555-010-9234-3
5. Gupta GP, Massague J. Cancer metastasis: building a framework. Cell. 2006;127(4):679–695. doi:10.1016/j.cell.2006.11.001
6. Extra JM, Marty M, Brienza S, Misset JL. Pharmacokinetics and safety profile of oxaliplatin. Semin Oncol. 1998;25(2 Suppl 5):13–22.
7. Iersel LV, Koudijs TM. In vitro schedule-dependent interaction between melphalan and oxaliplatin in human colorectal cancer cell lines. J Surg Res. 2011;167(2):273–278. doi:10.1016/j.jss.2009.07.007
8. Raymond E, Chaney SG, Taamma A, Cvitkovic E. Oxaliplatin: a review of preclinical and clinical studies. Ann Oncol. 1998;9(10):1053–1071. doi:10.1023/a:1008213732429
9. Rothenberg ML, Oza AM, Bigelow RH, et al. Superiority of oxaliplatin and fluorouracil-leucovorin compared with either therapy alone in patients with progressive colorectal cancer after irinotecan and fluorouracil-leucovorin: interim results of a phase III trial. J Clin Oncol. 2003;21(11):2059–2069. doi:10.1200/JCO.2003.11.126
10. MacKenzie RE. Folates and Pterins: Chemistry and Biochemistry of Folates. New York: Wiley Interscience; 1984.
11. Mattaini KR, Sullivan MR, Vander Heiden MG. The importance of serine metabolism in cancer. J Cell Biol. 2016;214(3):249–257. doi:10.1083/jcb.201604085
12. Ducker GS, Rabinowitz JD. One-carbon metabolism in health and disease. Cell Metab. 2017;25(1):27–42. doi:10.1016/j.cmet.2016.08.009
13. Tibbetts AS, Appling DR. Compartmentalization of mammalian folate-mediated one-carbon metabolism. Annu Rev Nutr. 2010;30(30):57–81. doi:10.1146/annurev.nutr.012809.104810
14. Bertucci F, Salas S, Eysteries S, et al. Gene expression profiling of colon cancer by DNA microarrays and correlation with histoclinical parameters. Oncogene. 2004;23(7):1377–1391. doi:10.1038/sj.onc.1207262
15. Ramanathan RK, Clark JW, Kemeny NE, et al. Safety and toxicity analysis of oxaliplatin combined with fluorouracil or as a single agent in patients with previously treated advanced colorectal cancer. J Clin Oncol. 2003;21(15):2904–2911. doi:10.1200/JCO.2003.11.045
16. Arango D, Laiho P, Kokko A, et al. Gene-expression profiling predicts recurrence in Dukes’ C colorectal cancer. Gastroenterology. 2005;129(3):874–884. doi:10.1053/j.gastro.2005.06.066
17. Eschrich S, Yang I, Bloom G, et al. Molecular staging for survival prediction of colorectal cancer patients. J Clin Oncol. 2005;23(15):3526–3535. doi:10.1200/JCO.2005.00.695
18. Salazaar R, Bender RA, Bruin S. Development and validation of a robust high-through put gene expression test (Coloprint) for risk stratification of colon cancer patients. Gastrointestinal Cancers Symp. 2010;21:22–24.
19. Wang Y, Jatkoe T, Zhang Y, et al. Gene expression profiles and molecular markers to predict recurrence of Dukes’ B colon cancer. J Clin Oncol. 2004;22(9):1564–1571. doi:10.1200/JCO.2004.08.186
20. Kusaba T, Nakayama T, Yamazumi K, et al. Expression of p-STAT3 in human colorectal adenocarcinoma and adenoma; correlation with clinicopathological factors. J Clin Pathol. 2005;58(8):833–838. doi:10.1136/jcp.2004.023416
21. Li JL, Qi F, Jian YU, Zhang HY, Peng W. Correlation between methylation profile of promoter cpg islands of seven metas tasis-associated genes and their expression states in six cell lines of liver origin. Chin J Cancer. 2004;23(23):985–991.
22. Andrew AS, Gui J, Sanderson AC, et al. Bladder cancer SNP panel predicts susceptibility and survival. Hum Genet. 2009;125(5–6):527–539. doi:10.1007/s00439-009-0645-6
23. Harlid S, Ivarsson MI, Butt S, et al. A candidate CpG SNP approach identifies a breast cancer associated ESR1-SNP. Int J Cancer. 2011;129(7):1689–1698. doi:10.1002/ijc.25786
24. Duygu S, Donoghue MTA, Kristina R, et al. MicroRNA-9 inhibition of cell proliferation and identification of novel miR-9 targets by transcriptome profiling in breast cancer cells. J Biol Chem. 2012;287(35):29516–29528. doi:10.1074/jbc.M111.335943
25. Sen N, Cross AM, Lorenzi PL, et al. EWS-FLI1 reprograms the metabolis-m of Ewing sarcoma cells via positive regulation of glutamine import and serine-glycine biosynthesis. Mol Carcinog. 2018;256(27):22586–22614.
26. Shin M, Momb J, Appling DR. Human mitochondrial MTHFD2 is a dual redox cofactor-specific methylenetetrahydrofolate dehydrogenase/methenyltetrahydrofolate cyclohydrolase. Cancer Metab. 2017;5(1):11. doi:10.1186/s40170-017-0173-0
 © 2019 The Author(s). This work is published and licensed by Dove Medical Press Limited. The full terms of this license are available at https://www.dovepress.com/terms.php and incorporate the Creative Commons Attribution - Non Commercial (unported, v3.0) License.
By accessing the work you hereby accept the Terms. Non-commercial uses of the work are permitted without any further permission from Dove Medical Press Limited, provided the work is properly attributed. For permission for commercial use of this work, please see paragraphs 4.2 and 5 of our Terms.
© 2019 The Author(s). This work is published and licensed by Dove Medical Press Limited. The full terms of this license are available at https://www.dovepress.com/terms.php and incorporate the Creative Commons Attribution - Non Commercial (unported, v3.0) License.
By accessing the work you hereby accept the Terms. Non-commercial uses of the work are permitted without any further permission from Dove Medical Press Limited, provided the work is properly attributed. For permission for commercial use of this work, please see paragraphs 4.2 and 5 of our Terms.