")
Back to Journals » Drug Design, Development and Therapy » Volume 15
The Effect of Metformin on the Proliferation, Apoptosis and CD133 mRNA Expression of Colon Cancer Stem Cells by Upregulation of miR 342-3p
Authors Zhang Y , Chen R , Deng L, Shuai Z, Chen M
Received 28 August 2021
Accepted for publication 30 October 2021
Published 11 November 2021 Volume 2021:15 Pages 4633—4647
DOI https://doi.org/10.2147/DDDT.S336490
Checked for plagiarism Yes
Review by Single anonymous peer review
Peer reviewer comments 2
Editor who approved publication: Prof. Dr. Tin Wui Wong
Yaqin Zhang, 1,* Ruofei Chen, 1,* Lili Deng, 2 Zongwen Shuai, 1 Mingwei Chen 2
1Department of Rheumatology, The First Affiliated Hospital of Anhui Medical University, Hefei, Anhui, 230022, People’s Republic of China; 2Department of Endocrinology, The First Affiliated Hospital of Anhui Medical University, Hefei, Anhui, 230022, People’s Republic of China
*These authors contributed equally to this work
Correspondence: Zongwen Shuai; Mingwei Chen Email [email protected]; [email protected]
Objective: To explore whether metformin (MET) can affect the biological behaviour and CD133 mRNA expression of CD133+ colon cancer stem cells (CCSCs) through miR-342-3p.
Methods: The direct immunomagnetic bead method was used to select CD133+ CCSCs from the SW480 and HCT116 cell lines, and miRNA-tailing qRT-PCR was used to detect the expression changes of tumor suppressor-related miRNAs (miR-34a, miR-126, miR-143, miR-145, miR-342-3p, miR-342-5p) after MET intervention. Then, miR-342-3p with markedly significant differential expression was selected as the target miRNA. The lentiviruses LV16-hsa-miR-342-3p inhibitor and LV16-NC were used for the transfection inhibition test. CCK-8, flow cytometry, and qRT-PCR were used to detect the cell viability, apoptosis rate, and CD133 mRNA expression of CD133+ CCSCs.
Results: Under the high-glucose environment, the expression of tumor suppressor-related miRNAs in CCSCs changed differently (p < 0.05), MET also had different effects on the expression of tumor suppressor-related miRNA under different glucose concentrations (p< 0.05). Among them, MET upregulates the expression of miR-342-3p in CCSCs for the first time. The results of the lentiviruses transfection inhibition test showed that after miR-342-3p was inhibited, the cell viability and apoptosis rate of CD133+ CCSCs did not change significantly compared with before inhibition (p> 0.05), but the expression of CD133 mRNA markedly increased (p< 0.05). Meanwhile, after MET intervention, the apoptosis rate and the expression of CD133 mRNA of CD133+ CCSCs was significantly increased, and the proliferation of CD133+ CCSCs was obviously inhibited (p< 0.05).
Conclusion: MET upregulating the expression of miR-342-3p may not have a significant effect on the proliferation and apoptosis of CD133+ CCSCs, but it can reduce the expression of CD133 mRNA in CD133+ CCSCs.
Keywords: metformin, colon cancer stem cells, tumor suppressor-related miRNAs, CD133
Background
Diabetes is a chronic disease that is common worldwide. According to statistics, in developed countries, the incidence of undiagnosed diabetes is as high as 30%.1,2 In recent years, epidemiological surveys of diabetes in many regions in China have shown that the prevalence of diabetes has exceeded 10%.3–5 An increasing number of epidemiological studies have shown that type 2 diabetes mellitus (T2DM) is positively related to the risk of common human malignant tumors, such as colon cancer, breast cancer, endometrial cancer, lung cancer, pancreatic cancer and liver cancer.,6–9 and the mortality rate increases linearly with glucose concentration.10 Colorectal cancer (CRC) is one of the most common malignant tumors of the digestive system. According to the 2018 Global Cancer Incidence and Mortality Report published by the International Agency for Research on Cancer (IARC), CRC is the third most common cancer in men and the second most common cancer in women. It accounts for approximately 10% of cancer incidence in both men and women.11 It is estimated that more than 50% of patients with CRC die from the tumor.12 Previous studies have shown that diabetes is not only a risk factor for colon cancer, but the treatment effect and prognosis of colon cancer patients suffering from diabetes are worse than those of nondiabetic patients.13 Metformin (MET) is one of the first-choice oral hypoglycaemic drugs for patients with T2DM, and it is also the core hypoglycaemic agent recommended by worldwide diabetes guidelines. A large number of studies have shown that MET not only can control the blood glucose level of diabetic patients/impaired glucose tolerance people but also can be used in the clinical treatment of a variety of cancers.14,15 It is currently being extended to nondiabetic people.16 MET intervention can not only reduce the incidence of cancer in patients with diabetes but also improve the response to cancer radiotherapy in patients with diabetes and improve the survival rate of patients to a certain extent.17
Cancer stem cells (CSCs), also known as tumor-initiating cells (TICs), refer to a small portion of human malignant tumors that have unlimited self-renewal, multidirectional differentiation potential and cytoprotective properties. It is related to tumor formation, growth, metastasis, recurrence, and resistance to antitumor therapy.18 It is generally believed that cancer can be completely cured only by eliminating CSCs, but CSCs are difficult to eradicate with ordinary radiotherapy and chemotherapy. CSCs have been proven to be the main cause of tumor recurrence.19 Therefore, CSCs have increasingly become a hot spot in the prevention and treatment of cancer. While MET has proven to be used to treat a variety of cancers, its similar effects on CSCs have also been demonstrated. Studies by Yu et al confirmed that the synergistic effect of MET and temozolomide can inhibit the proliferation of glioma stem cells and produce the highest rate of apoptosis compared with any drug alone.20 Cell experiments found that MET reduces the expression of aldehyde dehydrogenase, a biomarker on the surface of breast cancer stem cells, through the PKA-GSK3β-KLF5 pathway and reduces the number of stem cell spheres.21 Studies have also shown that the use of MET could represent an efficient strategy to inhibit tumor growth by targeting gastric CSCs.22 Due to the high incidence and mortality of CRC, an increasing number of scholars have turned their attention to colon cancer stem cells (CCSCs). At present, the internationally recognized surface markers of CCSCs are CD133, CD144, CD24, CD166, CD44, CD29, ALDH1, LGR5 and CXCR4,17 among which CD133 has been most widely recognized. CD133 is a five-transmembrane glycoprotein with a molecular weight of 120 kDa that was first discovered by Yin et al at the membrane protrusions of haematopoietic stem and progenitor cells.23 The expression of CD133, as a target gene of the cancer stem cell signalling pathways, is regulated by activation or suppression of the signalling pathways.24,25 Studies have found that the CD133 protein can promote cell migration and maintain cell polarity in colon cancer tissues, which is related to tumor vascular infiltration, lymph node metastasis, and negative effects on overall survival.17
MiRNAs (microRNAs) are small non-coding molecules (generally 17~25 nt) known to regulate the expression of more than 60% of human genes, and their aberrant expression has been associated with the pathogenesis of human cancers and the regulation of stemness features of CSCs.26 At present, it is considered that the expression of mature miRNAs in colon cancer, such as miR-34a, miR-126, miR-143, miR-145 and miR-342, is very low, which is regarded as tumor suppressor-related miRNAs.27–31 The deletion of tumor suppressor miRNA may lead to the overexpression of oncogenes, which may affect the malignant biological behavior of tumor cells (such as proliferation, migration, invasion, apoptosis, tumorigenicity, etc.). A study revealed that MET can influence the above biological characteristics of pancreatic cancer stem cells by up regulating the expression of aforementioned tumor suppressor-related miRNAs.32 Our previous study found that MET can promote the apoptosis of CCSCs and inhibit their proliferation in time-concentration dependent manner, and reduce the protein expression of the stem cell surface marker CD133,33 but the pathway of MET acting on CCSCs and whether MET is involved in the regulation of tumor suppressor-related miRNAs are unclear. In particular, it is uncertain whether the expression of tumor suppressor-related miRNA in CCSCs changes under high glucose environment. The purpose of this study was to investigate whether the effect of MET on the biological behaviour of CCSCs involves the participation of tumor suppressor-related miRNAs (miR-34a, miR-126, miR-143, miR-145, miR-342), especially in a high-glucose environment, and provide new insights into the mechanism of MET in the treatment of diabetic patients with colon cancer.
Materials and Methods
Cell Lines
Human SW480 and HCT116 colon cancer cell lines were obtained from the Cell Bank of the Chinese Academy of Sciences; human CD133 MicroBead Kit-Tumor Tissue was purchased from Miltenyi, Germany; human SW480~ and HCT116~CD133+ CCSCs were obtained from SW480 and HCT116 cell lines by the direct immunomagnetic bead method; miR-NC CCSCs were obtained from human CD133+ CCSCs transfected with LV16-NC lentivirus; and CCSCs with downregulated miR-342-3p expression were obtained by the transfection of human CD133+ CCSCs with LV16-hsa-miR-342-3p inhibitor lentivirus.
Sorting of SW480 and HCT116~CD133+ CCSCs by the Direct Immunomagnetic Bead Method
The cells labelled with CD133 microbead antibodies were injected into the sorting column. When the cell suspension in the sorting column was drained naturally under the action of gravity, the sorting column was washed with 500 μL of sorting buffer. The sorting column was removed from the separator and placed in a sterile centrifuge tube. The magnetic bead-labelled CD133+ cells in the sorting column were flushed into a centrifuge tube.
Identification of SW480 and HCT116~CD133+ CCSCs
A total of 2×10⁶ cells were extracted from the sorted CD133+ cells and divided into two groups. One group of cells was resuspended in 100 μL of sorting buffer; the other group of cells was resuspended in 98 μL of sorting buffer, and 2 μL of fluorescence staining reagent PE was added. A flow analyser (BECKMAN COULTER, USA) was used to detect the content of CD133+ cells.
Culture of SW480 and HCT116~CD133+ CCSCs
CD133+ CCSCs were grown in suspension in a 6-well ultra-low-adhesion plate (Wuxi NEST Biotechnology Co., Ltd.). Two millilitres of SFM was added to each well and cultured in an incubator at 37°C and 5% CO2. When the stem cells were aggregated into large clumps under the microscope (Olympus, Japan), the cells were collected into a sterile centrifuge tube and cultured in an incubator at 5% CO2 and 37°C.
miRNA Tailing qRT-PCR to Detect the Effect of MET on the Expression of CCSCs Tumor Suppressor-Related miRNAs (miR-34a, miR-126, miR-143, miR-145, miR-342-3p, miR-342-5p) in a High-Glucose Environment
According to the previous study results (MET concentration was set to 20 mmol/L)33 SW480 and HCT116~CD133+ CCSCs were divided into NC group (common medium with glucose concentration of 3.1 g/L), MET group (common medium and 20 mmol/L MET), HG group (high-glucose medium with glucose concentration of 5.0 g/L), HG + MET Group (high-glucose medium and 20 mmol/L MET, respectively.
CD133+ CCSCs in the logarithmic growth phase were selected and treated according to grouping conditions. CCSCs were collected into a labelled centrifuge tube, 1 mL of TRIzol was added, mixed well and transferred to a labelled 1.5 mL enzyme-free EP tube. Then, 200 µL of chloroform was added, and the tube was then shaken vigorously for 15 s, left at room temperature for 2–3 min, and centrifuged (12,000 rpm×10 min). The sample was divided into 3 layers. Total RNA was pipetted to a new enzyme-free EP tube (approximately 500–550 μL). Equal volumes of isopropanol and mixed and were precipitated at room temperature for 20 min. After centrifugation (12,000 rpm×10 min), a white precipitate (RNA fragment) was observed at the bottom of the tube. After the RAN was slightly dry, 30 µL of DEPC water (Biyuntian Biotech Co., Ltd.) was added to each tube to dissolve it, and the tubes were bathed in a water bath at 55 °C for 10 min. Store at −80°C after labelling or perform reverse transcription immediately.
The RNA concentration analyser (Gene Company, Hong Kong, China) was used to detect the concentration and purity of total RNA in each group. The total RNA volume required for each tube of the reverse transcription reaction solution was calculated according to the reverse transcription kit instructions.
To prepare the reverse transcription reaction solution, 1 µg of Total RNA, 1 µL of Poly A Polymerase, the 1 µL RTase Mix, and 5 µL Reaction Buffer to the precooled RNase-free reaction tube to a final volume of 25 µL. The reverse transcription reaction solution was placed on a BIO-RAD gradient gene amplification instrument (BIO-RAD, USA). The reaction procedure was set to 37°C for 60 min and 85°C for 5 min. After the reaction, CCSCs cDNA solution was obtained and stored in a refrigerator at −80°C for later use.
CCSCs tumor suppressor-related miRNA primers were synthesized by Shanghai Shenggong Company. The internal reference U6 was purchased from GeneCopoeia, USA. The sequences (5ʹ to 3ʹ, forward) of miRNA primers are as follows:
miR-34a: GCG TGG CAG TGT CTT AGC TGG TTG T; miR-126: CGG CGT CGT ACC GTG AGT AAT AAT GCG; miR-143: GCG CGT GAG ATG AAG CAC TGT AGC TC; miR-145: CGC GTC CAG TTT TCC CAG GAA TCC CT; miR-342-3p: CGT CTC ACA CAG AAA TCG CAC CCG T; miR-342-5p: CGC GAG GGG TGC TAT CTG TGA TTG A. The qRT-PCR solution was prepared on ice, gently mixed and divided into 8 tubes for PCR, and put into the PCR amplification instrument. The reaction procedure was set as follows: pre-denaturation at 95°C for 10 min, 95°C denaturation for 10 s, 60°C annealing for 20 s, and 72°C extension for 10 s for a total of 42 cycles. The solution curve analysis reaction program of the instrument was used for solution curve analysis. After the amplification procedure, the relative expression level of miRNAs in each group was calculated and expressed as 2(-ΔΔCT).
CD133+ CCSCs Lentivirus Transfection Experiment
Since the LV16 carrier type ordered did not carry fluorescently labelled GFP, the LV16 NC of the same batch was used for pre-experiments, and the transfection efficiency was observed under a fluorescent inverted microscope (Olympus Company, Japan).
Under high-glucose condition, CCSCs were divided into miR-NC group (high-glucose medium and LV16-NC transfection), miR-NC+ MET group (high-glucose medium and LV16-NC transfection and 20 mmol/L MET intervention), inhibition group (high-glucose medium and LV16- has-miR-342-3p inhibitor), inhibition + MET group (high-glucose medium and LV16-has-miR-342-3p inhibitor and 20 mmol/L MET intervention).
The miR-NC group and the inhibition group used a 6-well plate to dilute the virus stock at a rate of 1:5, and 1×10⁶ cells/well were taken and cultured in an incubator at 5% CO2 and 37°C. After 24 h, the virus solution was centrifuged for removal, and 0.5 mL medium was added overnight culture. The qRT-PCR method was used to detect the expression of miRAN342-3p in each group of cells to verify successful transfection.
Detection of CD133 mRNA Expression in CD133+ CCSCs by qRT-PCR
The extraction of total cell RNA and the determination of its concentration and purity as above.
The reverse transcriptional reaction solution was prepared in an RNase-free centrifuge tube (operate on ice throughout the protocol): Template RNA (1 µg), 5 × HiScript II qRT SuperMix (4 µL), and RNase-free ddH2O (20 µL). The sample was placed on the Bio-Rad gradient gene amplification instrument. The reaction procedure was set to incubation at 50°C for 15 min and 85°C for 5 s. At the end of the reaction, CD133+ CCSC cDNA solution was obtained and stored in a refrigerator at −80°C for later use.
Primers were synthesized by Sangon BiotechCo., Ltd. (Shanghai), and the mRNA primer sequences (5ʹ to 3ʹ) were as follows: Human CD133 F: GTC CTG GGG CTG CTG TTT AT; human CD133 R: TCT GTC GCT GGT GCA TTT CT; Human β-actin F: CCC TGG AGA AGA GCT ACG AG; Human β-actin R: GGA AGG AAG GCT GGA AGA GT. Prepare the qPCR master mix in 8 tubes and put it into the PCR amplification instrument. The reaction procedures were set as follows: pre-denaturation at 95°C for 5 min, one cycle, 95°C denaturation for 10 s, 60°C annealing for 30 s, and for a total of 40 cycles. The solution curve analysis reaction program of the instrument was used for solution curve analysis.
A CCK-8 Assay Was Used to Detect the Effect of MET on CD133+ CCSCs Proliferation
According to the experimental groups, the cells of each group were seeded in 96-well plates, each group was established in 3 wells with a cell concentration in each well of 1×10⁵ cells/well. To reduce the error, 100 µL of PBS was added to each well around the 96-well plate, which was not used well for indicator detection. An appropriate amount of MET solution was added to the miR-NC + MET group and the inhibition + MET group to make MET concentrate in the culture well 20 mmol/L. After intervention for 24 h in an incubator at 37°C and 5% CO2, fresh medium was replaced. Ten microlitres of CCK-8 solution was added to each well and incubated for 2 h in an incubator at 37°C and 5% CO2. Finally, the absorbance (OD value) of each group at 450 nm was measured with a microplate analyser.
The Effect of MET on CD133+ CCSCs Apoptosis Was Detected by Flow Cytometry
According to the experimental groups, 1×10⁶ cells per well were seeded into 6-well plates, and 3 duplicate wells were prepared in each group. After intervention for 24 h, the suspended cells were collected into a labelled sterile centrifuge tube. Then, 5 μL of Annexin V-FITC staining solution and 10 μL of PI staining solution were added to the cell suspension, and the cells were incubated in a 4°C refrigerator in the dark for 5 min. A flow cytometer was immediately used for detection.
Subcutaneous Tumorigenesis Experiment in Nude Mice
In order to further verify whether the tumorigenicity of SW480~CD133+CCSCs changed after the down-regulation of miR-342-3p expression, we selected SW480 CCSCs in the miR-NC group and inhibition group in the above experiment. Twenty 3-week-old male nude mice were randomly divided into two groups with 10 mice in each group. Two groups of mice were injected subcutaneously into the right armpit with 200μL SW480~CD133+CCSCs suspension (including 2×10⁴ cells) from the miR-NC group (group A) and 200μL SW480~CD133+CCSCs suspension (including 2×10⁴ cells) from the inhibition group (group B). After subcutaneous injection of cells, the growth, diet, spirit and activity of nude mice were observed every day. After 2 weeks, the nude mice were killed to observe the subcutaneous tumorigenesis of the two groups, and the tumorigenesis rate of each group was calculated. In the right axillary tissue of nude mice, the tumor was stripped, the long diameter and short diameter of the transplanted tumor were measured with vernier caliper, and its volume was calculated. Volume (mm3) = long diameter (mm) × short diameter2 (mm2)/2. The study has been approved by the Animal Ethics Committee of Anhui Medical University and is based on the National Institutes of Health’s Guide to the Care and Use of Laboratory Animals.
Statistical Methods
The statistical software SPSS 21.0 was used for data processing and analysis. Measurement data are expressed as the mean ± standard deviation. A t test was used for comparisons between two groups, whereas an ANOVA was performed for comparison between multiple groups. The LSD-t was conducted for further pairwise comparison. Each experiment was repeated 3 times, and the average value was taken. Degree of freedom (df) = sample size-1. The difference of bilateral p< 0.05 was statistically significant.
Results
Sorting, Identification and Culture of CD133+ CCSCs
After the CD133+ CCSCs were sorted from the SW480 and HCT116 cell lines, they were cultured in SFM for approximately 5 days. Under an inverted microscope (20×), CCSCs spheres were formed and grew in suspension (Figure 1). The results of flow cytometry showed that the contents of CD133, a surface marker of CCSCs, were as high as 83.32% and 82.1% (Figure 2).
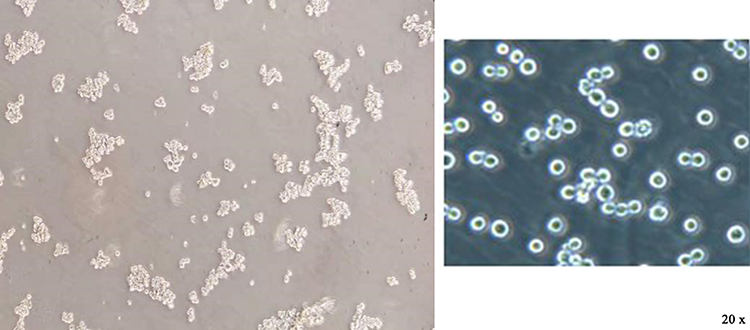 |
Figure 1 Observation of colon cancer stem cell growth under an inverted microscope (20×). Note: The sorted CCSCs grew in suspension, gradually increased, became round and aggregated into spheres. Left, growth status of SW480~ CD133+ CCSCs; right, growth status of HCT116~ CD133+ CCSCs. |
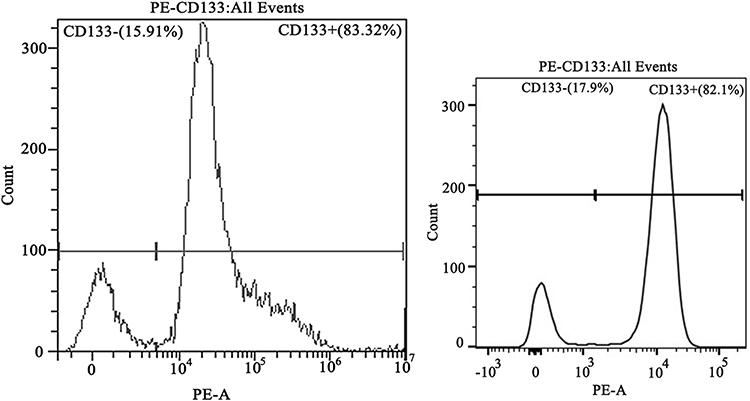 |
Figure 2 The surface marker CD133 of colon cancer stem cells was identified by flow cytometry. Notes: CD133+ indicates the colon cancer stem cell population that expresses CD133 protein; CD133- indicates the colon cancer stem cell population that does not express CD133 protein. The content of SW480~ and HCT116~ CD133+ CCSCs by the direct immunomagnetic bead method reached 83.32% and 82.1%, respectively. Left, SW480~ CD133+ CCSCs; right, HCT116~ CD133+ CCSCs. |
The Effect of MET on the Expression of Tumor Suppressor-Related miRNAs in CD133+ CCSCs
Compared with NC group, the expression of miR-34a, miR-126, miR-143, miR-145, miR-342-3p and miR-342-5p in SW480~ and HCT116~ CD133+ CCSCs in MET group was significantly increased (p< 0.05), Figure 3. Whereas compared with NC group, the expression of miR-34a, miR-126, miR-143, miR-145, miR-342-3p and miR-342-5p in SW480~ and HCT116~ CD133+ CCSCs in HG group showed differential changes, in which the expressions of miR-143 and miR-342-3p in SW480~ and HCT116~ CD133+ CCSCs decreased (p<0.05), and the expression of miR-342-5p increased (p<0.05); the expression of miR-34a was decreased in HCT116~ CD133+ CCSCs but increased in SW480~ CD133+ CCSCs (Figures 3A and B) (p<0.05). As for miR-126, the expression in SW480~ and HCT116~ CD133+ CCSCs had a downward trend, but only marked significant change was observed in SW480~ CD133+ CCSCs (p<0.05). In addition, compared with HG group, the expression of miR-126 and miR-342-3p in SW480~ and HCT116~ CD133+ CCSCs increased (p<0.05), and the expression of miR-145 and miR-342-5p decreased in HG + MET group (p<0.05) (Figure 3).
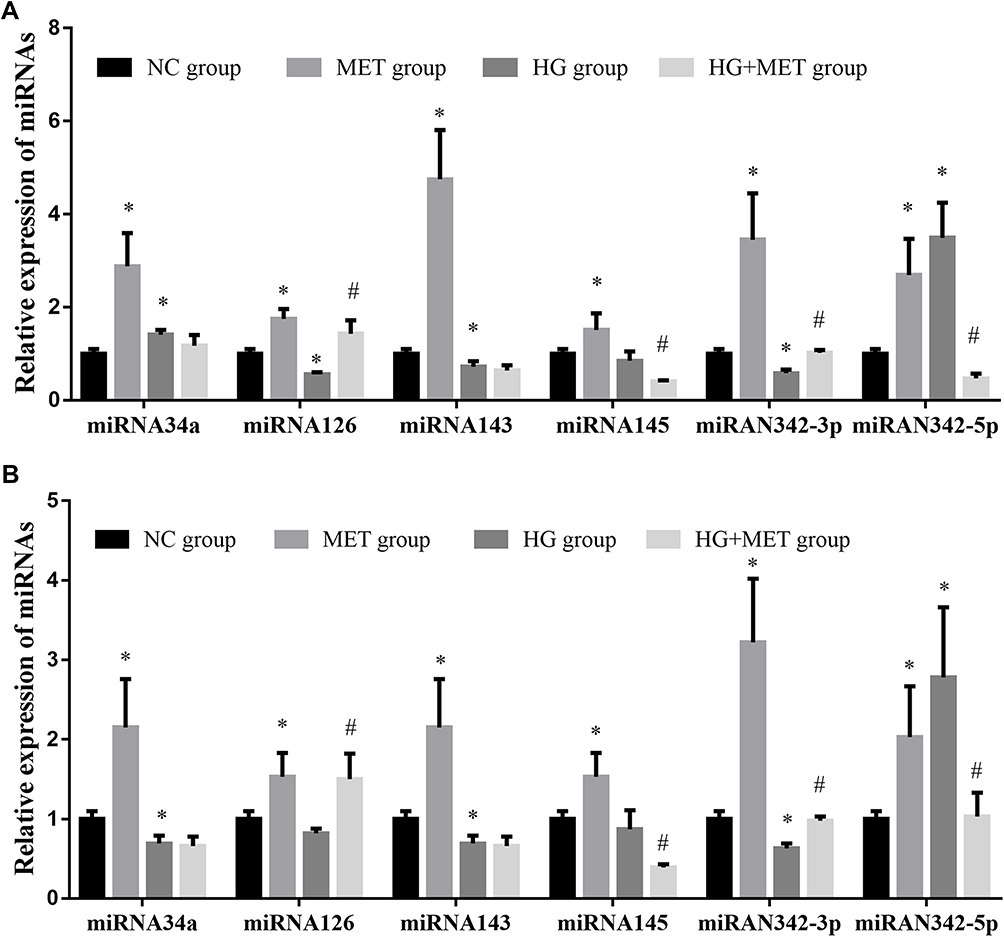 |
Figure 3 Effect of metformin on the expression of tumor suppressor-related miRNAs in CD133+ colon cancer stem cells. (A) the expression of tumor suppressor-related miRNAs in SW480~ CD133+ CCSCs; (B) The expression of tumor suppressor-related miRNAs in HCT116~ CD133+ CCSCs. Notes: NC group: normal control group (normal medium, glucose concentration 3.1 g/L); MET group: metformin group (normal medium + 20 mmol/L MET intervention); HG group: high-glucose group (high-glucose medium, glucose concentration 5.0 g/L); HG + MET group: high-glucose + metformin (high-glucose medium + 20 mmol/L MET intervention). *p<0.05, MET group vs NC group; #p<0.05, HG + MET group vs HG group, df=5. |
Notably, this study showed that MET upregulated the level of miRNAs in SW480~ CD133+ CCSCs more significantly than in HCT116~ CD133+ CCSCs. Therefore, the SW480 cell line was chosen as the main cell line and selected for the following lentiviral transfection experiment.
Lentivirus LV16-hsa-miR-342-3p Inhibitor Transfects SW480~ CD133+ CCSCs to Downregulate miR-342-3p Expression
CD133+ CCSCs were transfected with LV16-hsa-miR-342-3p inhibitor lentivirus for 48 h, and the transfection efficiency was observed under an inverted fluorescence microscope (20×). When the dilution ratio of lentivirus stock solution was 1:5, the transfection efficiency reached approximately 50%. Therefore, formal experiments can be carried out according to this dilution ratio (Figure 4).
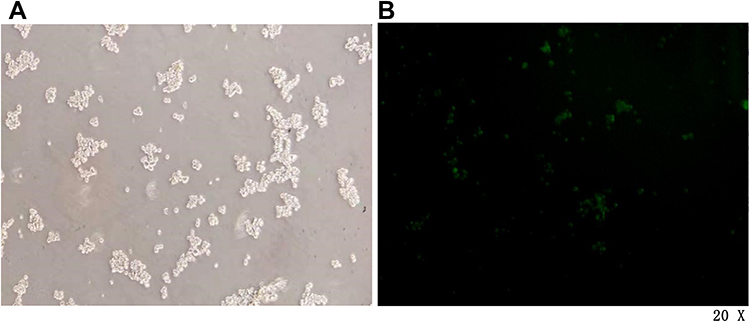 |
Figure 4 Pre-experimental CCSCs infected for 48 h under a microscope. (A) White light field. (B) Fluorescence field. Notes: Microscope magnification 20×. |
Forty-eight hours after transfection with lentivirus LV16-hsa-miR-342-3p inhibitor (inhibition group) and LV16-NC (miR-NC group), qPCR detection showed that the expression of miR-342-3p in the inhibition group was significantly lower than that in the miR-NC group (p<0.05), which proved that lentivirus LV16-has-miR-342-3p inhibitor successfully inhibited the expression of miR-342-3p in CD133+ CCSCs (Figure 5).
 |
Figure 5 Relative expression of miR-342-3p after transfection of CD133+ CCSCs with lentivirus. Notes: miR-NC group: high glucose medium+LV16-NC transfection; inhibition group: high glucose medium +LV16-has-miR-342-3pinhibitor transfection. *p<0.05, inhibition group vs miR-NC group, df=5. |
The Effect of MET on the Proliferation of SW480~CD133+ CCSCs with Downregulated miR-342-3p Expression
After 24 hours of intervention in each experimental group, the results showed that the OD value and cell viability of CD133+ CCSCs in the miR-NC+MET group were decreased compared with those in the miR-NC group (OD values: 1.08±0.08 vs 1.58±0.07), and the difference was statistically significant (p<0.05). The OD value (1.48±0.11) and cell viability of the inhibition group did not change significantly (p =0.253). Compared with the inhibition group, the OD value (1.10±0.11) and cell viability of CD133+ CCSCs in the inhibition + MET group decreased, and the difference was statistically significant (p<0.05) (Table 1 and Figure 6).
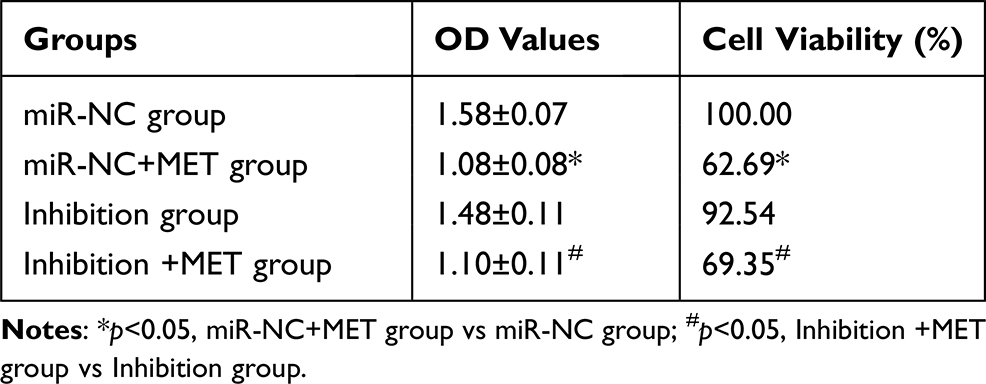 |
Table 1 The Effect of Metformin on the Proliferation of CD133+ CCSCs with Down-Regulated miR-342-3p Expression (X±s, %) |
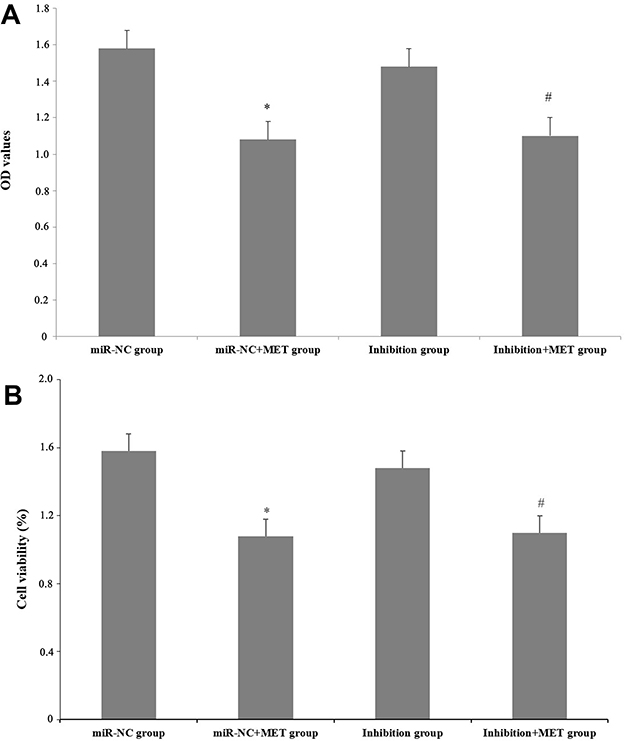 |
Figure 6 The effect of metformin on the proliferation of CD133+ CCSCs with downregulated miR-342-3p expression. (A) After 24 hours of intervention for each experimental group, the OD value of CD133+ CCSCs at 450 nm. (B) After 24 hours of intervention for each experimental group, the cell viability of CD133+ CCSCs. Notes: miR-NC group: high-glucose medium+LV16-NC transfection; miR-NC + MET group: high-glucose medium +LV16-NC transfection + 20 mmol/LMET intervention; inhibition group: high-glucose medium +LV16-hsa-miR-342-3p inhibitor transfection; inhibition +MET group: high-glucose medium + LV16-hsa-miR-342-3p inhibitor transfection + 20 mmol/L MET intervention. OD: optical density. *p<0.05, miR-NC+MET group vs miR-NC group; #p<0.05, inhibition +MET group vs inhibition group, df=5. |
The Effect of MET on the Apoptosis of CD133+ CCSCs with Downregulated miR-342-3p Expression
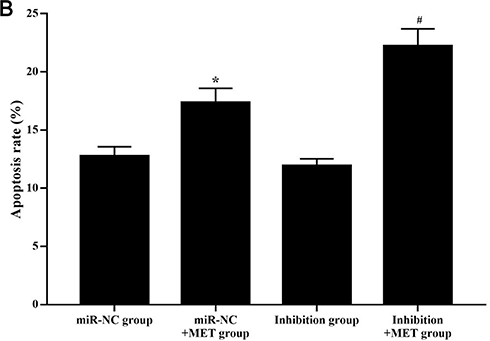
After 24 hours of intervention for each experimental group, the apoptosis rate of CD133+ CCSCs in the miR-NC+MET group was significantly higher than that in the miR-NC group [(17.362±1.539 vs 12.783±2.423) %, p<0.05], whereas the apoptosis rate of CD133+ CCSCs in the inhibition group showed no statistically significant difference [(11.934±3.074 vs.12.783±2.423) %, p=0.374]. In addition, compared with the inhibition group, the apoptosis rate of CD133+ CCSCs in the inhibition + MET group was significantly increased [(22.215±1.726 vs 11.934±3.074) %, p<0.001], Figure 7A and B Figure 7 Continue. Figure 7 Effects of metformin on apoptosis of CD133+ CCSCs with downregulated miR-342-3p expression. (A) Flow cytometry to detect the apoptotic rate of CD133+ CCSCs in each group. (B) Comparison of the apoptosis rate between each group. Notes: miR-NC group: high-glucose medium+LV16-NC transfection; miR-NC + MET group: high-glucose medium +LV16-NC transfection + 20 mmol/LMET intervention; inhibition group: high-glucose medium +LV16-hsa-miR-342-3p inhibitor transfection; inhibition +MET group: high-glucose medium + LV16-has-miR-342-3p inhibitor transfection + 20 mmol/L MET intervention. D1: Necrotic cells; D2: late apoptosis; D3: Normal cells; D4: Early apoptosis. Apoptosis rate=D2+D4. *p<0.05, miR-NC +MET group vs miR-NC group; #p<0.05, inhibition +MET group vs inhibition group, df=5.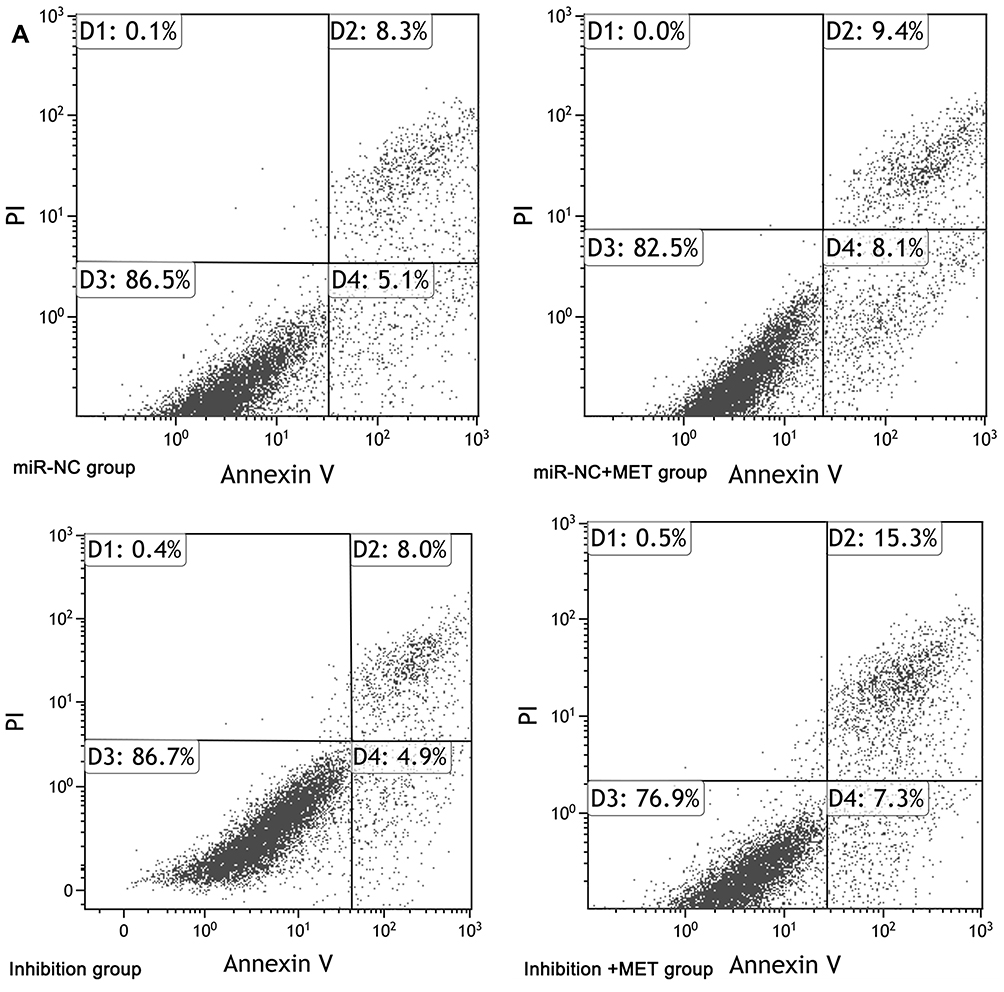
Detection of the Relative Expression of CD133 mRNA in CD133+ CCSCs with Downregulated miR-342-3p Expression by qRT-PCR
After 24 h of intervention in each experimental group, compared with the miR-NC group, the relative expression of CD133 mRNA in the inhibition group was obviously increased (p<0.001), whereas the relative expression of CD133 mRNA in CD133+ CCSCs in the miR-NC+ MET group was significantly decreased (p=0.002). In addition, compared with the inhibition group, the relative expression of CD133 mRNA in CD133+ CCSCs in the inhibition +MET group was markedly decreased (p<0.001) (Figure 8).
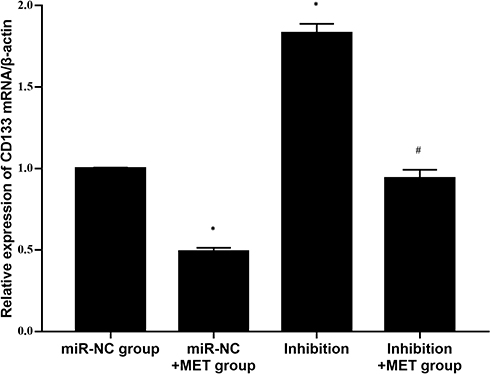 |
Figure 8 Relative expression level of CD133 mRNA in CD133+ CCSCs with downregulated miR-342-3p expression. Notes: miR-NC group: high-glucose medium+LV16-NC transfection; miR-NC + MET group: high-glucose medium +LV16-NC transfection + 20 mmol/LMET intervention; inhibition group: high-glucose medium +LV16-hsa-miR-342-3p inhibitor transfection; inhibition +MET group: high-glucose medium + LV16-hsa-miR-342-3p inhibitor transfection + 20 mmol/L MET intervention. *p<0.05, miR-NC+MET group vs miR-NC group; #p<0.05, inhibition +MET group vs inhibition group, df=5. |
Comparison of Tumor Formation Rate and Tumor Volume Between the Two Groups
After subcutaneous inoculation of SW480~CD133+CCSCs in nude mice, no death was observed in the two groups. After 14 days, we killed the nude mice and observed the tumorigenesis of the two groups with naked eyes. It was found that 3 nude mice in group A formed tumors, and the tumorigenesis rate was 30%, and 8 nude mice in group B formed tumors, and the tumorigenesis rate was 80%. There was significant difference in the tumorigenesis rate between the two groups (x2 =5.051, p=0.025) (Figure 9A); In addition, we found that the average volume of transplanted tumor in group A was (42.4 ± 1.50) mm3 and that in group B was (62.0 ± 1.49) mm.3 There was significant difference in tumor volume between the two groups (t=29.254, p<0.001), Figure 9B and C.
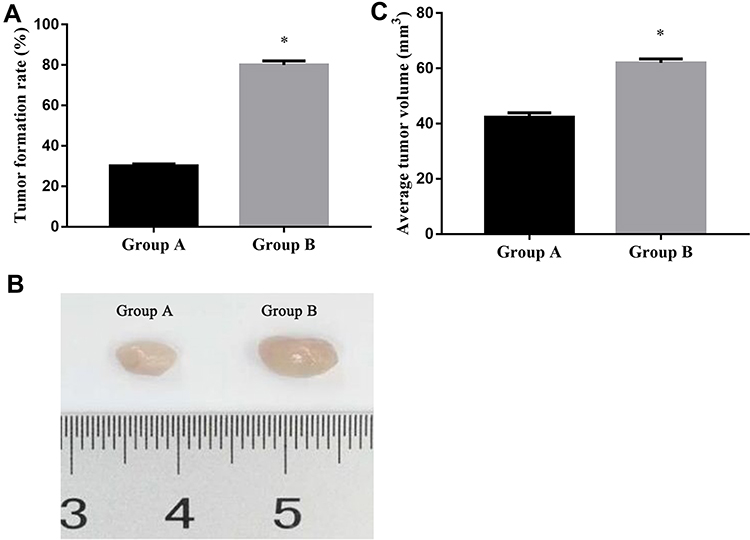 |
Figure 9 Tumor formation rate and tumor volume between the two groups. (A) Tumor formation rate in group A and group B; (B) Representative images of group A and group B of subcutaneous tumors. (C) average tumor volume in group A and group B. Notes: Group A mice were injected SW480~CD133+CCSCs suspension from the miR-NC group; Group B mice were injected SW480~CD133+CCSCs suspension from the inhibition group. *p<0.05, group B vs group A, df=19. |
Discussion
In the present study, we found that under the high-glucose environment, the expression of tumor suppressor-related miRNAs (miR-34a, miR-126, miR-143, miR-145, miR-342) in CCSCs can change differently, including the up-regulated expression of miR-34a and miR-342-5p, the down-regulated expression of miR-126, miR-143 and miR-342-3p, and no significant change in the expression of miR-145. Interestingly, we revealed that MET also had different effects on the expression of tumor suppressor-related miRNA under different glucose concentrations. MET could up regulate the expression of miR-34a, miR-126, miR-143, miR-145 and miR-342 in CCSCs in common medium with glucose concentration of 3.1 g/L, whereas in the high-glucose medium with glucose concentration of 5.0 g/L, MET could up regulate the expression of miR-126 and miR-342-3p, down regulate the expression of miR-145 and miR-342-5p, and had no significant effect on the expression of miR-34a and miR-143 in CCSCs. These results mentioned above can be observed in multiple cell lines, and suggest that the antitumor effects of MET on colon cancer in vitro is related to the level of glucose in the environment. To our knowledge, this is the first systematic study on the effect of MET on the expression of common tumor suppressor miRNAs related to colon cancer. Among them, MET up regulates the expression of miR-342-3p in CCSCs for the first time.
CCSCs are a set of the CSCs in the colon cancer cell population with infinite self-renewal, multidirectional differentiation potential and cell protection characteristics. CD133 is the first protein, called “Prominin”, that was originally discovered and studied as a surface-specific marker for haematopoietic progenitor cells. With increasing research on CD133, scientists have found that CD133 can also be used to isolate and identify tumor stem cells, interfere with PI3K/Akt, Src-FAK and other signalling pathways, and affect the biological behaviour of CD133-positive cells, and its expression level is closely related to the effect of tumor therapy.34 At present, the commonly used methods for sorting cancer stem cells are immunomagnetic bead sorting and flow cytometry sorting. The immunomagnetic bead sorting method is simple to perform and has a high target cell content. Therefore, CD133+ CCSCs were selected from SW480 and HCT116 colon cancer cell lines by the direct immunomagnetic bead sorting method in this study, which was basically consistent with the results of Ricci-Vitiani et al.35
A large number of studies have confirmed that miRNAs play an important role in maintaining and regulating the function of CSCs.26,36 In prostate CSCs, the expression of miR-34a, let-7b, miR-106a, and miR-141 was decreased. Moreover, miRNA profiling in breast CSCs showed that the expression of miR-203 and miR-375 was markedly downregulated.37 In addition, the up- and downregulation of miRNAs was also observed in CD133+ CSCs, affecting the biological behaviour of CD133+ CSCs. For example, miR-107, as a tumor suppressor gene for gliomas, targets Notch2 receptors, and matrix metalloproteinase-12 (MMP-12) mRNA expression inhibits the proliferation of CD133+ CSCs.38 However, most miRNAs indirectly regulate the expression of CD133, and it is unclear whether there are specific miRNAs that directly target CD133.39 With in-depth study of the anticancer mechanism of MET, scholars have also discovered that MET can affect the biological behaviour of cancer cells by regulating the expression of miRNAs. In vitro cell experiments by Nangia-Makker et al showed that MET combined with 5-fluorouracil and oxaliplatin (FuOx) can inhibit the migration of colon cancer cells. These changes may be related to the increase in miR-145 and the decrease in miR-21.40 Our previous study (see Supplementary Material) also showed that MET can promote the apoptosis of CCSCs and inhibit the proliferation of CCSCs and the expression of CD133 protein, but it is not completely clear whether miRNAs are involved in the tumor suppressor effect of MET.
MiR-34a, miR-126, miR-143, miR-145, and miR342 are currently recognized as relatively mature miRNAs in malignant tumors. Yang et al believes that underexpression of miR-34a facilitates invasion in vitro and metastasis in vivo by suppressing the potential oncogene fos-related antigen 1 in breast cancer.41 Cell line experiments were further extended by injecting miR-34a into prostate cancer mouse models, which caused a significant decrease in tumor growth by inhibiting the c-Myc oncogene, indicating a tumor suppressive role of miR-34a in prostate cancer.42 Similar expression characteristics were observed between miR-143 and miR-145. Several studies have explored whether miR-145 or miR-143 plays a tumor-suppressive role in various cancers, such as prostate cancer, breast cancer, and oesophageal cancer.43–45 Studies have also shown that changes in the expression of miR-143 and miR-145 are related to the clinicopathological characteristics of colorectal cancer.46 MiR-126 plays an important role in cancer biology. It can inhibit the progression of certain cancers through the negative regulation of proliferation, migration, invasion and cell survival.47 In vivo and in vitro studies have shown that overexpression of miR-126 reduces the proliferation and increases the apoptosis of colon cancer cells (SW480) and decreases the accumulation of cells in the G0-G1 phase. The survival rate of colorectal cancer patients with low miR-126 expression was poorer.28
In addition, the miR-342 gene is located in the third intron region of the Evl (Ena/VASP-like) gene, and two miRNAs are produced during biosynthesis, namely, miR-342-3p and miR-342-5p. Previous studies have demonstrated that miR-342-3p acts as a tumor suppressor gene in cervical cancer by targeting FOXM1 for downregulation.48 A recent study by Komoll et al suggests that miR-342-3p is an effective hepatocellular carcinoma tumor suppressor that can significantly slow the development of liver tumors and increase survival rates.49 Another study reported that miR-342-3p is associated with the prognosis of colon cancer, especially in TNM stage I and II patients.50 Lindholm et al pointed out that the overexpression of miR-342-5p in breast cancer cell lines may reduce the proliferative ability of cancer cells.51 Liu et al indicated that miR-342-5p inhibits the growth, migration and invasion of osteosarcoma cells by targeting Wnt7b.52 Besides, some studies have shown that miR-342-5p suppresses the tumorigenesis of colon cancer cells in vitro and in vivo by targeting NAA10 mRNA for degradation.53 Therefore, this study selected the above miRNAs as candidate miRNAs for MET regulation in CD133+ CCSCs.
Consistent with previous studies,54,55 in this study, we also found that high glucose can regulate the expression of miRNA, but unexpectedly found that the expression of five candidate miRNAs in CCSCs can be changed differently in high glucose environment, with two up-regulated, two down regulated and one not significantly changed. The specific mechanism and role need to be further elucidated. Similarly, MET also had different effects on the expression of five candidate miRNAs in CCSCs under different glucose concentrations. In fact, the results showed that although MET can upregulate the abovementioned miRNA levels in CD133+ CCSCs at normal sugar concentrations, only miR-126 and miR-342-3p can be upregulated by MET in a high-glucose environment. In view of the main purpose of this study was to explore the mechanism by which MET promotes apoptosis and inhibits the proliferation of CCSCs in a high glucose environment and to provide ideas for the treatment of diabetes mellitus with CRC by MET in the future. Only miR-126 and miR-342-3p satisfied the purpose of this study. There have been reports on relationship between miR-126 expression and colon cancer.28 In vitro, the tumorigenicity of SW480~CD133+CCSCs markedly increased after the down-regulation of miR-342-3p expression, thus we chose miR-342-3p as the target miRNA for further study, which is the first miRNA reported to change after MET intervention by our team. Then, we transfected CD133 + CCSCs with LV16-hsa-miR-342-3p inhibitor lentivirus to understand whether miR-342-3p is involved in the effects of MET on the proliferation, apoptosis and CD133 protein expression of CD133+ CCSCs. In the present study, after miR-342-3p was inhibited, the cell viability and apoptosis rate of CD133+ CCSCs did not change significantly compared with before inhibition. Whereas, after MET intervention, the apoptosis rate of CD133+ CCSCs was increased, and the proliferation of CD133+ CCSCs was inhibited. These results suggest that miR-342-3p does not seem to be involved in the regulatory effect of MET on the proliferation and apoptosis of CD133+ CCSCs. It is worth mentioning that this result may also be related to conducting the experiment in high-glucose medium. High glucose stimulation itself can downregulate the expression of miR-342-3p, so the regulatory effect of miR-342-3p on the proliferation and apoptosis of CD133+ CCSCs cannot be fully reflected after the inhibition of miR-342-3p by lentivirus. In addition, we found that the downregulation of miR-342-3p can promote the expression of CD133 mRNA in CD133+ CCSCs, suggesting that miR-342-3p is involved in the regulation of CD133 protein expression. MET intervention reduced the increase in CD133+ CCSC CD133 mRNA expression caused by the downregulation of miR-342-3p. Combined with the results of our previous studies,33 the findings in this study support the conclusion that the upregulation of miR-342-3p is involved in the inhibition of CD133+ CCSC CD133 protein expression by MET. However, it is still unclear whether miR-342-3p directly targets CD133 regulation, and its specific mechanism needs to be further explored. At the same time, this experiment has some shortcomings: for example, no miR-342-3p overexpression experiment was carried out, only miR-342-3p was selected as the target miRNA for lentivirus infection experiment.
Conclusion
The results of this study showed that MET can upregulate the expression of miR-342-3p in CD133+ CCSCs, promote the apoptosis of CD133+ CCSCs, and inhibit the proliferation of CD133+ CCSCs in a high-glucose environment, but this effect may not be achieved through the upregulation of miR-342-3p. In addition, MET can decrease the expression of CD133 mRNA in CD133+ CCSCs by upregulating miR-342-3p in a high-glucose environment, providing new ideas for the future treatment of patients with diabetes and colon cancer with MET.
Abbreviations
CCSCs, colon cancer stem cells; CRC, colorectal cancer; CSCs, cancer stem cells; MET, metformin; T2DM, type 2 diabetes mellitus; TICs, tumor-initiating cells; IARC, International Agency for Research on Cancer.
Data Sharing Statement
The data sets used to support the findings of this study are available from the corresponding authors upon request.
Author Contributions
All authors made substantial contributions to conception and design, acquisition of data, or analysis and interpretation of data; took part in drafting the article or revising it critically for important intellectual content; agreed to submit to the current journal; gave final approval of the version to be published; and agreed to be accountable for all aspects of the work.
Funding
This work was supported by the Natural Science Foundation of Anhui Province (grant. no.1508085MH150; grant no. 2108085MH269).
Disclosure
The authors declare no conflict of interest.
References
1. Beagley J, Guariguata L, Weil C, Motala AA. Global estimates of undiagnosed diabetes in adults. Diabetes Res Clin Pract. 2014;103(2):150–160. doi:10.1016/j.diabres.2013.11.001
2. Gakidou E, Mallinger L, Abbott-Klafter J, et al. Management of diabetes and associated cardiovascular risk factors in seven countries: a comparison of data from national health examination surveys. Bull World Health Organ. 2011;89(3):172–183.
3. Han K, Xi YF, Wang WR. Epidemiological investigation of diabetes and impaired fasting blood glucose among Mongolian residents over 35 years old in Inner Mongolia Autonomous Region. J Chronic Dis. 2018;19(01):8–11.
4. Kai F. Epidemiological status and risk factors of diabetes and impaired fasting blood glucose among residents aged 40-79 in Beijing. Chin General Pract. 2019;22:1014–1020.
5. Liqun L. Epidemiological investigation and risk factor analysis of adult diabetes in Jiangxi Province. Jiangxi Med. 2019;54(1143–1147):1153.
6. Hemminki K, Li X, Sundquist J, Sundquist K. Risk of cancer following hospitalization for type 2 diabetes. Oncologist. 2010;15(6):548–555.
7. Giovannucci E, Michaud D. The role of obesity and related metabolic disturbances in cancers of the colon, prostate, and pancreas. Gastroenterology. 2007;132(6):2208–2225.
8. Hjartåker A, Langseth H, Weiderpass E. Obesity and diabetes epidemics: cancer repercussions. Adv Exp Med Biol. 2008;630:72–93.
9. Wojciechowska J, Krajewski W, Bolanowski M, Kręcicki T, Zatoński T. Diabetes and Cancer: a Review of Current Knowledge. Exp Clin Endocrinol Diabetes. 2016;124(5):263–275.
10. Zhou XH, Qiao Q, Zethelius B, et al. Diabetes, prediabetes and cancer mortality. Diabetologia. 2010;53(9):1867–1876.
11. Sung H, Ferlay J, Siegel RL, et al. Global cancer statistics 2020: GLOBOCAN estimates of incidence and mortality worldwide for 36 cancers in 185 countries. CA Cancer J Clin. 2021;71(3):209–249.
12. Siegel RL, Miller KD, Goding Sauer A, et al. Colorectal cancer statistics, 2020. CA Cancer J Clin. 2020;70(3):145–164.
13. van de Poll-franse LV, Houterman S, Janssen-Heijnen ML, Dercksen MW, Coebergh JW, Haak HR. Less aggressive treatment and worse overall survival in cancer patients with diabetes: a large population based analysis. Int j Cancer. 2007;120(9):1986–1992.
14. Zhang ZJ, Zheng ZJ, Kan H, et al. Reduced risk of colorectal cancer with metformin therapy in patients with type 2 diabetes: a meta-analysis. Diabetes Care. 2011;34(10):2323–2328.
15. Zhao X, Li Y, Chen M, et al. Effects of different doses of metformin treatment for 6 months on aberrant crypt foci in Chinese patients with impaired glucose tolerance. Eur J Cancer Prev. 2015;24(1):27–36.
16. Gong J, Kelekar G, Shen J, Shen J, Kaur S, Mita M. The expanding role of metformin in cancer: an update on antitumor mechanisms and clinical development. Target Oncol. 2016;11(4):447–467.
17. Fedyanin M, Anna P, Elizaveta P, Sergei T. Role of stem cells in colorectal cancer progression and prognostic and predictive characteristics of stem cell markers in colorectal cancer. Curr Stem Cell Res Ther. 2017;12(1):19–30.
18. Rao M, Gao C, Guo M, Law BYK, Xu Y. Effects of metformin treatment on radiotherapy efficacy in patients with cancer and diabetes: a systematic review and meta-analysis. Cancer Manag Res. 2018;10:4881–4890.
19. Tomasetti C, Vogelstein B. Cancer etiology. Variation in cancer risk among tissues can be explained by the number of stem cell divisions. Science (New York, NY). 2015;347(6217):78–81.
20. Yu Z, Zhao G, Li P, et al. Temozolomide in combination with metformin act synergistically to inhibit proliferation and expansion of glioma stem-like cells. Oncol Lett. 2016;11(4):2792–2800.
21. Shi P, Liu W. Tala, et al. Metformin suppresses triple-negative breast cancer stem cells by targeting KLF5 for degradation. Cell Discovery. 2017;3:17010.
22. Courtois S, Durán RV, Giraud J, et al. Metformin targets gastric cancer stem cells. Eur J Cancer. 2017;84:193–201.
23. Yin AH, Miraglia S, Zanjani ED, et al. AC133, a novel marker for human hematopoietic stem and progenitor cells. Blood. 1997;90(12):5002–5012.
24. Klose J, Eissele J, Volz C, et al. Salinomycin inhibits metastatic colorectal cancer growth and interferes with Wnt/β-catenin signaling in CD133(+) human colorectal cancer cells. BMC Cancer. 2016;16(1):896.
25. Tang Y, Berlind J, Mavila N. Inhibition of CREB binding protein-beta-catenin signaling down regulates CD133 expression and activates PP2A-PTEN signaling in tumor initiating liver cancer cells. Cell Commun Signal. 2018;16(1):9.
26. Khan AQ, Ahmed EI, Elareer NR, Junejo K, Steinhoff M, Uddin S. Role of miRNA-regulated cancer stem cells in the pathogenesis of human malignancies. Cells. 2019;8:8.
27. Jiang L, Hermeking H. miR-34a and miR-34b/c suppress intestinal tumorigenesis. Cancer Res. 2017;77(10):2746–2758.
28. Ebrahimi F, Gopalan V, Wahab R, Lu CT, Smith RA, Lam AK. Deregulation of miR-126 expression in colorectal cancer pathogenesis and its clinical significance. Exp Cell Res. 2015;339(2):333–341.
29. Yang F, Xie YQ, Tang SQ, Wu XB, Zhu HY. miR-143 regulates proliferation and apoptosis of colorectal cancer cells and exhibits altered expression in colorectal cancer tissue. Int J Clin Exp Med. 2015;8(9):15308–15312.
30. Sheng N, Tan G, You W, et al. MiR-145 inhibits human colorectal cancer cell migration and invasion via PAK4-dependent pathway. Cancer Med. 2017;6(6):1331–1340.
31. Wang H, Wu J, Meng X, et al. MicroRNA-342 inhibits colorectal cancer cell proliferation and invasion by directly targeting DNA methyltransferase 1. Carcinogenesis. 2011;32(7):1033–1042.
32. Bao B, Wang Z, Ali S, et al. Metformin inhibits cell proliferation, migration and invasion by attenuating CSC function mediated by deregulating miRNAs in pancreatic cancer cells. Cancer Prev Res. 2012;5(3):355–364.
33. Zhang Q, Chen M, Zhao X, Wang L. Preliminary study of the effects of metformin on proliferation, apoptosis and the expression of CD133 in colon cancer stem cells. Chin J Diabetes. 2017;25:639–643.
34. Zhou Q, Chen A, Song H, Tao J, Yang H, Zuo M. Prognostic value of cancer stem cell marker CD133 in ovarian cancer: a meta-analysis. Int J Clin Exp Med. 2015;8(3):3080–3088.
35. Ricci-Vitiani L, Lombardi DG, Pilozzi E, et al. Identification and expansion of human colon-cancer-initiating cells. Nature. 2007;445(7123):111–115.
36. Liu C, Kelnar K, Liu B, et al. The microRNA miR-34a inhibits prostate cancer stem cells and metastasis by directly repressing CD44. Nat Med. 2011;17(2):211–215.
37. Hao J, Zhao S, Zhang Y, et al. Emerging role of microRNAs in cancer and cancer stem cells. J Cell Biochem. 2014;115(4):605–610.
38. Liu Y, Zhang B, Wen C, et al. [Overexpressed miRNA-134b inhibits proliferation and invasion of CD133(+) U87 glioma stem cells]. Xi bao yu Fen Zi Mian Yi Xue Za Zhi/Chin J Cell Mol Immunol. 2017;33(5):637–642. Chinese.
39. Huang SX, Zhao ZY, Weng GH, et al. Upregulation of miR-181a suppresses the formation of glioblastoma stem cells by targeting the Notch2 oncogene and correlates with good prognosis in patients with glioblastoma multiforme. Biochem Biophys Res Commun. 2017;486(4):1129–1136.
40. Nangia-Makker P, Yu Y, Vasudevan A, et al. Metformin: a potential therapeutic agent for recurrent colon cancer. PLoS One. 2014;9(1):e84369.
41. Yang S, Li Y, Gao J, et al. MicroRNA-34 suppresses breast cancer invasion and metastasis by directly targeting Fra-1. Oncogene. 2013;32(36):4294–4303.
42. Yamamura S, Saini S, Majid S, et al. MicroRNA-34a modulates c-Myc transcriptional complexes to suppress malignancy in human prostate cancer cells. PLoS One. 2012;7(1):e29722.
43. Chiyomaru T, Tatarano S, Kawakami K, et al. SWAP70, actin-binding protein, function as an oncogene targeting tumor-suppressive miR-145 in prostate cancer. Prostate. 2011;71(14):1559–1567.
44. Spizzo R, Nicoloso MS, Lupini L, et al. miR-145 participates with TP53 in a death-promoting regulatory loop and targets estrogen receptor-alpha in human breast cancer cells. Cell Death Differ. 2010;17(2):246–254.
45. Kano M, Seki N, Kikkawa N, et al. miR-145, miR-133a and miR-133b: tumor-suppressive miRNAs target FSCN1 in esophageal squamous cell carcinoma. Int J Cancer. 2010;127(12):2804–2814.
46. Slaby O, Svoboda M, Fabian P, et al. Altered expression of miR-21, miR-31, miR-143 and miR-145 is related to clinicopathologic features of colorectal cancer. Oncology. 2007;72(5–6):397–402.
47. Tai HC, Chang AC, Yu HJ, et al. Osteoblast-derived WNT-induced secreted protein 1 increases VCAM-1 expression and enhances prostate cancer metastasis by down-regulating miR-126. Oncotarget. 2014;5(17):7589–7598.
48. Li XR, Chu HJ, Lv T, Wang L, Kong SF, Dai SZ. miR-342-3p suppresses proliferation, migration and invasion by targeting FOXM1 in human cervical cancer. FEBS Lett. 2014;588(17):3298–3307.
49. Komoll RM, Hu Q, Olarewaju O, et al. MicroRNA-342-3p is a potent tumor suppressor in hepatocellular carcinoma. J Hepatol. 2021;74(1):122–134.
50. Tao K, Yang J, Guo Z, et al. Prognostic value of miR-221-3p, miR-342-3p and miR-491-5p expression in colon cancer. Am J Transl Res. 2014;6(4):391–401.
51. Lindholm EM, Leivonen SK, Undlien E, et al. miR-342-5p as a potential regulator of HER2 breast cancer cell growth. MicroRNA (Shariqah, United Arab Emirates). 2019;8(2):155–165.
52. Liu Q, Wang Z, Zhou X, et al. miR-342-5p inhibits osteosarcoma cell growth, migration, invasion, and sensitivity to Doxorubicin through targeting Wnt7b. Cell Cycle (Georgetown, Tex). 2019;18(23):3325–3336.
53. Yang H, Li Q, Niu J, et al. microRNA-342-5p and miR-608 inhibit colon cancer tumorigenesis by targeting NAA10. Oncotarget. 2016;7(3):2709–2720.
54. Zampetaki A, Kiechl S, Drozdov I, et al. Plasma microRNA profiling reveals loss of endothelial miR-126 and other microRNAs in type 2 diabetes. Circ Res. 2010;107(6):810–817.
55. Jiang ZH, Tang YZ, Song HN, Yang M, Li B, Ni CL. miRNA‑342 suppresses renal interstitial fibrosis in diabetic nephropathy by targeting SOX6. Int J Mol Med. 2020;45(1):45–52.
 © 2021 The Author(s). This work is published and licensed by Dove Medical Press Limited. The full terms of this license are available at https://www.dovepress.com/terms.php and incorporate the Creative Commons Attribution - Non Commercial (unported, v3.0) License.
By accessing the work you hereby accept the Terms. Non-commercial uses of the work are permitted without any further permission from Dove Medical Press Limited, provided the work is properly attributed. For permission for commercial use of this work, please see paragraphs 4.2 and 5 of our Terms.
© 2021 The Author(s). This work is published and licensed by Dove Medical Press Limited. The full terms of this license are available at https://www.dovepress.com/terms.php and incorporate the Creative Commons Attribution - Non Commercial (unported, v3.0) License.
By accessing the work you hereby accept the Terms. Non-commercial uses of the work are permitted without any further permission from Dove Medical Press Limited, provided the work is properly attributed. For permission for commercial use of this work, please see paragraphs 4.2 and 5 of our Terms.