")
Back to Journals » Drug Design, Development and Therapy » Volume 17
The Effect of Dihydromyricetin on the Pharmacokinetics of Fluconazole in Sprague-Dawley Rat Plasma, Based on High-Performance Liquid Chromatography–Tandem Mass Spectrometry
Authors Liu H, Dong H, Guo L, Jin Y, Liu L
Received 4 April 2023
Accepted for publication 7 August 2023
Published 31 August 2023 Volume 2023:17 Pages 2657—2667
DOI https://doi.org/10.2147/DDDT.S415813
Checked for plagiarism Yes
Review by Single anonymous peer review
Peer reviewer comments 2
Editor who approved publication: Dr Qiongyu Guo
Hongchuan Liu,1 Huaihuai Dong,2 Liangjun Guo,3 Yongsheng Jin,2 Lihong Liu1
1Department of Pharmacy, Beijing Chaoyang Hospital, Capital Medical University, Beijing, 100020, People’s Republic of China; 2School of Pharmacy, Naval Medical University, Shanghai, 200433, People’s Republic of China; 3Department of Drug and Equipment, The 72st Group Army Hospital of PLA, Huzhou, 313000, People’s Republic of China
Correspondence: Yongsheng Jin, School of Pharmacy, Naval Medical University, No. 325 of Guohe Street, Yangpu District, Shanghai, 200433, People’s Republic of China, Tel/Fax +86 21 8187 1227, Email [email protected] Lihong Liu, Department of Pharmacy, Beijing Chaoyang Hospital, Capital Medical University, No. 8 of Gongti South Street, Chaoyang District, Beijing, 100020, People’s Republic of China, Tel/Fax +86 10 85231786, Email [email protected]
Background: The synergistic effect of dihydromyricetin (DHM) and fluconazole (FLC) can improve the killing effect of FLC-resistant Candida albicans in vitro and in vivo. However, it is not clear whether DHM affects the pharmacokinetic characteristics of FLC.
Methods: In this study, 12 Sprague–Dawley (SD) rats were randomly divided into two groups as follows: (1) an FLC group in which rats were administered FLC only (42 mg/kg orally); (2) an FLC with the combined administration of DHM group, in which rats received an equivalent FLC dose immediately following the administration of DHM (100 mg/kg). Blood samples were collected from the ocular choroid vein of rats and converted into plasma. The concentrations of FLC in the rat plasma were then determined by high-performance liquid chromatography–tandem mass spectrometry (HPLC-MS/MS), and the related pharmacokinetic parameters were analysed. The initial mobile phase included 0.1% acetonitrile and water with gradient elution. Multiple reaction monitoring modes of m/z 307.2→ 220.1 for FLC, and m/z 237.1→ 194.2 for carbamazepine, were utilised to conduct quantitative analysis.
Results: The calibration curve of FLC in rat plasma demonstrated good linearity in the range of 0.1– 30 μg/mL (r > 0.99), and the lower limit of quantification was 0.1 μg/mL. Moreover, the intra- and inter-day precision relative standard deviation of FLC was less than 9.09% and 6.51%, respectively. There were no significant differences in the pharmacokinetic parameters between the two groups.
Conclusion: The results showed that DHM administration did not significantly alter FLC pharmacokinetics in SD rat plasma.
Keywords: HPLC-MS/MS, dihydromyricetin, fluconazole, pharmacokinetic
Introduction
In recent years, the incidence rate of candidiasis has increased dramatically worldwide, leading to high mortality rates in the immunocompromised population. Approximately half of candidiasis cases are caused by Candida albicans infection.1,2 Fluconazole (FLC) is an antifungal agent commonly used to treat C. albicans infections because it is inexpensive, effective, relatively non-toxic, and exhibits high bioavailability. However, the increasingly widespread use of FLC as a first-line antifungal treatment has led to the development of drug-resistant fungi,3,4 thereby increasing the time and cost requirements of novel antifungal agents. To overcome these problems, researchers have recently sought to develop antifungal sensitising agents that can be administered in combination with FLC as an alternative treatment strategy.5–9
Dihydromyricetin (DHM) is a flavonoid with antibacterial effects. In the case of DHM, this effect is primarily destroying the structural integrity of bacteria and undermining the selective permeability of cell membranes for releasing nucleic acids, polysaccharides, and other bacterial content.10,11 In this way, the normal operation of membrane function is hindered, which seriously affects its metabolism and leads to bacterial death.11
Some studies have found 2R,3R-dihydromyricetin (DMY) to have a strong inhibitory effect on the growth of Staphylococcus aureus.12 In the current authors’ previous study, combining FLC and DHM effectively mediated the killing of FLC-resistant C. albicans with a fractional inhibitory concentration index below 0.1. The data suggested that FLC and DHM synergistically killed resistant C. albicans strains in vitro and in vivo (patent number: 201610060695.1, State Intellectual Property Office of China).
Although therapeutically promising, DHM has been shown to alter the pharmacokinetics of other co-administered drugs that are metabolically processed by cytochrome P450 (CYP) family enzymes (CYP2E1, CYP3A4, and CYP2D6). Moreover, FLC functions as a CYP isoenzyme substrate and inhibitor, linking it with a range of drug–drug interactions.13–15 The authors’ prior research underscored the clinical importance of FLC and DHM co-administration in a clinical setting, but the impact of DHM on the pharmacokinetic properties of FLC remains unclear. The effect of DHM on the pharmacokinetics of FLC must be studied to ensure that the plasma concentration of FLC is not affected by DHM.
Current methods for the determination of the plasma concentration of fluconazole include HPLC and HPLC–MS/MS. Sample preparation is a crucial procedure requiring both reliability and convenience. The existing sample pretreatment methods include LLE, SPE and PPT. Kamran Bashir et al16 developed a solid phase extraction (SPE) method for determination of fluconazole in rat plasma samples by HPLC. The SPE method was recognized as the most efficient and eliminated interferences from proteins (and even lipids). Due to the optimization of solid-phase extraction conditions, the nonspecific interaction was reduced and the extraction recovery of fluconazole was increased in plasma samples. Angela Eerkes et al17 developed a liquid/liquid extraction using 96-well plate format in conjunction with hydrophilic interaction liquid chromatography-tandem mass spectrometry method for the analysis of fluconazole in human plasma. LLE is another common method for separation of lipophilic compounds using proper extraction solvents. However, compared with the time and organic solvent consumed by SPE and LLE, PPT method was simple and rapid and it can also accurately quantify drug concentration in plasma, therefore, a direct PPT method was used to simplify the pretreatment steps. Additionally, in other aspects, such as the standard range, LLOQ and run time, the methods used in this research are similar or superior to some other methods published recently.18–21
Drug interactions can reduce the bioavailability of a particular medication, which can lead to treatment failure or increase the likelihood of side effects and even toxicity. There are currently no reports on the combined use of FLC and DHM drugs. Therefore, in this study, the authors established a rapid and sensitive method for measuring FLC levels in the plasma of Sprague–Dawley (SD) rats following oral DHM administration via high-performance liquid chromatography–tandem mass spectrometry (HPLC-MS/MS) and investigated the effects of DHM on the pharmacokinetics of FLC.
Materials and Methods
Reagents and Chemicals
The FLC (lot EXZOF-KF, >98.0% purity) used in this study was purchased from Tokyo Chemical Industry Co., Ltd. (North District, Tokyo, Japan). The carbamazepine (lot 100142–201706, 100% purity) was purchased as an internal standard (IS) from the National Institutes for Food and Drug Control (Beijing, China). The HPLC-grade acetonitrile and methanol were purchased from Fisher (NJ, USA), and the HPLC-grade ammonium acetate (lot 2540257) and formic acid (lot 7610732) were purchased from Decoma Technologies (CA, USA). Ultrapure water with a resistivity of 18.2 MΩ × cm and a total organic carbon value of 5–10 ppm was prepared using a water purification system (Millipore, MA, USA).
Animals
The SD rats (male, 310 ± 20 g; female, 270 ± 20 g) were obtained from Beijing Zhongsheng Beidong Science and Technology Development Co., Ltd (license no. SCXK Beijing 2019–0010) and housed in a climate-controlled environment (25°C ± 2°C, 50% ± 10% relative humidity, 12-h light/dark cycle) for three days with free access to food (standard rodent chow).22 The animals were fasted for 12 h before conducting the experiment and had free access to water. For the (PK) study, the rats were randomly assigned to two groups (three males and three females per group).
Ethical Statement
All the experiments were performed in accordance with China’s Guidelines for Care and Use of Laboratory Animals. The animal study was approved by the ethics committee and the welfare of the animals met the relevant requirements.
High-Performance Liquid Chromatography-Tandem Mass Spectrometry Analytical Conditions
The HPLC-MS/MS analyses were conducted using an AB SCIEX 3200 MD MS system (CA, USA) with a Shimadzu HPLC-20AD (Japan) instrument. The Analyst (AB SCIEX, v.1.6.3) software program was used for data acquisition and processing.
An XBrige C18 column (Waters, 2.1×50 mm, 3.5-μm particles) was used for chromatographic separation with a mobile phase that included methanol containing 0.1% formic acid (A) and water containing 0.1% formic acid and 2 mmol/L ammonium acetate (B). The gradient elution settings were as follows: a flow rate of 0.4 mL/min, 0–0.3 min, 80% B; 0.3–0.5 min, 80–5% B; 0.5–1.5 min, 5% B; 1.5–1.7 min, 5–80% B; 1.7–4 min, 80% B.
The column oven and autosampler were maintained at room temperature, and the analyses were conducted in positive multiple reaction monitoring modes. The precursor and product ions were m/z 307.2→220.1 for FLC and m/z 237.1→194.2 for IS, and the temperature and ion spray voltage values were set to 500°C and 5500 V, respectively. The curtain gas was set to 10 psi, with both ion source gas 1 and ion source gas 2 set to 50 psi. The declustering potential, collision energy, entrance potential, and collision cell exit potential for FLC were 60, 22, 10, and 4 V, respectively, while for IS, these values were 52, 26, 10, and 4 V, respectively. The structure and spectra corresponding to FLC are shown in Figure 1.
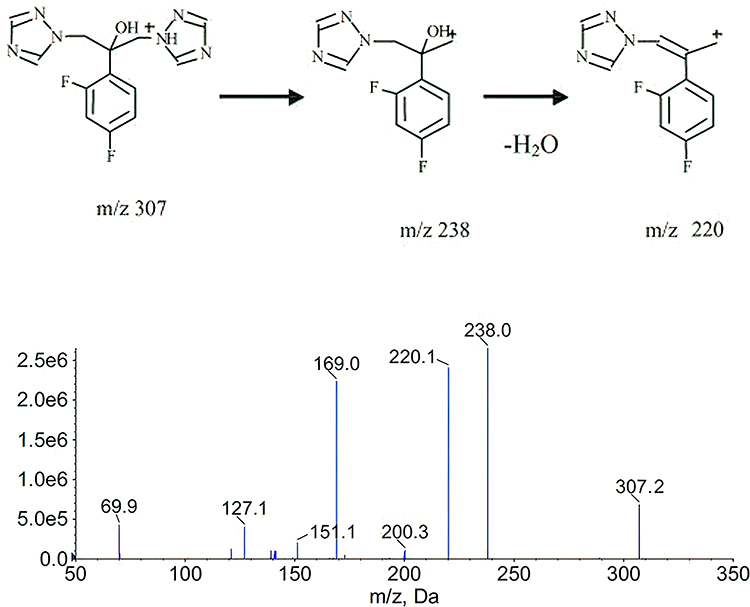 |
Figure 1 Fluconazole product ion mass spectra (m/z 307.2→220.1) in positive ionization mode. |
Standard and Quality Control Sample Preparation
The FLC (1.0 mg/mL) and carbamazepine (1.0 mg/mL) stock solutions were prepared in methanol. The carbamazepine was then further diluted using methanol to a working IS concentration (24 μg/mL), and the stock and working solutions were stored at –70°C and –20°C, respectively. The samples were warmed to room temperature before use.23
Methanol was used to dilute the stock FLC to 600 μg/mL; then, 50 μL of this solution was mixed with 950 μL of drug-free plasma and then diluted with drug-free plasma to concentrations of 0.1, 0.2, 0.4, 1.0, 2.0, 5.0, 15.0, and 30.0 μg/mL to generate a standard curve. The quality control (QC) samples were comparably prepared at concentrations of 0.3, 3.0, and 24.0 μg/mL (LQC, MQC, and HQC, respectively).
Sample Preparation
Dihydromyricetin was administered to the animals in the DHM + FLC treatment group (100 mg/kg in 0.5% sodium carboxymethyl cellulose) [a]; following on, FLC (42 mg/kg in distilled water) was orally administered to the animals in both groups [b]. As DHM had previously been shown to be almost completely metabolised within 12 h of oral administration,24,25 the authors did not assess the effect of multiple rounds of DHM administration on the pharmacokinetics of FLC. Blood samples (200 μL) were collected from the ocular choroid vein of the rats into tubes that had been pretreated with dipotassium ethylenediaminetetraacetic acid at 0.33, 0.67, 1, 1.5, 2, 3, 4, 6, 9, 12, 24, 48, 72, and 96 h after oral FLC administration. These samples were spun for 10 min at 2800 ×g, after which the obtained plasma supernatant samples were frozen at –70°C until their use for the analysis.
Samples of methanol (5 μL) supplemented with IS (24 g/mL) were combined with 50 μL plasma samples, after which protein precipitation was achieved via the addition of 200 μL acetonitrile. The samples were vortexed for 60s and centrifuged for 5 min at 2800 ×g, and 100 μL of supernatant was transferred to another tube and diluted with 500 μL water. This sample was then transferred to an autosampler vial, and a 5-μL aliquot was injected for analysis.
Methodological Validation
According to the guidelines of the US Food and Drug Administration,26 method verification mainly includes the evaluation of specificity, linear range, precision, accuracy, stability, recovery rate and detection limit. For example, Xu et al27 developed an UPLC- MS method for simultaneous determination of imatinib, voriconazole and their metabolites in rat plasma, and evaluated the specificity, linear range, precision, accuracy, stability, recovery rate and LLOQ. Tang et al28 also established and verified an UPLC/MS-MS method for the study of drug interactions in vivo, which confirmed the linear range, precision, accuracy, stability and selectivity. Combined with the guiding principles of the Pharmacopoeia of the People’s Republic of China (2020)29 and the European Medicines Agency,30 we evaluated the selectivity, lower limit of quantitation (LLOQ), residual effect, linearity, accuracy, precision, recovery, matrix effect, haemolysis effect, dilution effect and stability.
Selectivity and the Lower Limit of Quantification
The selectivity was evaluated according to the plasma samples of 6 different rats that were free of FLC and an IS. The LLOQ (0.1 μg/mL) was the lowest concentration analyzed in the experimental calibration curve. The overall selectivity was deemed satisfactory when any interference associated with the retention times of the analysed analyte was <20% of the LLOQ and <5% of the IS working concentration. The LLOQ sample inaccuracy had to be within ± 20%, while the within- and between-run coefficient of variation (CV) values had to be less than 20% to be considered satisfactory.
The Carry-Over Effect and Linearity
The highest-concentration calibration sample (upper limit of quantification, [ULOQ], 30.0 μg/mL) was analysed, after which plasma samples free of FLC and IS were injected thrice to assess the carry-over effect. A maximum peak area for the blank samples comprising <20% of the peak area for the LLOQ sample for FLC and <5% for IS was considered acceptable The calibration curves were expressed as the ratio between the peak area (FLC/IS) and the nominal concentration. A weighted least-squares linear regression (1/x2) approach was used to determine the intercept, correlation coefficient, and slope values. The calibration standard was ±15% of the nominal value for all samples other than the LLOQ samples (±20%).
Accuracy and Precision
The accuracy and precision were assessed by preparing six samples at the LLOQ, LQC, MQC, and HQC concentrations for each of the three analysis batches. When calculated, the LQC, MQC, and HQC sample concentrations were within ±15% of the nominal concentrations, and the calculated LLOQ sample concentrations were within ±20% of the nominal concentrations. The inter- and intra-day accuracies were considered to be acceptable In addition, the within and between-run CV values could not exceed 15% (or 20% for the LLOQ samples).
Recovery and Matrix Effect
The extraction recovery and matrix effects were assessed using blank plasma samples from six rats to prepare the LQC, MQC, and HQC samples as follows: (A) FLC and IS, spiked into drug-free plasma and subjected to protein precipitation; (B) FLC and IS, spiked into drug-free plasma following protein precipitation; (C) FLC and IS, spiked into samples of water. The recovery was calculated as A/B × 100%, while the IS normalised matrix factor was calculated as (B – FLC / C–FLC) / (B – IS / C – IS) × 100%, where A, B, and C corresponded to peak areas. All analyses were performed in triplicate. The results were considered satisfactory if the recovery was consistent and if the CV of the IS-normalised matrix factor was <15%.
The Effects of Haemolysis and Sample Dilution
To gauge the impact of haemolysis on the FLC measurements, drug-free plasma was spiked with haemolytic whole blood (5%, v/v) before use for the preparation of six replicate LQC, MQC, and HQC samples. The dilution effects were assessed to determine the efficacy of this approach for analysing samples above the ULOQ. For these analyses, 40 μg/mL of FLC-containing plasma was diluted with an equivalent volume of blank plasma. The haemolysis and dilution effects were considered acceptable when the inaccuracy was within ±15%, and the imprecision did not exceed 15%.
Stability
The LQC, MQC, and HQC sample accuracy values were assessed after storage under a range of conditions to assess the FLC stability. The tested stability conditions included post-preparative stability in the autosampler (24 h at 22°C ± 2°C), short-term stability (24 h at 25°C ± 5°C, 3 days at 4°C), long-term stability (150 days at –70°C), freeze-thaw stability (three cycles from –70°C to room temperature), and whole-blood stability (5 days at 4°C, 24 h at 25 ± 5°C). The stability analyses were repeated six times and were considered acceptable if the measured FLC levels were within ±15% of the nominal levels.
Statistical Analysis
Plasma samples from 12 SD rats were analysed to assess the FLC pharmacokinetic parameters via a non-compartmental analysis, with individual parameters calculated using WinNonLin (Pharsight Corporation, v.8.1, CA, USA). The calculated parameters included the area under the plasma concentration-time curve, maximal plasma concentration, time to maximal plasma concentration, elimination half-life, plasma clearance, apparent volume of distribution, and mean residence time; all values were presented as means ± standard deviation.
The SPSS software (v.16.0, SPSS Inc., IL, USA) was used to compare the primary pharmacokinetic parameters between groups using a Student’s t-test, and P < 0.05 was considered to indicate a significant difference.
Results
Overall, based on HPLC-MS/MS, the authors successfully designed and validated a sensitive, rapid, and selective method for verifying the plasma FLC concentration. Concurrently, DHM pretreatment was found to have had no significant effect on the pharmacokinetics of FLC PK.
Method Validation
Selectivity and the Lower Limit of Quantification
Blank plasma samples taken from 6 SD rats revealed that endogenous substances had not interfered with the ability to detect FLC in the plasma samples. While an interfering peak was observed at the time of carbamazepine elution (ie IS), the response was <5% of that at the LLOQ concentration and did not interfere with the FLC measurements. The calculated signal-to-noise ratio, imprecision, and inaccuracy values of the LLOQ samples were 53.2, <9.09%, and 0.00% ~ 10.00%, respectively. As such, the approach presented herein could be reliably used to measure FLC concentrations at or above the LLOQ. Chromatograms corresponding to the FLC and IS-free plasma, the blank plasma spiked with these substances at the LLOQ (0.1 μg/mL), and rat plasma samples are shown in Figure 2.
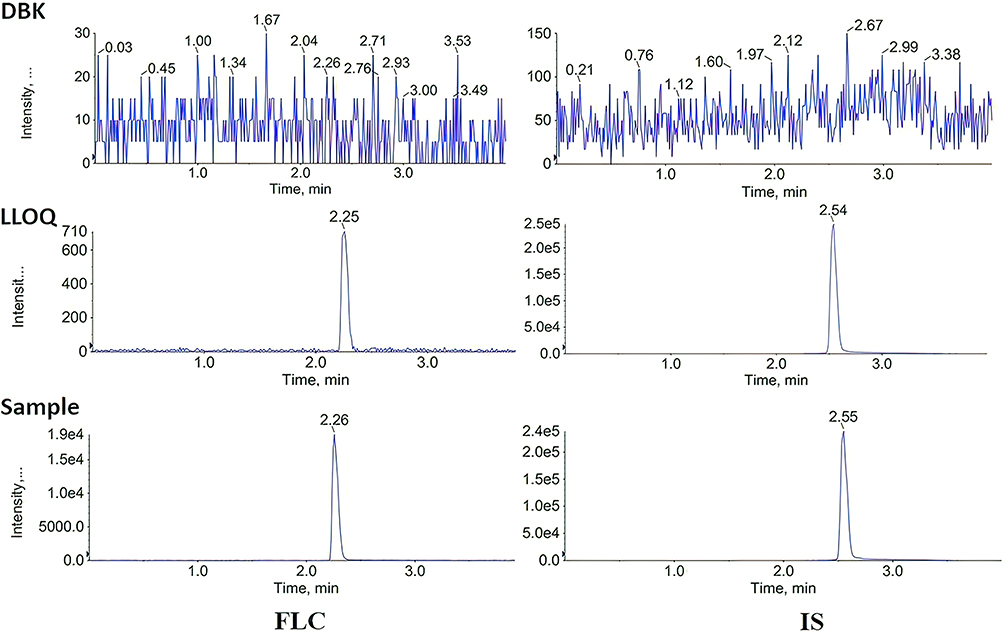 |
Figure 2 Chromatograms corresponding to FLC and IS in drug-free plasma, blank plasma spiked with FLC and IS attheLLOQ (0.1 μg/mL), and a rat plasma sample. |
The Carry-Over Effect and Linearity
The analyte peak area values in the drug-free samples, which were analysed after the highest-concentration calibration standard analysis, were <19.22% for FLC and <0.43% for IS, indicating a negligible carry-over effect. The calibration curves were linear within the assessed range (0.1–30.0 μg/mL), yielding a correlation coefficient of >0.99 when analysed using a weighted (1/x2) linear regression.
Accuracy and Precision
At the LLOQ and three tested QC levels, the intra- and inter-day accuracy values for this analytical approach were 88.33–110.00% and 91.78%–106.43%, respectively, while the intra- and inter-day imprecision values were <9.09% and 6.51%, respectively. All of these values were within acceptable limits and are shown in Table 1.
 |
Table 1 Intra-Day and Inter-Day Precision and Accuracy Values |
Recovery and Matrix Effects
At the three levels of the tested QC samples, the recovery and matrix effects were 104.98–119.98% and 100.23%–105.55%, respectively, with corresponding imprecision values being <5.56% and 9.59%. As such, the recovery and matrix effects associated with this analysis were acceptable (Table 2).
 |
Table 2 Recovery and Matrix Effect Data of FLC (n=6) |
The Effects of Haemolysis and Sample Dilution
At the three tested QC levels, the haemolytic plasma sample (5%, v/v) inaccuracy values ranged from –3.33% to 1.00%, and the imprecision was <2.63%. As such, no effect of haemolysis on this analytical process was observed. For the diluted samples, the inaccuracy and imprecision values were –3.00% and 1.91%, respectively. Taken together, these data indicated that this approach could be reliably used to measure analyte concentrations above the ULOQ.
Stability
The FLC remained stable under all tested conditions (Table 3), with stability accuracy values of 93.33–106.65% for the three QC sample levels.
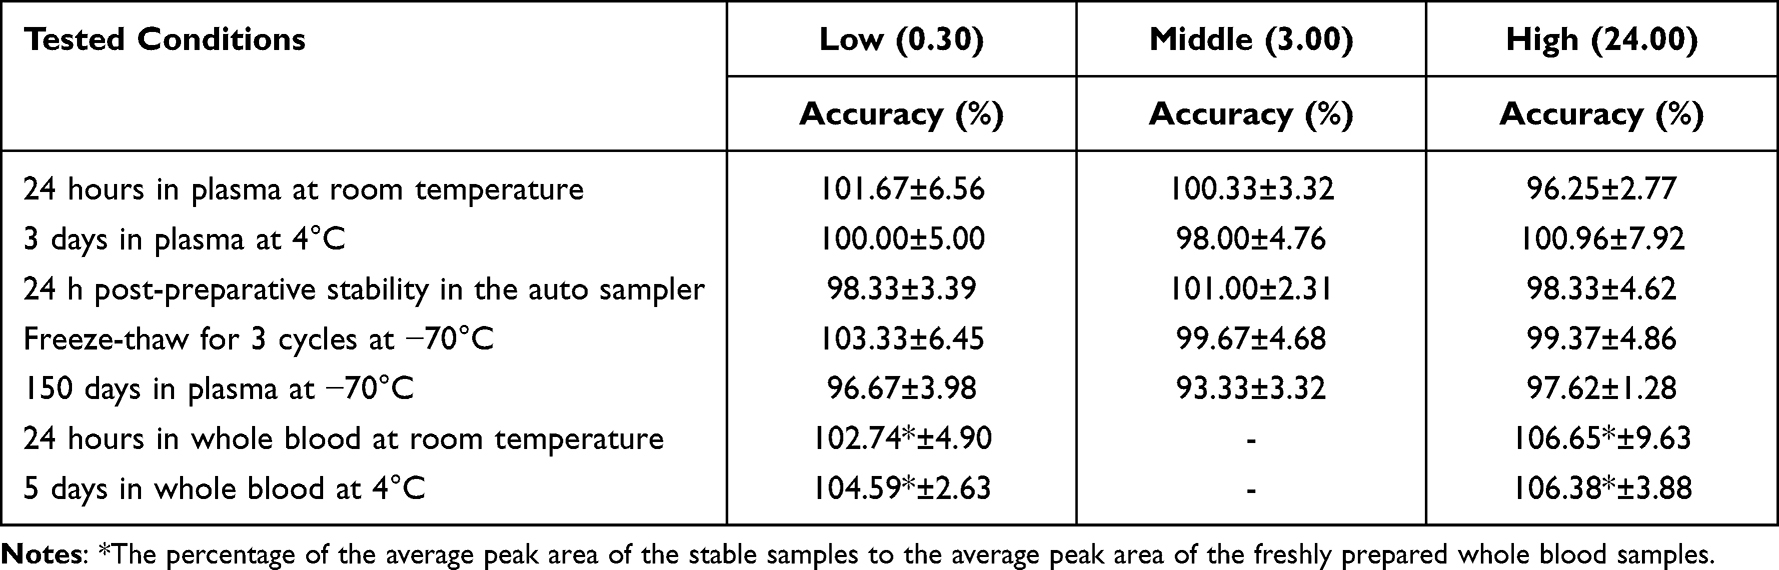 |
Table 3 Stability of FLC Under Tested Conditions (n =6) |
PK Analyses
The mean FLC plasma concentration-time curves in the two treatment groups were generated (Figure 3), and a non-compartmental analysis was used to calculate the associated pharmacokinetic parameters (Table 4). No significant differences in the FLC pharmacokinetic parameters were detected following DHM pretreatment (P>0.05), indicating that no meaningful interactions occurred between FLC and DHM and that these two drugs could be safely co-administered without dose adjustments.
 |
Table 4 Primary FLC Pharmacokinetic Parameters in SD Rats |
 |
Figure 3 Mean plasma concentration-time curves for FLC in the FLC only and FLC+ dihydromyricetin combination treatment groups. |
Discussion
In this study, we were able to successfully design and validate a sensitive, rapid, and selective HPLC-MS/MS approach for measuring plasma FLC levels in SD rats using 50 μL of plasma with an LLOQ of 0.1 μg/mL and a 4 min total run time. The HPLC-MS/MS method was successfully applied to the pharmacokinetic interaction study of FLC and DHM; the results indicated that they did not interfere with each other.
As HPLC-MS/MS approaches exhibit excellent sensitivity and specificity, they are widely used in the field of biological analysis, particularly when analysing complex biological matrices.31 This study is the first to compare the pharmacokinetics of FLC, both in combination with DHM and on its own.
Drug–drug interactions are generally determined according to PK properties, and their effects can be observed during absorption, distribution, metabolism, and/or excretion.32 Such interactions are increasingly being recognised as important clinical events, as they can produce irrelevant, synergistic, additive, or antagonistic outcomes.
The preliminary studies conducted by our group showed that the combination of FLC and DHM could be used to treat FLC-resistant C. albicans infection. Therefore, it is important to determine whether there are any potential drug interactions between these drugs to prevent adverse reactions and to adjust the dosage as necessary before their combined use.
In this study, we compared key pharmacokinetic parameters when FLC was administered on its own or with DHM. All calculated pharmacokinetic parameters upon co-administration of FLC and DHM were found to be similar to those following FLC single-agent administration. As such, DHM did not have any substantial impact on FLC pharmacokinetics, indicating that it may have no significant effect or limited effect on the metabolism and transport of fluconazole. Dihydromyricetin, as a CYP3A4 inhibitor, did not significantly inhibit the metabolism of fluconazole by CYP3A4 at the concentration of this study. Individual differences may also be one of the reasons for the different results. Subsequent studies need to increase the sample size for verification.
This study nonetheless had some limitations. Healthy rats were used, and potential drug interactions in rats with abnormal liver and kidney functionality were not evaluated. The HPLC-MS/MS method used in this study can sensitively and quantitatively detect fluconazole, but the concentration of dihydromyricetin was not determined, and the actual concentration in vivo could not be determined, which may be one of the factors affecting the results. In future studies, the concentration of dihydromyricetin should be determined simultaneously to evaluate its quantitative relationship with the pharmacokinetics of fluconazole. In vivo experiments also have certain limitations, and cytological experiments are helpful to further explore the mechanism. In order to further reveal the effect of dihydromyricetin on the pharmacokinetics of fluconazole, subsequent studies can increase the dose and action time of dihydromyricetin, increase the sample size and type. In addition, only the effect of DHM on the pharmacokinetics of FLC was studied, ignoring the effect of FLC on the pharmacokinetics of DHM, thereby presenting shortcomings in the study of drug interaction. The results of these follow-up studies can more comprehensively evaluate the drug interaction and mechanism between dihydromyricetin and fluconazole.
Conclusion
In conclusion, the authors successfully established a rapid, simple, and sensitive HPLC-MS/MS method for measuring FLC levels in the plasma of SD rats. The pharmacokinetic characteristics of FLC in rats were explored with the application of this method. The results indicated that DHM did not interfere with FLC pharmacokinetics in SD rats, suggesting that FLC doses did not require adjustment when individuals were treated with a combination of DHM and FLC.
Data Sharing Statement
All data generated or analyzed during this study are included in this published article.
Statement of Ethics
This study was conducted in accordance with the declaration of Helsinki. This study was conducted with approval from the Ethics Committee of Beijing Chaoyang Hospital, Capital Medical University.
Author Contributions
All authors have made a significant contribution to the work reported, whether that is in the conception, study design, execution, acquisition of data, analysis and interpretation, or in all these areas. Have drafted or written, or substantially revised or critically reviewed the article. Have agreed on the journal to which the article will be submitted. Reviewed and agreed on all versions of the article before submission, during revision, the final version accepted for publication, and any significant changes introduced at the proofing stage. Agree to take responsibility and be accountable for the contents of the article.
Funding
This research did not receive any specific grant from funding agencies in the public, commercial, or not-for-profit sectors.
Disclosure
The Authors declare that there is no conflict of interest.
References
1. Li YM, Jiao P, Li YY, Gong Y, Chen XQ, Sun SJ. The synergistic antifungal effect and potential mechanism of D-penicillamine combined with fluconazole against Candida albicans. Front Microbiol. 2019;10:2853. doi:10.3389/fmicb.2019.02853
2. Croaker A, King GJ, Pyne JH, Anoopkumar-Dukie S, Liu L. Sanguinaria canadensis: traditional medicine, phytochemical composition, biological activities and current uses. Int J Mol Sci. 2016;17(9):1414. doi:10.3390/ijms17091414
3. Whaley SG, Berkow EL, Rybak JM, Nishimoto AT, Barke KS, Rogers PD. Azole antifungal resistance in candida albicans and emerging non-albicans candida species. Front Microbiol. 2017;7:2173. doi:10.3389/fmicb.2016.02173
4. Zhang M, Yan HY, Lu MJ, Wang DC, Sun SJ. Antifungal activity of ribavirin used alone or in combination with fluconazole against Candida albicans is mediated by reducing virulence. Int J Antimicrob Agents. 2020;55(1):105804. doi:10.1016/j.ijantimicag.2019.09.008
5. Saibab V, Fatima Z, Singh S, Khan LA, Hameed S. Vanillin confers antifungal drug synergism in Candida albicans by impeding CaCdr2p driven efflux. J Mycol Med. 2020;30(1):100921. doi:10.1016/j.mycmed.2019.100921
6. Lu MJ, Yu CX, Cui XY, Shi JY, Yuan L, Sun SJ. Gentamicin synergises with azoles against drug-resistant Candida albicans. Int J Antimicrob Agents. 2018;51(1):107–114. doi:10.1016/j.ijantimicag.2017.09.012
7. Zhao YJ, Liu WD, Shen YN, Li DM, Zhu KJ, Zhang H. The efflux pump inhibitor tetrandrine exhibits synergism with fluconazole or voriconazole against Candida parapsilosis. Mol Biol Rep. 2019;46(6):5867–5874. doi:10.1007/s11033-019-05020-1
8. Jia W, Zhang HY, Li CY, Li G, Liu XM, Wei J. The calcineruin inhibitor cyclosporine a synergistically enhances the susceptibility of Candida albicans biofilms to fluconazole by multiple mechanisms. BMC Microbiol. 2016;16(1):113. doi:10.1186/s12866-016-0728-1
9. Wang TM, Shao J, Da WY, et al. Strong synergism of palmatine and fluconazole/itraconazole against planktonic and biofilm cells of candida species and efflux-associated antifungal mechanism. Front Microbiol. 2018;9:2892. doi:10.3389/fmicb.2018.02892
10. Luo J, Liu D, Ding LJ. Advances in the detection, pharmacodynamics and pharmacokinetics of dihydromyricetin. Journal of Guangdong University of Technology. 2020;37(3):88–94. doi:10.12052/gdutxb.190067
11. Liu WJ, Ao CJ, Sa YL, Chen SY, Ding H. Antibacterial activity of plant extracts and its mechanism of action. Chinese Journal of Animal Nutrition. 2016;28(8):2344–2452. doi:10.3969/j.issn1006-267x2016.08.004
12. Wu Y, Bai J, Zhong K, Huang Y, Gao H. A dual antibacterial mechanism involved in membrane disruption and DNA binding of 2R,3R-dihydromyricetin from pine needles of Cedrus deodara against Staphylococcus aureus. Food Chem. 2017;218:463–470. doi:10.1016/j.foodchem.2016.07.090
13. Liu L, Sun S, Rui HB, Li XH. In vitro inhibitory effects of dihydromyricetin on human liver cytochrome P450 enzymes. Pharm Biol. 2017;55(1):1868–1874. doi:10.1080/13880209.2017.1339284
14. Bellmann R, Smuszkiewicz P. Pharmacokinetics of antifungal drugs: practical implications for optimized treatment of patients. Infection. 2017;45(6):737–779. doi:10.1007/s15010-017-1042-z
15. Amsden JR, Gubbins PO. Pharmacogenomics of triazole antifungal agents: implications for safety, tolerability and efficacy. Expert Opin Drug Metab Toxicol. 2017;13(11):1135–1146. doi:10.1080/17425255.2017.1391213
16. Bashir K, Chen G, Han J, et al. Preparation of magnetic metal organic framework and development of solid phase extraction method for simultaneous determination of fluconazole and voriconazole in rat plasma samples by HPLC. J Chromatogr B Analyt Technol Biomed Life Sci. 2020;1152:122201. doi:10.1016/j.jchromb.2020.122201
17. Eerkes A, Shou WZ, Naidong W. Liquid/liquid extraction using 96-well plate format in conjunction with hydrophilic interaction liquid chromatography-tandem mass spectrometry method for the analysis of fluconazole in human plasma. J Pharm Biomed Anal. 2003;31(5):917–928. doi:10.1016/s0731-7085(02)00672-6
18. Boonstra JM, Märtson AG, Sandaradura I, et al. Optimization of fluconazole dosing for the prevention and treatment of invasive candidiasis based on the pharmacokinetics of fluconazole in critically ill patients. Antimicrob Agents Chemother. 2021;65(3):e01554–20. doi:10.1128/AAC.01554-20
19. Pan L, Fan X, Jia A, et al. High-throughput identification and determination of antifungal triazoles in human plasma using UPLC-QDa. J Chromatogr B Analyt Technol Biomed Life Sci. 2023;1226:123774. doi:10.1016/j.jchromb.2023.123774
20. Zarad W, El-Gendy H, Bazan L, et al. Bio-analytical liquid chromatographic-based method with a mixed mode online solid phase extraction for drug monitoring of fluconazole in human serum. J Chromatogr B Analyt Technol Biomed Life Sci. 2021;1187:123045. doi:10.1016/j.jchromb.2021.123045
21. Tanaka R, Shiraiwa K, Takano K, et al. High-throughput simultaneous quantification of five azole anti-fungal agents and one active metabolite in human plasma using ultra-high-performance liquid chromatography coupled to tandem mass spectrometry. Clin Biochem. 2022;99:87–96. doi:10.1016/j.clinbiochem.2021.10.010
22. Zhang M, Wen C, Zhang Y, et al. Serum metabolomics in rats models of ketamine abuse by gas chromatography-mass spectrometry. J Chromatogr B Analyt Technol Biomed Life Sci. 2015;1006:99–103. doi:10.1016/j.jchromb.2015.10.037
23. Wang S, Wu H, Huang X, et al. Determination of N-methylcytisine in rat plasma by UPLC-MS/MS and its application to pharmacokinetic study. J Chromatogr B Analyt Technol Biomed Life Sci. 2015;990:118–124. doi:10.1016/j.jchromb.2015.03.025
24. Liu L, Yin XL, Wang X, Li XH. Determination of dihydromyricetin in rat plasma by LC-MS/MS and its application to a pharmacokinetic study. Pharm Biol. 2017;55(1):657–662. doi:10.1080/13880209.2016.1266669
25. Tong Q, Hou XL, Fang JG, et al. Determination of dihydromyricetin in rat plasma by LC-MS/MS and its application to a pharmacokinetic study. J Pharm Biomed Anal. 2015;114:455–461. doi:10.1016/j.jpba.2015.06.030
26. Center for Drug Evaluation and Research of the U.S. Department of health and human services food and drug administration guidance for industry: bioanalytical method validation; 2018.
27. Xu RA, Lin Q, Qiu X, et al. UPLC-MS/MS method for the simultaneous determination of imatinib, voriconazole and their metabolites concentrations in rat plasma. J Pharm Biomed Anal. 2019;166:6–12. doi:10.1016/j.jpba.2018.12.036
28. Tang C, Niu X, Shi L, Zhu H, Lin G, Xu RA. In vivo pharmacokinetic drug-drug interaction studies between fedratinib and antifungal agents based on a newly developed and validated UPLC/MS-MS method. Front Pharmacol. 2021;11:626897. doi:10.3389/fphar.2020.626897
29. Chinese Pharmacopoeia Committee. People’s Republic of China pharmacopoeia (part IV); 2020.
30. European Medicines Agency, Committee for Medicinal Products for Human Use. Guideline on Bioanalytical Method Validation. EMEA/CHMP/EWP/192217/2009; 2011.
31. Mishra A, Chhonker YS, Bisen AC, et al. Rapid and simultaneous analysis of multiple classes of antimicrobial drugs by liquid chromatography-tandem mass spectrometry and its application to routine biomedical, food, and soil analyses. ACS Omega. 2020;5(49):31584–31597. doi:10.1021/acsomega.0c03863
32. Kozloff M, Chuang E, Starr A, et al. An exploratory study of sunitinib plus paclitaxel as first-line treatment for patients with advanced breast cancer. Ann Oncol. 2010;21(7):1436–1441. doi:10.1093/annonc/mdp565
 © 2023 The Author(s). This work is published and licensed by Dove Medical Press Limited. The full terms of this license are available at https://www.dovepress.com/terms.php and incorporate the Creative Commons Attribution - Non Commercial (unported, v3.0) License.
By accessing the work you hereby accept the Terms. Non-commercial uses of the work are permitted without any further permission from Dove Medical Press Limited, provided the work is properly attributed. For permission for commercial use of this work, please see paragraphs 4.2 and 5 of our Terms.
© 2023 The Author(s). This work is published and licensed by Dove Medical Press Limited. The full terms of this license are available at https://www.dovepress.com/terms.php and incorporate the Creative Commons Attribution - Non Commercial (unported, v3.0) License.
By accessing the work you hereby accept the Terms. Non-commercial uses of the work are permitted without any further permission from Dove Medical Press Limited, provided the work is properly attributed. For permission for commercial use of this work, please see paragraphs 4.2 and 5 of our Terms.