")
Back to Journals » Adolescent Health, Medicine and Therapeutics » Volume 10
The effect of a community crash reenactment program on teen alcohol awareness and behavior
Authors Hafner JW , Bleess BB , Famakinwa MF, Wang H, Coleman M
Received 15 November 2018
Accepted for publication 24 April 2019
Published 10 July 2019 Volume 2019:10 Pages 83—90
DOI https://doi.org/10.2147/AHMT.S191079
Checked for plagiarism Yes
Review by Single anonymous peer review
Peer reviewer comments 2
Editor who approved publication: Professor Alastair Sutcliffe
John W Hafner,1 Brandon B Bleess,1 Michelle Folake Famakinwa,2 Huaping Wang,3 Monica Coleman4
1University of Illinois College of Medicine at Peoria, Department of Emergency Medicine, Peoria, IL 616137, USA; 2University of Illinois College of Medicine at Peoria, Peoria, IL, USA; 3University of Illinois College of Medicine at Peoria, Department of Internal Medicine, Peoria, IL, USA; 4American Red Cross Central and Southern Illinois Region, Peoria, IL, USA
Background: Motor vehicle crashes (MVCs) are the leading cause of death in US teens, encompassing greater than one in three deaths. Mock crash reenactments have been used to promote awareness in communities about the effects of drinking and driving. The majority of these programs are for alcohol injury prevention, target high school students, and often involve a scenario of a student driving while under the influence (DUI) and sustaining a fatal car crash.
Objective: The purpose of this study is to evaluate the effectiveness of a regional mock crash reenactment upon the students’ drinking and driving knowledge and behaviors.
Methods: An observational pre-post study was conducted. The survey had seven five-point Likert-scale questions (1 being strongly disagree and 5 strongly agree) measuring outcomes. Students were surveyed before and after the crash reenactment concerning their knowledge and attitudes related to drinking and driving. The survey also included questions that queried participant’s age, gender, alcohol consumption history, and seatbelt usage.
Results: The final study population included 947 pre-surveys and 840 post-surveys. Students demonstrated no significant increase in knowledge-based drinking and driving questions. However, after the reenactment program, students were 1.39 times less likely to report drinking and driving in the future or that they would get into a car with someone who would drive drunk. Students were 1.7 times more likely to report thinking about the risks associated with drinking and driving after participating in the program.
Conclusion: After viewing a mock crash reenactment, students reported they were less likely to drink and drive in the future or get into a car with someone who would drive drunk, and were more likely often think the risks associated with drinking and driving.
Keywords: adolescents, motor vehicle crash, alcohol consumption, DUI, injury prevention
Background
Motor vehicle crashes (MVCs) are the leading cause of death for teenagers in the United States. In 2016, 2,433 American teenagers ages 16–19 died from MVCs, and 292,742 teens were treated in emergency departments for injuries sustained in MVCs.1 In the United States, the fatal crash rate per mile driven for 16–19 year olds is almost three times higher than the rate for drivers aged 20 and older.2 In 2013, teens ages 15–19 made up only 7% of the US population, but accounted for 11% ($10 billion) of the total cost of motor vehicle injuries.1 Although teen drivers are less likely than adults to drive after consuming alcohol, their risk for crashing is substantially higher when they do. It is estimated that 1 in 5 fatally injured teen drivers have blood alcohol concentrations of 0.08% or more.3 In addition to impaired driving, lack of seatbelt use is also another major factor contributing to teen MVCs. In 2016, at least 48% of drivers ages 16–19, who were killed in MVCs, were not wearing a seatbelt at the time of the crash.3 When compared to other age groups, teens have among the lowest rates of seatbelt use. In 2015, only 61% of high school students reported always using a seatbelt when they are in a car with someone else.2
Teen MVCshave proven to be a substantial contributor to the total amount of MVC fatalities in the US as well as the overwhelming economic consequences associated with MVCs. Therefore, it is no surprise that many organizations across the US have developed a number of tools and initiatives in order to educate teens about the dangers of impaired driving and the importance of seatbelt use. In school settings, alcohol misuse prevention usually involves alcohol awareness education, social and peer resistance skills, normative feedback, or development of behavioral norms and positive peer affiliations.4 Multiyear systemic evaluation of school-based alcohol education trials indicates that multi-component interventions for alcohol misuse prevention in adolescents can be effective. In addition, taking a more comprehensive approach to adolescent alcohol misuse prevention can be theoretical supported using the health belief model and social learning theory.5 The theory of social learning postulates the hypothesis that attitudes towards substances, including adolescent alcohol consumption, as well as the expectancies about possible outcomes, are critical factors to misuse. The learning and reinforcement of drinking behaviors in adolescents are thought to occur through both active (alcohol offers) and passive (social modeling and perceived normative behavior) experiences within the social environment.6 Accordingly, a supportive school and community environment should enhance any healthy learning that occurs in the classroom.
Mock crash reenactments have been used in various communities to promote awareness about the effects of drinking and driving. The majority of these programs are for alcohol injury prevention and target high school students, often involving a driving while under the influence (DUI) fatal car crash. In these reenactments, students watch a scripted scene with actual staged damaged vehicles, local police activation, fire-rescue extraction and treatment of crash victims, and an on-scene death of a fellow student. After the scene plays out, witnesses and staff describe the effects of a fatal DUI on friends, family, and a community. The American Red Cross has been a leader in the use of mock crash reenactments. “Operation Prom Night” is a community sponsored crash reenactment program conducted by the Red Cross of Central Illinois secondary to grants from the Illinois Department of Transportation that is staged annually at participating Central Illinois high schools around prom season. Its main focus is to promote safe behaviors and alcohol abstinence, for students that will be participating in prom night festivities.
The use of a comprehensive educational effort that involves students, faculty, parents, and community members and targets a specific facet of adolescent alcohol use is rare, and has not been well studied. The purpose of this study is to evaluate the effectiveness of a mock crash reenactment on the observing student’s knowledge about the risks of drinking and driving as well as their attitudes and behaviors relating to drinking and driving as well as seat belt usage.
Methods
Study design and participants
An observational pre–post study was conducted. The survey used throughout the study was developed internally by the American Red Cross Central Illinois Chapter, because the survey includes sensitive topic (alcohol use) and the survey was anonymous. Students were surveyed before and after the crash reenactment concerning their knowledge and attitudes related to drinking and driving. The Institutional Review Board of the University of Illinois College of Medicine at Peoria reviewed and approved this study prior to initiation. All data remained deidentified throughout the study.
Schools involved with the mock crash reenactment presentation were self-selected and were required to apply to the American Red Cross Central Illinois Chapter to have the presentation for their students. This grant targets six counties in the West-Central Illinois region, including Peoria, Tazewell, Woodford, Marshall, Mason, and Stark counties. These counties make up a geographic area of 3010.09 square miles and account for a population of 393,852 based on the 2010 census.7 Of the population, 23.2% of them are under the age of 18.7 According to the Office of Management and Budget, within the United States Department of Agriculture, Mason county is the only county to qualify as a rural county.8
According to the Illinois Traffic Crash Report Database, in 2010, there were 9,010 MVCs in the targeted counties, with 2,748 of those involving either a driver or occupant in the vehicles involved between the ages of 15–19 (65.9% were the driver).9 According to the 2010 Illinois Youth Survey, 65.7% of 12th grade students and 53.7% of 10th grade students reported ever drinking. In addition, 43.6% of 12th grade students and 31.4% of 10th grade students reported drinking at least once in the prior 30 days to the survey.10 Our study includes the student participants for each crash reenactment event between 2007 and 2011. There were 13 high schools with students aged 14–19 who participated in the program.
The total enrollment over the 5-year study period for the schools involved was 10,415, with 11th grade students counting for 24.49% (2,551 students) and 12th grade students counting for 22.89% (2,384 students). A total of 1,049 students initially completed the pre-survey with 978 completing the post-survey. There were 102 pre-surveys, and 138 post-survey excluded from analysis (Table 1). The total final study population included 947 pre-surveys and 840 post-surveys.
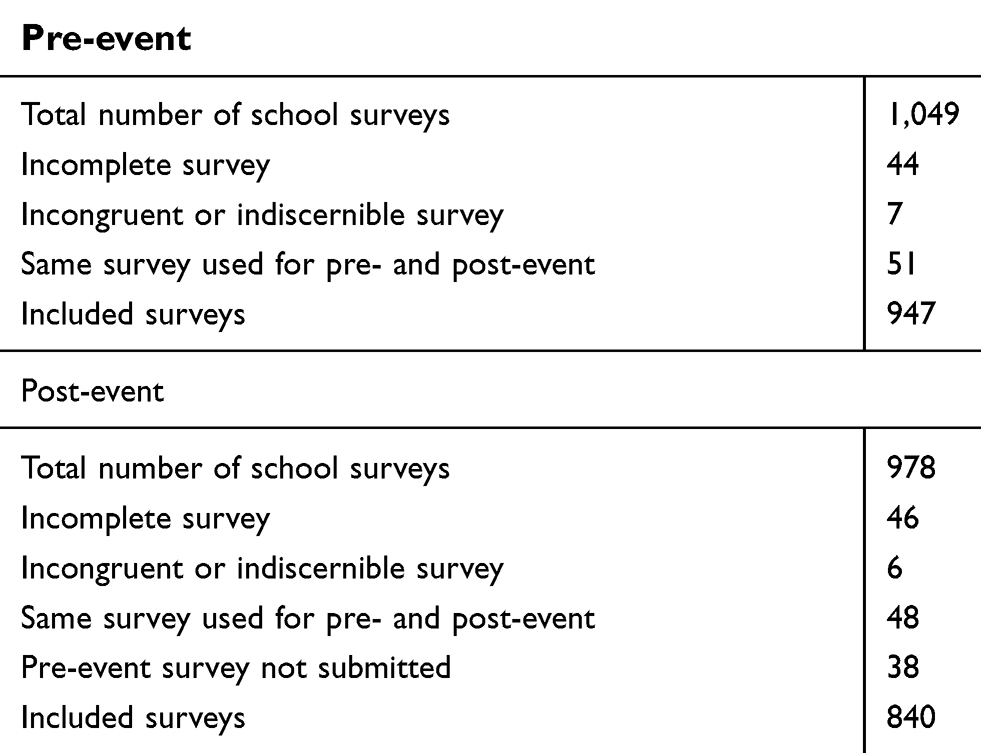 |
Table 1 Participant enrollment |
Setting
Previously wrecked vehicles were obtained and delivered to the intervention site, and placed together to create the appearance of an MVC. Just prior to the start of the program the student actors dressed in prom attire and are molouged to indicate injuries, and placed in the wrecked vehicles. The wrecked vehicles are then covered with tarps to prevent the observing students from seeing the scene prior to the event beginning. A scenario of what had occurred is read aloud to the students and a recorded tape of an MVC is played while the tarps are removed, uncovering the scene for the students. During the scene, the local 911 system is mock-activated with the dispatcher being an American Red Cross representative allowing the observing students to hear the exchange. After a few minutes to simulate a real response time, the police arrive on the scene, followed by fire and EMS personnel. An ambulance transports injured victims away from the scene to a location unseen by the students as if they were taking them for treatment at the local hospital. Later, a police officer administers a sobriety test to the intoxicated driver, and the driver is handcuffed and taken to the police car. The county coroner examines the student portraying a fatality and pronounces them deceased on scene. The victim is removed from the car, placed in a body bag, and taken to the hearse. The hearse drives around the area and ends by slowly passing in front of the students observing. During the viewing of the deceased victim by the coroner, dramatic music sets the tone until the hearse drives away.
After the mock scene, about 35 mins into the presentation, a safety officer from the State Police or local Police Department will speak to students about DUI laws, seat belt laws, and the consequences the driver will face. The coroner speaks to students about parent notification and what he would be expected to do after a crash such as this. At the end of the incident a poem entitled “Death of an Innocent” is read prior to the students are dismissed back to class.
Program evaluation
The survey had seven Likert-scale questions measuring the outcome. Three questions determining subjects’ knowledge on the influence of alcohol on driving ability, reflexes, judgment, and decision-making, and consumption of alcohol under the age of 21 on brain development, and four questions determining subjects’ risky driving behaviors related to alcohol. These alcohol knowledge questions were not queried on the survey until the 2010 reenactments. All those seven questions were 5-point Likert scale questions, with 1 being strongly disagree and 5 strongly agree. In addition, the survey includes questions querying participant’s age, gender, alcohol consumption history (yes/no), and seatbelt usage (with 1 being less frequently use and 5 being frequently use).
Statistical methods
The survey results were entered into a Microsoft Excel spreadsheet (Microsoft Inc., Redmond, WA, USA; v2010). If there were any ambiguous answers, incomplete surveys, or indiscernible answers they were discarded. Some students only answered the survey before the reenactment event, some students only answered the survey after the reenactment event, and some students answered the survey both before and after the reenactment event. Since the survey was designed as anonymous survey, it is impossible to match the pre-event and post-event data of the same responders based on the available information. In other words, the pre-event and post-event cannot be paired for the same subject. When we conducted data analysis, we made two assumptions. Firstly, we assume the pre-event and post-event data were from the two independent groups. Secondly, for the same responders, they completed the post-event survey several hours after they completed pre-event; hence, we assume the pre-event data and post-event data from the same responders are positively correlated. Making such assumptions cause power reduction by ignoring the correlations between pre-event and post-event results, and introducing extra variability by not knowing the individuals.
Likert scale questions were stratified into dichotomous positive and negative answers based upon the assumed correct answer to the question. With negatively worded questions, 1 and 2 were coded as positive answers, and 3 through 5 as negative answers. With positively worded questions, 4 and 5 were coded as correct answers, and 1 through 3 as negative answers. The primary outcome variables are answering each question correctly, which are binary variables. In addition, we combined the three knowledge questions, and four behavior questions, respectively, and then checked the correct probabilities. Hence, we used logistic regression for the binary outcome or the number of correct answers in a fixed number of questions (events/trials). Age, sex, alcohol consumption history (yes/no), and seatbelt usage (use often/not use often), and location were adjusted for logistic regression analysis. We checked the interaction effects between our primary predictor and others covariates and only kept the significant interaction effect items in our final models.
Chi-square tests were used to compare the difference in participants’ characteristics between before and after the event. The two-tailed P values were calculated for all tests and a P-value of <0.05 was considered statistically significant. All analyses were conducted using SAS 9.4 (SAS Institute Inc., Cary, NC, USA).
Results
Study population demographics
There were no significant differences found in gender and alcohol consumption history between pre- and post-surveys. Post-surveys had more students aged 14–16 (46.6% vs 41.8%, P=0.04), and more students who reported often wearing seatbelts (91.2% vs 79.3%, P<0.0001) (Table 2).
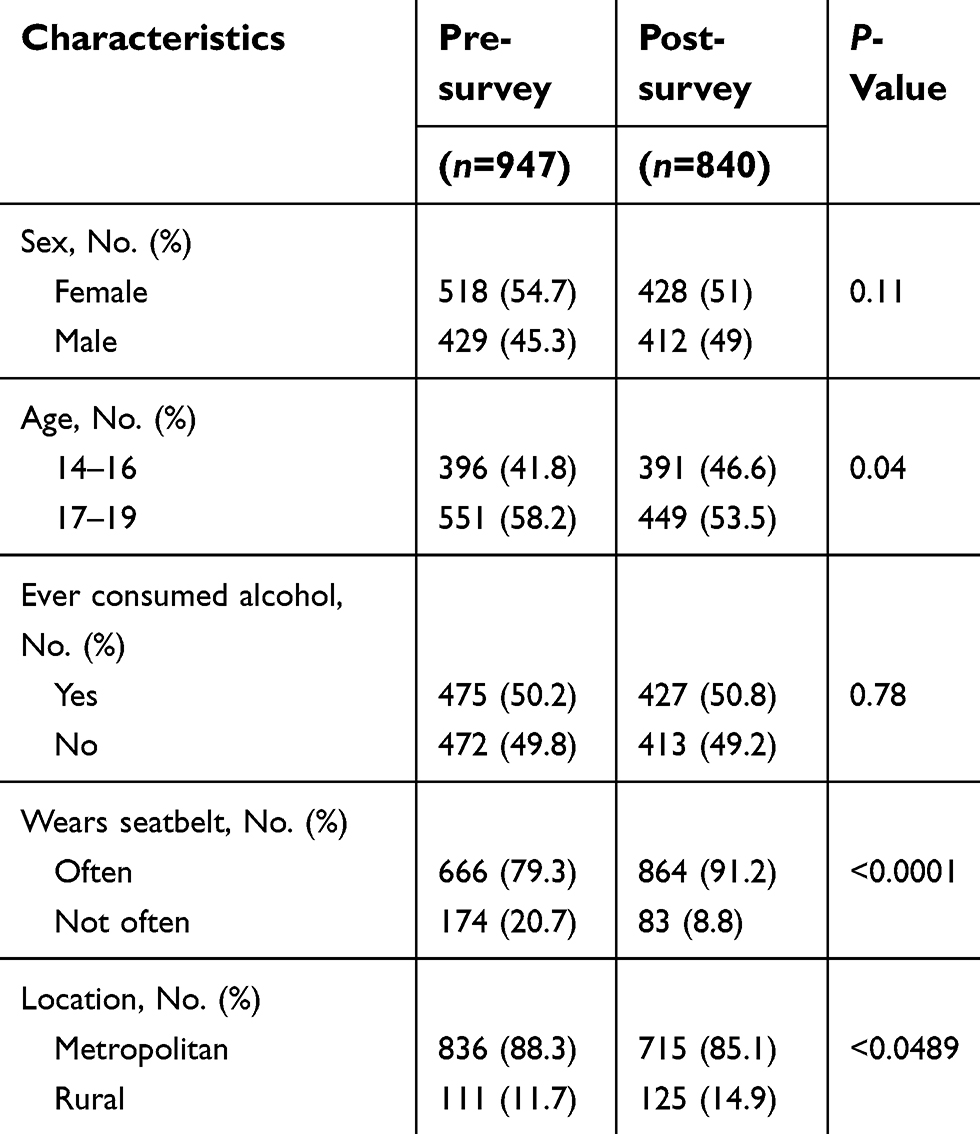 |
Table 2 Characteristics of participants |
General question results
There were three questions related to knowledge of consumption of alcohol and driving, and four questions were related to the behaviors of consuming alcohol and driving. Both crude and adjusted comparisons between pre- and post-surveys showed the similar results. Among the seven questions, only two behavior questions showed significant differences between the pre- and post-surveys. Those questions were: “I am likely to drink and drive in the future or get into a car with someone who would drive drunk.” (behavior question 1) and “I often think about the risks associated with drinking and driving.” (behavior question 4). For behavior question 1, more students answered correctly in post-surveys (83.6% vs 78.5%). For behavior question 4, more students answered correctly in post-surveys (85.1% vs 77.1%).
After the reenactment program, students were 1.39 times less likely (95% CI, 1.09–1.78, P=0.01) to report drinking and driving in the future or getting into a car with someone who would drive drunk. In addition, they reported they were 1.7 times more likely (95% CI, 1.38–2.27, P<0.0001) to often think of the risks associated with drinking and driving (Table 3).
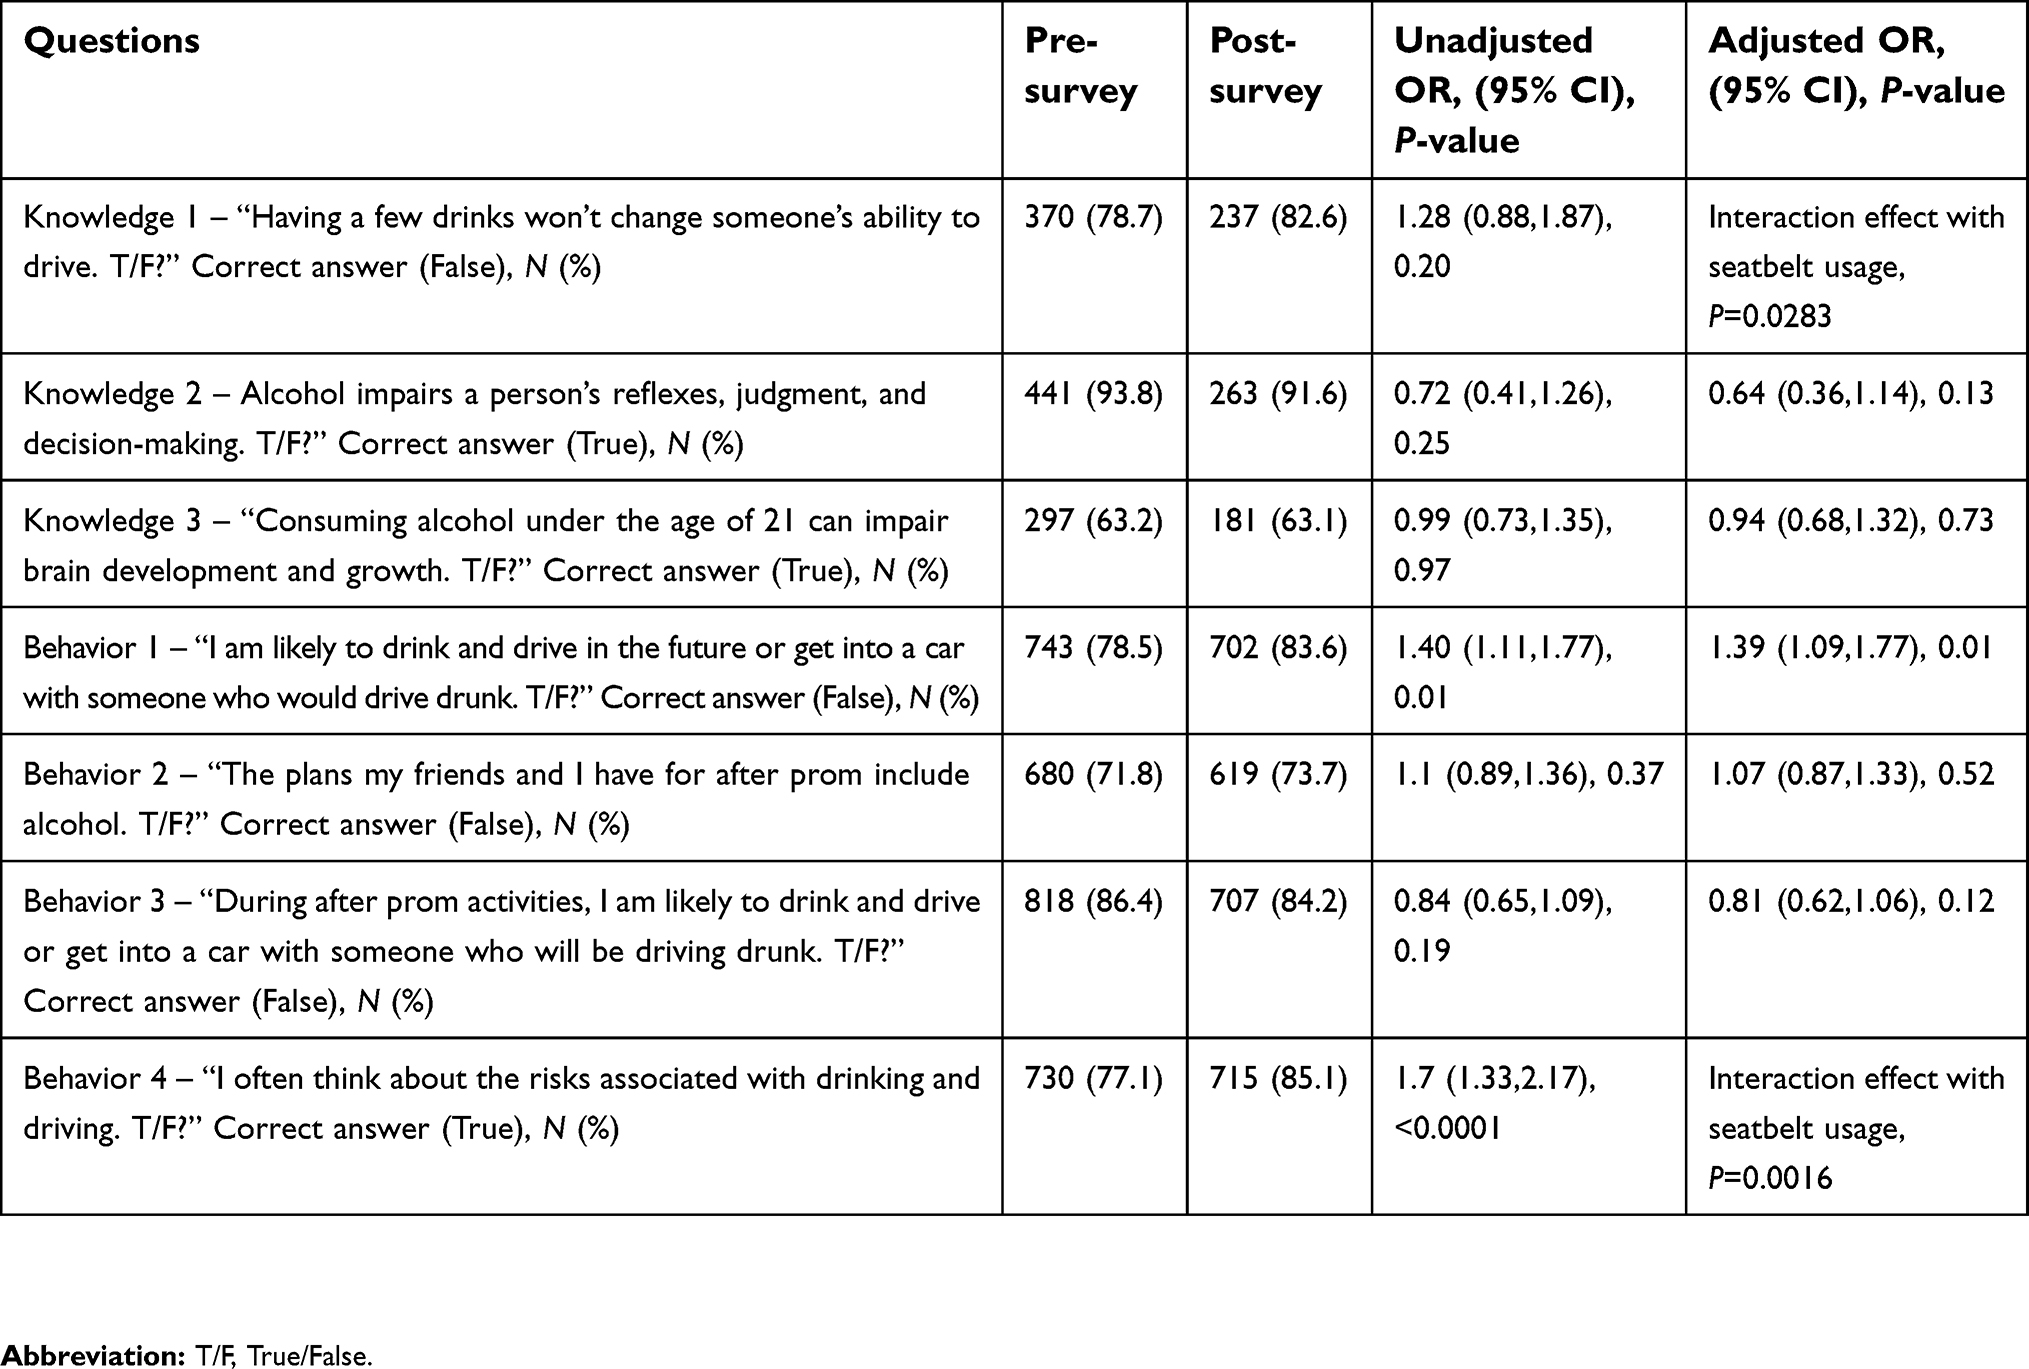 |
Table 3 Pre- and post-survey question responses |
For the three knowledge questions, 51.9%, and 56.1% of participants answered all questions correctly in the pre-survey and post-survey, respectively (Table 4), but no statistical significant difference was found (P=0.77). After the reenactment program, more students answered all four behavior questions correctly (50.8% pre-survey vs 67.9% post-survey; P<0.0001) (Table 4). When adjusted, we found significant interaction effects (P=0.228, 0.0029, respectively).
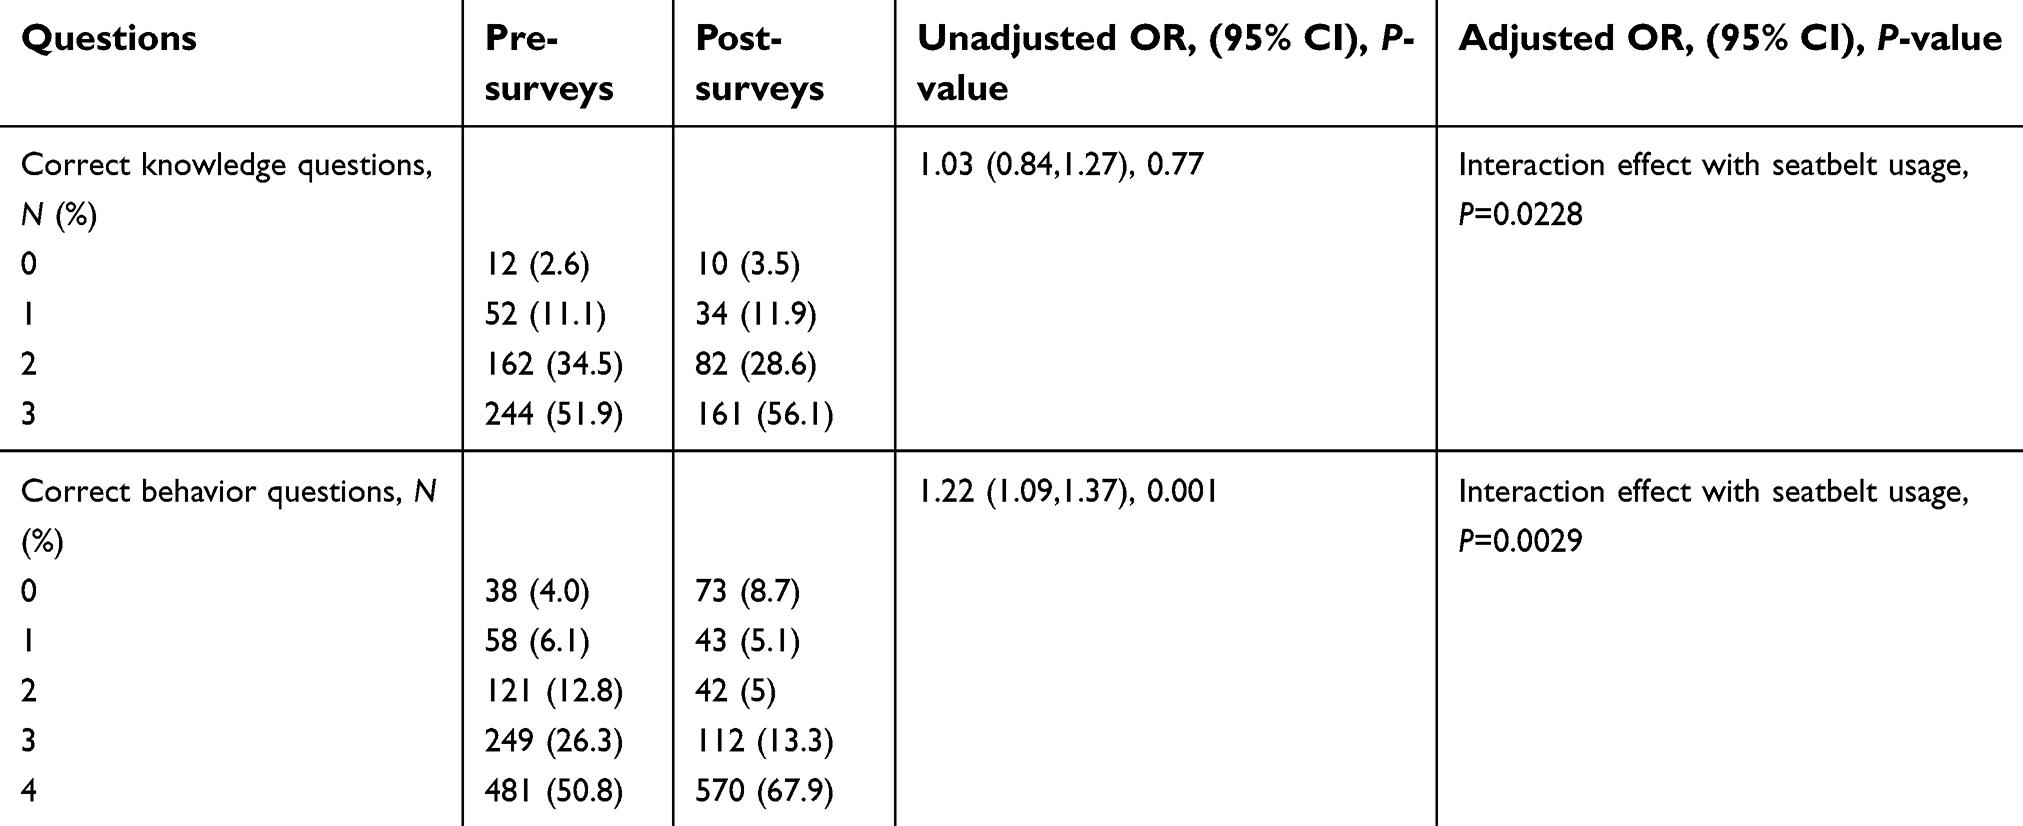 |
Table 4 Comparing the correct knowledge and behavior questions between pre- and post-surveys |
Interaction with seat belt usage
For the question, “Having a few drinks won’t change someone’s ability to drive,” (knowledge question 1) and behavior question 4, we found significant interaction effect relating to seat belt usage (P=0.0283, P=0.0016, respectively). For knowledge 1, the OR of answering correctly was 1.51 (95% CI 0.97, 2.34) for those students who wore their seatbelt often, and 0.51 (95% CI 0.20, 1.21) for those students who did not wear their seatbelt often. While these results are not statistically significant, students who reported wearing their seatbelt often had a trend to correctly answering knowledge question 1, while students who reported not wearing their seatbelt often had a trend to incorrectly answering knowledge question 1. For behavior question 4, the OR of answering correctly was 1.48 (95% CI 1.14, 1.94) for those students reporting wearing their seatbelt often, and 4.46 (95% CI 2.37, 8.38) for those students reporting not wearing their seatbelt often. Both students who did and did not wear their seatbelts often increased answering behavior questions correctly. However, students who did not wear their seatbelt often increased more.
For knowledge questions, the OR of answering knowledge questions correctly was 1.1 (95% CI 0.87, 1.4) for those students that wore their seatbelt often, and 0.57 (95% CI 0.33, 0.95) for those students who did not wear their seatbelt often. Students who did not wear their seatbelt often significantly decreased the probability of answering knowledge questions correctly, while students who wore their seatbelt had a trend to increase the probability of answering knowledge questions correctly.
For behavior questions, the OR of answering behavior question 1 correctly was 1.1 (95% CI 0.99, 1.3) for those students who wore their seatbelt often, and 1.9 (95% CI 1.4, 2.7) for those students who did not wear their seatbelt often. Students who did not wear their seatbelt often had a significantly increased probability of answering behavior questions correctly, while students who often wore their seatbelt had a trend to increase the probability of answering knowledge questions correctly, but not significantly (Table 4).
Discussion
Our results demonstrate that using a school-based mock crash reenactment significantly improved the subjects’ attitudes related to drinking and driving, including drinking and driving himself or herself or getting into a vehicle with someone under the influence. We were unable to show a statistical significance in the knowledge of the effects of alcohol on the body, or the plans for consumption of alcohol during prom night festivities. However, the ceiling effect may be a cause of the inability to improve given the high pre-event positive responses. In addition, our results are impacted by student’s additional risk tolerant behaviors, in that those students who utilized seatbelts less often also had less correct answers to knowledge and behavior survey questions.
The study is important for several reasons. Foremost, drinking and driving accounts for nearly one-third of all traffic-related deaths in the United States.11 Education has been shown to help prevent these behaviors. Evans-Whipp et al demonstrated that adolescents that had been in vehicles with a driver under the influence were more likely to drive under the influence at a later age.11 According to The Community Preventive Services Task Force, since 2003, school-based instructions programs have been recommended to reduce riding with alcohol-impaired drivers. They state that school-based health promotion comes from knowledge of consequences and alternatives to drinking and driving, development of refusal skills, and a change in the social norms are the basis for improvement.12
Our intervention, Operation Prom Night, utilizes a multifaceted comprehensive approach using multiple communities and populations. The program highlights in a “real world” fashion the events surrounding a MVCrelated to teenage drinking and driving. In a systematic review looking at this multifaceted approach, Elder et al found that school-based instructional programs were effective in reducing riding with drivers who have been drinking.13 In a drug prevention program meta-analysis, interactive programs were statistically and clinically significant compared to non-interactive programs.14 Another meta-analysis confirmed this idea,however, went on to demonstrate that while approximately two-thirds of the educational providers taught effective content, only about one sixth of those used an effective delivery method.15 Our intervention uses actual wrecked vehicles and rescue equipment and personnel, as well as a detailed simulation of the consequences of drinking and driving. In addition, the program also uses the students’ peers as participants and victims’ families discussing the impacts of drinking and driving; making the program more realistic.
There is some precedence for similar school-based risk intervention programs. A 2017 study conducted by Layba et al, found a 37% risk reduction in the number of drivers aged 16–21 treated for MCV injuries at the trauma center at the University of Texas Medical Branch in Galveston after the annual implementation of a risk-reduction program, entitled The Save A Life Tour™, at a local high school in Galveston, Texas.16 Like our study, the study demonstrates the benefit of providing teens with educational programs that detail the dangers of distracted driving. Our study reports the qualitative changes in teens’ attitudes toward drinking and driving after participating in the Operation Prom Night Program, while the Layba study assessed the effectiveness of The Save A Life Tour™ program by tracking the pre-intervention and post-intervention number of drivers age 16–21 treated for MCV injuries at the University of Texas Medical Branch in Galveston.
In terms of alcohol consumption, our demographics are in line with the national averages. In comparison to the 2013 Monitoring the Future Survey by Johnston et al, our number of 50.2% on the pre-survey and 50.8% were lower than their expected 28% of 8th grader students and 68% of 12 grade students had ever tried alcohol.17 Our study did not improve student’s behavior related to alcohol involvement during prom night activities. In fact, our numbers are slightly higher at 71.8% and 73.7% on the pre- and post-survey, respectively. However, these likely falls in line with the study by Johnston et al.
Given that many of our participating schools in the study were not in urban populations, public transportation is likely limited. This lends to the idea that suburban and rural students, often have to ride with a peer who has been drinking, due to limited public options. We did demonstrate a mildly positive correlation with 86.4% of students involved stating they would be likely to drive or ride in a vehicle with someone who had been drinking on the pre-survey decreasing to 84.2% on the post-survey. However, with the increased availability of ride-sharing services, adolescents may have additional options for transportation when intoxicated or faced with an intoxicated driver.19
Limitations
Our study is not without limitations. As previously mentioned, we used an anonymous survey instrument because of the sensitive topics included. The anonymous survey instrument protects for privacy and promotes feedback that is more honest. However, we were unable to match pre- and post-survey results obtained from the same respondents. When we conducted our data analysis, we assumed pre- and post-surveys were independent. In doing so, the power of our study was reduced because of the extra variability introduced. However, our study sample size was large, which could limit the magnitude of decreased power. Another limitation is that the survey was developed internally by the American Red Cross, which included both positively and negatively worded questions, which could have caused respondent confusion.18 Hence, the survey results may have been impacted. In addition, some knowledge-based questions had a high correct response baseline; therefore, due to the ceiling effect, these questions may not have shown significant improvement after the intervention. An additional limitation of this study is that although the survey questions can gauge the subjects’ attitudes towards drinking and driving, they cannot predict the subjects’ actual behaviors. Future studies are necessary in order to determine the behavioral effects of educational intervention programs on drunk and distracted driving.
Conclusions
We were able to demonstrate that through the reenactment program, students reported they were less likely to drink and drive in the future or get into a car with someone who would drive drunk, and were more likely to think about the risks associated with drinking and driving. However, students reported they were just as likely to use alcohol during their prom night celebrations, and were still as likely to travel in a vehicle with an intoxicated driver or operate a vehicle themselves while under the influence. Knowledge of the effects of alcohol on the body was also not significantly increased.
Meeting Presentation
The study was presented at the American College of Emergency Physician’s Scientific Assembly/Research Forum in October 2012 as a poster presentation.
Disclosure
The authors report no conflicts of interest in this work.
References
1. Centers for Disease Control and Prevention. Web-based Injury Statistics Query and Reporting System (WISQARS) [Online]. National Center for Injury Prevention and Control, Centers for Disease Control and Prevention (producer). 2015. Available from: https://www.cdc.gov/motorvehiclesafety/teen_drivers/teendrivers_factsheet.html.
2. Insurance Institute for Highway Safety Highway Loss Data Institute (IIHS). Fatality facts: teenagers 2015. 2016. Available from: http://www.iihs.org/iihs/topics/t/teenagers/fatalityfacts/teenagers.
3. Insurance Institute for Highway Safety Highway Loss Data Institute (IIHS). Beginning drivers and crash risk. 2016. Available from: http://www.iihs.org/iihs/brochures/beginning-teen-drivers.
4. Foxcroft DR, Tsertsvadze A. Universal alcohol misuse prevention programmes for children and adolescents: cochrane systematic reviews. Perspect Public Health. 2012;132(3):128–134. doi:10.1177/1757913911430913
5. Rosenstock IM, Strecher VJ, Becker MH. Social learning theory and the health belief model. Health Educ Q. 1988;15(2):175–183. doi:10.1177/109019818801500203
6. LaBrie JW, Huchting K, Pedersen ER, Hummer JF, Shelesky K, Tawalbeh S. Female college drinking and the social learning theory: an examination of the developmental transition period from high school to college. J Coll Stud Dev. 2007;48(3):344–356. doi:10.1353/csd.2007.0026
7. United States Census Bureau. Population estimates. 2012. Available from: https://www.census.gov/quickfacts/fact/table/US/PST045216,
8. United States Department of Agriculture. Rural Definitions 2007, 4 September. Available from: https://www.ers.usda.gov/data-products/rural-definitions/.
9. Illinois Department of Public Health (IDPH). Traffic crash report database. 2019. Available from: http://www.idph.state.il.us/emsrpt/crash.asp.
10. Center for Prevention Research and Development. Illinois youth survey 2010 statewide report. 2011. Available from: https://iys.cprd.illinois.edu/UserFiles/Servers/Server_178052/File/state-reports/2010/IYS2010_State_Report.pdf.
11. Evans-Whipp TJ, Plenty SM, Toumbourou JW, Olsson C, Rowland B, Hemphill SA. Adolescent exposure to drink driving as a predictor of young adults’ drink driving. Accid Anal Prev. 2013;51:185–191. doi:10.1016/j.aap.2012.11.016
12. Community Preventive Services Task Force. Reducing alcohol-impaired driving: school-based programs, instructional programs 2014, 16 September. Available from: http://www.thecommunityguide.org/sites/default/files/assets/MVOI-AID-School-Instructional.pdf
13. Elder RW, Nichols JL, Shults RA, Sleet DA, Barrios LC, Compton R. Effectiveness of school-based programs for reducing drinking and driving and driving and riding with drinking drivers: a systematic review. Am J Prev Med. 2005;28(5S):288–304. doi:10.1016/j.amepre.2005.02.015
14. Tobler NS, Stratton HH. Effectiveness of school-based drug prevention programs: a meta-analysis of the research. J Prim Prev. 1997;18(1):71–128. doi:10.1023/A:1024630205999
15. Ennett ST, Ringwalt CL, Thorne J, et al. A comparison of current practice in school-based substance use prevention programs with meta-analysis findings. Prev Sci. 2003;4(1):1–14. doi:10.1023/A:1021777109369
16. Layba C, Griffin LW, Jupiter D, Mathers C, Mileski W. Adolescent motor vehicle crash prevention through a trauma center-based intervention program. J Trauma Acute Care Surg. 2017;83(5):850–853. doi:10.1097/TA.0000000000001605
17. Johnston LD, O‘Malley PM, Miech RA, Bachman JG, Schulenberg JE Monitoring the future national results on drug use: 1975–2013: overview, key findings on adolescent drug use. the university of michigan institute for social research 2014, February. Available from: http://www.monitoringthefuture.org/pubs/monographs/mtf-overview2013.pdf,
18. Colosi R Negatively worded questions cause respondent confusion. ASA section on survey research methods. Available from: http://ww2.amstat.org/section/srms/proceeding/y2005/Files/JSM2005-000508.pdf.
19. Simeon D. Your Teen For Parents. Drinking and driving: teens using and uber designated driver. Available from: https://yourteenmag.com/health/drugs-alcohol/when-the-designated-driver-is-uber,
 © 2019 The Author(s). This work is published and licensed by Dove Medical Press Limited. The full terms of this license are available at https://www.dovepress.com/terms.php and incorporate the Creative Commons Attribution - Non Commercial (unported, v3.0) License.
By accessing the work you hereby accept the Terms. Non-commercial uses of the work are permitted without any further permission from Dove Medical Press Limited, provided the work is properly attributed. For permission for commercial use of this work, please see paragraphs 4.2 and 5 of our Terms.
© 2019 The Author(s). This work is published and licensed by Dove Medical Press Limited. The full terms of this license are available at https://www.dovepress.com/terms.php and incorporate the Creative Commons Attribution - Non Commercial (unported, v3.0) License.
By accessing the work you hereby accept the Terms. Non-commercial uses of the work are permitted without any further permission from Dove Medical Press Limited, provided the work is properly attributed. For permission for commercial use of this work, please see paragraphs 4.2 and 5 of our Terms.