")
Back to Journals » International Journal of Nanomedicine » Volume 19
The Dual Angiogenesis Effects via Nrf2/HO-1 Signaling Pathway of Melatonin Nanocomposite Scaffold on Promoting Diabetic Bone Defect Repair
Authors Chen T , Wu Z, Hou Q, Mei Y, Yang K, Xu J , Wang L
Received 22 November 2023
Accepted for publication 4 March 2024
Published 16 March 2024 Volume 2024:19 Pages 2709—2732
DOI https://doi.org/10.2147/IJN.S449290
Checked for plagiarism Yes
Review by Single anonymous peer review
Peer reviewer comments 2
Editor who approved publication: Dr Xing Zhang
Tingting Chen,1 Zimei Wu,1,2 Qiaodan Hou,1 Yixin Mei,1 Kunkun Yang,1 Jing Xu,3 Lin Wang1,3
1School of Medicine, Southern University of Science and Technology, Shenzhen, People’s Republic of China; 2Department of Orthopedic Surgery, The Seventh Affiliated Hospital, Sun Yat-Sen University, Shenzhen, People’s Republic of China; 3Southern University of Science and Technology Hospital, Shenzhen, People’s Republic of China
Correspondence: Lin Wang, Email [email protected]
Purpose: Given the escalating prevalence of diabetes, the demand for specific bone graft materials is increasing, owing to the greater tendency towards bone defects and more difficult defect repair resulting from diabetic bone disease (DBD). Melatonin (MT), which is known for its potent antioxidant properties, has been shown to stimulate both osteogenesis and angiogenesis.
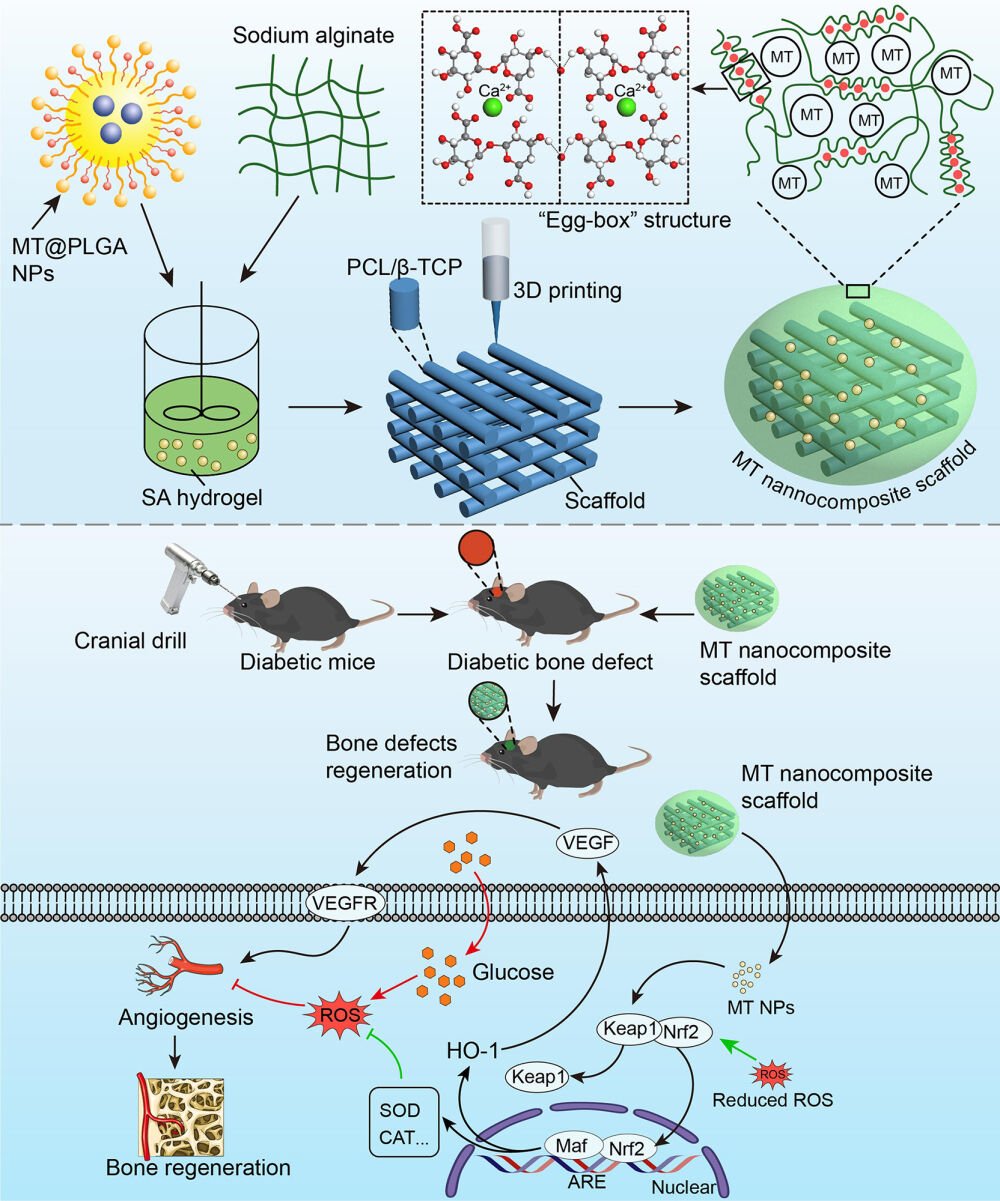
Methods: MT was formulated into MT@PLGA nanoparticles (NPs), mixed with sodium alginate (SA) hydrogel, and contained within a 3D printing polycaprolactone/β-Tricalcium phosphate (PCL/β-TCP) scaffold. The osteogenic capacity of the MT nanocomposite scaffold under diabetic conditions was demonstrated via in vitro and in vivo studies and the underlying mechanisms were investigated.
Results: Physicochemical characterization experiments confirmed the successful fabrication of the MT nanocomposite scaffold, which can achieve long-lasting sustained release of MT. The in vitro and in vivo studies demonstrated that the MT nanocomposite scaffold exhibited enhanced osteogenic capacity, which was elucidated by the dual angiogenesis effects activated through the NF-E2–related factor 2/Heme oxygenase 1 (Nrf2/HO-1) signaling pathway, including the enhancement of antioxidant enzyme activity to reduce the oxidative stress damage of vascular endothelial cells (VECs) and directly stimulating vascular endothelial growth factor (VEGF) production, which reversed the angiogenesis-osteogenesis uncoupling and promoted osteogenesis under diabetic conditions.
Conclusion: This study demonstrated the research prospective and clinical implications of the MT nanocomposite scaffold as a novel bone graft for treating bone defect and enhancing bone fusion in diabetic individuals.
Keywords: diabetic bone defect, melatonin, Nrf2/HO-1 signaling pathway, dual angiogenesis effects, 3D printing
Graphical Abstract:
Introduction
Bone serves as a crucial structural support for the human body, and defects resulting from trauma or disease always produce significant disadvantages for patients’ overall health. To clinically address these critical orthopedic defects, bone autografts, allografts, and artificial bone grafts including ceramics, and synthetic or natural polymers have been applied.1 Autografts have always been regarded as the benchmark for bone substitutes while the source is limited. Meanwhile, allografts pose latent risks, including the transmission of diseases and concerns related to immunogenicity.2 To address these challenges, artificial bone grafts, such as ceramics/polymers or hydrogels, have been widely applied to mimic the biological activity of natural bone. Although research on bone grafts gained rapid progression in recent decades,1 new bone formation and bone defect repair remain challenging in pathological environments such as tumors, infections, and metabolic diseases.
With over 537 million diabetes mellitus (DM) patients worldwide having been reported by 2021,3 DM has emerged as a significant menace to human well-being. Epidemiological investigations have revealed a rapid expansion of the affected population and progressively younger patients in proportion, which led to diabetic bone disease (DBD) being considered growing as a major contributor to morbidity and mortality in DM.4 DBD exhibited features of increased susceptibility to fragility fracture, delayed fracture healing, and high recurrent fracture rate, all of which mean a greater tendency towards bone defects and more difficult defect repair.5 Otherwise, significantly higher failure rates of bone fusion in diabetic individuals were also reported in clinical investigation.6 Therefore, it is imperative to prioritize the research of a novel bone graft specific to the DBD population. Although the exact pathological mechanism remains unclear,5 DBD has been identified as a condition characterized by impaired osteogenesis and low bone turnover metabolism. Kusumbe et al7 reported intraosseous H-type blood vessels and their important role in angiogenesis-osteogenesis coupling. Given that intracellular excess reactive oxygen species (ROS) and oxidative stress damage to vascular endothelial cells (VECs) have been reported as important pathological mechanisms of many diabetic complications.8 The angiogenesis-osteogenesis uncoupling induced by ROS accumulation has been gradually identified as contributing to the development of DBD.9–12 Thus, antioxidants are anticipated to have a therapeutic efficacy in the treatment of DBD.
Melatonin (MT), a hormone synthesized by the pineal gland, is pivotal in the regulation of circadian rhythm, and has also been discovered to possess powerful antioxidant properties.13,14 The antioxidant therapeutic effect of MT has been widely studied in pathological environments such as tumors and inflammation.15,16 In recent years, some scholars have gradually paid attention to the antioxidant activity of MT in DM-related complications,17,18 especially in bone lesions caused by diabetes.19,20 Our previous study found that MT electrospun nanofiber coatings protect osteoblasts by inhibiting ROS overproduction and directly improving osteogenesis via the BMP/WNT pathway under diabetic conditions.21 Nevertheless, the widespread use of MT is hindered by several challenges, including inadequate stability, easy degradation, and limited bioavailability. To overcome these limitations, the current approach involves developing drug-carrier systems to facilitate controlled and sustained drug release.22
Polylactic-co-glycolic acid (PLGA), as a biodegradable polymer, has gained considerable attention in biomedical applications owing to its high biocompatibility and tunable biodegradation rate. PLGA nanoparticles (NPs) have received approval for parenteral administration, exhibiting sustained release characteristics.23 Altindal et al24 prepared MT-loaded PLGA NPs and drug release tests showed that MT@PLGA NPs released about 70% of the drug after 40 days in vitro. 3D printing techniques have been extensively applied in the construction of bone grafts with predesigned shapes and tailored structural features.25–27 3D printing polycaprolactone (PCL) scaffolds using fused deposition modeling technology have gained significant attention as implant materials due to the outstanding compatibility and mechanical characteristics.28 β-Tricalcium phosphate (β-TCP) stands as a commonly employed bioceramic within the realm of calcium phosphate applications that possesses the capability to induce osteogenic differentiation of stem cells by releasing calcium ions.29 However, scaffolds crafted solely from bioceramics or even polymer/bioceramic composites might not offer adequate bone-forming capability. Furthermore, recent studies have recognized hydrogel materials for enhancing sustained drug release when filled into the interspace of 3D printing scaffolds.30,31 Alginate materials are highly desirable biomaterials with numerous exceptional properties such as in situ gel, hydrophilicity, cytocompatibility,32–34 and prolonged release of active agents.35 Miao et al36 demonstrated that decorating MT into 3D printing β-TCP scaffolds can promote the regeneration of skull defect. However, the release time was only approximately 15 hours, which hinders its ability to exert a prolonged effect on bone regeneration.
In the present study, a 3D printing technique was applied to fabricate a PCL/β-TCP scaffold. Subsequently, MT was encapsulated into the PLGA carrier to prepare MT@PLGA NPs, these MT@PLGA NPs were then mixed with sodium alginate (SA) hydrogel and filled into the interspace of PCL/β-TCP scaffold, resulting in an MT@PLGA NP-functionalized PCL/β-TCP scaffold. This approach combines NPs with a 3D printing scaffold to develop a novel bone graft with sustained MT release and improved osteogenic ability under DM conditions. We assumed that the MT@PLGA NPs combined with the PCL/β-TCP/SA scaffold could play a crucial role in reversing diabetic ROS-induced angiogenesis-osteogenesis uncoupling and aimed to investigate the underlying mechanism at the molecular and gene levels.
Materials and Methods
Synthesis of MT@PLGA NPs
Preparation of MT@PLGA NPs using solvent evaporation. Briefly, PLGA (lactide: glycolide = 75:25, MW =80,000, Aladdin) and MT (Aladdin Biochemical Technology Co., Ltd.) with different mass ratios (MT: PLGA=1:5, 1:3, 1:1, m: m) were dissolved in 10 mL of DCM (dichloromethane) as organic phase (O). Then the O phase was added to the 40 mL of water phase (W) containing 2% PVA solution and homogenized with a high-speed homogenizing emulsifier for 1 min (20,000 rpm) to form nanoemulsion. The nanoemulsion was homogenized (AH-NANO P, ATS, China) under high pressure at 800 bar, and the homogenized emulsion was poured into 150 mL water solution containing 0.1% PVA for 4 h by magnetic stirring, and the particles were solidified by volatilizing DCM. The solidified NPs were obtained through centrifugation for 15 minutes (5000 rpm) and subsequently washed with distilled water. Following a freeze-drying process (Keruide Trading Co., LTD, China) was used to remove water and finally the MT@PLGA NPs with different MT ratios were obtained.
Fabrication of PCL/β-TCP Scaffolds and MT Nanocomposite Scaffold
The geometric scaffolds were fabricated utilizing a fused deposition modeling (FDM) 3D printing technique. A 3D bioprinting system (Maipu Regenerative Medicine Technology Co., LTD, Guangzhou, China) was employed. It featured a three-axis with x-y-z translation stage, a nozzle, a dispenser with a heating jacket for PCL polymer melting, and a compression/heat controller, facilitating the scaffold construction. Using the 3D plotting system, two varieties of scaffolds were constructed: 1) 3D scaffolds composed solely of PCL (MW 80000; Zhanyang Tiflon Enterprise Store, China) and 2) 3D scaffolds combining PCL with β-TCP (Sigma-Aldrich, St. Louis, MO, USA) (PCL/β-TCP). To fabricate the PCL/β-TCP scaffold, molten PCL and β-TCP powder were blended and injected into the printer dispenser barrel. The mixture in the barrel was heated to 150°C and extruded through a nozzle with a diameter of 300 µm. 3D printing scaffolds with dimensions of 10×10×2 mm³ were produced layer by layer.
The resultant scaffolds were placed in a 48-well plate containing 2% SA solution (MACKLIN, Cat#C12782338) blended with NPs, and 1 mL calcium chloride solution (Damao chemical reagent Factory, China, Cat#10043524) was added for 2 min at room temperature to crosslink with SA to solidify. Finally, the nanocomposite scaffolds were vacuum-dried overnight to solidify the hydrogel films.
Characterization of NPs and Scaffolds
To evaluate drug loading and encapsulation efficiency, 10 mg of MT@PLGA NPs was dissolved in 10 mL of DCM. The suspension was ultrasonicated for 30 min and subsequently maintained at room temperature for 2 h. After complete degradation, the amount of MT was measured using a UV spectrometer (UV-8000A, METASH, Shanghai). The drug loading (%) and encapsulation (%) were calculated as follows:


The size of the NPs was evaluated employing a laser diffraction particle size analyzer (Zeta PALS, Bruker). Field-emission scanning electron microscopy (SEM) was employed to characterize the morphology of the NPs, strand size of the scaffolds, and NPs deposited on the hydrogel at an accelerating voltage of 10 kV (Nova Nano Sem 450, FEI). X-ray diffraction (XRD) analysis was conducted utilizing an X-ray diffractometer (Smartlab, Rigaku) in the 2θ range of 10–60◦ with Cu Kα radiation. Spectrum Fourier Transform infrared spectroscopy (FT-IR) was employed to capture the infrared spectrum of the sample in the range of 400~4000 cm−1 (PerkinElmer LAMBDA 750s, US). For the assessment of the water contact angle on the scaffold surfaces, 5 μL distilled water was dropped onto the scaffold surface, and the contact angle was measured using a contact angle goniometer (KRUSS DSA25, Germany). To evaluate the mechanical properties of the scaffolds, their compressive strengths were evaluated utilizing a universal material-testing machine (Allroundfloor, Germany).
In vitro Drug Release
The NPs and MT nanocomposite scaffolds were placed in 5 mL of PBS. The solution was sealed and promptly positioned in a constant-temperature water bath shaker at 37.0°C with a rotation speed of 70 rpm. At a predetermined time, 3 mL of each solution was extracted for absorbance measurement and then returned to the original container after measurement. All samples were examined utilizing a UV spectrometer (UV-8000A, METASH, Shanghai), and sustained release curves were plotted.
Cell Culture
Both mouse embryonic osteoblast precursor (MC3T3-E1) and mouse brain microvascular endothelial (bEnd.3) (Procell Life Science & Technology Co., Ltd., Wuhan, HB, CHN) cell lines were cultured in supplemented Dulbecco’s Modified Eagle’s medium (DMEM; 10% FBS, 1% penicillin/streptomycin, Gibco, Grand Island, USA) at 37°C with 5% CO2. To mimic a diabetic environment, the diabetes-induced medium was used, containing glucose (25 μM; Sigma) and palmitate (500 μM; Sigma).37 The mesenchymal stem cell (MSCs) basal medium was substituted to induce osteogenic differentiation of MC3T3-E1 cells (Oricell, Cat #MUXMT90021), with refreshment every three days. The cell cocultured with scaffolds were categorized into the following groups: 3D printing PCL scaffold (PCL), 3D printing PCL/β-TCP scaffold (PCL/β-TCP), 3D printing PCL/β-TCP scaffold composite SA hydrogel (PCL/β-TCP/SA), 3D printing PCL/β-TCP scaffold composite SA hydrogel, and MT@PLGA NPs (PCL/β-TCP/SA/MT).
Cell Counting Kit-8 (CCK-8) Assay
MC3T3-E1 and bEnd.3 cells were cultured with different groups of scaffolds after 1, 4, and 7 days, and evaluated the cytotoxicity and cell proliferation using a Cell Counting Kit 8 (Abbkine, Cat# KTA1020). Briefly, at 3 h after adding the CCK-8 reagent to 10% of the medium, the absorbance (450 nm) was assessed utilizing a microplate reader (Bio-TekELx800) and proliferation curves for cells of various groups were then plotted.
Live/Dead Assay
For a visual assessment of cell culture with different groups of scaffolds, a live/dead kit (Baiaolaibo, China, Cat#HR8279) was employed to assess cell viability after culturing with scaffolds for 3 days. Dye diluent and serum-free culture medium were used to dilute calcein-AM and EthD-I to prepare a live/dead solution, and 500 μL of the solution was added. Following that, cells were incubated for 15 min. Live and dead cell images were acquired using a fluorescence microscope (Nikon, Tokyo, Japan). Live cells were green-stained with calcein-AM, while dead cells were red-stained with EthD-I.
Immunofluorescence Staining
MC3T3-E1 and bEnd.3 cells and different groups of scaffolds were cultured for 48 h. The cells were washed with PBS and subsequently fixed with paraformaldehyde (4%) and incubated with primary antibodies vinculin (Sigma, Cat#V9131), NF-E2–related factor 2 (Nrf2, Cell Signaling Technology, Cat#12,721), vascular endothelial growth factor (VEGF, HUABIO, Cat#HN0727), cluster of differentiation 31 (CD31, Abcam, Cat # ab28364), angiopoietin 2 (Ang2, HUABIO, Cat#RT1046) overnight at 4°C. On the following day, the cells were rinsed with PBS to eliminate unconjugated primary antibodies and were then incubated with a fluorescent secondary antibody (Abcam, Cat#ab150113) for 1 h. Then, DAPI was stained nuclei. A confocal laser-scanning microscopy (Zeiss, Germany) was utilized to acquire fluorescence images.
Alkaline Phosphatase (ALP)activity
Following the previously described protocol, MC3T3-E1 cells were cultured with various groups of scaffolds in a diabetic environment with osteogenic induction medium. ALP staining was conducted utilizing a BCIP/NBT staining kit (Cat#C3206; Beyotime) after 14 days of culture. In summary, cells were fixed with 4% paraformaldehyde for 15 min and submerged in a dyeing working solution for 30 min. After washing away excess stain with PBS, the overall appearance of the cells on the scaffold was shot utilizing a camera, and the staining details were examined under an optical microscope (Nikon, Japan). The ALP activity was assessed using a commercial assay kit (Cat#P0321, Beyotime Biotechnology) following the instructions. The measurement of ALP activity was conducted at a wavelength of 405 nm.
Alizarin Red Staining (ARS)
The mineralized nodules produced by MC3T3-E1 cells were stained with ARS to evaluate the efficacy of the different groups of scaffolds in promoting bone regeneration under diabetic conditions. In the third week of the experiment, the cells were fixed with PFA (4%) and rinsed with PBS. Subsequently, 2% (w/v) ARS solution was introduced intothe wells. After a 10 min incubation, excess ARS was washed away, and images were captured using a camera, and the staining details were observed using optical microscopy (Nikon, Japan). To quantify ARS, the mineral deposits were dissolved in 10 mM cetylpyridinium chloride (Aladdin, China), and the absorbance values were measured at 570 nm using a Microplate Reader (Bio-TekELx800).
Quantitative Real-Time PCR
MC3T3-E1 and bEnd.3 cells were cultured with scaffolds of each group in osteogenic induction medium (OriCell, MUXMT-90021) for seven days. Expression levels of osteogenesis-, angiogenesis-, and anti-oxidation-related genes, collagen type 1a1 (Col1a1), osteopontin (OPN), runt-related transcription factor 2 (Runx2), osterix (OSX), bone morphogenetic protein-2 (BMP-2), ALP, CD31, angiopoietin 1 (Ang1), Ang2, VEGF, catalase (CAT), Keap1 (Kelch-like ECH-associated protein 1), Nrf2, heme oxygenase 1(HO-1), and superoxide dismutase 2 (SOD2) were assessed utilizing quantitative real-time PCR (qPCR). In summary, total RNA was harvested from MC3T3-E1 and bEnd.3 cells from the various groups using an RNA extraction kit (Vazyme, Cat#RC112-01). Subsequently, RNA was converted into cDNA using a reverse transcription kit (Vazyme, Cat#R323-01). Real-time PCR was performed using an amplification kit (Vazyme, Cat#Q712) and Bio-Rad RT-PCR detection system (CFX96). Primers can be found in the supplementary material (Table S1), along with the housekeeping gene GAPDH.
Scratch Wound Healing
The bEnd.3 cells were cultured with different scaffolds until they reached 100% confluence. Straight lines were then scratched through the middle of the cells in every well. The full medium was substituted with serum-free medium. Images of scratches were captured after 0 and 12 h using the microscope. The average scratch width was quantified using ImageJ 6.4 software, and the rates of scratch wound healing were calculated.
Tube-Formation Assay
To assess the scaffold’s capacity to stimulate angiogenesis in a diabetic environment, Matrigel (100 μL well−1; BD Biosciences, US) was employed to stimulate tube formation in bEnd.3 cells. The bEnd.3 cell cultured with various group scaffolds for three days were treated with 0.05% trypsin and then seeded at a density of 5×10⁴ cells/well in a 96-well plate. The plate had been pre-coated with growth factor-reduced Matrigel. After a 6-hour incubation period, the formation of tubes by bEnd.3 was viewed under a microscope (Nikon, Japan). Subsequently, ImageJ6.4 software was utilized to quantify tube formation parameters and the mean tube length per field.
ELISA Assay
After bEnd.3 cell was cultured with the scaffolds for 72 h, the supernatant from the cell culture was collected for enzyme-linked immunosorbent assay (ELISA) to assess the secretion of VEGF and PDGFA, which are key cytokines crucial for mediating angiogenesis and angiogenesis-osteogenesis coupling, respectively. The concentrations of VEGF (Meimian, Cat #MM-44452M2) and PDGFA (Solarbio, Cat # SEKM-0159) were measured using ELISA kits in accordance with the instructions provided by the manufacturer.
Measurement of Intracellular ROS
To assess the scaffold’s capacity to mitigate the intracellular reactive oxygen species (ROS), the ROS level was measured based on the fluorescence intensity of 2′7′-dichlorofluorescein (DCF). After the b.End3 cells were cultured with scaffolds from different groups for 72 h, they were treated with DCFH-DA (Sigma, 10 μmol L−1) solution, and DCF fluorescence was visualized under a confocal microscope (Zeiss, Germany).
Western Blot Assay
Proteins were obtained from cell extracts and quantified utilizing a BCA protein assay kit (Beyotime, China). Equal quantities of protein were loaded and subjected to SDS-PAGE separation. Subsequently, the samples were transferred to PVDF membranes (0.45 μm, Millipore, US) and target proteins (NRF2, Cell Signaling Technology, Cat#12721; VEGF, HUABIO, Cat#HN0727; CD31, Abcam, Cat # ab28364; Ang2, HUABIO, Cat#RT1046) were detected using a specific antibody. Stained bands were visualized using a chemiluminescence detection system, and the gray values were analyzed using ImageJ6.4 software.
Lipid Peroxidation MDA Assay
A lipid peroxidation (malondialdehyde, MDA) analysis kit (Abbkine, Cat # KTB1050) was used to estimate the effects of scaffolds on MDA. The bEnd.3 cells were collected and rinsed with cold PBS. Following centrifugation, the supernatant was removed, and 1 mL of pre-cooled extraction buffer was added and crushed for 5 min using ultrasonic waves in an ice bath. Next, the centrifugation was performed at 13,000 × g for 10 min (4°C), and the supernatant was obtained. The provided processing steps were adhered to the treatment of both samples and standards. A volume of 200 μL from the supernatant was transferred to a 96-well plate for analysis, and the absorbance was measured at 532 nm and 600 nm using a microplate reader. The standard curve was constructed based on the difference between A532 and A600.
Superoxide Dismutase (SOD) Assay
A SOD assay (Abbkine, Cat # KTB1030) was used to evaluate the impact of the scaffolds on SOD activity. bEnd.3 cells were gathered, rinsed with pre-cooled PBS, subjected to centrifugation for 2 min at 800 × g, then removed the supernatant. Then 1 mL of 1×Lysis buffer was suspended in cells, kept on ice for 10 min, and subjected to centrifugation at 12,000 × g for 5 min (4°C), and the supernatant was analyzed. The samples and standards were prepared following the recommended steps. The absorbance at 450 nm was determined using a microplate reader, and SOD activity was subsequently calculated.
Glutathione (GSH) Assay
A GSH assay (Abbkine, Cat # KTB1600) was performed according to the kit protocol to evaluate the impact of the scaffolds on GSH activity. The bEnd.3 cells were rinsed with cold PBS twice and resuspended the extraction buffer. The cells underwent two cycles of freeze-thawing, alternately in liquid nitrogen and a hot water bath (37°C). After 10 min centrifuged (4°C), supernatant was obtained. The provided processing steps were adhered to for the treatment of both samples and standards, and the absorbance was gauged at 412 nm utilizing a microplate reader.
Hydroxyl Radical Scavenging Assay
A Hydroxyl radical scavenging assay (Abbkine, Cat # KTB1091) was performed to assess the hydroxyl radical scavenging ability of the scaffolds. The cells were collected in a centrifuge tube, cleaned with cold PBS, and the supernatant was discarded. One milliliter of deionized water was added, and the cells were broken for 5 min by ultrasonic waves in an ice bath. Subsequently, centrifugation was carried out at 10,000 × g for 10 min (4°C), and the supernatant was harvested for further analysis. The provided processing steps were adhered to for the treatment of both samples and standards, and the absorbance was measured at 520 nm using a microplate reader.
RNA-Sequencing
The bEnd.3 cells cultured in DM medium with or without the MT nanocomposite scaffold (DM group and PCL/β-TCP/SA/MT group) were harvested, and RNA was extracted. After RNA integrity detection, reverse transcription was performed to generate a cDNA library for subsequent sequencing.
In vivo Animal Studies
All the animal procedures obeyed the guidelines of Animal Care and Use of the Southern University of Science and Technology University (Approval Number: SUSTech-JY2-202208022). Eight-week-old male C57 mice (21–25 g) were fed a high-fat diet for two weeks after intraperitoneal injection of 120 mg/kg streptozotocin (STZ). After seven days, blood glucose levels were assessed through tail cutting. A DM model was successfully constructed when the fasting blood glucose level exceeded 13.8 mmol/L which can be used for follow-up investigations.
Diabetic mice were randomly distributed into 3 groups, including the DM group (diabetic mice with skull defects), PCL/β-TCP/SA/MT group (MT nanocomposite scaffold was implanted in diabetic mice with skull defects), and PCL/β-TCP/SA/MT/ML385 group (MT nanocomposite scaffold was implanted in diabetic mice with skull defects and intraperitoneally injected with an NRF2 inhibitor, 30 mg/kg). First, mice were intraperitoneally injected with the anesthetic 2.5% avertin. To expose the calvarium, a midline incision was created from the pupillary line to the occipital region, Subsequently, a 4 mm diameter calvarial defect was generated on the unilateral parietal bone using a cranial drill. After the skull was removed, the MT nanocomposite scaffold was implanted into the bone defects area, and then sutured the incision. Post-surgery, intramuscular injections of penicillin (10,000 U) were administered for three consecutive days to prevent infection.
For the assessment of the new bone formation, the skull underwent Micro CT scanning (60 kV and 100 μA radiation source) at 4 and 8 weeks. The designated region of interest (ROI) encompassed the complete defect area containing the newly formed bone, and parameters such as bone mineral density (BMD), trabecular number (Tb. N), and trabecular separation/spacing (Tb. Sp) were computed. After scanning, the calvarial bone was retrieved and fixed using 4% paraformaldehyde (PFA), followed by decalcification for approximately 21 days in EDTA (10%). After dehydration, the bone tissue was embedded in paraffin and was subsequently sectioned into 5 μm-thick slices for staining with hematoxylin and eosin (H&E) as well as Masson’s trichrome.
Statistical Analysis
The statistical significance of differences between the two groups was assessed using t-tests, while comparisons among multiple groups were conducted using one-way analysis of variance. In all analyses, statistical significance was set at p < 0.05.
Results
Characterization of NPs and Scaffolds
MT@PLGA NPs were successfully prepared via the process of emulsion solvent evaporation (Figure 1a). To investigate how the characteristics of the resulting NPs are affected by the process parameters, different mass ratios of MT@PLGA (MT: PLGA =1:5, 1:3, 1:1, and m: m) in the feed were studied. Although the drug loading of MT@PLGA ratio (1:3) exhibited no significant disparity compared with the MT@PLGA ratio (1:1), it surpassed the values obtained from the MT@PLGA ratio (1:5) (Figure 1b). Among the different MT@PLGA ratios investigated, the MT@PLGA ratio (1:3) exhibited the most favorable encapsulation efficiency (Figure 1c). Importantly, an MT@PLGA ratio (1:3) yielded NPs with a small size of approximately 364 nm and the most favorable polymer dispersity index, indicative of heightened stability (Figure 1d and e). Therefore, we selected the optimal mass ratio of MT@PLGA (1:3) to prepare NPs for integration into our subsequent experiments to obtain an ideal nano-carrier for co-delivery.
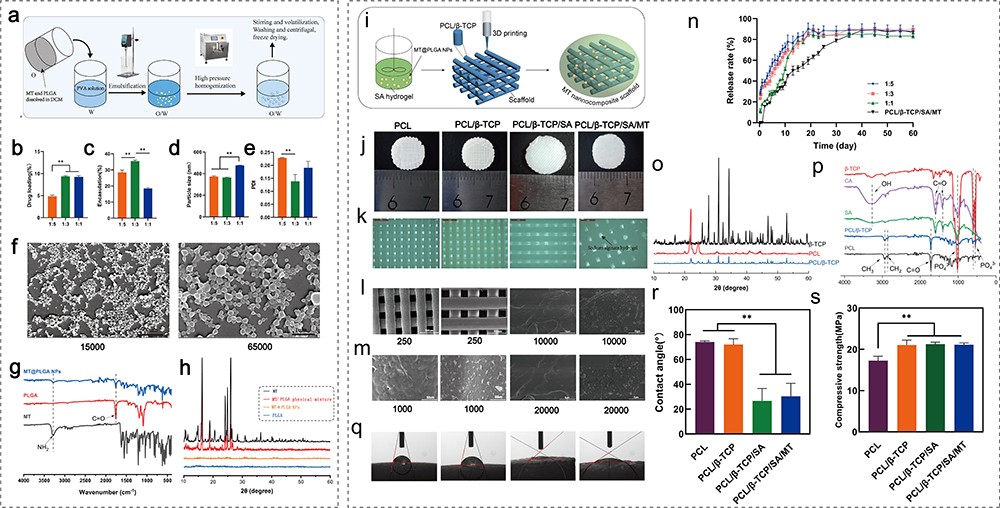 |
Figure 1 Characterization of MT@PLGA NPs and 3D-printed scaffold. (a) Preparation of NPs by emulsion solvent evaporation method. (b–e) Drug loading, encapsulation, particle size, and polymer dispersity index (PDI) of MT@PLGA NPs with different MT and PLGA mass ratios. (f) SEM image of MT@PLGA NPs (1:3) with different magnifications. (g and h) FT-IR and XRD patterns confirmation of the synthesis of MT@PLGA NPs. (i) Fabrication of MT nanocomposite scaffolds. (j and k) Overview and local microscope amplification of different scaffolds (PCL, PCL/β-TCP, PCL/β-TCP/SA and PCL/β-TCP/SA/MT scaffolds). (l and m) SEM image of different scaffolds. (n) In vitro release profiles of NPs and MT nanocomposite scaffold. (o and p) FT-IR and XRD patterns of different components contained in scaffolds. (q and r) Water contact angles of different scaffolds. (s) Compressive strength of different scaffolds. n = 3; **p < 0.01. |
MT@PLGA NPs were characterized in detail using SEM, XRD, and FT-IR. The SEM images (Figure 1f) show that the NPs are spherical and monodisperse, with a mean diameter of approximately 300–400 nm. The FT-IR spectra of both PLGA and MT@PLGA NPs showed C=O stretching at 1756 cm−1, which is a characteristic peak of PLGA. NH2-stretching peak at 3275 cm−1, belonging to MT, was observed in the spectrum of MT@PLGA NPs (Figure 1g).24 The XRD analysis was performed to examine the crystallinity of PLGA, MT, the MT@PLGA physical mixture, and MT@PLGA NPs (Figure 1h). The XRD patterns of MT showed sharp peaks at diffraction angles of 2θ (16.2, 18.9, 24.1, 24.8, and 26.1)38 indicating its crystalline structure. PLGA showed no distinct peak, demonstrating that the polymers were amorphous.39 The MT@PLGA physical mixture exhibited an approximate composition of the individual patterns of both MT and PLGA. The XRD pattern of the MT@PLGA NPs resembled the amorphous structure of PLGA, lacking the characteristic peaks of MT. This observation suggested the substantial presence of amorphous material and the absence of crystalline peaks, providing evidence of the formation of the PLGA-encapsulated NPs.
The three-dimensional architecture of 3D printing scaffolds and integration of MT@PLGA NPs are depicted (Figure 1j and k). The SEM images displayed an intricate pore structure, which revealed a consistent and uniform appearance of interconnected pores within the scaffolds, measuring approximately 200 μm (Figure 1l and m). This dimension aligns harmoniously with the ideal range of pore sizes in bone tissue engineering for porous implant materials.40 Furthermore, a small amount of β-TCP particles were detected on the surface of PCL/β-TCP scaffolds in contrast to pure PCL scaffolds. Additionally, a significant quantity of MT@PLGA NPs was evenly dispersed on the SA coating film. The drug release profiles exhibited consistent patterns across various NPs ratios, with complete release occurring over a span of approximately 20 days. Notably, the release rates did not vary significantly among different NPs proportions. Leveraging the retentive properties of the SA hydrogel, the PCL/β-TCP/SA/MT group demonstrated a more gradual release rate than the pure NPs, which maintained a sustained release profile for approximately 40 days (Figure 1n).
The XRD pattern (Figure 1o) showed that the three highest diffraction peaks at 2θ values of approximately 27.7°, 31.0°, and 34.3° were assigned to the peak characteristics of the β-TCP.41 PCL polymer, which showed two sharp characteristic peaks at 2θ values of approximately 21.9° and 24.4°42 indicating its semi-crystalline nature. For the PCL/β-TCP scaffold, the characteristic peaks of PCL and β-TCP showed a moderate reduction, indicating that crystallinity decreased after the FDM process. The FT-IR spectrum (Figure 1p) showed CH3, CH2, and C=O vibrational peaks corresponding to PCL at 2936, 2864, and 1721 cm−1 respectively.43 The β-TCP powder spectra exhibited strong absorption bands at about 1018, 605, and 546 cm−1 which are typical functional groups of PO43-.44 The PCL/β-TCP scaffolds showed a combination of PCL and β-TCP typical infrared absorption bands. SA showed a broad peak at 3255 cm−1 for the O-H group, and asymmetric and symmetric stretching of the C=O group were observed at 1599 and 1406 cm−1. After cross-linking, the stretching vibrations of O-H bonds in calcium alginate (CA) exhibited a narrower appearance compared to SA. This narrower profile is attributed to the involvement of hydroxyl and carboxylate groups of alginate in the formation of a chelating structure with calcium ions, resulting in a subsequent reduction in hydrogen bonding between hydroxyl functional groups.45 Intriguingly, the water contact angles in the SA coating film scaffolds were markedly smaller than PCL and PCL/β-TCP scaffolds, demonstrating a substantial improvement in hydrophilicity (Figure 1q and r). Mechanical test revealed that the PCL/β-TCP (21.1 ± 1.2 MPa), PCL/β-TCP/SA (21.3 ± 0.5 MPa), and PCL/β-TCP/SA/MT (21.1 ± 0.4 MPa) groups demonstrated similar compressive strength (Figure 1s), which is similar to cancellous bone.46
Biosafety and Cell Adhesion of Scaffolds
To better understand the biological functions of NPs, it is essential to ascertain the optimal dosage of MT@PLGA NPs on the scaffolds. Therefore, we fabricated scaffolds containing varying concentrations of MT@PLGA NPs (0, 20, 40, 60, and 80 mg/mL). The CCK-8 test was applied to measure the cytotoxicity of varying doses of MT@PLGA NPs in MC3T3-E1 and b.End3 cells seeded on scaffolds. The results showed that MC3T3-E1 and b.End3 cell proliferation was dose-dependent, and the cells showed the best proliferation activity on scaffolds containing 40 mg/mL MT@PLGA NPs at 1,4,7 days (Figure S1). When the concentration of MT@PLGA NPs was > 40 mg/mL, cell proliferation began to decline, indicating that MT@PLGA NPs are cytotoxic at high doses. Therefore, the concentration of 40 mg/mL MT@PLGA NPs was chosen in the final scaffolds.
Next, we evaluated cell proliferation, viability (live/dead), and adhesion to explore the effects of the different scaffolds on cell biological functions. MC3T3-E1 and b.End3 cell cultures in all groups demonstrated robust growth and displayed substantial proliferation in CCK-8 assay at 1, 4, and 7 d (Figure 2a and b). Furthermore, the cells in the PCL/β-TCP/SA/MT group grew faster than those in the scaffolds of the other three groups. Next, live/dead cell staining was employed for the direct assessment of the cell activity in the various groups. The result showed that nearly all cells remained viable in the experimental groups after being cultured for three days (Figure 2c and d). Moreover, immunofluorescence staining was employed to examine both the spreading area of cells and the expression of vinculin (Figure 2e–j). The results of the semi-quantitative analysis showed that the average spreading area of MC3T3-E1 cells in both PCL/β-TCP/SA and PCL/β-TCP/SA/MT groups was larger than that in the PCL and PCL/β-TCP groups (Figure 2h) as for the b.End3 cells only PCL/β-TCP/SA/MT group exhibits a notable difference from the PCL group (Figure 2j). The expression of the membrane-cytoskeletal protein vinculin in b.End3 cells were significantly increased in the PCL/β-TCP/SA/MT group in comparison to that in the PCL group (Figure 2i), with no obvious distinction observed among the four groups in the MC3T3-E1 cells (Figure 2g). These results indicated that the MT nanocomposite scaffold effectively improved cell adhesion and motility. Overall, immunofluorescence combined with CCK-8 and live/dead cell experimental results revealed that the MT nanocomposite scaffold exhibited excellent cytocompatibility for further investigation.
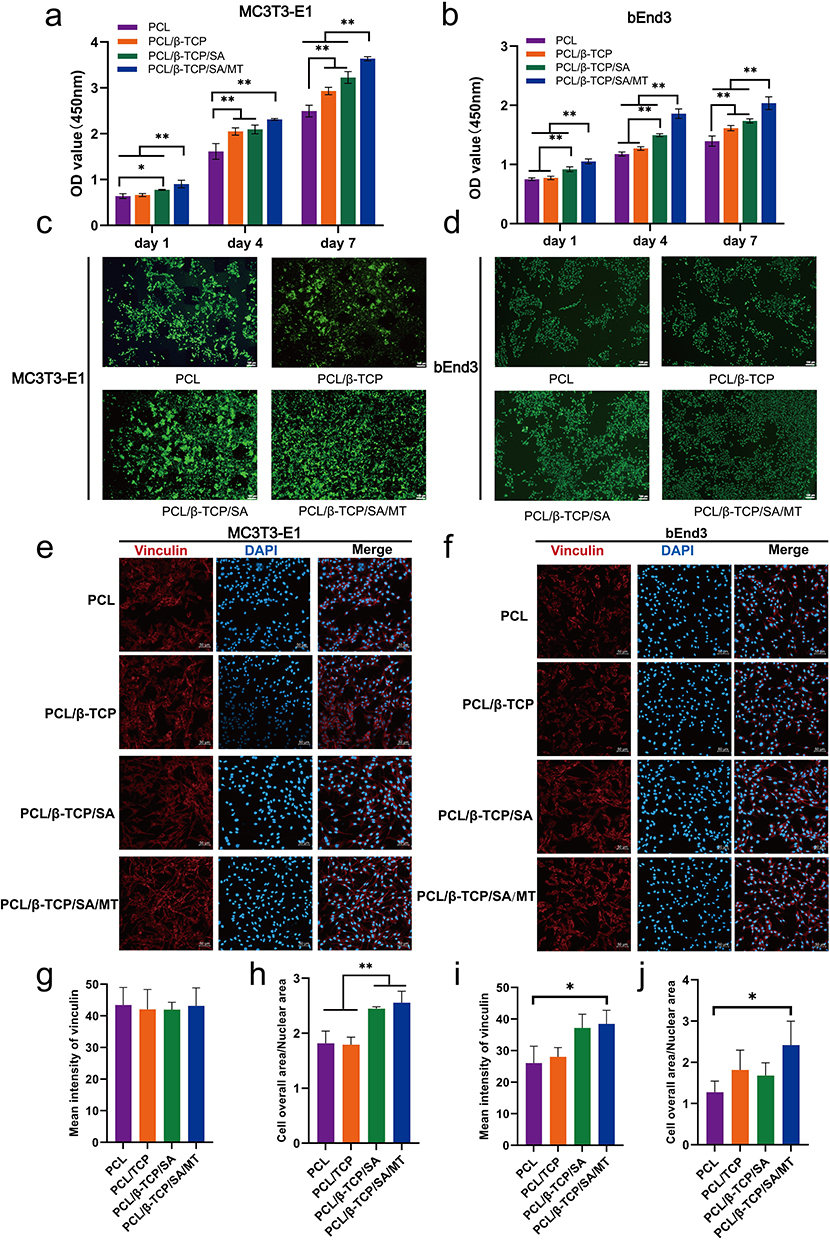 |
Figure 2 Biosafety and cell adhesion of scaffolds. (a and b) Proliferation of MC3T3-E1 and b. End3 cells after culture with scaffolds for 1, 4, and 7 days using the CCK-8 kit. (c and d) Live/dead staining of MC3T3-E1 and b. End3 cells culture with different scaffolds after 3 days incubation. (e and f) Immunofluorescence staining of vinculin in MC3T3-E1 and b. End3 cells after 48 h. (g–j) Fluorescence intensity of vinculin and the ratio of cell overall area to nucleus area in MC3T3-E1 and b. End3 cells were calculated. n=3, *p < 0.05, **p < 0.01. |
Effects of Scaffolds on Osteogenic Differentiation of MC3T3-E1 Cell Under DM Conditions
The effects of different scaffolds on early osteogenic differentiation and osteogenic mineralization of MC3T3-E1 cells were detected by ALP and alizarin red staining, respectively. On Day 7, ALP staining on the scaffold surface in the PCL/β-TCP/SA/MT group exhibited a deeper intensity compared to the other three groups (Figure 3a and b). In addition, ALP activity was notably elevated in the PCL/β-TCP/SA/MT group than in the other three groups (Figure 3c). On Day 21, MC3T3–E1 cells in the PCL/β-TCP/SA/MT group formed deep-stained red calcium nodules, whereas the color of the other three groups was lighter (Figure 3d and e), and the quantitative analysis of ARS calcium nodules also exhibited the same trends (Figure 3f). These results demonstrated that MC3T3-E1 cells within the MT nanocomposite scaffold displayed enhanced osteogenic differentiation, surpassing the performance of the other three groups. Transcriptional level assessment was conducted to evaluate the osteogenic differentiation of MC3T3-E1 cells. The expression of osteogenesis-related genes including Col1, OPN, BMP-2, OSX, Runx2, and ALP were noticeably higher in the PCL/β-TCP/SA/MT group than in the other three groups (Figure 3g). Moreover, compared with the PCL group, the PCL/β-TCP, and PCL/β-TCP/SA groups exhibited improved osteogenic differentiation ability (Figure 3g) because β-TCP promoted osteogenic differentiation through the release of calcium ions.29 These findings indicated that the MT nanocomposite scaffold can effectively promote the osteogenesis of MC3T3-E1 cells in diabetic conditions.
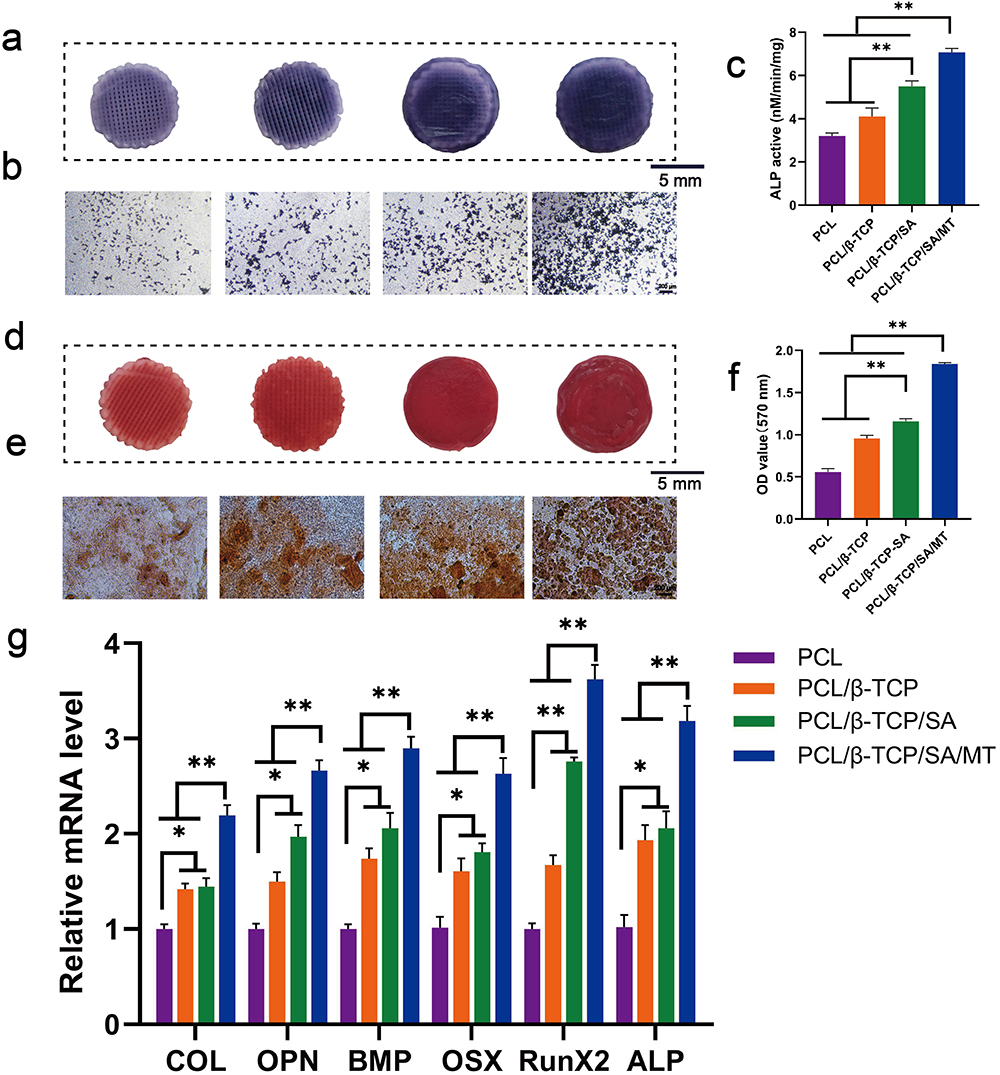 |
Figure 3 The osteogenic properties of different scaffolds in vitro. (a) ALP staining of MC3T3-E1 cell cultured on scaffolds after 7 days. (b) ALP staining images under microscope. (c) The quantification of ALP activity. (d) Alizarin red staining of MC3T3-E1 cell cultured on scaffolds after 21 days. (e) Alizarin red staining images under microscope. (f) The quantification analysis of ARS staining. (g) The osteogenic gene expression of MC3T3-E1 cell culture with different scaffolds for 7 days. n=3, *p < 0.05, **p < 0.01. |
Effects of Scaffolds on the Angiogenesis of b.End3 Under DM Conditions
Figure 4a illustrates the outcomes of scratch experiments involving b.End3 cells under diabetic conditions across different scaffold groups. Notably, b.End3 cells exhibited substantial migration-induced healing within 12 h in all experimental groups. Statistical analysis showed that the healing effect in the PCL/β-TCP/SA/MT group was remarkably greater than that in PCL, PCL/β-TCP, and PCL/β-TCP/SA groups, whereas there was no considerable variation between the other three groups (Figure 4b). In the tubule formation experiment, b.End3 cells in the PCL/β-TCP/SA/MT group exhibited the ability to form tubular structures within 6 hours. In contrast, cells in the PCL, PCL/β-TCP, and PCL/β-TCP/SA groups only generated numerous vascular branching structures with discontinuous tubular walls (Figure 4c). Statistical analysis revealed that both the number of vascular branch nodes and the total vessel length in the PCL/β-TCP/SA/MT group surpassed those in the PCL, PCL/β-TCP, and PCL/β-TCP/SA groups (Figure 4d and e). RT-PCR was applied to evaluate the angiogenesis activity of b.End3 cells at the transcriptional level. After co-culture, angiogenesis-associated genes, including CD31, ANG1, ANG2, and VEGF, were significantly upregulated in the PCL/β-TCP/SA/MT group than in the other three groups (Figure 4f). Western blot and immunofluorescence indicated that in comparison with the other three groups, angiogenesis-related proteins (VEGF, CD31, and Ang2) in the PCL/β-TCP/SA/MT group were significantly upregulated (Figure 4g–m). These findings indicated that the MT nanocomposite scaffold effectively facilitated the angiogenesis of b.End3 cells under diabetic conditions. To verify the antioxidant performance of different scaffolds, we determined a series of antioxidant indexes including MDA, GSH, SOD, and hydroxyl radical scavenging assay in b. End3 cells under diabetic conditions (Figure 4n–q). The results showed notably diminished MDA levels in the PCL/β-TCP/SA/MT group (Figure 4n). Meanwhile, PCL/β-TCP/SA/MT group showed the highest GSH and SOD activities and the most robust capacity for scavenging free radicals (Figure 4o–q), indicating that the MT nanocomposite scaffold possesses favorable antioxidant activity under diabetic conditions.
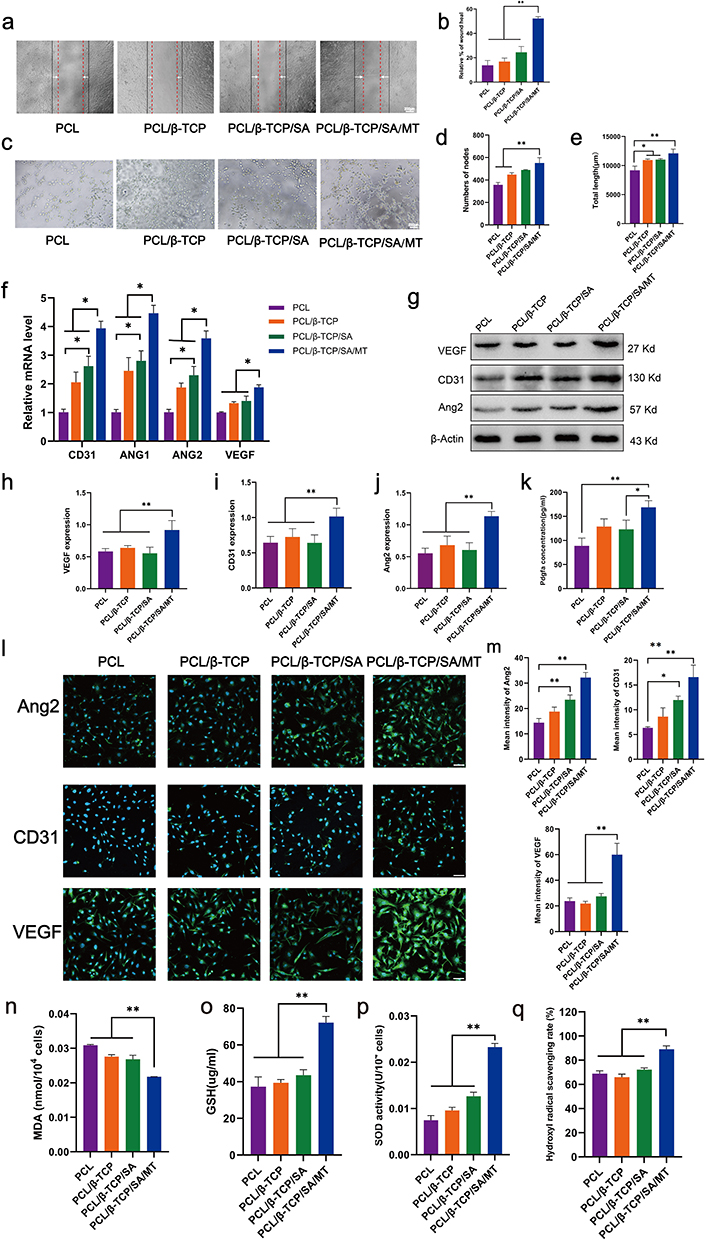 |
Figure 4 The angiogenesis properties of different scaffolds in vitro. (a) Scratch wound healing of b. End3 cultured with different scaffolds after 12 h, scale bar = 200 μm. (b) Statistical analysis of wound healing. (c) Tubule formation of b. End3, scale bar = 200 μm. (d and e) Quantitative analysis of nodes and total tube length. (f) Quantitative analysis of the angiogenesis-related gene expression. (g–j) The protein level of angiogenesis-related genes by Western blot analysis in b. End3 cells. (k) ELISA quantitative results of cytokine PDGFA secreted from VECs. (l and m) Immunofluorescence images of Ang2, CD31, and VEGF staining (scale bar: 50 μm) and relative quantitative analysis of fluorescence intensity. (n–q) Activity of lipid oxidation metabolites MAD, antioxidant enzymes SOD, GSH, and hydroxyl radical scavenging rate of b. End3. n=3, *p < 0.05, **p < 0.01. |
Mechanism of Scaffolds on the Angiogenesis Under DM Conditions
To understand the underlying mechanisms through which the MT nanocomposite scaffold promotes angiogenesis, we conducted an RNA-sequencing assay to analyze the differentially expressed genes (DEGs) between the DM and PCL/β-TCP/SA/MT groups. Furthermore, we analyzed osteogenesis, angiogenesis, and antioxidant-related functions of the target genes via Gene Ontology (GO) and Kyoto Encyclopedia of Genes and Genomes (KEGG) enrichment analyses. Transcriptomic sequencing results are shown in Figure 5. The heatmap of DEGs demonstrated that the transcriptome profile exhibited evidently changes between the PCL/β-TCP/SA/MT and DM groups (Figure 5a). In comparison to the DM group, there were 781 upregulated DEGs and 584 downregulated DEGs in the PCL/β-TCP/SA/MT group, as shown in the volcano map (Figure 5b). To understand the functions of the identified DEGs, GO (Figure 5c) and KEGG (Figure 5d) pathway enrichment analyses were performed. Statistical analysis of GO for DEGs revealed an upregulation in the expression of genes associated with biological processes responding to reduced oxygen levels (Figure 5c). The KEGG enrichment analysis scatter plot showed that oxidative stress- and inflammation-related signaling pathways were among the top 20 signaling pathways with the most significant differences (Figure 5d). These pathways included the AGE-RAGE signaling pathway in diabetic complications, the TNF signaling pathway, the HIF-1 signaling pathway, and the NF-kappa B signaling pathway. Further screening of genes related to the response to decreased oxygen levels indicated that the expression of almost all the genes related to the decrease in oxygen levels was significantly downregulated in the DM group, whereas it was significantly increased in the PCL/β-TCP/SA/MT group (Figure 5e). Moreover, gene screening of heat maps for antioxidation and vascular-related DEGs showed that HO-1, Wnt, Fgfr3, VEGFA, Col1a1, Sod3, and Col9a1 were significantly upregulated, while Keap1 decreased significantly in the PCL/β-TCP/SA/MT group compared to the DM group (Figure 5f). Keap1 serves as a well-known antagonist of Nrf2, sequestering Nrf2 in the cytoplasm through ubiquitination and proteasome-mediated degradation. Therefore, the downregulation of Keap1 potentially signifies the activation of Nrf2.47 The protein-protein interaction (PPI) network showed that HO-1, Wnt, Fgfr3, VEGFA, Col1a1, Sod3, Col9a1, and Keap1 may interact with proteins (Figure 5g), and the MT nanocomposite scaffold may promote angiogenesis under diabetic conditions by regulating this protein network. Subsequent qPCR validation (Figure 5h) showed that compared to the DM group, the PCL/β-TCP/SA/MT group exhibited a significant increase in the mRNA levels of HO-1, Wnt, Fgfr3, VEGFA, Col1a1, Sod3, and Col9a1, while the expression of Keap1 demonstrated a significant decrease, which is consistent with the transcriptome sequencing results. These findings indicated that the diabetic environment suppressed the expression of antioxidant and angiogenesis genes, and the MT nanocomposite scaffold exhibited significant antioxidant and angiogenesis abilities under diabetic conditions, potentially due to these genetic alterations.
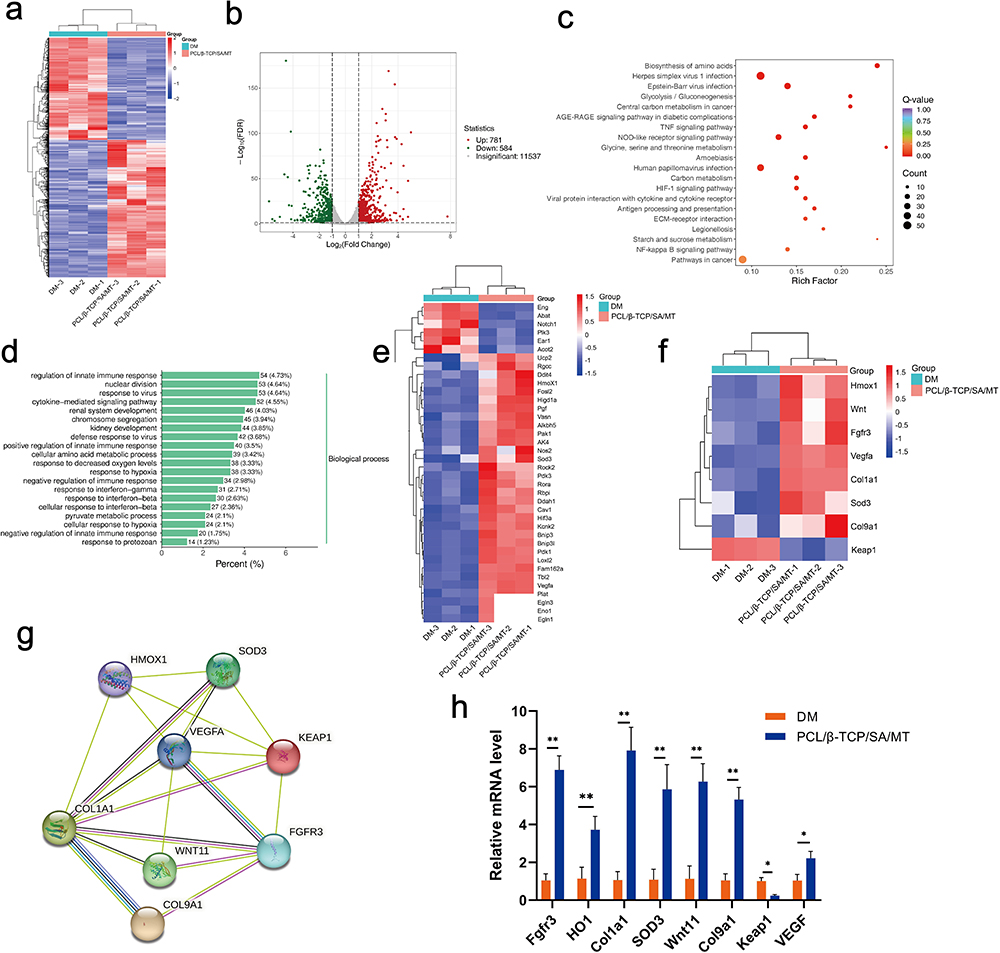 |
Figure 5 Transcriptome analysis of MT nanocomposite scaffold. (a) DEG heat map according to RNA-seq analysis. (b) The differentially expressed genes in the PCL/β-TCP/SA/MT group compared to DM group. (c) GO analysis of differentially expressed genes between PCL/β-TCP/SA/MT group and DM group. (d) KEGG enrichment analysis of PCL/β-TCP/SA/MT group compared with DM group. (e) DEG heat map related to response to decreased oxygen levels. (f) Heat map of DEG related to antioxidant and angiogenesis in PCL/β-TCP/SA/MT group vs DM group. (g) The PPI network of antioxidant and angiogenesis-related genes. (h) qPCR to verify the expression of DEG mRNA related to antioxidant and angiogenesis in Bend.3 cell. n=3; *p < 0.05, **p < 0.01. |
Nrf2 acts as a master regulatory transcription factor, essential for cellular protection against oxidative.48 The RNA-sequencing revealed the activation of Nrf2 in VECs after intervening with MT nanocomposite scaffold. To further verify the protective mechanism of the MT nanocomposite scaffold in b.End3 cells under diabetic conditions, we used ML385, a selective NRF2 inhibitor, to probe the intricate interplay between NRF2 targets and angiogenesis. Three groups of DM (b.End3 cell culture under diabetic conditions), PCL/β-TCP/SA/MT (b.End3 cell culture with the MT nanocomposite scaffold under diabetic conditions), and PCL/β-TCP/SA/MT/ML385 (b.End3 cell culture with the MT nanocomposite scaffold using ML385 (5 μM) under diabetic conditions) were established. First, the levels of intracellular ROS were evaluated through fluorescence staining with DCFH-DA (Figure 6a) and quantified using Image J software (Figure 6b). The DM group showed the strongest DCF fluorescence intensity compared with the other two groups. The DCF intensity in the PCL/β-TCP/SA/MT group was significantly reduced, whereas the inhibitory effect of the MT nanocomposite scaffold on ROS was counteracted in the PCL/β-TCP/SA/MT/ML385 group. These results indicate that the MT nanocomposite scaffold significantly decreased DM-induced intracellular ROS levels, which may be mediated by Nrf2 activation. Furthermore, to explore the potential mechanism, the downstream regulation of MT nanocomposite scaffold on Nrf2 downstream was examined using qPCR and immunofluorescence. The transcriptional expression of antioxidant- and angiogenesis-related genes, including CAT, SOD, HO-1, Nrf2, and VEGF, was evaluated. qPCR analysis showed that the mRNA levels of CAT, SOD, HO-1, Nrf2, and VEGF were higher in the PCL/β-TCP/SA/MT group than in the DM group (Figure 6c). Interestingly, the expression of these genes decreased after addition of ML385. Furthermore, the results of immunofluorescence and Western blot confirmed that the expression of Nrf2 and VEGF in b.End3 cells decreased under diabetic conditions (Figure 6d–j). The fluorescence intensity of Nrf2 and VEGF was enhanced in the PCL/β-TCP/SA/MT group, whereas the expression of Nrf2 and VEGF was inhibited after the addition of ML385. The results of Western blot showed the same tendency. Consistently, ELISA analysis of VEGF revealed notably elevated levels in the PCL/β-TCP/SA/MT group, while the ML385 group exhibited a decrease in VEGF concentration (Figure 6k). These results demonstrate that the MT nanocomposite scaffold may promote angiogenesis by facilitating VEGF production through activation of the Nrf2/HO-1 signaling cascade under diabetic conditions.
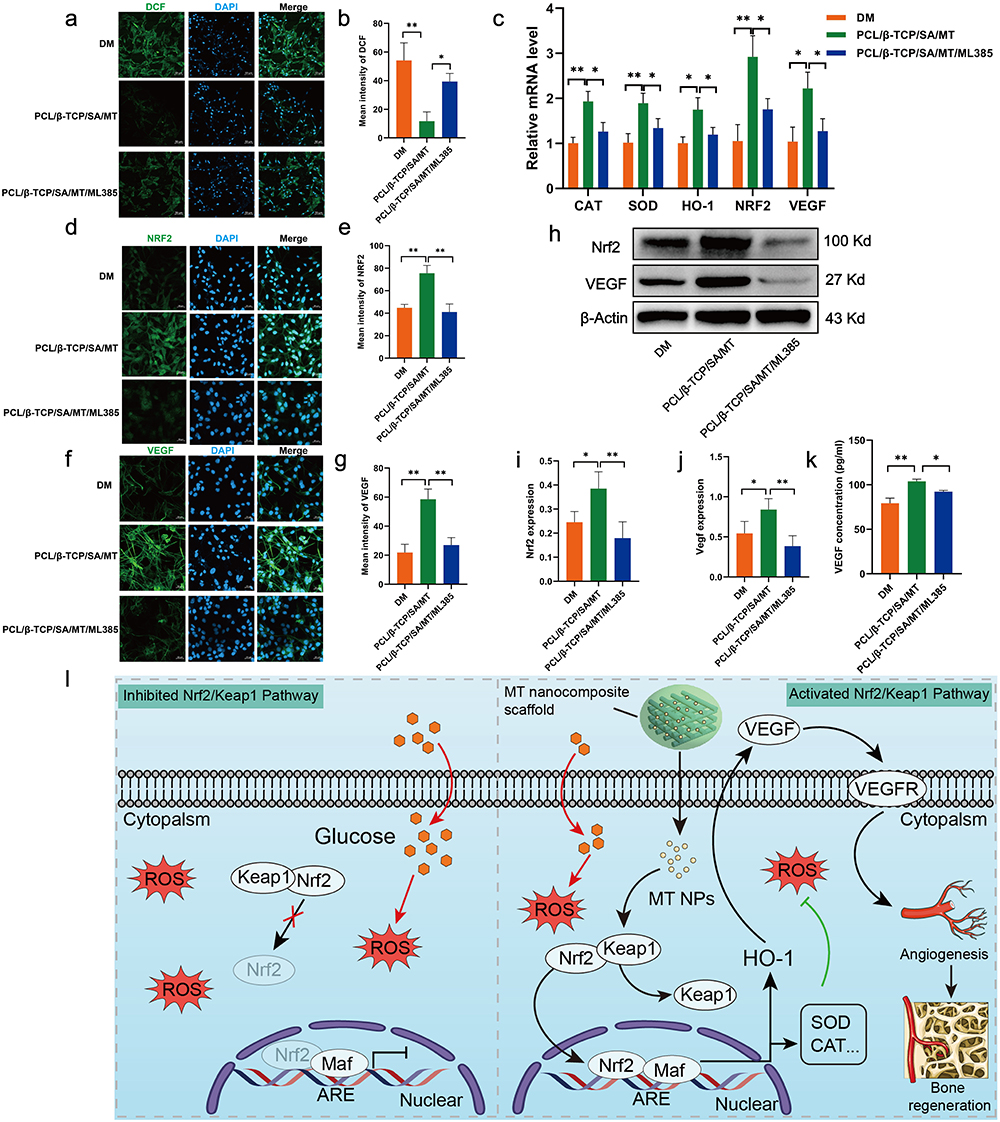 |
Figure 6 The mechanism of MT nanocomposite scaffold to promote angiogenesis. (a) The DCF fluorescence images represented the ROS level, scale bar: 50 μm. (b) Quantitative analysis of the relative DCF fluorescence intensity. (c) qPCR analysis of the mRNA expression levels of intracellular antioxidant and angiogenesis-related genes. (d–g) Immunofluorescence images of the Nrf2 and VEGF staining (scale bar: 50 μm) and relative quantitative analysis of fluorescence intensity. (h–j) The protein level of Nrf2 and VEGF by Western blot analysis in bEend.3 cell. (k) ELISA quantitative results of cytokine VEGF secreted from VECs. (l) Schematic diagram showing the mechanism of Nrf2-mediated angiogenesis activated by MT nanocomposite scaffold. n=3; *p < 0.05, **p < 0.01. |
In vivo Bone Regeneration of Nanocomposite Scaffolds
The timeline design of diabetic model construction, diabetic bone defect, and MT nanocomposite scaffold implantation in mice were shown in Figure 7a. The diabetic mice model was constructed by administering a high-fat diet along with intraperitoneal injections of STZ. After two weeks of high-fat feeding, the body weight and blood glucose of the mice increased slightly, and after STZ injection, the blood glucose level quickly reached the hyperglycemia level (>13.8 mmol/L) within a week (Figure 7b and c), indicating that the diabetic mice were successfully induced. Next, to assess the impact of MT nanocomposite scaffolds on promoting bone regeneration in diabetic mice and their potential mechanism, we implanted MT nanocomposite scaffolds in diabetic mice. After implantation of the MT nanocomposite scaffolds for two months, the major organs were collected for pathological evaluation (Figure S2). The results of the long-term biosafety assessment confirmed that scaffolds containing MT were non-toxic in vivo, suggesting their potential for clinical application in bone defect repair in diabetes.
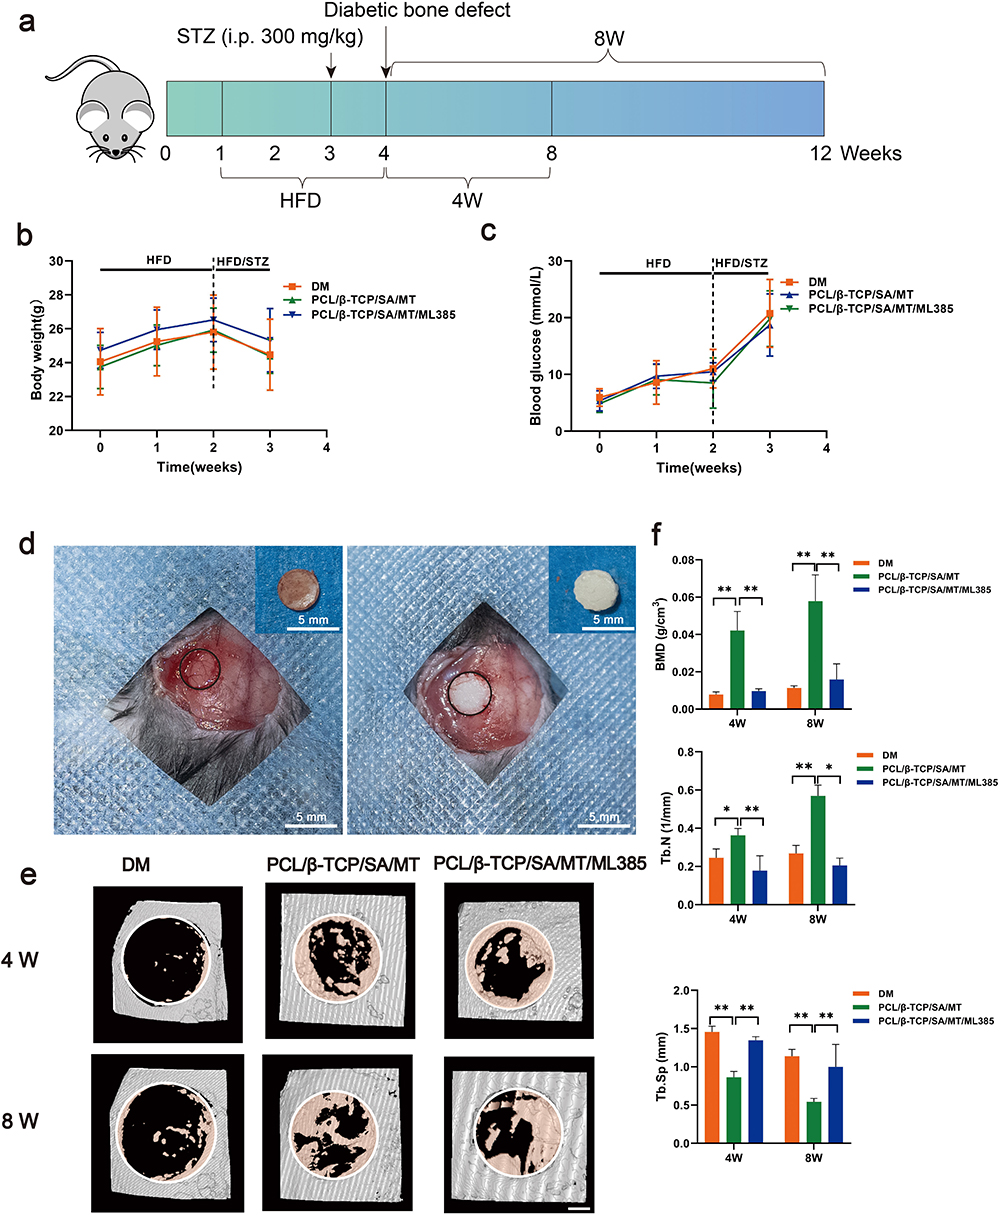 |
Figure 7 The osteogenesis properties of MT nanocomposite scaffold in vivo. (a) The timeline design of diabetic model construction, diabetic bone defect, and MT nanocomposite scaffold implantation in mice. (b and c) Body weight and blood glucose were measured for two consecutive weeks to confirm the establishment of diabetic mice. (d) diabetic mice were subjected to calvarial defect surgery and intraoperative photos of removing skull pieces and then the MT nanocomposite scaffold (diameter: 4 mm, height: 1.5 mm) was implanted. (e) 3D reconstructed images showing the effects of MT nanocomposite scaffold on the new bone formation inside the defect site (scale bar: 1mm). (f) Quantitative analysis of micro-CT images at 4 and 8 weeks. n=4; *p < 0.05, **p < 0.01. |
An in vivo experiment was conducted on diabetic mice with 4 mm diameter calvarial defects, and the cylindrical scaffolds were appropriately fitted to the calvarial defects during the surgical procedure (Figure 7d). Micro-CT analysis and histomorphometric analysis were performed at 4 and 8 weeks post-surgery, respectively. From the 3D micro-CT reconstruction images (Figure 7e), all three groups displayed new bone formation extending from the edge to the center of the defects, among which the PCL/β-TCP/SA/MT group presented the best radiological manifestations, followed by the PCL/β-TCP/SA/MT/ML385 group. With the passage of time, an increase in new bone tissue was evident in the defect area at 8 weeks compared to the observations at 4 weeks in all the groups. Next, micro-architectural parameters, including BMD and Tb. N and, Tb. The Sp values measured in the defect area were analyzed (Figure 7f). The micro-CT results at 8 weeks postoperatively showed that BMD in the DM group was the lowest compared to that in the PCL/β-TCP/SA/MT and PCL/β-TCP/SA/MT/ML385 groups, indicating that the implantation of the MT nanocomposite scaffold could accelerate bone healing in diabetes. Besides, the Tb. N in the PCL/β-TCP/SA/MT mice was greater than in DM mice, demonstrating the outstanding repair effect of the MT nanocomposite scaffold in vivo. While the Tb. Sp showed opposite results for Tb. Sp in the bone is inversely proportional to bone strength. The above analysis demonstrated that the MT nanocomposite scaffold improved the damaged diabetic bone microenvironment by the sustained release of MT, which was conducive to bone tissue healing, and the Nrf2 may be one of the underlying mechanisms through which the MT nanocomposite scaffold promotes osteogenesis.
H&E and Masson’s trichrome staining were used to observe the diabetic bone regeneration within the calvarial defect region. The results showed that there are some new bone formation around the calvarial defect in each group, which are consistent with the micro-CT images (Figure 8). It was worth noting that the lateral cortical bone of the defect areas in the DM group was discontinuous (Figure 8a) and rare trabecular bone structures were observed. In contrast, more new bone formation was present in the other two groups and new bone tissue was more abundant in the PCL/β-TCP/SA/MT group than in the PCL/β-TCP/SA/MT/ML385 group. Moreover, the differences among the three groups became more evident at eight weeks. Similarly, Masson’s staining also showed that the MT nanocomposite scaffold promoted more new bone formation than the other groups (Figure 8a), indicating the excellent capacity for osteogenesis in diabetic bone defects.
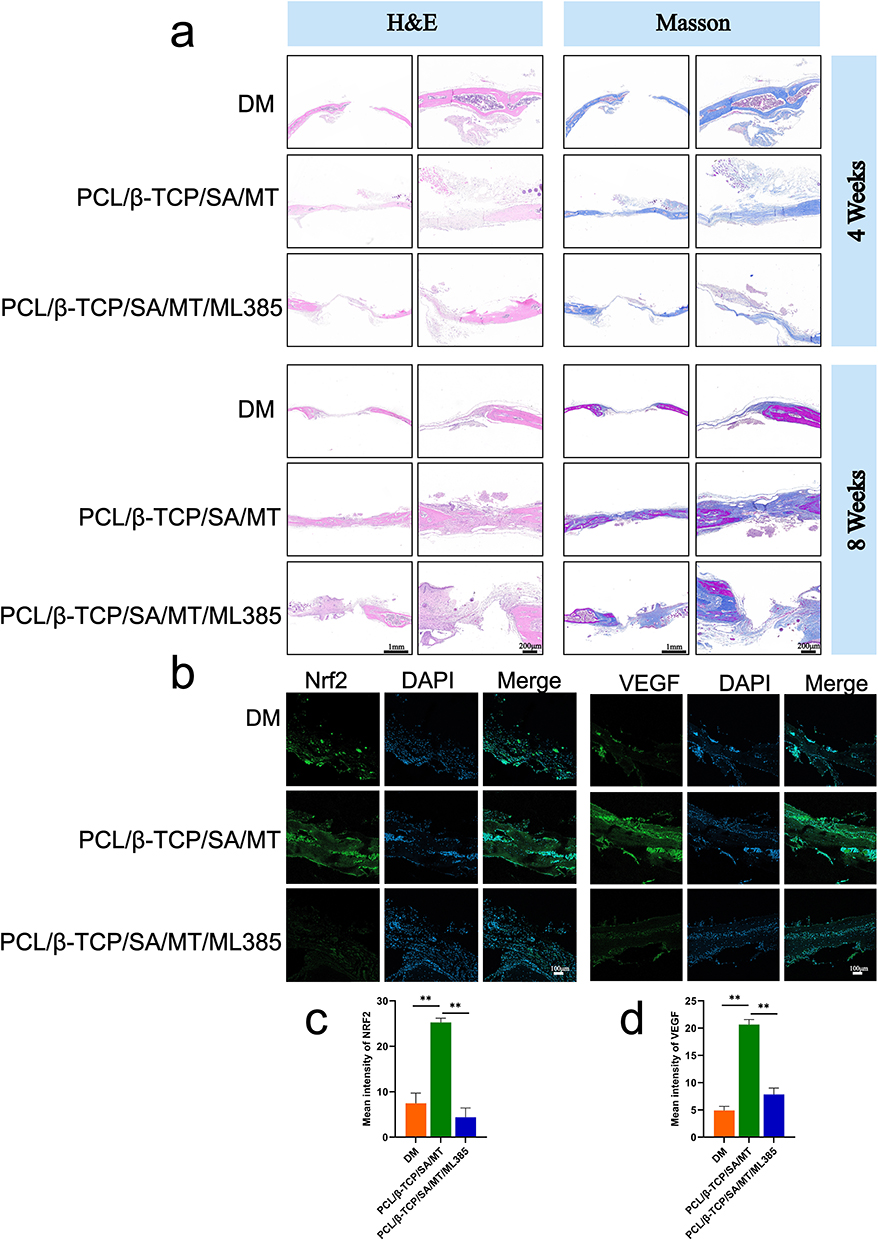 |
Figure 8 Evaluation of in vivo bone defect repair following scaffold implantation through histological and immunofluorescence staining. (a) Images of H&E and Masson trichrome staining in the skull defect area at 4 and 8 weeks postoperatively. (b–d) Immunofluorescence staining of Nrf2 and VEGF in the skull defect area at 8 weeks after implantation. n=3; *p < 0.05, **p < 0.01. |
To confirm that the Nrf2 pathway was activated during the bone repair process after implantation of the MT nanocomposite scaffold, immunofluorescence staining for Nrf2 and VEGF was performed at eight weeks. As shown in Figure 8b–d, the fluorescence signal of Nrf2 was higher in the PCL/β-TCP/SA/MT group than in the DM and PCL/β-TCP/SA/MT/ML385 groups. The fluorescence signal of VEGF was also more evident in slices of the PCL/β-TCP/SA/MT group (Figure 8b). Quantitative analysis showed that the expression of Nrf2 and VEGF was significantly higher in the PCL/β-TCP/SA/MT group than in other groups, suggesting that the MT nanocomposite scaffold could activate the Nrf2 signaling pathway and efficiently promote blood vessel formation (Figure 8c and d). These findings further indicated that the Nrf2-VEGF pathway enhances angiogenesis in bone defects under diabetic conditions.
Discussion
In this study, we developed an MT nanocomposite scaffold and demonstrated improved osteogenic ability under diabetic conditions. The mechanism was the dual effects of the MT nanocomposite scaffold on promoting angiogenesis by stimulating the Nrf2/HO-1 signaling pathway, including enhancing the activity of antioxidant enzymes to reduce the oxidative stress damage of VECs and directly stimulating VECs to produce VEGF, which rescued the angiogenesis-osteogenesis uncoupling in the diabetic bone environment.
To increase the stability and bioavailability of MT and enhance its sustained-release properties, we employed PLGA, a biodegradable polymer material, as a sustained nano-carrier for MT. By optimizing our processing techniques, we successfully achieved a uniform and stable dispersion of MT@PLGA NPs with particle sizes of approximately 300–400 nm (Figure 1). 3D printing PCL/β-TCP scaffold for bone tissue engineering has superior compatibility and excellent mechanical properties. Mechanical testing of the MT nanocomposite scaffold revealed a compressive strength of approximately 21.1 MPa (Figure 1), which was comparable to that of the cancellous bone. However, the growth of cells on the PCL/β-TCP scaffold surface was limited because of insufficient biofunctionality and strong hydrophobicity. The hydrophilicity of bone implant materials plays a crucial role in influencing osseointegration capacity. Previous studies indicate that heightened hydrophilicity of the material can facilitate the adhesion and differentiation of bone progenitor cells,49 increase the amount of bone attachment to the implant surface, and expedite the rate of mineralization deposition on the implant surface.50 On a conventional titanium implant, the absorption of carbonates and hydrocarbons from the surrounding air can lead to a low surface energy, and the surface roughness may contribute to hydrophobicity. To counteract these effects, it is essential to hydroxylate the implants, rinse them under nitrogen protection, and store them in an isotonic saline solution until use. This process promotes hydrophilicity.51 In the case of PEEK materials, their inherent hydrophobic and biologically inert nature can result in poor osseointegration. To address this limitation, the hydrophilicity and bioactivity of PEEK materials are enhanced through surface modification techniques within the realm of biomaterials.50 Because the SA hydrogel demonstrated excellent properties, such as good biocompatibility, bioadhesion, and hydrophilicity, SA hydrogel modification can markedly improve the hydrophilicity and biological activity of the PCL/β-TCP scaffold (Figures 1 and 2). Furthermore, the encapsulation effect of MT@PLGA NPs, combined with the retention effect of SA hydrogels, enabled the nanocomposite scaffold to exhibit an MT sustained-release profile that lasted for over 40 days (Figure 1), exerting a long-term influence on bone defect repair. Moreover, our results verified good biocompatibility of the MT nanocomposite scaffold for heightened proliferation, adhesion, and spread of MC3T3-E1 and bEnd.3 cells in vitro (Figure 2).
β-TCP has garnered significant attention in clinical treatments, primarily owing to its notable properties in terms of biocompatibility, osteoconductivity, osteoinductivity, and biodegradability thus rendering it well-suited as a bone substitute for clinical applications. The promising results from various clinical trials underscore the efficacy of β-TCP in bone repair, demonstrating outcomes comparable to allografts.52 Our results showed that compared with the PCL scaffold, the PCL/β-TCP scaffold can effectively promote osteogenic differentiation of MC3T3 cells (Figure 3). Moreover, our in vivo and in vitro results showed that the PCL/β-TCP/SA/MT group exhibited the best osteogenic ability (Figures 3 and 7) compared to the other groups under diabetic conditions, which aligns with the findings of prior investigations.53,54 The osteogenic ability of the PCL/β-TCP/SA/MT group was demonstrated by marked upregulation in the transcriptional expression of pivotal osteogenic-related genes (RUNX2, OSX, COL1a, OPN, ALP, and BMP2) and increased matrix mineralization in MC3T3-E1 cells in vitro (Figure 3). In vivo studies encompassing micro-CT and histomorphometric evaluations within T2DM mice also showed more new bone formation and effective bone defect repair in the PCL/β-TCP/SA/MT group (Figure 7). Overall, these data demonstrated that MT@PLGA NPs combined with PCL/β-TCP/SA scaffolds designed and fabricated in our study could notably enhance osteoblastic differentiation and facilitate new bone regeneration under diabetic conditions, exhibiting elevated osteogenesis ability as a novel graft to repair diabetic bone defects and indicating potential clinical application in the future.
It was well known that punctually and sufficient angiogenesis during new bone formation is critical and the mechanism had been elucidated as intraosseous H-type blood vessels mediating the angiogenesis-osteogenesis coupling through a constant supply of bone progenitor cells.7 Although the precise mechanism underlying DBD remains unclear, excess accumulation of ROS has been found to trigger oxidative stress damage in VECs, which has been reported as a significant pathological mechanism of many DM complications.8 In recent years, our studies have increasingly pointed towards ROS-induced VECs damage, H-type vascular lesions, and angiogenesis-osteogenesis uncoupling as pivotal mechanisms of DBD.9,12,55 In this study, we also observed a notable elevation of ROS levels in bEnd.3 cells under diabetic conditions, but further remarkable reduction when the cells were cultured with the MT nanocomposite scaffold (Figure 6). Meanwhile, it was proved that the MT nanocomposite scaffold significantly enhanced the antioxidant enzymes activity (GSH, SOD) and improved the free radical scavenging ability of bEnd.3 cells (Figure 4). Angiogenesis-related genes (CD31, VEGF, Ang1, and Ang2) and proteins (VEGF, CD31, and Ang2) were upregulated in the PCL/β-TCP/SA/MT group, indicating that the MT nanocomposite scaffold reversed oxidative stress damage in VECs and promoted angiogenesis in the diabetic environment (Figure 4). Furthermore, we found that the MT nanocomposite scaffold promoted the osteoblastic differentiation through the augmentation of communication between bEnd.3 and MC3T3-E1 cells, which was demonstrated by pronounced paracrine cytokine PDGFA secretion from VECs in PCL/β-TCP/SA/MT group (Figure 4). These results indicate that the MT nanocomposite scaffold might rescue the angiogenesis-osteogenesis uncoupling from ROS-induced oxidative stress damage to VECs and thus tend to facilitate new bone formation and bone defect repair under diabetic conditions.
Nrf2 is a well-known antioxidant transcription factor that responds to oxidative stress, safeguards cells by binding to antioxidant response elements in the nucleus, and stimulates the transcription of relevant antioxidant genes, such as HO-1, SOD, and CAT.56 The Nrf2/HO-1 pathway is among the main mechanisms underlying the antioxidant effects of MT. Shi et al57 found MT could potentially mitigate renal ischemia/reperfusion damage in diabetes, likely via enhancing the Nrf2/HO-1 signaling pathway. Otherwise, MT was reported to improve the osteogenic potential of MC3T3-E1 by activating the Nrf2/HO-1 pathway and significantly suppressing ferroptosis under type 2 diabetic conditions.20 In our study, the qPCR results demonstrated the genes of Nrf2/HO-1 and other downstream genes of Nrf2 including SOD and CAT were down-regulated in DM group and reversed in PCL/β-TCP/SA/MT group (Figure 6). Transcriptome analysis also confirmed that HO-1 was upregulated and Keap1 (a negative regulator of Nrf2) downregulated in the PCL/β-TCP/SA/MT group, indicating that the MT nanocomposite scaffold activated the Nrf2/HO-1 signaling pathway (Figure 5). Combined with the results mentioned previously, these findings demonstrate that the MT nanocomposite scaffold can trigger the activation of the Nrf2/HO-1 pathway to reduce VECs oxidative stress damage, promote angiogenesis, and ultimately facilitate the angiogenesis-osteogenesis coupling under diabetic conditions.
Although excessive accumulation of ROS leads to the inhibition of Nrf2 activation and subsequent impairment of angiogenesis under diabetic conditions,58 the Nrf2/HO-1 signaling pathway exhibited the capability to directly stimulate VEGF, thereby promoting angiogenesis in the presence of appropriate concentration of ROS.59 Our immunofluorescence and Western blot results showed that the intervention of MT nanocomposite scaffold significantly enhanced the expression of Nrf2 and VEGF in vitro (Figure 6). To delve deeper into the role of the Nrf2/HO-1 signaling pathway, an Nrf2 inhibitor (ML385) was added to the PCL/β-TCP/SA/MT group. Interestingly, the transcriptional expressions of HO-1 and VEGF were significantly downregulated (Figure 6). The data of the in vivo experiments consistently exhibited the same trend. The expression of Nrf2 and VEGF was downregulated in the diabetic mice injected with ML385 (Figure 8). These findings suggest that the MT nanocomposite scaffold may directly promote angiogenesis by activating the Nrf2/HO-1 pathway as ROS overproduction is suppressed through antioxidants. Briefly, we speculated that the MT nanocomposite scaffold may exert dual angiogenesis effects through the Nrf2/HO-1 signaling pathway. The MT nanocomposite scaffold protected VECs from oxidative stress damage induced by the diabetic environment via increasing the activity of antioxidant enzymes and then directly promoting VEGF production through the Nrf2/HO-1 signaling pathway activated via reduced ROS concentration.
Conclusion
In this study, we successfully fabricated MT nanocomposite scaffolds with sustained MT release and improved osteogenic ability as novel bone grafts for DBD defect repair. The MT nanocomposite scaffold could effectively promote new bone formation and diabetic bone defect repair, and the underlying mechanism was dual angiogenesis effects by activating the Nrf2/HO-1 signaling pathway, which protects VECs from oxidative stress damage and simultaneously promotes VEGF production directly. Our study highlighted the potential of the MT nanocomposite scaffold as a novel bone graft, positioning it as a promising candidate for the treatment of diabetic bone defects.
Funding
This work was supported by the Basic Applied Basic Research Foundation of Guangdong Province (No.2022A1515012373), the National Natural Science Foundation of China (No. 81972045), and a research fund from the SUSTech Hospital.
Disclosure
The authors report no conflicts of interest in this work.
References
1. Wang W, Yeung KW. Bone grafts and biomaterials substitutes for bone defect repair: a review. Bioact Mater. 2017;2(4):224–247. doi:10.1016/j.bioactmat.2017.05.007
2. Hruby J, Spunda R, Mericka P, et al. Influence of the new standardized clinical cryopreservation/slow thawing protocol on immunogenicity of arterial allografts in rats. PLoS One. 2020;15(3):e0230234. doi:10.1371/journal.pone.0230234
3. International Diabetes Federation. IDF Diabetes Atlas.
4. Yan Y, Wu T, Zhang M, Li C, Liu Q, Li F. Prevalence, awareness and control of type 2 diabetes mellitus and risk factors in Chinese elderly population. BMC Public Health. 2022;22(1):1382. doi:10.1186/s12889-022-13759-9
5. Hofbauer LC, Busse B, Eastell R, et al. Bone fragility in diabetes: novel concepts and clinical implications. Lancet Diabetes Endocrinol. 2022;21:00347. doi:10.1016/S2213-8587
6. Al‐Sowygh ZH, Ghani SMA, Sergis K, Vohra F, Akram Z. Peri implant conditions and levels of advanced glycation end products among patients with different glycemic control. Clin Implant Dent Relat Res. 2018;20(3):345–351. doi:10.1111/cid.12584
7. Kusumbe AP, Ramasamy SK, Adams RH. Coupling of angiogenesis and osteogenesis by a specific vessel subtype in bone. Nature. 2014;507(7492):323–328. doi:10.1038/nature13145
8. Babel RA, Dandekar MP. A review on cellular and molecular mechanisms linked to the development of diabetes complications. Review. Curr Diabetes Rev. 2021;17(4):457–473. doi:10.2174/1573399816666201103143818
9. Hu XF, Xiang G, Wang TJ, et al. Impairment of type H vessels by NOX2-mediated endothelial oxidative stress: critical mechanisms and therapeutic targets for bone fragility in streptozotocin-induced type 1 diabetic mice. Theranostics. 2021;11(8):3796–3812. doi:10.7150/thno.50907
10. Hu X-F, Wang L, Xiang G, Lei W, Feng Y-F. Angiogenesis impairment by the NADPH oxidase-triggered oxidative stress at the bone-implant interface: critical mechanisms and therapeutic targets for implant failure under hyperglycemic conditions in diabetes. Article. Acta Biomater. 2018;73:470–487. doi:10.1016/j.actbio.2018.04.008
11. Hu XF, Feng YF, Xiang G, Lei W, Wang L. Lactic acid of PLGA coating promotes angiogenesis on the interface between porous titanium and diabetic bone. J Mater Chem B. 2018;6(15):2274–2288. doi:10.1039/C7TB03247A
12. Wu Z, Hou Q, Chen T, et al. ROS-reactive PMS/PC drug delivery system improves new bone formation under diabetic conditions by promoting angiogenesis-osteogenesis coupling via down-regulating NOX2-ROS signalling axis. Biomaterials. 2022;291:121900. doi:10.1016/j.biomaterials.2022.121900
13. Hardeland R, Reiter R, Poeggeler B, Tan DX. The significance of the metabolism of the neurohormone melatonin: antioxidative protection and formation of bioactive substances. Neurosci Biobehav Rev. 1993;17(3):347–357.
14. Reiter RJ. Functional pleiotropy of the neurohormone melatonin: antioxidant protection and neuroendocrine regulation. Front Neuroendocrinol. 1995;16(4):383–415. doi:10.1006/frne.1995.1014
15. Shen S, Liao Q, Wong YK, et al. The role of melatonin in the treatment of type 2 diabetes mellitus and Alzheimer’s disease. Review. Int J Biol Sci. 2022;18(3):983–994. doi:10.7150/ijbs.66871
16. Bastani S, Akbarzadeh M, Rastgar Rezaei Y, et al. Melatonin as a therapeutic agent for the inhibition of hypoxia-induced tumor progression: a description of possible mechanisms involved. Review. Int J Mol Sci. 2021;22(19):10874. doi:10.3390/ijms221910874
17. Dehdashtian E, Mehrzadi S, Yousefi B, et al. Diabetic retinopathy pathogenesis and the ameliorating effects of melatonin; involvement of autophagy, inflammation and oxidative stress. Review. Life Sci. 2018;193:20–33. doi:10.1016/j.lfs.2017.12.001
18. Maity J, Dey T, Banerjee A, Chattopadhyay A, Das AR, Bandyopadhyay D. Melatonin ameliorates myocardial infarction in obese diabetic individuals: the possible involvement of macrophage apoptotic factors. Review. J Pineal Res. 2023;74(2). doi:10.1111/jpi.12847
19. Zhou R, Ma Y, Tao Z, et al. Melatonin inhibits glucose-induced apoptosis in osteoblastic cell line through PERK-eIF2 alpha-ATF4 Pathway. Article. Front Pharmacol. 2020:11602307. doi:10.3389/fphar.2020.602307
20. Ma H, Wang X, Zhang W, et al. Melatonin suppresses ferroptosis induced by high glucose via activation of the Nrf2/HO-1 signaling pathway in type 2 diabetic osteoporosis. Article. Oxid Med Cell Longev. 2020:20209067610. doi:10.1155/2020/9067610
21. Wang Z, Chen T, Wu Z, et al. The dual-effects of PLGA@MT electrospun nanofiber coatings on promoting osteogenesis at the titanium–bone interface under diabetic conditions. J Mater Chem B. 2022;10(21):4020–4030. doi:10.1039/D2TB00120A
22. de Almeida Chuffa LG, Ferreira Seiva FR, Novais AA, et al. Melatonin-loaded nanocarriers: new horizons for therapeutic applications. Review. Molecules. 2021;26(12):3562. doi:10.3390/molecules26123562
23. Elmowafy EM, Tiboni M, Soliman ME. Biocompatibility, biodegradation and biomedical applications of poly(lactic acid)/poly(lactic-co-glycolic acid) micro and nanoparticles. J Pharm Investig. 2019;49(4):347–380. doi:10.1007/s40005-019-00439-x
24. Altındal DÇ, Gümüşderelioğlu M. Melatonin releasing PLGA micro/nanoparticles and their effect on osteosarcoma cells. J Microencapsulation. 2016;33(1):53–63. doi:10.3109/02652048.2015.1115901
25. Brunello G, Sivolella S, Meneghello R, et al. Powder-based 3D printing for bone tissue engineering. Biotechnol Adv. 2016;34(5):740–753. doi:10.1016/j.biotechadv.2016.03.009
26. Wang X, Xu S, Zhou S, et al. Topological design and additive manufacturing of porous metals for bone scaffolds and orthopaedic implants: a review. Biomaterials. 2016;83:127–141. doi:10.1016/j.biomaterials.2016.01.012
27. Zamani Y, Amoabediny G, Mohammadi J, et al. 3D-printed poly (Ɛ-caprolactone) scaffold with gradient mechanical properties according to force distribution in the mandible for mandibular bone tissue engineering. J Mech Behav Biomed Mater. 2020;104:103638.
28. Zhang W, Wang N, Yang M, et al. Periosteum and development of the tissue-engineered periosteum for guided bone regeneration. J Orthopa Transl. 2022;33:41–54. doi:10.1016/j.jot.2022.01.002
29. Mota C, Puppi D, Chiellini F, Chiellini E. Additive manufacturing techniques for the production of tissue engineering constructs. J Tissue Eng Regen Med. 2015;9(3):174–190. doi:10.1002/term.1635
30. Kim YB, Lee H, Yang GH, et al. Mechanically reinforced cell-laden scaffolds formed using alginate-based bioink printed onto the surface of a PCL/alginate mesh structure for regeneration of hard tissue. J Colloid Interface Sci. 2016;461:359–368. doi:10.1016/j.jcis.2015.09.044
31. Lee JH, Park JK, Son KH, Lee JW. PCL/sodium-alginate based 3D-printed dual drug delivery system with antibacterial activity for osteomyelitis therapy. Gels. 2022;8(3):163. doi:10.3390/gels8030163
32. Park J, Lee SJ, Chung S, et al. Cell-laden 3D bioprinting hydrogel matrix depending on different compositions for soft tissue engineering: characterization and evaluation. Mater Sci Eng. 2017;71:678–684.
33. Reakasame S, Trapani D, Detsch R, Boccaccini AR. Cell laden alginate-keratin based composite microcapsules containing bioactive glass for tissue engineering applications. J Mater Sci. 2018;29:1–7. doi:10.1007/s10856-018-6195-5
34. Wei X, Luo Y, Huang P. 3D bioprinting of alginate scaffolds with controlled micropores by leaching of recrystallized salts. Polym Bull. 2019;76:6077–6088. doi:10.1007/s00289-019-02690-6
35. Osmokrovic A, Jancic I, Vunduk J, Petrovic P, Milenkovic M, Obradovic B. Achieving high antimicrobial activity: composite alginate hydrogel beads releasing activated charcoal with an immobilized active agent. Carbohydr Polym. 2018;196:279–288. doi:10.1016/j.carbpol.2018.05.045
36. Miao Y, Chen Y, Liu X, et al. Melatonin decorated 3D-printed beta-tricalcium phosphate scaffolds promoting bone regeneration in a rat calvarial defect model. J Mater Chem B. 2019;7(20):3250–3259. doi:10.1039/C8TB03361G
37. Tong X, Kono T, Anderson-Baucum EK, et al. SERCA2 deficiency impairs pancreatic β-cell function in response to diet-induced obesity. Diabetes. 2016;65(10):3039–3052. doi:10.2337/db16-0084
38. Topal B, Altındal DÇ, Gümüşderelioğlu M. Melatonin/HPβCD complex: microwave synthesis, integration with chitosan scaffolds and inhibitory effects on MG-63CELLS. Int J Pharm. 2015;496(2):801–811. doi:10.1016/j.ijpharm.2015.11.028
39. Khanal S, Adhikari U, Rijal N, Bhattarai S, Sankar J, Bhattarai N. pH-Responsive PLGA Nanoparticle for Controlled Payload Delivery of Diclofenac Sodium. J Funct Biomater. 2016;7. doi:10.3390/jfb7030021
40. Murphy CM, Haugh MG, O’Brien FJ. The effect of mean pore size on cell attachment, proliferation and migration in collagen–glycosaminoglycan scaffolds for bone tissue engineering. Biomaterials. 2010;31(3):461–466. doi:10.1016/j.biomaterials.2009.09.063
41. Bohner M, Santoni BLG, Döbelin N. β-tricalcium phosphate for bone substitution: synthesis and properties. Acta Biomater. 2020;113:23–41. doi:10.1016/j.actbio.2020.06.022
42. Fadaie M, Mirzaei E. Nanofibrillated chitosan/polycaprolactone bionanocomposite scaffold with improved tensile strength and cellular behavior. Nanomed J. 2018;5(2). doi:10.22038/NMJ.2018.005.004
43. Balu R, Kumar T, Ramalingam M, Ramakrishna S. Electrospun Polycaprolactone/Poly (1, 4-butylene adipate-co-polycaprolactam) blends: potential biodegradable scaffold for bone tissue regeneration. J Biomater Tissue Eng. 2011;1(1):30–39. doi:10.1166/jbt.2011.1004
44. Xidaki D, Agrafioti P, Diomatari D, et al. Synthesis of Hydroxyapatite, β-Tricalcium Phosphate and Biphasic Calcium Phosphate Particles to Act as Local Delivery Carriers of Curcumin: loading, Release and In Vitro Studies. Materials. 2018;11:595. doi:10.3390/ma11040595
45. Daemi H, Barikani M. Synthesis and characterization of calcium alginate nanoparticles, sodium homopolymannuronate salt and its calcium nanoparticles. Sci Iranica. 2012;19(6):2023–2028. doi:10.1016/J.SCIENT.2012.10.005
46. Juan PK, Fan FY, Lin WC, et al. Bioactivity and bone cell formation with poly-ε-caprolactone/bioceramic 3D porous scaffolds. Polymers. 2021;13(16):2718. doi:10.3390/polym13162718
47. Guo Z, Mo Z. Keap1-Nrf2 signaling pathway in angiogenesis and vascular diseases. J Tissue Eng Regen Med. 2020;14(6):869–883. doi:10.1002/term.3053
48. Suzuki M, Otsuki A, Keleku-Lukwete N, Yamamoto M. Overview of redox regulation by Keap1–Nrf2 system in toxicology and cancer. Curr Opin Toxicol. 2016;1:29–36. doi:10.1111/bph.16246
49. Parisi L, Ghezzi B, Bianchi MG, et al. Titanium dental implants hydrophilicity promotes preferential serum fibronectin over albumin competitive adsorption modulating early cell response. Mater Sci Eng. 2020;117:111307. doi:10.1016/j.msec.2020.111307
50. Wei X, Zhou W, Tang Z, et al. Magnesium surface-activated 3D printed porous PEEK scaffolds for in vivo osseointegration by promoting angiogenesis and osteogenesis. Bioact Mater. 2023;20:16–28. doi:10.1016/j.bioactmat.2022.05.011
51. Kligman S, Ren Z, Chung CH, et al. The Impact of Dental Implant Surface Modifications on Osseointegration and Biofilm Formation. J Clin Med. 2021;10(8). doi:10.3390/jcm10081641
52. Jiao X, Sun X, Li W, et al. 3D-Printed β-Tricalcium Phosphate Scaffolds Promote Osteogenic Differentiation of Bone Marrow-Deprived Mesenchymal Stem Cells in an N6-methyladenosine-Dependent Manner. Int J Bioprint. 2022;8(2):544. doi:10.18063/ijb.v8i2.544
53. Yildirimturk S, Batu S, Alatli C, Olgac V, Firat D, Sirin Y. The effects of supplemental melatonin administration on the healing of bone defects in streptozotocin-induced diabetic rats. J Appl Oral Sci. 2016;24:239–249. doi:10.1590/1678-775720150570
54. Tysoe O. Melatonin prevents diabetes mellitus-induced bone loss. Nat Rev Endocrinol. 2021;17(12):707. doi:10.1038/s41574-021-00581-3
55. Li Y, Liu Y, Liu S, et al. Diabetic vascular diseases: molecular mechanisms and therapeutic strategies. Signal Transduct Target Ther. 2023;8(1):152. doi:10.1038/s41392-023-01400-z
56. Sun TC, Liu XC, Yang SH, et al. Melatonin inhibits oxidative stress and apoptosis in cryopreserved ovarian tissues via Nrf2/HO-1 signaling pathway. Front Mol Biosci. 2020;7:163. doi:10.3389/fmolb.2020.00163
57. Shi S, Lei S, Tang C, Wang K, Xia Z. Melatonin attenuates acute kidney ischemia/reperfusion injury in diabetic rats by activation of the SIRT1/Nrf2/HO-1 signaling pathway. Article. Biosci Rep. 2019;39Bsr20181614. doi:10.1042/bsr20181614
58. Kasai S, Shimizu S, Tatara Y, Mimura J, Itoh K. Regulation of Nrf2 by Mitochondrial Reactive Oxygen Species in Physiology and Pathology. Biomolecules. 2020;10(2). doi:10.3390/biom10020320
59. Zhou S, Ye W, Zhang M. The effects of nrf2 on tumor angiogenesis: a review of the possible mechanisms of action. Crit Rev Eukaryot Gene Expres. 2012;22(2). doi:10.1615/critreveukargeneexpr.v22.i2.60
 © 2024 The Author(s). This work is published and licensed by Dove Medical Press Limited. The full terms of this license are available at https://www.dovepress.com/terms.php and incorporate the Creative Commons Attribution - Non Commercial (unported, v3.0) License.
By accessing the work you hereby accept the Terms. Non-commercial uses of the work are permitted without any further permission from Dove Medical Press Limited, provided the work is properly attributed. For permission for commercial use of this work, please see paragraphs 4.2 and 5 of our Terms.
© 2024 The Author(s). This work is published and licensed by Dove Medical Press Limited. The full terms of this license are available at https://www.dovepress.com/terms.php and incorporate the Creative Commons Attribution - Non Commercial (unported, v3.0) License.
By accessing the work you hereby accept the Terms. Non-commercial uses of the work are permitted without any further permission from Dove Medical Press Limited, provided the work is properly attributed. For permission for commercial use of this work, please see paragraphs 4.2 and 5 of our Terms.