")
Back to Journals » ClinicoEconomics and Outcomes Research » Volume 9
The cost of successful antiviral therapy in hepatitis C patients: a comparison of IFN-free versus IFN-based regimens at an individual patient level in Australia
Authors Lee AS, van Driel ML , Crawford DHG
Received 13 July 2017
Accepted for publication 4 September 2017
Published 3 October 2017 Volume 2017:9 Pages 595—607
DOI https://doi.org/10.2147/CEOR.S146280
Checked for plagiarism Yes
Review by Single anonymous peer review
Peer reviewer comments 2
Editor who approved publication: Professor Giorgio Colombo
Allister Sebastian Lee,1 Mieke L van Driel,2 Darrell HG Crawford3,4
1Faculty of Medicine, 2Primary Care Clinical Unit, Faculty of Medicine, 3School of Clinical Medicine, Faculty of Medicine, University of Queensland, 4Gallipoli Medical Research Foundation, Greenslopes Private Hospital, Brisbane, Australia
Background: Chronic hepatitis C remains a major global health burden with serious long-term consequences if left untreated. Recently the treatment standard of care has shifted to new interferon (IFN)-free drug regimens, which have been shown to be safe and effective. The aim of our study was to assess and compare medical resource utilization and costs of successfully treating patients with IFN-based and IFN-free therapies in Australia.
Methods: We performed a retrospective chart review of 30 HCV-infected patients successfully treated with IFN-based therapy between 2013 and 2015. We also generated a model for a virtual group of 100 genotype 1 (GT1) and 100 genotype 3 (GT3) patients treated with IFN-free therapy derived from national guidelines and clinical trial data.
Results: In comparison to virtual patients receiving IFN-free therapy, our IFN-treated patients on average had distinctively more liver clinic visits and blood tests. However, mean total cost per patient was $19,164 and $85,300 (AUD) more for GT1 and GT3 patients receiving IFN-free therapy, respectively. This difference was largely accounted for by higher antiviral drug costs. Of our 30 patients treated with IFN, total mean cost per patient during the study period was $33,595.
Conclusion: Resource utilization is lower with IFN-free treatment, which reflects the reduced need for patient monitoring and improved side-effect profile of these new drugs. However, total costs are still largely dominated by antiviral drug costs, representing a huge burden on national budgets. Our insight into resource utilization and costs associated with both types of treatment can serve as a reference for future studies.
Keywords: antiviral treatment, chronic hepatitis C, comparison, costs, real-life setting, resource utilization
Introduction
Chronic hepatitis C (CHC) affects approximately 130–150 million people worldwide with an estimated 234,000 infected individuals in Australia.1,2 This represents a huge burden of disease of national and global significance. Transmission of disease is predominantly by unsafe injection practices and needle-stick injuries in health care settings.1 With long-term complications including the development of liver cirrhosis and hepatocellular carcinoma, CHC remains the most common cause for liver transplantations.3
The recent development of new direct-acting antivirals (DAAs) has revolutionized CHC treatment and made interferon (IFN)-free therapy a reality. With sustained virological response (SVR) rates surpassing 90% for most genotypes, shorter treatment duration, and substantially improved side-effect profiles; current guidelines recommend using these drugs if available.4–7 Unfortunately, the substantial costs of these novel drugs mean that they are not universally accessible. Even in countries where IFN-free therapy is now subsidized, these high costs have a huge impact on national budgets.8 Fortunately, differential pricing and voluntary licensing agreements have increased treatment accessibility in poorer areas.8 Nonetheless, widespread access to new therapy is unrealistic until drug prices become more affordable.
Many studies have evaluated the cost-effectiveness of different types of CHC therapy using computer-generated models.9–11 IFN-free regimens have been demonstrated to be cost-effective compared to IFN-based therapy in some cases.12 However, these studies use data from clinical trials and therefore are not necessarily representative of real-life care. In addition, the thresholds for cost-effectiveness vary for different countries, and therefore may not be generalizable to a global population.
Information on treatment-related costs and medical resource utilization (MRU) based on real-life data is scarce. Several cohort studies performed in Germany and North America have looked at costs and MRU associated with dual and triple IFN-based therapy in routine clinical care.13–16
The aim of the current study is to evaluate and compare the relative costs and MRU of successful IFN-free therapy and IFN-based therapy at an individual patient level. MRU and costs associated with successfully treating real-life patients with IFN-based therapy will be compared to the hypothetical MRU and costs of successful IFN-free therapy. Our data could then be used in future studies and comparisons of hepatitis C treatment.
Materials and methods
Study design overview
A retrospective review was performed to investigate MRU, associated costs, and adverse events (AEs) for 30 patients with CHC who were successfully treated with IFN-based therapy. These were compared to the predicted MRU and costs of the hypothetical patients on IFN-free treatment, modeled on national guidelines and clinical trial data.17–19
Patient population and sample selection
Clinical data for 30 consecutive CHC patients treated at Greenslopes Liver Clinic in Brisbane, Australia, were included in the study. Patients for inclusion were 18 years of age or older diagnosed with CHC and treated with IFN-based therapy between 2013 and 2016. Patients must have completed a minimum of 20 weeks of therapy and achieved a SVR 24 weeks after treatment in order to be eligible. No other eligibility criteria were applied.
Ethics approval to conduct the study was obtained from the Greenslopes Research and Ethics Committee. All data were de-identified and stored in secure-password protected servers. De-identification occurred through removal of all patient identifiers during data collection.
Data collection
Information was collected from patient medical records. Approval was obtained from the Greenslopes Hospital Research and Ethics Committee. All data were de-identified through removal of patient identifiers during collection and stored in secure-password protected servers. Patient consent was waivered in accordance with the Australian National Health and Medical Research Council statement on ethical conduct in human research. Data collected included patient and treatment parameters, AEs, and MRU. AEs were evaluated as per documentation by the treating physician or reports of investigative tests. MRU was assessed in the period from the start of treatment (Day 0) to the day of final discharge from the liver clinic. The categories of MRU included the following:
- Investigative tests (e.g., blood tests, imaging)
- Liver clinic visits
- Outpatient procedures
- Emergency room (ER) visits
- Hospitalizations
- Referrals to other specialties
All costs represent costs to the government and were calculated by multiplying the number of resource items (as determined through reviewing clinical records) with unit costs retrieved from national government reimbursement schemes. Treatment duration and associated costs were determined for each patient individually, and subsequently used to calculate mean values. Similarly, mean costs of resource items and mean total costs were determined using individual calculated costs for each patient. Prices for 2016 were used to better reflect current treatment-related costs. All costs were expressed in Australian dollars (AUD). Costs for prescribed medications were derived from the Pharmaceutical Benefits Scheme (PBS) and medical resource costs were derived from the Medicare Benefits Schedule.20,21
Comparison to IFN-free treatment
A model for the hypothetical journey of 100 genotype 1 (GT1) and 100 genotype 3 (GT3) HCV-infected patients on IFN-free therapy was developed in order to compare MRU and costs to our GT1 and GT3 patients treated with IFN-based therapy. A population size of 100 was chosen to facilitate data analysis. GT1 patients were treated with sofosbuvir and ledipasvir, and GT3 patients were treated with sofosbuvir and daclatasvir. These treatment combinations were selected due to their listing on the PBS and national treatment guidelines.20,21 Clinic visits and investigations required for baseline monitoring were derived from the 2017 Australian consensus statement on hepatitis C management.17 AE rates were retrieved from the ION-1 and ALLY-3 phase 3 clinical trials for GT1 and GT3 patients, respectively.18,19 Additional resource utilization and costs were estimated for serious AEs using clinical guidelines. Common AEs (e.g., headache, nausea) were assumed to incur no additional costs. No dose reductions or treatment discontinuations were required in both IFN-free groups, based on clinical trial data.18,19 Therefore, normal doses and treatment durations were applied to each patient, retrieved from the national guidelines.20,21
Data for our 17 GT1 patients and 10 GT3 patients who received IFN-based therapy were modified so that MRU and costs associated with non-treatment-related events were excluded. AEs experienced by our patients were compared to the known treatment-related AEs. Associated MRU and costs for investigating or treating the AE were removed from the data set if deemed unlikely to be treatment-related by all authors in consensus.
Results
Patient characteristics
Baseline characteristics and conditions of the 30 patients treated for chronic HCV are outlined in Table 1. The most common patient comorbidities were diabetes mellitus (16.7%), hypertension (13.3%), and chronic kidney disease (6.7%). Only one patient (3.3%) was co-infected with chronic HBV and no patients were co-infected with HIV. One-third of patients had a psychiatric history (e.g., depression). Five patients (16.7%) were listed as having cirrhosis by a medical practitioner in the clinical records. The majority of patients were treatment-naïve with 16.7% of patients having received prior HCV treatment. The most common genotypes observed were GT1 (56.7%) and GT3 (33.33%), with GT2 (3.3%) and GT6 (6.7%) being uncommon.
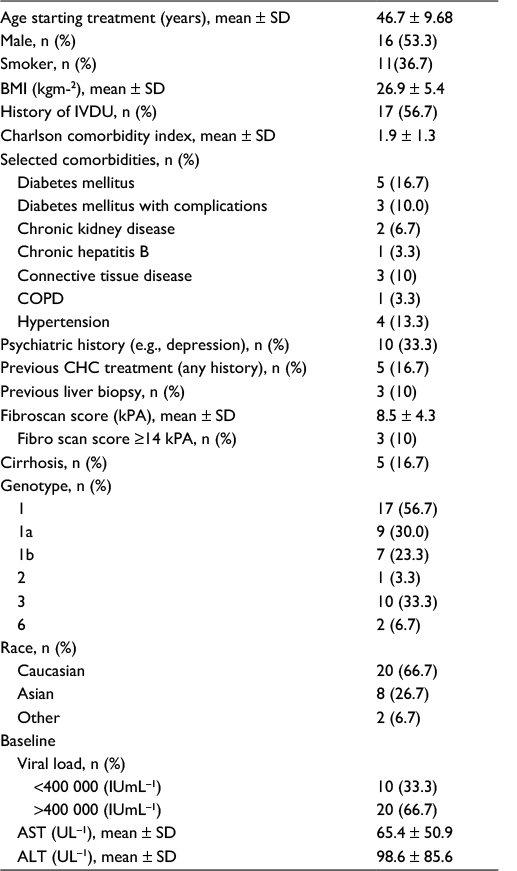 | Table 1 Baseline characteristics and conditions Abbreviations: ALT, alanine transaminase; AST, aspartate transaminase; BMI, body mass index; CHC, chronic hepatitis C; COPD, chronic obstructive pulmonary disease; IVDU, intravenous drug use; SD, standard deviation. |
Treatment characteristics
Treatment characteristics for all patients and separately for GT1 and GT3 patients are summarized in Table 2. All subjects achieved a SVR at 24 weeks post-treatment as per our inclusion criteria. Most patients were treated with either peg-IFN/RBV alone (46.7%) or peg-IFN/RBV with telaprevir (36.7%).
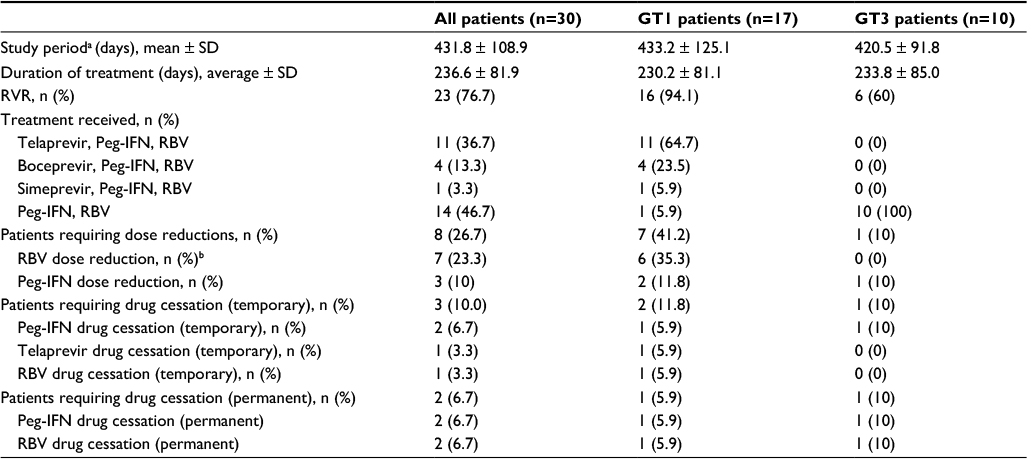 | Table 2 Treatment characteristics Notes: aStudy period defined as from first day of treatment to clinic discharge. bRBV dose reduction was required for one GT6 patient. Abbreviations: Peg-IFN, pegylated-interferon; RBV, ribavirin; RVR, rapid virological response rate (undetectable serum HCV RNA level at week 4 of treatment); SD, standard deviation. |
Approximately one quarter of patients required a dose reduction of at least one drug, with the most common being ribavirin (23.3%). The most common indication was ribavirin-associated hemolytic anemia. Two (6.7%) patients required permanent treatment cessation due to serious AEs requiring hospital admission.
Medical resource utilization
MRU and estimated costs are outlined in Table 3. Blood tests were the most ordered resource item, with a mean of 16.53 blood tests per patient. Ultrasound was the most common imaging investigation (0.93 per patient). Most other resource items were uncommon and only performed for a single patient. Only three surgical procedures were performed during the study period. These included a rib sequestrum resection for osteomyelitis, glass extraction under general anesthetic, and laparoscopic cholecystectomy. Only osteomyelitis was thought to be possibly treatment related.
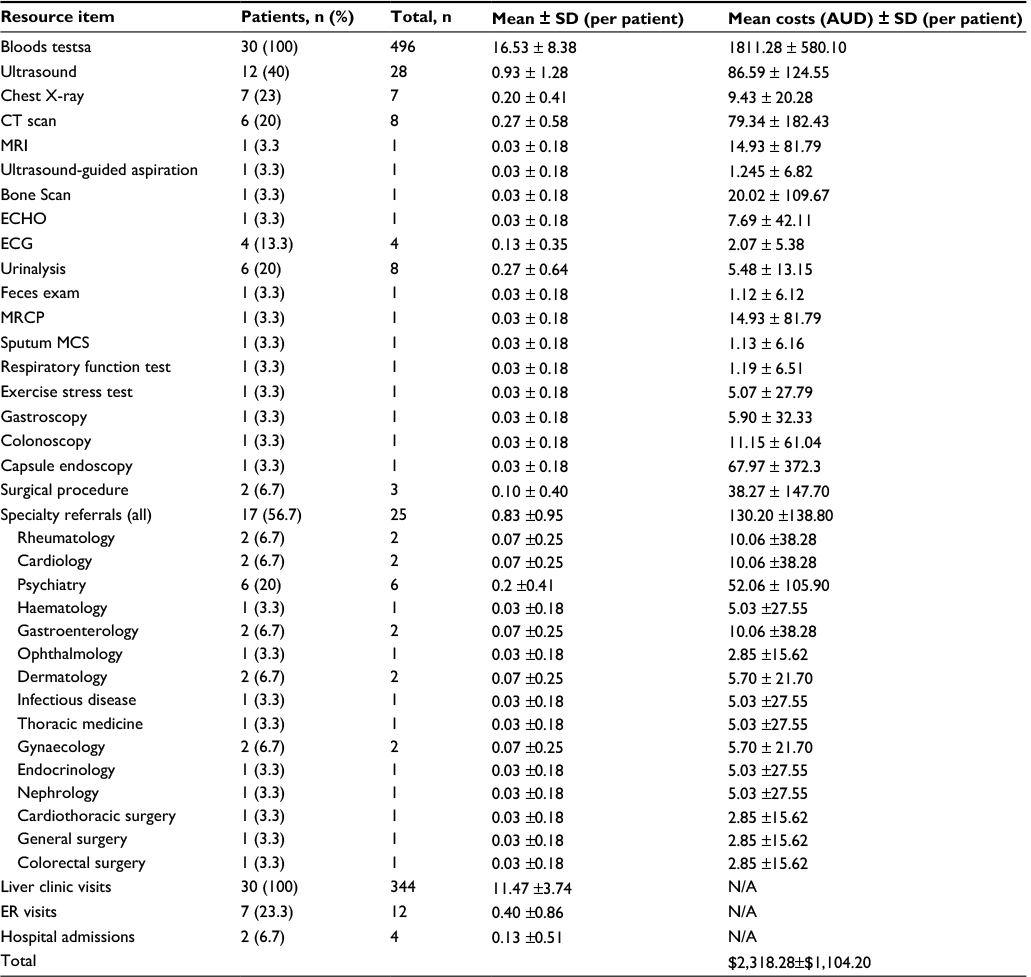 | Table 3 Medical resource utilization and costs Note: aBlood test costs per patient equal the sum of all individual item costs (e.g., full blood count, C-reactive protein). Abbreviations: AUD, Australian dollars; CT, computed tomography; ECG, electrocardiogram; ECHO, echocardiogram; ER, emergency room; MCS, microscopy, culture and sensitivity; MRCP, magnetic resonance cholangiopancreatography; MRI, magnetic resonance imaging; N/A, not applicable; SD, standard deviation. |
The mean number of liver clinic visits per patient was 11.47. Seven patients had at least one ER presentation with a mean of 0.40 per patient. Reasons for ER visits are listed in the Supplementary material. Two patients required hospital admission during treatment (mean of 0.13 per patient) for reasons stated previously. In all, 56.7% of patients had a minimum of one specialty referral, with a mean of 0.83 specialty referrals per patient. Referral numbers were highest for psychiatry (20%). The most common reason for psychiatric referral was for the management of treatment-related mood disturbance. All other specialties had a maximum of only two patient referrals in total.
Costs
The mean cost of resource items per patient (excluding visits to the liver clinic, ER or hospital admissions) was $2,318.28 (± $1,104.20). Blood tests represented the greatest component of total costs ($1,811.28 per patient). Mean cost for each other resource items was markedly lower, falling below $100 per patient.
In regards to specialty referrals, calculated costs were only for the initial specialist consultation due to limited data on subsequent visits in the medical records. The mean cost for all specialty referrals was $130.20 per patient. Mean antiviral drug costs for all patients was $31,277 (± 19,581), with a range of $8,992–$69,265. Higher costs were associated with triple therapy and longer treatment durations. The overall mean cost per patient in the study period was $33,595 (± $19,981), with a range of $10,110–$70,695.
Theoretical model for patient on IFN-free treatment
Table 4 shows demographic and treatment characteristics for our theoretical and real-life GT1/3 patients on IFN-free and IFN-based therapy, respectively. Rates of cirrhosis in both groups were similar. The mean duration of treatment was around 20 weeks longer in the IFN group for both genotypes.
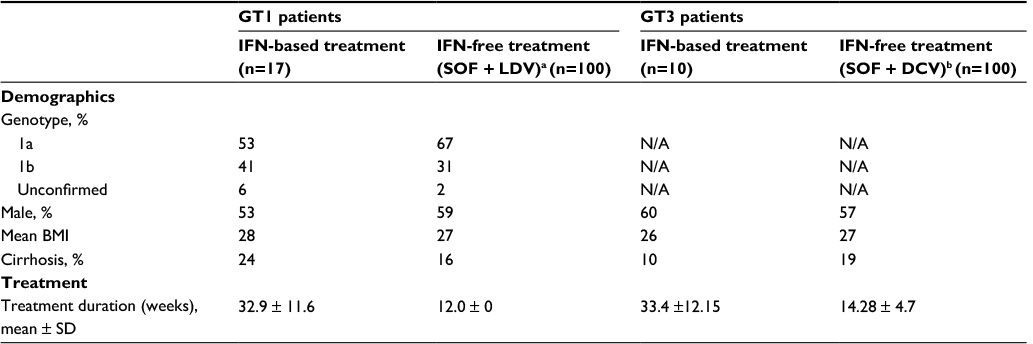 | Table 4 Comparison of demographic and treatment characteristics Notes: aDerived from ION-I trial (Afdhal et al18). bDerived from ALLY-3 trial (Nelson et al19). Abbreviations: BMI, body mass index; DCV, daclatasvir; GT1, genotype 1; GT3, genotype 3; IFN, interferon; LDV, ledipasvir; N/A, not applicable; SD, standard deviation; SOF, sofosbuvir. |
Comparison of AEs for both groups can be found in the Supplementary material. The most common AEs associated with both sofosbuvir/ledipasvir and sofosbuvir/daclatasvir were headache, fatigue, diarrhea, and nausea. Higher rates of the same AEs were observed in the IFN groups. Table 5 compares MRU and costs between both groups.
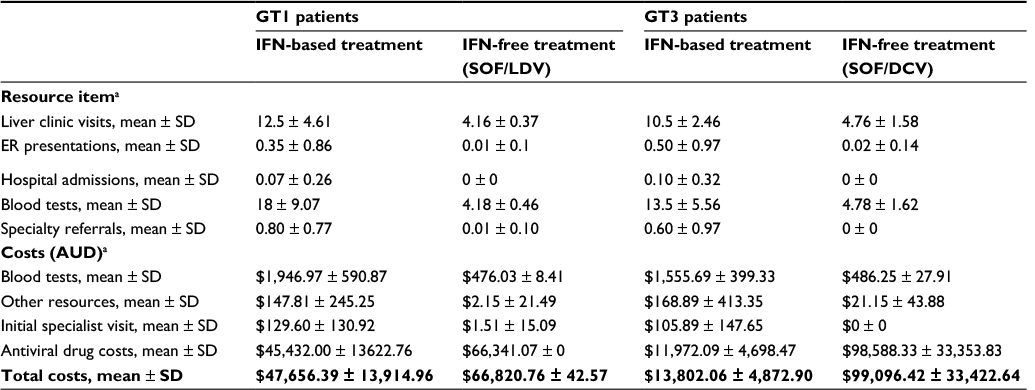 | Table 5 Comparison of medical resource utilization and costs Note: aPer patient. Abbreviations: AUD, Australian dollars; DCV, daclatasvir; ER, emergency room; GT1, genotype 1; GT3, genotype 3; IFN, interferon; LDV, ledipasvir; SD, standard deviation; SOF, sofosbuvir. |
GT1 patients
On an average, patients receiving IFN had 8.34 more liver clinic visits, 0.34 more ER presentations, and 0.07 more hospitalizations than patients on IFN-free therapy. For the IFN-free group, no hospital admissions were predicted and only one ER presentation was expected for chest pain.
Patients on IFN-based therapy had 13.82 blood tests, representing a mean cost difference of $1,470.94 per patient. Mean cost difference for other resource items was $145.66. Only one treatment specialty referral (cardiology) was predicted for the IFN-free group. Mean cost difference for an initial specialist consultation was $128.09.
Mean antiviral drug costs was $20,909.07 more per patient receiving IFN-free therapy. Overall, mean total cost per patient (excluding costs for liver clinic visits, ER presentations, and hospitalization) was $19,164.37 more in the IFN-free group. However, excluding antiviral drug costs, mean cost per patient was $1744.7 more for patients receiving IFN.
GT3 patients
Patients on IFN-based therapy for GT3 on an average attended the liver clinic 5.74 more times. Mean ER presentations and hospitalizations were 0.48 and 0.1 more, respectively, for this group. For patients receiving IFN-free therapy, no hospital admissions and two ER presentations were predicted (for food poisoning and vomiting).
Patients receiving IFN had 8.72 more bloods tests, representing a mean cost difference of $1,069.44. Mean cost difference for other resource items was $147.74. No specialty referrals were predicted for the IFN-free group. Mean cost difference per patient for an initial specialist consultation was therefore $105.89.
Mean antiviral drug therapy cost was $86,616.24 more for patients treated with IFN-free therapy. Mean total cost per patient was $85,294.36 higher in the IFN-free group. However, excluding antiviral drug costs, mean cost per patient was $1321.88 higher for patients treated with IFN-based therapy.
Discussion
The present study determined MRU and associated costs for successfully treating HCV-infected patients with IFN-based regimens in a real-world setting compared to IFN-free drug regimens based on current literature.
The mean total cost per patient treated with IFN-based therapy in the study period was approximately $33,595. The mean antiviral drug cost was $31,277, approximately 93% of total costs. Blood tests were the most common resource item and represented around 78% of non-drug costs. The contribution of other resource items was significantly less. On an average, each patient in our clinic sample visited the liver clinic nearly 12 times. Hospital admissions and ER visits were uncommon.
For GT1 patients, we found that the total cost per patient was $19,164 less for patients treated with IFN-based therapy ($47,656 per patient) compared to our theoretical patients receiving sofosbuvir/ledipasvir ($66,821 per patient). Total cost per patient was $85,294 less for GT3 patients receiving IFN-based therapy ($13,802 per patient) than those receiving sofosbuvir/daclatasvir ($99,096 per patient). These differences are due to the considerably higher drug costs of the IFN-free treatments. The difference is less striking for GT1 patients as first-generation DAAs (telaprevir and boceprevir) are still expensive. For both genotypes and treatment categories, blood tests constitute the majority of total resource costs. Excluding antiviral drug costs, total cost per patient was $1,745 and $1,322 greater for GT1 and GT3 patients treated with IFN, respectively. MRU was generally reduced in the IFN-free groups, with particularly fewer liver clinic visits and blood tests. However, the differences in hospitalizations and ER presentations were small. For both IFN-free groups, antiviral drug costs represented over 99% of total treatment costs. This percentage dropped to 95% and 87% for GT1 and GT3 patients receiving IFN, respectively. Therefore, drug costs still constitute the majority of overall treatment costs with IFN-based therapy. Even without removing non-treatment-related MRU and costs for our comparison, we predict a similar result.
There are several limitations to our study. Our SVR rate of 100% does not reflect SVR rates in clinical trials, particularly for IFN-based treatment, which are approximately ~80% for non-cirrhotic GT3 patients and ~70–80% for GT1 patients receiving triple therapy.22–24 For IFN-free therapy, reported SVR rates (of our chosen regimens) are closer to 100%.18,19 In addition, there are no treatment discontinuations or modifications due to AEs in the ION-1 or ALLY-3 trials.18,19 Therefore, we believe that developing our model with 100% SVR and no treatment adjustments would not likely confound our results. Another limitation is that our study period was relatively short. Therefore, long-term benefits (e.g., reduced need for liver transplantation) due to superior SVR rates with IFN-free therapy are not accounted for. We emphasize that our aim was to compare the relative costs of success of antiviral therapy for two different treatment regimens at an individual level, rather than at a population level. Our data could subsequently be extrapolated in larger studies (with longer study periods) and used to model costs of treating entire patient cohorts in which there would be non-responders.
We also acknowledge that despite our small sample size, our patients can still provide important insight into costs associated with antiviral therapy at an individual patient level. In addition, rates of cirrhosis and body mass index were similar between our real and hypothetical groups. This is important for our comparison, as drug choice and treatment duration are predominantly determined by the presence of cirrhosis (and patient genotype) for both IFN-based and IFN-free therapy.
In this retrospective study, costs of ER care, inpatient hospital care, specialist visits (other than the initial consultation), general practitioner visits, and medications to treat AEs were not included in the overall cost analysis for several reasons. Firstly, there was either insufficient or missing information in the clinical records regarding details of these, as care may have been provided at a different institution (e.g., inpatient hospital care, prescribed medications). In addition, the “Medicare Benefits Schedule”, from which resource costs were retrieved, did not demonstrate clear costs for a number of these items.21 The absence of this data is a limitation of the current study and it is likely that the cost difference between the treatments is slightly less than we have shown. Similarly, in our model of patients treated with IFN-free therapy, a major assumption was that real-life MRU and AE rates would closely follow national guidelines and clinical trial data. We also assumed that common AEs (e.g., headache) would not lead to any additional clinical care, which may underestimate resource costs. However, a recent study by Younossi et al assessing real-world outcomes with sofosbuvir/ledipasvir suggests that AE rates are similar in real-life practice when compared to clinical trial studies and are not associated with excess costs.25 Therefore, a major strength of our study is that our comparison is applicable to real-life care, giving insight into the differences in MRU and costs associated with successfully treating a patient with both types of treatment.
The distribution of genotypes of IFN-treated patients in our study was also similar to that cited in a recent global epidemiological study by Messina et al.26 For example 56.7% of our patients were GT1 compared to an estimated 54.23% of all HCV-infected Australian individuals. Therefore, our patient sample is likely to be representative of the national population.
No studies to date have compared MRU and costs for patients treated with IFN-based and IFN-free therapy using real-life data. Therefore, we are unable to compare our findings to other literature. Conclusions from cost-effectiveness studies are difficult to apply globally due to the varying willingness-to-pay thresholds and resource item costs in different countries. In addition, most of these studies generate models based on solely clinical trial data and therefore may not reflect real-life care.
Regarding the results of our chart review, numerous studies in other countries have demonstrated similar findings, with antiviral drugs accounting for the majority of treatment costs.13,15,27–29 However, they estimate that antiviral costs would amount to around 75–85% of total costs, which is lower than our calculation of 92%. There are several reasons for this discrepancy, the most obvious being the likely underestimation of MRU and costs in our study that we described previously. Other contributing factors could include differences in patient populations, study period durations, and resource item costs.
In summary, we found that IFN-free therapy was associated with reduced MRU and resource costs. However, treatment drug costs are still the dominating factor. We acknowledge that other factors such as quality of life were not assessed, but remain important considerations. For example, reduced AEs, blood tests, and liver clinic visits could result in higher patient satisfaction with IFN-free therapy. MRU and costs would also vary with characteristics of the individual patient. For example, older patients with multiple comorbidities would require closer monitoring and usually more frequent laboratory testing. As our study focused more on treatment-related costs, future models should take these factors into account. We also recognize that this is not a cost-effectiveness study. However, we have provided one of the first comparisons of expected real-life MRU and costs of treating patients with the previous and current treatment standard of care. As cost analyses are specific to individual health care systems, they could be performed in other countries using our study design.
The minimal need for monitoring and low MRU associated with IFN-free therapy could have implications for future clinical practice. For example, primary delivery of care could shift from a specialist to generalist setting, which is potentially more economical.30 Nonetheless, the high costs of these new antiviral drugs clearly represent a huge financial burden on government budgets and therefore also a large barrier to worldwide access to treatment. Pharmaceutical companies are addressing this issue through differential pricing. Future analysis of real-life data of patients treated with IFN-free therapy would lead to a more robust comparison between both groups and therefore stronger conclusions regarding differences in MRU and costs. Future larger studies will be able to utilize and model our data for determining or comparing costs of treating patient cohorts. This is ultimately important to health policy makers, particularly in developing countries, for more efficient allocation of scare government resources. Real-life data on IFN-free treatment will become available overtime as these new antivirals remain longer in the market and become more accessible worldwide.
Acknowledgment
The authors wish to thank the staff of the Gallipoli Medical Research Foundation for their valuable assistance in the conduct of this work.
Disclosure
The authors report no conflicts of interest in this work.
References
WHO. Fact sheet on Hepatitis C. 2015 [updated 2015; cited 2016 June 22]. Available from: www.who.int/mediacentre/factsheets/fs164/en/. Accessed June 22, 2016. | ||
Razavi H, Waked I, Sarrazin C, et al. The present and future disease burden of hepatitis C virus (HCV) infection with today’s treatment paradigm. J Viral Hepat. 2014;21(Suppl 1):34–59. | ||
Younossi ZM, Otgonsuren M, Henry L, et al. Inpatient resource utilization, disease severity, mortality and insurance coverage for patients hospitalized for hepatitis C virus in the United States. J Viral Hepat. 2015;22(2):137–145. | ||
Gentile I, Buonomo AR, Zappulo E, Borgia G. Interferon-free therapies for chronic hepatitis C: toward a hepatitis C virus-free world? Expert Rev Anti Infect Ther. 2014;12(7):763–773. | ||
European Association for Study of Liver. EASL Recommendations on Treatment of Hepatitis C 2015. J Hepatol. 2015;63(1):199–236. | ||
American Association for the Study of Liver Disease. Recommendations for testing, managing, and treating hepatitis C. 2016 [updated 2016; cited]. Available from: http://www.hcvguidelines.org. Accessed August 10, 2016. | ||
Myers RP, Shah H, Burak KW, Cooper C, Feld JJ. An update on the management of chronic hepatitis C: 2015 Consensus guidelines from the Canadian Association for the Study of the Liver. Can J Gastroenterol Hepatol. 2015;29(1):19–34. | ||
Iyengar S, Tay-Teo K, Vogler S, et al. Prices, costs, and affordability of new medicines for hepatitis C in 30 countries: an economic analysis. PLoS Med. 2016;13(5):e1002032. | ||
Zhang S, Bastian ND, Griffin PM. Cost-effectiveness of sofosbuvir-based treatments for chronic hepatitis C in the US. BMC Gastroenterol. 2015;15:98. | ||
Saab S, Parise H, Virabhak S, et al. Cost-effectiveness of currently recommended direct-acting antiviral treatments in patients infected with genotypes 1 or 4 hepatitis C virus in the US. J Med Econ. 2016;19(8):795–805. | ||
Chhatwal J, Kanwal F, Roberts MS, Dunn MA. Cost-effectiveness and budget impact of hepatitis C virus treatment with sofosbuvir and ledipasvir in the United States. Ann Intern Med. 2015;162(6):397–406. | ||
Wong W, Krahn M, Lee K, Singh S; CADTH Therapeutic Reviews. Drugs for chronic hepatitis C infection: cost-effectiveness analysis. Ottawa, ON: Canadian Agency for Drugs and Technologies in Health; 2016. | ||
Stahmeyer JT, Krauth C, Bert F, et al. Costs and outcomes of treating chronic hepatitis C patients in routine care – results from a nationwide multicenter trial. J Viral Hepat. 2016;23(2):105–115. | ||
Stahmeyer JT, Rossol S, Krauth C. Outcomes, costs and cost-effectiveness of treating hepatitis C with direct acting antivirals. J Comp Eff Res. Epub 2015 May 11. | ||
Le TK, Kalsekar A, Macaulay D, et al. Treatment patterns, health care resource utilization, and costs in U.S. patients diagnosed with chronic hepatitis C infection who received telaprevir or boceprevir. J Manag Care Spec Pharm. 2015;21(4):308–318. | ||
Nyberg L, Chiang K, Li Z, Nyberg A, Younossi Z, Cheetham T. Su1047 resource utilization during hepatitis C treatment with boceprevir or telaprevir-based triple therapy vs dual therapy in a large health maintenance organization. Gastroenterology. 2014;146(5 Suppl 1):S–973. | ||
Australian Society for Infectious Diseases. Australian recommendations for the management of hepatitis C virus infection: a consensus statement 2016. 2016 [updated 2016; cited 2016]. Available from: www.asid.net.au/documents/item/1208. Accessed January 30, 2017. | ||
Afdhal N, Zeuzem S, Kwo P, et al; ION-1 Investigators. Ledipasvir and sofosbuvir for untreated HCV genotype 1 infection. N Engl J Med. 2014;370(20):1889–1898. | ||
Nelson DR, Cooper JN, Lalezari JP, et al; ALLY-3 Study Team. All-oral 12-week treatment with daclatasvir plus sofosbuvir in patients with genotype 3 infection: ALLY-3 phase III study. Hepatology. 2015;61(4):1127–1135. | ||
Australian Government Department of Health. The Pharmaceutical Benefits Schedule. Australia. 2016 [updated 2016; cited 2016]. Available from: www.pbs.gov.au. Accessed November 12, 2016. | ||
Australian Government Department of Health. The Medicare Benefits Schedule. Australia. 2016 [updated 2016; cited]. Available from: http://www.health.gov.au/. Accessed November 12, 2016. | ||
Jacobson IM, McHutchison JG, Dusheiko G, et al; ADVANCE Study Team. Telaprevir for previously untreated chronic hepatitis C virus infection. N Engl J Med. 2011;364(25):2405–2416. | ||
Poordad F, McCone J Jr, Bacon BR, et al; SPRINT-2 Investigators. Boceprevir for untreated chronic HCV genotype 1 infection. N Engl J Med. 2011;364(13):1195–1206. | ||
Manns MP, McHutchison JG, Gordon SC, et al. Peginterferon alfa-2b plus ribavirin compared with interferon alfa-2b plus ribavirin for initial treatment of chronic hepatitis C: a randomised trial. Lancet. 2001;358(9286):958–965. | ||
Younossi ZM, Park H, Gordon SC, et al. Real-world outcomes of ledipasvir/sofosbuvir in treatment-naive patients with hepatitis C. Am J Manag Care. 2016;22(6 Spec No.):SP205–SP211. | ||
Messina JP, Humphreys L, Flaxman A, et al. Global distribution and prevalence of hepatitis C virus genotypes. Hepatology. 2015;61(1):77–87. | ||
Sapra S, Chang E, Broder MS, L’Italien G. Incidence and cost of treatment-emergent comorbid events in insured patients with chronic hepatitis C virus infection: a retrospective cohort study. BMC Health Serv Res. 2014;14:429. | ||
Solomon M, Bonafede M, Pan K, et al. Direct medical care costs among pegylated interferon plus ribavirin-treated and untreated chronic hepatitis C patients. Dig Dis Sci. 2011;56(10):3024–3031. | ||
Jonk YC, Adeniyi T, Knott A, Dieperink EW, Ho SB. Interferon-based therapies for hepatitis C: utilization, costs, and outcomes. Am J Pharm Benefits. 2013;5(1):25–33. | ||
Arora S, Thornton K, Murata G, et al. Outcomes of treatment for hepatitis C virus infection by primary care providers. N Engl J Med. 2011;364(23):2199–2207. |
Supplementary Materials
 | Table S1 Adverse events for patients receiving IFN-based therapy (n=30) Note: aPercentage of total number of patients who experienced the adverse event. Abbreviations: Hb, hemoglobin; IFN, interferon. |
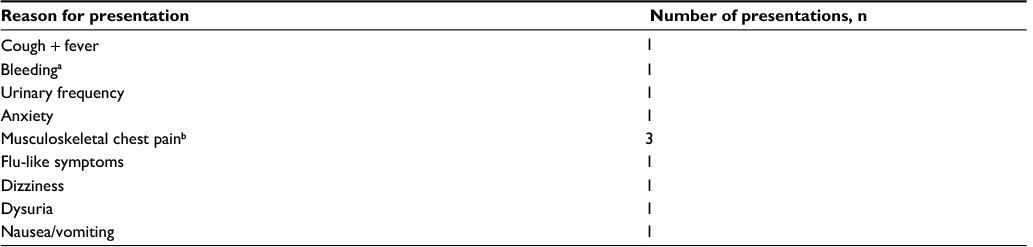 | Table S2 Emergency department presentations for patients treated with IFN-based therapy (n=30) Abbreviation: IFN, interferon. Notes: aEpistaxis and mucosal bleeding, secondary to severe thrombocytopenia. bRelated to chronic rib osteomyelitis. |
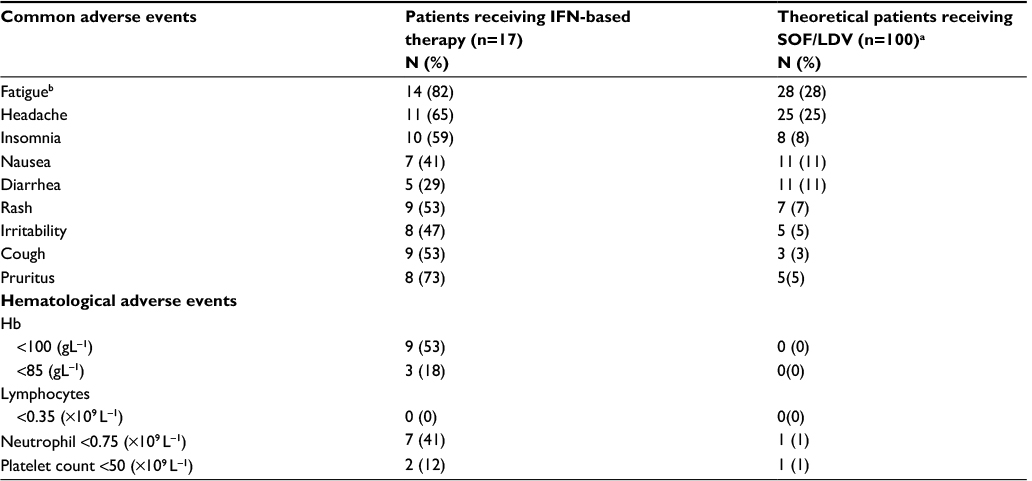 | Table S3 Adverse events for GT1 patients Notes: aDerived from ION-1 trial (Afdhal et al1). bTo facilitate comparison, cases of “asthenia” were included under fatigue. Abbreviations: GT1, genotype 1; Hb, hemoglobin; IFN, interferon; LDV, ledipasvir; SOF, sofosbuvir. |
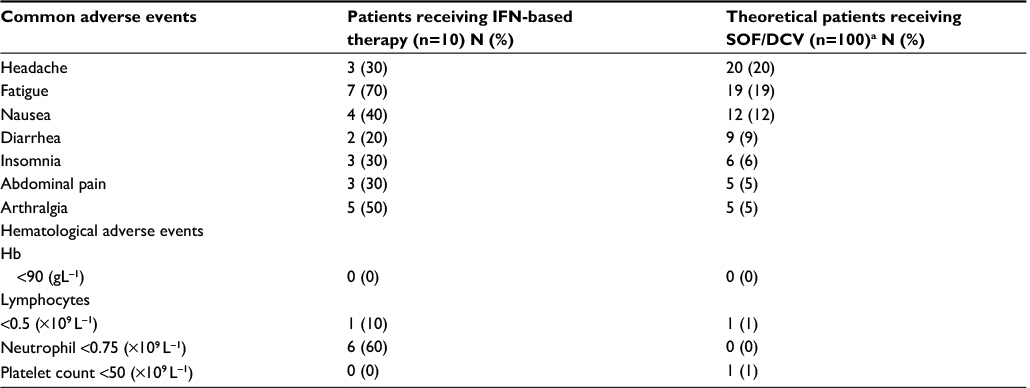 | Table S4 Adverse events for GT3 patients Note: aDerived from ALLY-3 trial (Nelson et al2) Abbreviations: DCV, daclatasvir; GT3, genotype 3; Hb, hemoglobin; IFN, interferon; SOF, sofosbuvir. |
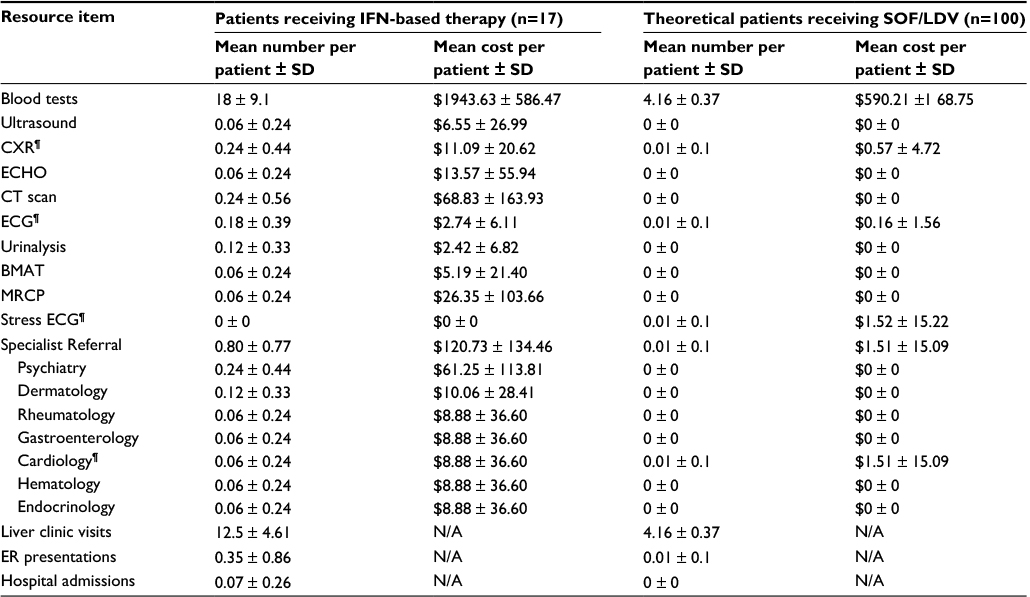 | Table S5 Comparison of medical resource utilization and costs for GT1 patients Note: The single serious adverse event (chest pain) for theoretical patients receiving SOF/LDV was predicted to result in an ECG, CXR, stress ECG, and a cardiology referral. Abbreviations: BMAT, bone marrow aspirate and trephine; CT, computed tomography; CXR, chest x-ray; ECG, electrocardiogram; ECHO, echocardiogram; ER, emergency room; GT1, genotype 1; IFN, interferon; LDV, ledipasvir; MRCP, magnetic resonance cholangiopancreatography; N/A, not applicable; SD, standard deviation; SOF, sofosbuvir. |
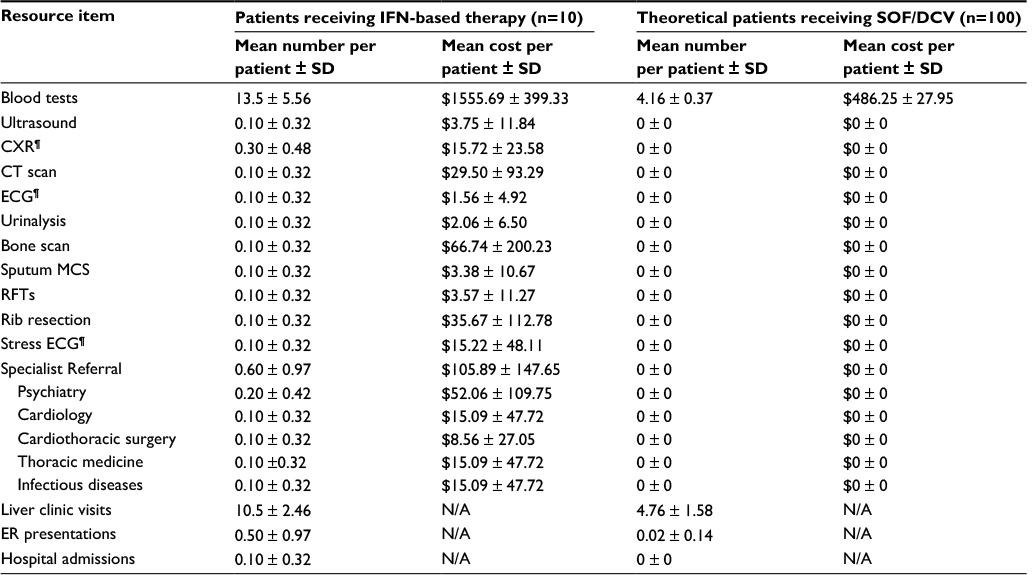 | Table S6 Comparison of medical resource utilization and costs for GT3 patients Abbreviations: CT, computed tomography; CXR, chest x-ray; DCV, daclatasvir; ECG, electrocardiogram; ER, emergency room; GT3, genotype 3; IFN, interferon; MCS, microscopy, culture and sensitivities; N/A, not applicable; RFTs, respiratory function tests; SD, standard deviation; SOF, sofosbuvir. |
References
Afdhal N, Zeuzem S, Kwo P, et al; ION-1 Investigators. Ledipasvir and sofosbuvir for untreated HCV genotype 1 infection. N Engl J Med. 2014;370(20):1889–1898. | ||
Nelson DR, Cooper JN, Lalezari JP, et al; ALLY-3 Study Team. All-oral 12-week treatment with daclatasvir plus sofosbuvir in patients with genotype 3 infection: ALLY-3 phase III study. Hepatology. 2015;61(4):1127–1135. |
 © 2017 The Author(s). This work is published and licensed by Dove Medical Press Limited. The full terms of this license are available at https://www.dovepress.com/terms.php and incorporate the Creative Commons Attribution - Non Commercial (unported, v3.0) License.
By accessing the work you hereby accept the Terms. Non-commercial uses of the work are permitted without any further permission from Dove Medical Press Limited, provided the work is properly attributed. For permission for commercial use of this work, please see paragraphs 4.2 and 5 of our Terms.
© 2017 The Author(s). This work is published and licensed by Dove Medical Press Limited. The full terms of this license are available at https://www.dovepress.com/terms.php and incorporate the Creative Commons Attribution - Non Commercial (unported, v3.0) License.
By accessing the work you hereby accept the Terms. Non-commercial uses of the work are permitted without any further permission from Dove Medical Press Limited, provided the work is properly attributed. For permission for commercial use of this work, please see paragraphs 4.2 and 5 of our Terms.