Back to Journals » Journal of Pain Research » Volume 14
The Cost of Lost Productivity in an Opioid Utilizing Pain Sample
Authors Fishman MA, Antony AB, Hunter CW, Pope JE, Staats PS ![]() , Agarwal R, Connolly AT
, Agarwal R, Connolly AT ![]() , Dalal N, Deer TR
, Dalal N, Deer TR ![]()
Received 9 March 2021
Accepted for publication 19 July 2021
Published 4 August 2021 Volume 2021:14 Pages 2347—2357
DOI https://doi.org/10.2147/JPR.S309691
Checked for plagiarism Yes
Review by Single anonymous peer review
Peer reviewer comments 2
Editor who approved publication: Dr Timothy Atkinson
Michael A Fishman,1 Ajay B Antony,2 Corey W Hunter,3 Jason E Pope,4 Peter S Staats,5 Rahul Agarwal,6 Allison T Connolly,6 Nirav Dalal,6 Timothy R Deer7
1Center for Interventional Pain and Spine, Exton, PA, USA; 2The Orthopaedic Institute, Gainesville, FL, USA; 3Ainsworth Institute of Pain Management, New York, NY, USA; 4Evolve Restorative Center, Santa Rosa, CA, USA; 5Premier Pain Centers, Shrewsbury, NJ, USA; 6Abbott, Sylmar, CA, USA; 7The Spine and Nerve Center of the Virginias, Charleston, WV, USA
Correspondence: Michael A Fishman
Center for Interventional Pain and Spine, 160 North Pointe Blvd Suite 208, Lancaster, PA, 17603, USA
Tel +1 917-543-6588
Email [email protected]
Background and Aims: Chronic pain affects more adults in the United States than any other condition. Opioid medications are widely used in the treatment of chronic pain, but there remains considerable risk and cost associated with their use. This study aims to characterize the effects of opioid prescribing for chronic pain and similar pain conditions on lost productivity in the United States.
Methods: This was a retrospective, longitudinal, observational study of chronic pain patients in 2011– 2014. We identified patients with a diagnosis of musculoskeletal pain receiving index prescription for opioids in administrative claims and studied disability absence in a linked health and productivity management database. Patients were grouped as de novo and continued use opioid users before index, and by opioid dose in the year after index. Days of disability were compared before and after index with bootstrapping. Effect of opioid dose group on disability was evaluated with negative binomial regression. Lost productivity cost was compared before and after index.
Results: The cohort contained 16,273 de novo and 6604 continued use patients. On average, de novo patients used 24.8 days of disability after index, an increase of 18.3 more days compared to before (p < 0.001). Continued use patients used 30.7 days after index, 9 more days than before (p < 0.001). There was a dose–response relationship between dose group and days of disability in de novo patients (p < 0.001). The weighted-average cost per person of lost productivity was $4344 higher in the year after index compared to the year before.
Conclusion: Opioid prescriptions for pain patients were associated with significant disability use and lost productivity costs. With the evolution of opioid-prescribing practices, CDC recommendations, and the HHS Pain Management Best Practices, there is opportunity to use alternative pain therapies without the risks of opioid-induced side effects to improve work productivity.
Keywords: opioids, pain, disability, productivity
Introduction
Chronic pain affects more adults in the United States than any other condition, and it is one of the most common reasons that adults seek medical care.1 The 2016 National Health Interview Survey indicated that 50 million US adults had chronic pain and 19.6 million had high-impact chronic pain affecting them daily.1 Pain is a complex biopsychosocial phenomenon where multiple variables inform the candidacy and response to treatment, including physical, interventional, pharmacologic, or psychological. Chronic pain has been linked to physical dysfunction, mood changes, poor quality of life, dependence on opioids, and disability.1–4 Opioid medications have been used in the treatment of acute and chronic pain for many years, and previously had been used routinely in the outpatient setting by primary-care and other non-pain physicians.5 Beginning in 2001, the Joint Commission on the Accreditation of Healthcare Organizations (JCAHO) introduced the requirement to monitor a patient’s pain as “the fifth vital sign”.6 Among other factors, a consequence of JCAHO’s approach was an overreliance on and overutilization of long-term opioids for non-cancer pain, as evidenced by a 7.3% overall increase in opioid prescriptions per capita from 2007 to 2012, primarily by primary care physicians.7 Even though opioid medications have a place in the treatment of some pain conditions, the increased utilization of opioids during this time period cannot be explained by any parallel changes in incidence of pain in the population.
Despite the controversy and confusion8 over the proper applications of the 2016 CDC Guidelines;9 the document highlighted public health challenges that worsened both the chronic pain and opioid problems in this country. Namely, while opioids can be effective in select patients for a short duration, there remains considerable risk and cost associated with their use. They are associated with significant cognitive effects that may interfere with a patient’s ability to work.10 Pain has been associated with lost productivity costs ranging from $299 to $335 billion per year, exceeding that of cardiovascular disease.11 Prescription opioid abuse was associated with workplace costs of $25.6 billion.12 There is need to better understand how the dual public health issues of chronic pain and chronic opioid use combine to improve or inhibit workers' productivity. In this study, we leverage large administrative claims and productivity databases to characterize the effects of opioid prescribing on disability status and lost productivity in the United States.
Methods
Design
This was a retrospective, longitudinal observational study of a subset of IBM MarketScan® Research Databases (IBM Watson Health) for individuals with a diagnosis of chronic pain or musculoskeletal pain in the years 2011–2014. The study objective was to quantify lost productivity by examining disability and absence from work over time in an opioid utilizing pain sample.
Data Sources
The MarketScan® Research Databases contain individual-level, de-identified, healthcare claims information from employers, health plans, hospitals, and Medicare and Medicaid programs. The MarketScan® Commercial database include health insurance claims across the continuum of care (eg, inpatient, outpatient, outpatient pharmacy) and enrollment from individuals covered by employer-sponsored US health plans. The MarketScan® Medicare Supplement database contains similar data for Medicare-eligible retirees with employer-sponsored Medicare Supplemental plans. The MarketScan® Health and Productivity Management (HPM) database contains workplace absence, short- and long-term disability, and workers’ compensation. The HPM data were available for a subset of patients in the Commercial and Medicare Supplemental databases. The databases contained claims from the years 2011–2014 and were linked at the individual person level using a randomized patient identifier. This provided a longitudinal database of all insurance and HPM claims submitted to any provider for the covered lives during the period of insurance coverage.
The study was a retrospective analysis of a deidentified database and thus exempt from institutional review board approval. Deidentified health information can be used without authorization or any other permission specified in the Health Insurance Portability and Accountability Act Privacy Rule, and this study was therefore exempt from informed consent procedures. The MarketScan® database is available for purchase from IBM Watson Health and is not publicly available.
Patient Selection
The study population consisted of patients in MarketScan® Commercial and Medicare Supplemental databases with a diagnosis code for chronic pain or musculoskeletal pain between 2011 and 2014. These pain conditions included post-laminectomy syndrome, complex regional pain syndrome, causalgia, neuritis/radiculitis, degenerative disc disease, back pain, and limb pain (Table S1). Patients were excluded if they had a spinal cord stimulator (SCS) or other neuromodulation device at any time (Table S2). The index event was defined as the first opioid prescription (drug therapeutic class 60, 61) in the year 2012 or later. The year 2011 was excluded to ensure each subject had potential for 1 year of pre-index enrollment, and patients were required to have at least 1 year of enrollment data before and after index to establish medical history and follow-up, respectively. Inclusion in the study required a refill opioid prescription, defined by a second opioid prescription within 6 months after index. Patients were required to have existing chronic pain, established by chronic pain diagnosis codes (Table S1) on or before index. Patients <18 years of age at index were excluded. Patients with extreme opioid use (ie, >1000 morphine milligram equivalents per day) were excluded due to probable data errors or outliers.
The study cohort consisted of those patients meeting inclusion and exclusion criteria who were also represented in the HPM database with at least 1 year of enrollment in long-term disability, short-term disability and workers’ compensation before and after index. Supplemental analyses were performed among patients meeting inclusion and exclusion criteria but who were not in the HPM database (see Supplementary Materials).
Patient History
Opioid users were categorized as de novo if they had 0 opioid prescriptions in the year before index. The presence of two or more prescriptions within a year was assumed as a measure of refilling an opioid prescription. Therefore, patients having ≥1 opioid prescription in the year before index were categorized as continued use. De novo patients with >1 year of enrollment data before index were characterized as renewed onset users if they had ≥1 opioid prescription >1 year before index. As renewed onset patients may have more complex pain profile and/or may represent patients with acute episodes of pain events, they were excluded from further analysis in this study.
Patient demographics, including age and sex, were measured at the time of index opioid prescription. History of pain syndromes including back pain, degenerative disc disease, limb pain, neuritis/radiculitis, and other chronic pain, were derived by searching the claims for corresponding diagnosis codes on or before index (Table S1).
Opioid Dosage
The outpatient pharmacy data captured the drug number (NDCNUM), brand name, generic name, ingredients, dose, quantity, and days-supply for filled prescriptions. These data were used to calculate the morphine milligram equivalent (MME) dosage based on published morphine equivalent conversion factors (MECF, Table S3).
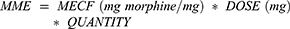
For each patient, total MME was calculated by summing the MME for all filled opioid prescriptions within a given time period. The average daily MME was calculated by dividing the total MME by the number of days in the period. Patients were categorized into one of three opioid use groups based on daily MME in the year after index: none (<5 MME/day), low (5–25 MME/day), or moderate (≥25 MME/day). Note that average daily MME dosage may vary from prescription dosage, as gaps between refills can reduce the average daily dosage compared to the prescribed dosage.
Disability Days
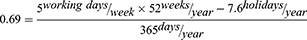
The primary outcome was the total number of days of disability, which included short-term disability leave, long-term disability leave, and workers’ compensation. Disability data were aligned with index event. In the database, periods of disability were defined by start and end dates. Days of disability was calculated by subtracting the end date from the start date. Patients were considered “on disability” if they had at least one day of disability absence within a given period. The proportion of all patients in the study on disability was calculated for each month in the year before and after index. The cumulative disability days in the one year before and after index were compared, and the cumulative disability days in the one month before and after index were compared. Total days of disability were converted into working days of disability by multiplying by a factor of 0.69, accounting for working days (5 of 7) and holidays (7.6 per year, Bureau of Labor and Statistics, https://www.bls.gov/news.release/ebs.t05.htm).
Cost of Lost Productivity
Hourly wage was estimated for each patient based on weekly median earnings for full time employees by age and sex, assuming a 40 hour work week (Bureau of Labor and Statistics, https://www.bls.gov/webapps/legacy/cpswktab3.htm). The Bureau of Labor and Statistics reported total employee compensation of $38.26/hour, with wage accounting for $26.25/hour in September 2020 (https://www.bls.gov/news.release/archives/ecec_12172020.htm). Therefore, wage could be converted into productivity cost (wage + benefits) by multiplying by a factor 38.26/26.25=1.458. Cost of lost productivity was calculated by multiplying productivity cost by working days of disability for each patient. Cost was calculated at the time of analysis using most recently available estimates to make the results relevant.
Statistics
Statistical analyses were performed in Jupyter Notebook version 4.2.1 running on Python version 3.5.3, and Anaconda version 4.1.1 (64-bit) (https://jupyter.org/). Continuous variables were presented as mean ± std and were compared using t-test. Categorical variables were presented as count (percent) and were compared using Chi-squared test. Disability and opioid dosage data were skewed and non-normally distributed, so non-parametric statistics were used for comparisons. Percent of patients on disability and working days per year lost to disability were compared across time periods using bootstrapping with replacement with 1000 iterations. The bootstrap model was designed to replicate data assuming the null hypothesis (no relationship between opioids and working days or disability) was true. We report the percent of times that the bootstrap process reported a test statistic more extreme than that produced by the original data. Before and after comparisons were done using paired, within-subject comparisons. Negative binomial regression was used to quantify the effect of opioid dosage on disability in the year after opioid prescription. Statistical tests were adjusted for age, sex and presence of disability in the year before.
Results
Study Population
The MarketScan® Commercial and Medicare Supplemental databases contained 14,534,718 patients with pain who did not receive neuromodulation therapy, of which 581,151 had an opioid prescription with a refill, met enrollment requirements, had existing pain at the time of index, and did not meet any exclusion criteria (Figure 1). Of these, 104,008 (18%) were represented in the HPM database. After excluding patients with insufficient enrollment in the HPM database and those characterized as renewed onset, 16,273 patients were identified as de novo and 6604 were continued use.
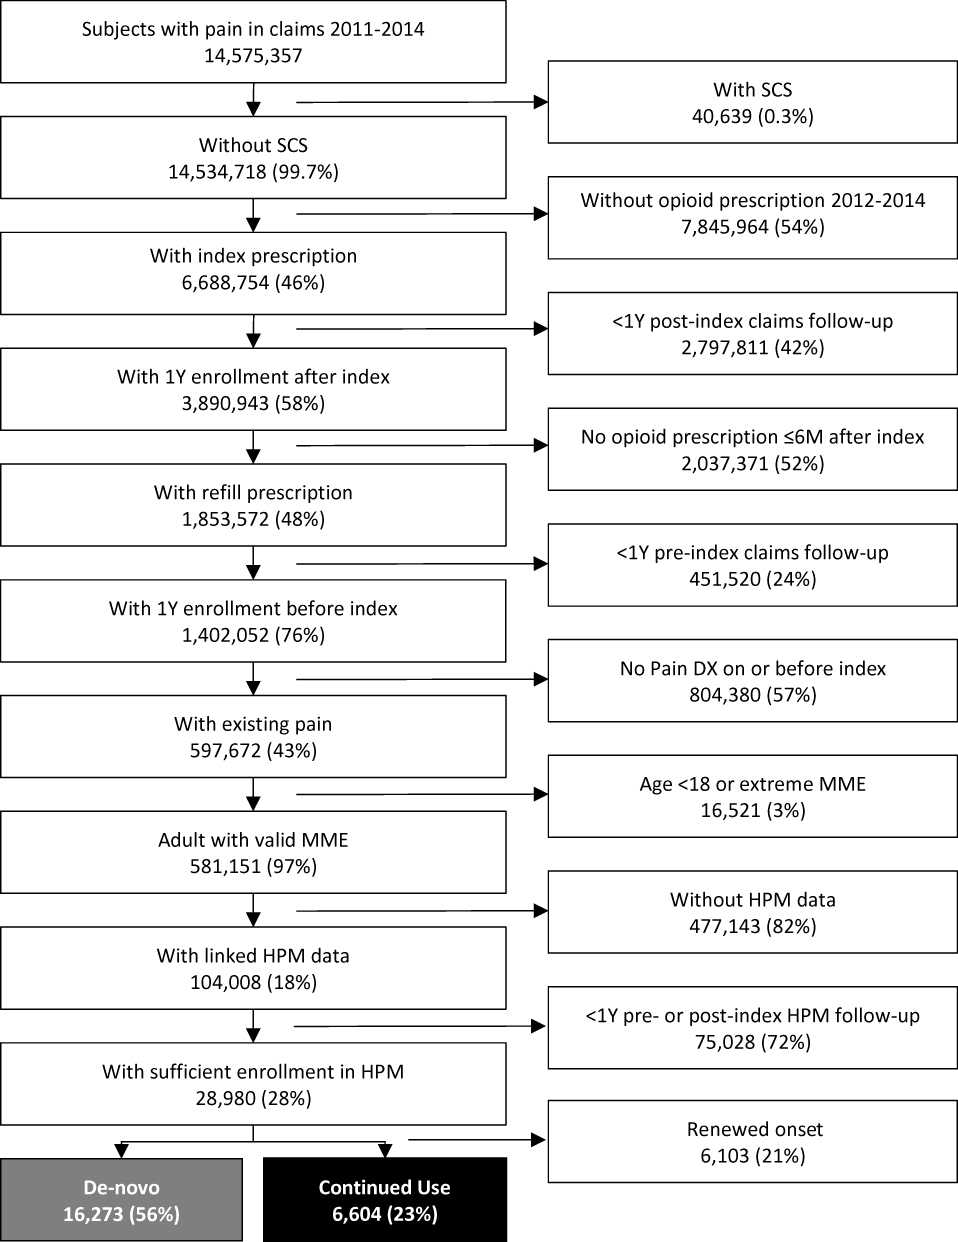 |
Figure 1 Cohort diagram. Abbreviations: DX, diagnosis; HPM, health and productivity management; MME, morphine milligram equivalent; SCS, spinal cord stimulation. |
Among patients with HPM data, de novo and continued use patients were similar in age and sex, while de novo patients had lower incidence of history of pain disorders (Table 1). In continued use patients, 19% had MME ≥25 in the year before index and 61% had MME <5 in the year before index.
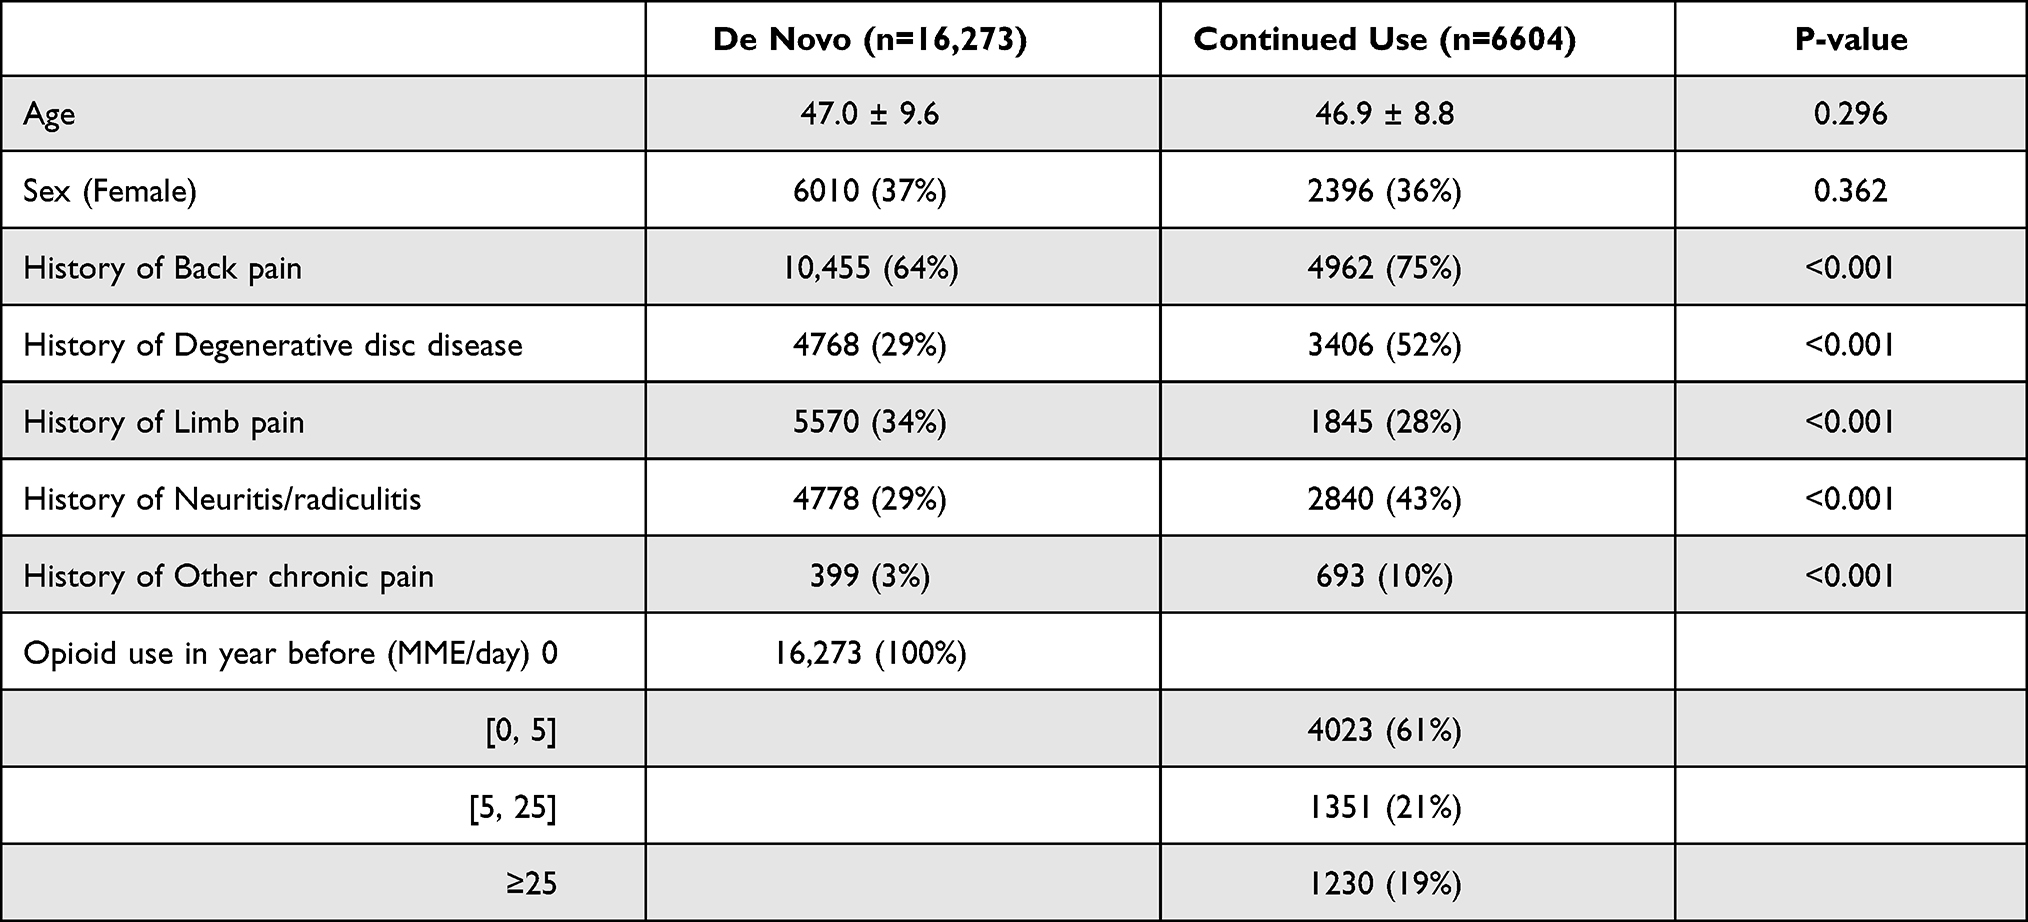 |
Table 1 Baseline Demographics of Patients Included in Both Claims and HPM Data Sets |
In comparison to patients with HPM data, patients without HPM were more likely to be continued use (33%) and were less likely de novo (50%) or renewed onset (17%, Figure S1). This was associated with the non-HPM cohort being older, having more females, having higher dose of opioids in the prior year, and more likely to have a history of pain conditions (Table S4).
Further, patients that were on HPM also tended to have lower average opioid dosage than patients that were not on HPM (4.2 vs 8.1%; p-value <0.001 patients in more than 25 MME/day average dosage, Table S5).
Opioid Use Characterization
Patients were categorized into three groups based on their average daily MME dispensation in the year after index. There was a shift toward higher doses and higher MME group in continued use patients. Of de novo patients, 13,729 (84%) were none MME, 2232 (14%) were low MME, and 312 (2%) were moderate MME after index (Table 2). For continued use patients, 3034 (46%) were none MME, 2032 (31%) were low MME, and 1537 (23%) were moderate MME. Within opioid use groups, de novo patients tended to have lower daily MME than continued use patients (p < 0.001). For example, in the moderate MME group, de novo patients had median 37.4 MME/day [IQR 29.8, 55.3], while continued use patients had median 55.9 MME/day [IQR 35.4, 122.0].
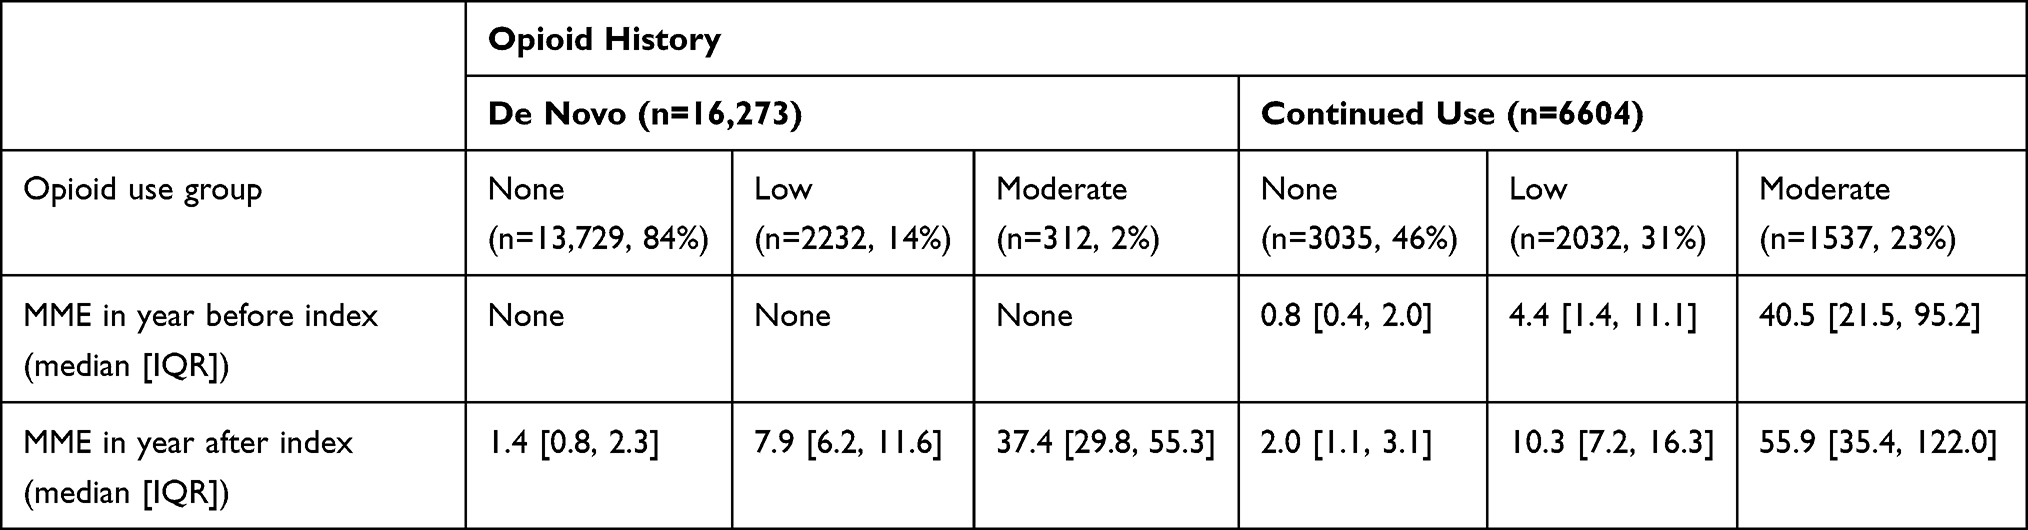 |
Table 2 Average Daily MME in the Year After Index Grouped by Opioid History and by Opioid Use Group |
Disability-Related Absences from Work After Opioids
At one year before index, only 2.5% of de novo and 9.3% of continued use patients experienced disability-related absence from work (Figure 2A and B). This proportion of patients was highest in the months surrounding the index opioid prescription. In de novo patients, 14.2% and 27.9% experienced disability absence in the months before and after index, respectively. In continued use patients, 16.7% and 22.5% experienced disability absence in the months before and after index, respectively. At one year after index, the percent of patients experiencing absence was lower compared to the time of index but remained significantly elevated compared to one year before index (6.6% in de novo and 11.8% in continued use patients, p < 0.001).
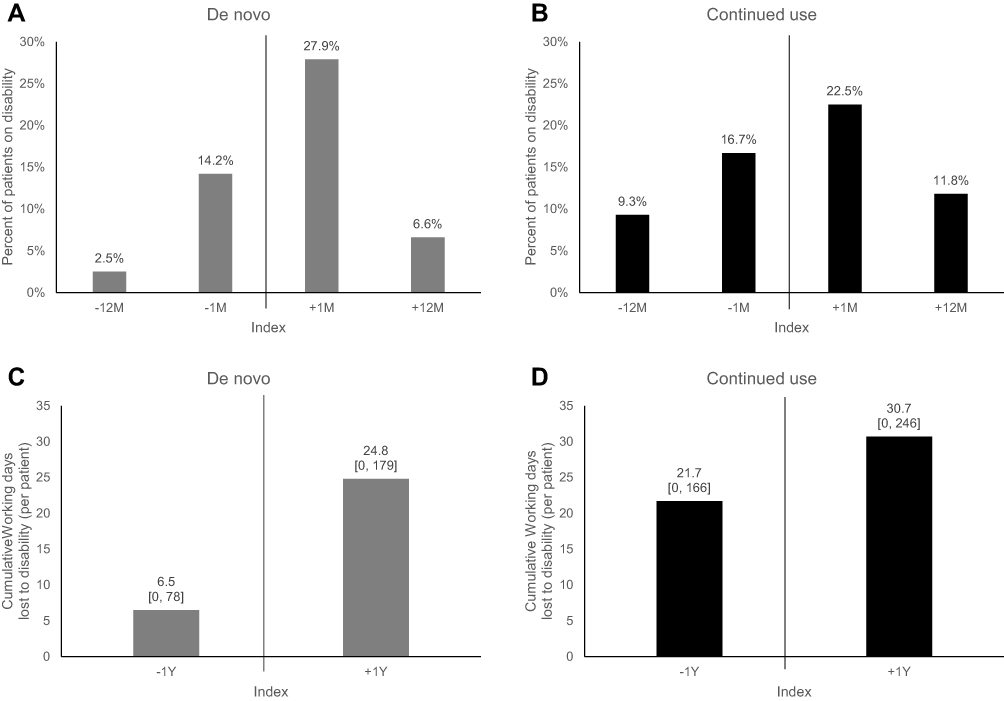 |
Figure 2 Disability in patients prescribed opioids for pain management. Percent of (A) de novo and (B) continued use patients on disability in a given month. Average working days lost to disability per patient in (C) de novo and (D) continued use patients. Bar labels show means and [95% confidence intervals]. For all subplots, comparison of −12M to +12M, −1M to +1M, and −1Y to +1Y have p-value < 0.001. |
In addition to the number of patients having disability-related work absence, the number of working days lost to disability per patient also increased after the index prescription. Patients in the de novo group missed an average of 24.8 working days per patient due to disability in the year after index, an increase of 18.3 days over the year before index (p < 0.001, Figure 2C), while those in the continued use group missed an average of 30.7 working days in the year after index, an increase of 9 days over the prior year (p < 0.001, Figure 2D).
Dose–Response of MME on Disability-Related Absence
A dose–response relationship was observed between the opioid dosage after index and the number of working days lost to disability in de novo patients. The patients with low MME were 1.8 times more likely to experience disability absence (95% Confidence Interval (CI) [1.7–1.9], p < 0.001), and moderate MME patients were 2.1 times more likely to experience disability absence compared to none MME (95% CI [1.8–2.5], p < 0.001). From the year before to the year after index, the work time lost due to disability increased by 15 days per patient for none MME, 35 for low MME, and 41 for moderate MME (Figure 3).
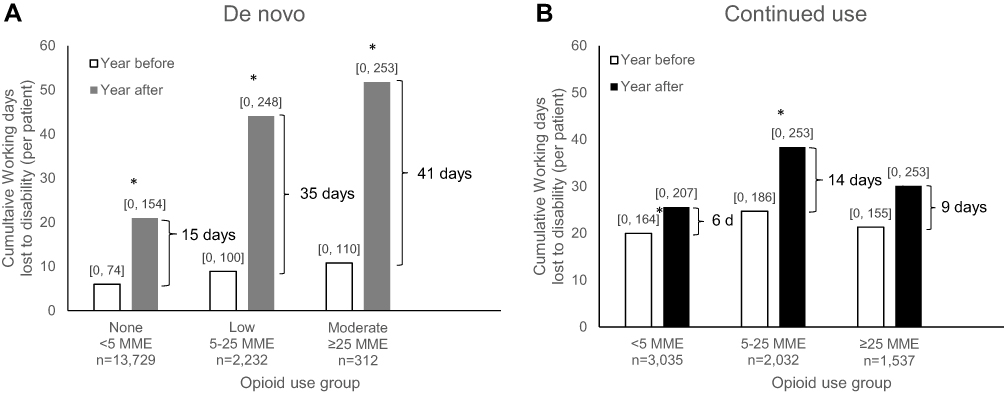 |
Figure 3 Working days lost in (A) de novo and (B) continued use patients, grouped by opioid use in the year after index. Bar labels show [95% confidence intervals]. Asterisk (*) represents a significant difference between year before and year after index with p < 0.001, with adjustment for age, sex and presence of disability in the year before. Abbreviation: MME, morphine milligram. |
Among the continued use group, patients with low and moderate MME were more likely than none MME to have disability-related absence (RR 1.4, 95% CI [1.3–1.5] and RR 1.2, 95% CI [1.1–1.3], respectively, p < 0.001). Low and moderate MME missed an additional 14 and 9 days, respectively, compared to the prior year, versus 6 additional days for none MME. There were no clinically meaningful differences in age among the dose groups; however, patients with higher average MME were more likely to be male and were more likely to have a history of pain disorders, except for limb pain (Tables S6 and S7).
Cost of Lost Productivity in Pain Patients
In the year before index opioid prescription, de novo patients experienced an average $1763 in lost productivity due to disability absence; this increased to $6869 in the year following the index prescription (p < 0.001, Figure 4). Likewise, the lost productivity among continued use group increased from $5975 in the year before to $8443 in the year after the index prescription (p < 0.001). With 71% of the studied population in the de novo group and 29% in the continued use group, the weighted-average cost per person of lost productivity was $4344 higher in the year after index compared to the year before index.
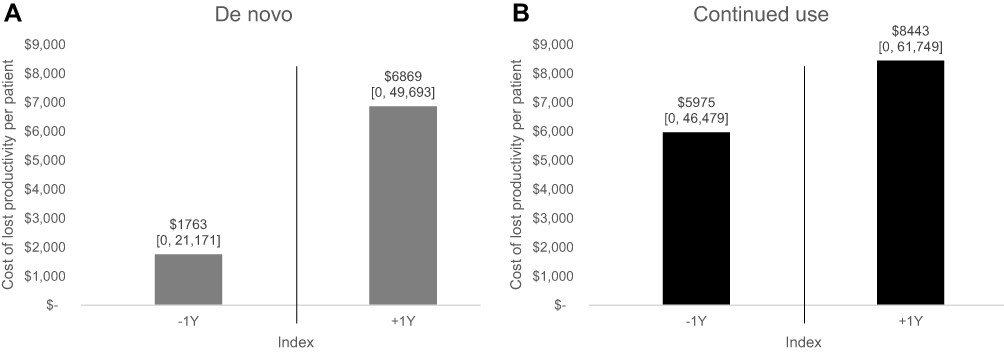 |
Figure 4 Cost of lost productivity in (A) de novo and (B) continued use patients. Bar labels show means and [95% confidence intervals]. For all subplots, comparison of −1Y to +1Y have p-value < 0.001. |
Discussion
The objective of this retrospective study was to evaluate the contributions of both de novo and continued opioid use on lost productivity. Our data suggest that establishing new opioid prescriptions was directly associated with an increase in disability-related absence, with 27.9% of patients experiencing disability in the month after index. Disability absence was also substantial in the continued use group, with 22.5% of patients experience disability following index event. De novo opioid use was associated with an additional 18.3 days of disability per patient per year, while continued use added 9 days. Further, these absences followed a dose–response relationship with the prescribed opioid dosage, with patients in the low and moderate opioid groups being 1.8 times and 2.1 times more likely to experience disability absence compared to the low opioid group. This amounted to an average lost productivity cost of $4344 per patient per year.
Both de novo opioid users and those who were prescribed opioids within the year prior to index exhibited an increase in disability-related absences from work that spiked in the months surrounding the index opioid prescription. This increase within both groups may have been due to the nature of the injury or event that initiated the new prescription of opioids. This type of trajectory with peaked disability days surrounding the index event was also seen in a Swedish study.13 They concluded that disability usage after opioid initiation reflects a continuation of pre-opioid patterns, and the opioids do not coincide with a reversal or reduction in disability usage. In our study, the upward trend persisted past the one-month post index event period. The percent of patients experiencing disability-related absences remained elevated out to one year following the index event in both de novo and continued use groups, demonstrating a long-lasting correlation between pain and opioid use on productivity.
Our results show a dose–response relationship between de novo opioid dosage and lost productivity. In a study of musculoskeletal disorders, Kidner et al found a similar dose–response relationship between opioid dosage and the outcomes of return to work and social security disability usage.14 Gaskin and Richard found a dose–response relationship between pain severity and lost productivity, with severe pain patients losing 717 hours of work while those with moderate pain lost 291 hours.11 Pain severity may be directly related to opioid dose in de novo users, but in chronic users, opioid dependence and abuse can confound this relationship. Volinn et al found that back pain patients with chronic opioid prescriptions (≥90 days) were at 11–14 times greater risk for chronic work loss than those not prescribed opioids for their pain.15 These studies demonstrate that pain, chronic or otherwise, is associated with lost productivity. Opioids, while they are meant to treat pain and improve outcomes, they have not been shown to improve productivity or functional capacity, and in fact may have the opposite effect.16
The HPM database used for this analysis was limited to individuals who were eligible for disability benefits through their employer. Therefore, the results may represent less severe cases compared to those on disability programs administered by the Social Security Administration and who cannot work due to their pain. There is evidence for this effect in our study, considering that more individuals without HPM data were in the low and moderate opioid groups compared to those with HPM data (Table S4). Those without HPM data may include individuals who qualify for medical insurance through a family member are not contained in the HPM database because they do not work. Therefore, considering the dose–response relationship between opioid dose and lost productivity, the cost of lost productivity of the non-HPM population may be even higher than $4344 per patient per year. The inability to work qualifies patients to be categorized as having high-impact pain, which has been estimated to affect nearly 20 million Americans.1,17
Alternative therapies beyond opioid medications should be explored for the treatment of chronic pain, with the goal of reducing disability and enabling patients to return to work. Integrated care18 and psychological treatments19 have been shown to improve functional status and disability. Advances in neuromodulation therapies for chronic pain have resulted in even greater efficacy and increased responder rates than traditional tonic dorsal column stimulation.20,21 Spinal cord stimulation (SCS) has been shown to be an effective method to decrease opioid use in some studies.22,23 However, we do all know that the challenges of treating chronic pain and chronic opioid use are significantly entangled, and the efficacy of any therapy cannot be judged by opioid reduction alone. In that sense, patient-centric multimodal treatment for chronic pain is critical, with condition- and diagnosis-specific therapies favored over universal treatments like opioids. In this study neither both the continued use nor the de novo opioid group found a benefit in productivity with opioid treatment. There is opportunity to introduce alternative therapies that improve work productivity earlier in the pain treatment spectrum, instead of or in conjunction with opioids in a patient-centric manner.
Strengths and Limitations
A key strength of this descriptive study was the longitudinal design, which allowed patients to be followed for one year before and after index event. The large database provided a study population that far exceeded those obtainable in a clinical study and was enough for across group comparisons. Data linkage between claims and HPM allowed for identification of a patient cohort by disease state and medication therapy and enabled time-based analysis of work productivity around a qualifying opioid prescription event.
This was a retrospective analysis, so causal relationships could not be derived from the results. The MarketScan® database was representative of the privately insured US working-age population and those on Medicare Supplemental insurance and may not be representative of those using alternative types of medical insurance, such as Medicaid. In the United States, individuals change insurance plans frequently, which limited the available follow-up for this study to one year after index. Prescription data contained only filled prescriptions but do not reflect if the medication was consumed. Inpatient and outpatient claims were analyzed based on diagnosis codes that could not be adjudicated for appropriateness. Clinical characteristics including pain duration and opioid use duration in the continued use group were not available. Most notably, the reason for opioid onset or refill prescription was not captured. The HPM data were available for a subset of claims patients, which may introduce bias in the population towards an actively working patient group. Patients with spinal cord stimulator implants were excluded, which may remove individuals with more severe disability. This study focused on cost of lost productivity and did not expand to the total burden of opioid use for chronic pain, which can include additional healthcare expenditures and other indirect costs. Direct measure of lost productivity cost was not available and was instead inferred based on averages accounting for age and sex, but not varying with geography, education, or occupation. In addition, we cannot rule out the possibility that more severe injuries resulted in both the initiation of opioids or higher opioid requirements, making disability more a function of the initial injury.
Conclusions
Opioid prescriptions for pain patients were associated with significant increased disability use and lost productivity costs. With the evolution of opioid-prescribing practices and CDC recommendations, there is opportunity to use alternative pain therapies without opioid-induced side effects to improve clinical outcomes and work productivity.
Disclosure
Dr Michael A Fishman reports personal fees from Abbott, Biotronik, Braeburn, grants and personal fees from Medtronic, personal fees from Nevro, Thermaquil, Nalu Medical, Boston Scientific, SGX Medical, Celeri Health, outside the submitted work. Dr Ajay Antony reports non-financial support from Abbott, during the conduct of the study; grants, personal fees from Abbott, Boston Scientific, PainTeq, Nalu, SPR, outside the submitted work. Dr Corey Hunter reports personal fees from Abbott, during the conduct of the study. Dr Jason Pope reports personal fees from Abbott, Saluda, Medtronic, SPR Therapeutics, Flowonix, AIS, Ethos, Painteq, Vertos, Aurora Spine, Boston Scientific, outside the submitted work. Dr Peter Staats reports a patent High dose capsaicin in pain with royalities paid to Averitas; and Employee electroCore Manufacturer of gammacore a vagus nerve stimulator consultant Nalu Medtronic SPR AIS healthcare (pain therapies). Dr Rahul Agarwal reports personal fees from Abbott, during the conduct of the study. Dr Allison T Connolly reports personal fees from Abbott, during the conduct of the study. Mr Nirav Dalal reports personal fees from Abbott, during the conduct of the study; personal fees from Abbott, outside the submitted work. Dr Timothy Deer reports personal fees from Abbott, grants, personal fees from Vertos, personal fees from Flowonix, Axonics, SpineThera, grants from Saluda, Mainstay, personal fees from Nalu, grants from Vertiflex, Cornerloc, Ethos, SPR Therapeutic, Stimgenics, SI Bone, Nevro, Medtronic, Boston Scientific, Painteq, outside the submitted work. In addition, Dr Timothy Deer has a patent Abbott pending.
This study was funded by Abbott.
References
1. Dahlhamer J, Lucas J, Zelaya C, et al. Prevalence of chronic pain and high-impact chronic pain among adults - United States, 2016. MMWR Morb Mortal Wkly Rep. 2018;67(36):1001–1006. doi:10.15585/mmwr.mm6736a2
2. Oliveira DS, Velia Ferreira Mendonca L, Sofia Monteiro Sampaio R, Manuel Pereira Dias de Castro-lopes J, Ribeiro de Azevedo LF. The impact of anxiety and depression on the outcomes of chronic low back pain multidisciplinary pain management-a multicenter prospective cohort study in pain clinics with one-year follow-up. Pain Med. 2019;20(4):736–746. doi:10.1093/pm/pny128
3. Kroenke K, Outcalt S, Krebs E, et al. Association between anxiety, health-related quality of life and functional impairment in primary care patients with chronic pain. Gen Hosp Psychiatry. 2013;35(4):359–365. doi:10.1016/j.genhosppsych.2013.03.020
4. Staats PS, Hekmat H, Staats AW. The psychological behaviorism theory of pain and the placebo: its principles and results of research application. Adv Psychosom Med. 2004;25:28–40.
5. Ballantyne JC, Mao J. Opioid therapy for chronic pain. N Engl J Med. 2003;349(20):1943–1953. doi:10.1056/NEJMra025411
6. Institute of Medicine (US) Committee on Advancing Pain Research, Care, and Education. Relieving Pain in America: A Blueprint for Transforming Prevention, Care, Education, and Research. Washington (DC): National Academies Press (US); 2011. doi:10.17226/13172
7. Levy B, Paulozzi L, Mack KA, Jones CM. Trends in opioid analgesic-prescribing rates by specialty, U.S., 2007–2012. Am J Prev Med. 2015;49(3):409–413. doi:10.1016/j.amepre.2015.02.020
8. Dowell D, Haegerich T, Chou R. No shortcuts to safer opioid prescribing. N Engl J Med. 2019;380(24):2285–2287. doi:10.1056/NEJMp1904190
9. Dowell D, Haegerich TM, Chou R. CDC guideline for prescribing opioids for chronic pain - United States, 2016. MMWR Morb Mortal Wkly Rep. 2016;65(1):1–49.
10. Dhingra L, Ahmed E, Shin J, Scharaga E, Magun M. Cognitive effects and sedation. Pain Med. 2015;16(Suppl 1):S37–43. doi:10.1111/pme.12912
11. Gaskin DJ, Richard P. The economic costs of pain in the United States. J Pain. 2012;13(8):715–724. doi:10.1016/j.jpain.2012.03.009
12. Birnbaum HG, White AG, Schiller M, Waldman T, Cleveland JM, Roland CL. Societal costs of prescription opioid abuse, dependence, and misuse in the United States. Pain Med. 2011;12(4):657–667. doi:10.1111/j.1526-4637.2011.01075.x
13. Lalic S, Bell JS, Gyllensten H, et al. Trajectories of sickness absence and disability pension before and after opioid initiation for noncancer pain: a 10-year population-based study. Pain. 2019;160(5):1224–1233. doi:10.1097/j.pain.0000000000001500
14. Kidner CL, Mayer TG, Gatchel RJ. Higher opioid doses predict poorer functional outcome in patients with chronic disabling occupational musculoskeletal disorders. J Bone Joint Surg Am. 2009;91(4):919–927. doi:10.2106/JBJS.H.00286
15. Volinn E, Fargo JD, Fine PG. Opioid therapy for nonspecific low back pain and the outcome of chronic work loss. Pain. 2009;142(3):194–201. doi:10.1016/j.pain.2008.12.017
16. Eriksen J, Sjogren P, Bruera E, Ekholm O, Rasmussen NK. Critical issues on opioids in chronic non-cancer pain: an epidemiological study. Pain. 2006;125(1–2):172–179. doi:10.1016/j.pain.2006.06.009
17. Pitcher MH, Von Korff M, Bushnell MC, Porter L. Prevalence and profile of high-impact chronic pain in the United States. J Pain. 2019;20(2):146–160. doi:10.1016/j.jpain.2018.07.006
18. Lambeek LC, van Mechelen W, Knol DL, Loisel P, Anema JR. Randomised controlled trial of integrated care to reduce disability from chronic low back pain in working and private life. BMJ. 2010;340:c1035. doi:10.1136/bmj.c1035
19. Roditi D, Robinson ME. The role of psychological interventions in the management of patients with chronic pain. Psychol Res Behav Manag. 2011;4:41–49. doi:10.2147/PRBM.S15375
20. Deer TR, Levy RM, Kramer J, et al. Dorsal root ganglion stimulation yielded higher treatment success rate for complex regional pain syndrome and causalgia at 3 and 12 months: a randomized comparative trial. Pain. 2017;158(4):669–681. doi:10.1097/j.pain.0000000000000814
21. Deer T, Slavin KV, Amirdelfan K, et al. Success using neuromodulation with BURST (SUNBURST) study: results from a prospective, randomized controlled trial using a novel burst waveform. Neuromodulation. 2018;21(1):56–66. doi:10.1111/ner.12698
22. Al-Kaisy A, Van Buyten JP, Carganillo R, et al. 10 kHz SCS therapy for chronic pain, effects on opioid usage: post hoc analysis of data from two prospective studies. Sci Rep. 2019;9(1):11441. doi:10.1038/s41598-019-47792-3
23. Sharan AD, Riley J, Falowski S, et al. Association of opioid usage with spinal cord stimulation outcomes. Pain Med. 2018;19(4):699–707. doi:10.1093/pm/pnx262
 © 2021 The Author(s). This work is published and licensed by Dove Medical Press Limited. The
full terms of this license are available at https://www.dovepress.com/terms
and incorporate the Creative Commons Attribution
- Non Commercial (unported, 3.0) License.
By accessing the work you hereby accept the Terms. Non-commercial uses of the work are permitted
without any further permission from Dove Medical Press Limited, provided the work is properly
attributed. For permission for commercial use of this work, please see paragraphs 4.2 and 5 of our Terms.
© 2021 The Author(s). This work is published and licensed by Dove Medical Press Limited. The
full terms of this license are available at https://www.dovepress.com/terms
and incorporate the Creative Commons Attribution
- Non Commercial (unported, 3.0) License.
By accessing the work you hereby accept the Terms. Non-commercial uses of the work are permitted
without any further permission from Dove Medical Press Limited, provided the work is properly
attributed. For permission for commercial use of this work, please see paragraphs 4.2 and 5 of our Terms.