Back to Journals » Diabetes, Metabolic Syndrome and Obesity » Volume 13
The Correlation of Type 2 Diabetes Status with Bone Mineral Density in Middle-Aged Adults
Authors Yao X, Xu X, Jin F, Zhu Z ![]()
Received 20 June 2020
Accepted for publication 19 August 2020
Published 16 September 2020 Volume 2020:13 Pages 3269—3276
DOI https://doi.org/10.2147/DMSO.S268592
Checked for plagiarism Yes
Review by Single anonymous peer review
Peer reviewer comments 2
Editor who approved publication: Dr Konstantinos Tziomalos
Xiaocong Yao,1 Xiaocheng Xu,2 Fang Jin,1 Zhongxin Zhu1,3
1Department of Osteoporosis Care and Control, The First People’s Hospital of Xiaoshan District, Hangzhou, Zhejiang 311200, People’s Republic of China; 2Department of Cancer Medicine, The First People’s Hospital of Xiaoshan District, Hangzhou, Zhejiang 311200, People’s Republic of China; 3Zhejiang Chinese Medical University, Hangzhou, Zhejiang 310053, People’s Republic of China
Correspondence: Zhongxin Zhu Email [email protected]
Background: Bone metabolism can be influenced by type 2 diabetes mellitus (T2DM). However, the relationship between T2DM and bone mineral density (BMD) remains inconsistent. This study explored the differences in BMD in middle-aged adults with and without T2DM.
Methods: We conducted a cross-sectional study of 4986 participants aged 40– 59 years who participated in the National Health and Nutrition Examination Survey (NHANES) 2011– 2018. We performed multivariable logistic regression models to evaluate the associations between T2DM status, serum glucose, glycohemoglobin (HbA1c), disease duration and lumbar BMD.
Results: There was a positive association between T2DM status and lumbar BMD in all three models (model 1: β=0.039, 95% CI: 0.025– 0.052; model 2: β=0.045, 95% CI: 0.031– 0.059; model 3: β=0.035, 95% CI: 0.014– 0.055). In the subgroup analysis stratified by gender, this positive association existed in both gender after adjusting for confounders (males: β=0.033, 95% CI: 0.003– 0.062; females: β=0.035, 95% CI: 0.008– 0.062). Besides, there were no significant associations of serum glucose, HbA1c, disease duration with lumbar BMD in both genders with T2DM.
Conclusion: This study indicated that middle-aged adults with T2DM had significantly higher lumbar BMD compared with those without DM.
Keywords: diabetes, glucose, HbA1c, bone health, NHANES
Introduction
Diabetes mellitus (DM) and osteoporosis are two common metabolic diseases prevalent in all regions of the world.1 They may thus occur together by chance. Caused by deficiency of insulin secretion, type 1 DM (T1DM) commonly occurs during childhood and adolescence period, and type 2 DM (T2DM), also called adult-onset diabetes, is the result of resistance to insulin and an inadequate compensatory insulin secretion response to glucose.2 Any of these types of DM may be associated with osteoporosis; therefore, DM has become a topic of interest in bone research.
Diabetes-related osteoporosis is one of the main complications of DM affecting the skeletal system; however, the mechanisms linking DM to osteoporosis have not been fully explained.3 In recent years, a significant association between DM and osteoporosis has been established with an increased prevalence or risk of osteoporosis, and decreased bone mineral density (BMD) has consistently been observed in T1DM; however, studies investigated on BMD in T2DM came to contradictory conclusions.4–8 Therefore, this study investigated the relationship of T2DM with BMD in adults aged 40–59 years using a nationally representative sample. We also evaluated the effect of disease duration of T2DM on BMD and the associations of serum glucose and glycohemoglobin (HbA1c) with BMD.
Methods
Data Sources
To address emerging public health issues and provide objective data on health conditions for children and adults in the US, the National Health and Nutrition Examination Survey (NHANES) was designed and conducted by the National Center for Health Statistics (NCHS). The NHANES was a large, ongoing cross-sectional survey designed to be nationally representative. The data accessed from NHANES is freely available on the Internet for researchers throughout the world. In this study, we pooled data from 4 two-year cycles of NHANES 2011–2018 (the latest data available at the time of analysis). Participants in each NHANES cycle were identified through stratified, multi-stage probability sampling of the non-institutionalized US population. Among the 7383 adults aged 40–59 years, we excluded 669 participants with missing serum glucose data, one participant with missing HbA1c data, 1218 participants with missing lumbar BMD data, 304 participants with cancer, and 155 participants who had unclear self-report DM status. To minimize the number of participants with T1DM, 50 participants with age of DM onset before age 30 were also excluded. Finally, 4986 participants were analyzed after applying these exclusion criteria (Figure 1). The survey protocol was approved by the Institutional Review Board of NCHS, and each participant provided written informed consent.
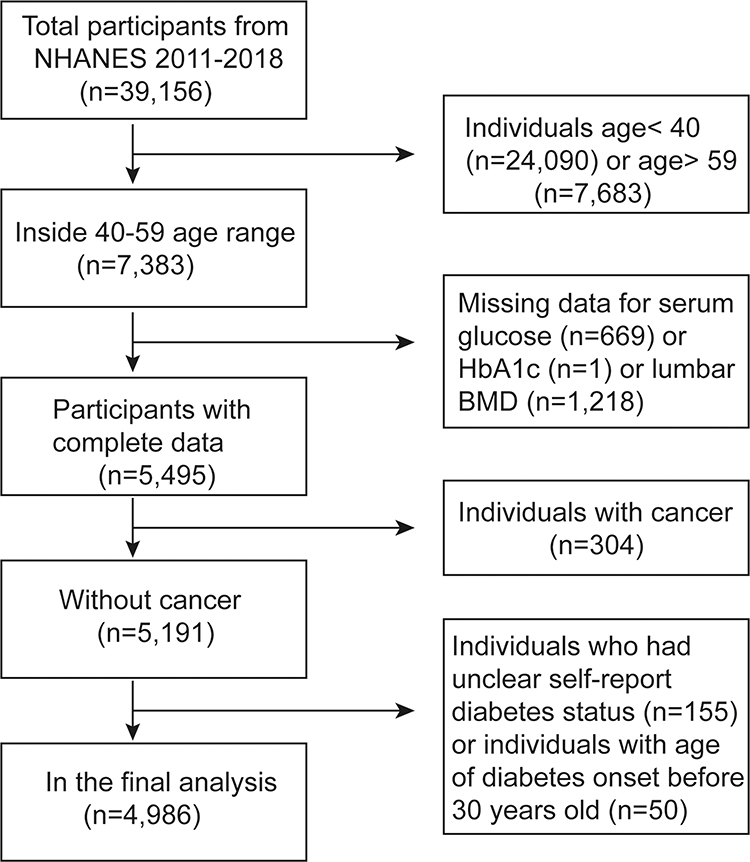 |
Figure 1 Flow chart of sample selection from the NHANES 2011–2018. |
Evaluation of Exposures
Exposures included T2DM status, serum glucose, HbA1c, and disease duration of T2DM. T2DM status was defined as following criteria: participants being told by a doctor that they had DM, with diagnosis age ≥30 years; or HbA1c ≥6.5% among those without a self-reported diagnosis, according to the guideline from the American Diabetes Association.9 Serum glucose (nonfasting) was measured by means of a Roche/Hitachi cobas C Chemistry Analyzer (Roche Diagnostics, Indianapolis, IN) or a Roche/Hitachi Modular P Chemistry Analyzer. HbA1c was measured on a Tosoh Automated Analyzer HLC-723G8 (Tosoh Medics, Inc., San Francisco, CA) or a Tosoh G7 Automated HPLC Analyzer.10 Disease duration of T2DM was self-reported (age in years at screening minus age when the doctor told the participants they had DM).
Outcome
The outcome of the present study is lumbar BMD. As a clinical trial outcome, the measurement of BMD at lumbar spine has been used for the assessment and treatment of osteoporosis.11 The measurements of lumbar BMD were provided by the dual-energy X-ray absorptiometry (DXA) scans, acquired on the Hologic Discovery model A densitometers (Hologic, Inc., Bedford, Massachusetts), using software version Apex 3.2. The trained and certified radiology technologists administered the DXA examinations.12
Covariates
Information on age, gender, race, ratio of family income to poverty, educational level, smoked at least 100 cigarettes in life, and vigorous recreational activities were obtained through self-report. Body mass index (BMI) was calculated during the study visit. The detailed process of serum sodium, serum potassium, serum phosphorus, alkaline phosphatase, serum uric acid, blood urea nitrogen, serum creatinine, total protein, total cholesterol, and serum calcium were at the NHANES website.
Statistical Methods
The data analysis in this study took into account sampling weights based on the analytical guideline edited by NCHS, and was conducted using package R version 3.4.3 (http://www.R-project.org) and EmpowerStats software (http://www.empowerstats.com). The significance level was 0.05. The associations of T2DM status, serum glucose, HbA1c, and duration of T2DM with lumbar BMD were evaluated by multivariable logistic regression models. Following the STrengthening the Reporting of OBservational studies in Epidemiology (STROBE) statement guidelines,13 we constructed three models: model 1, no covariates were adjusted; model 2, age, gender, race were adjusted; model 3, the covariates presented in Table 1 were adjusted. Subgroup analyses stratified by gender and T2DM status were also performed.
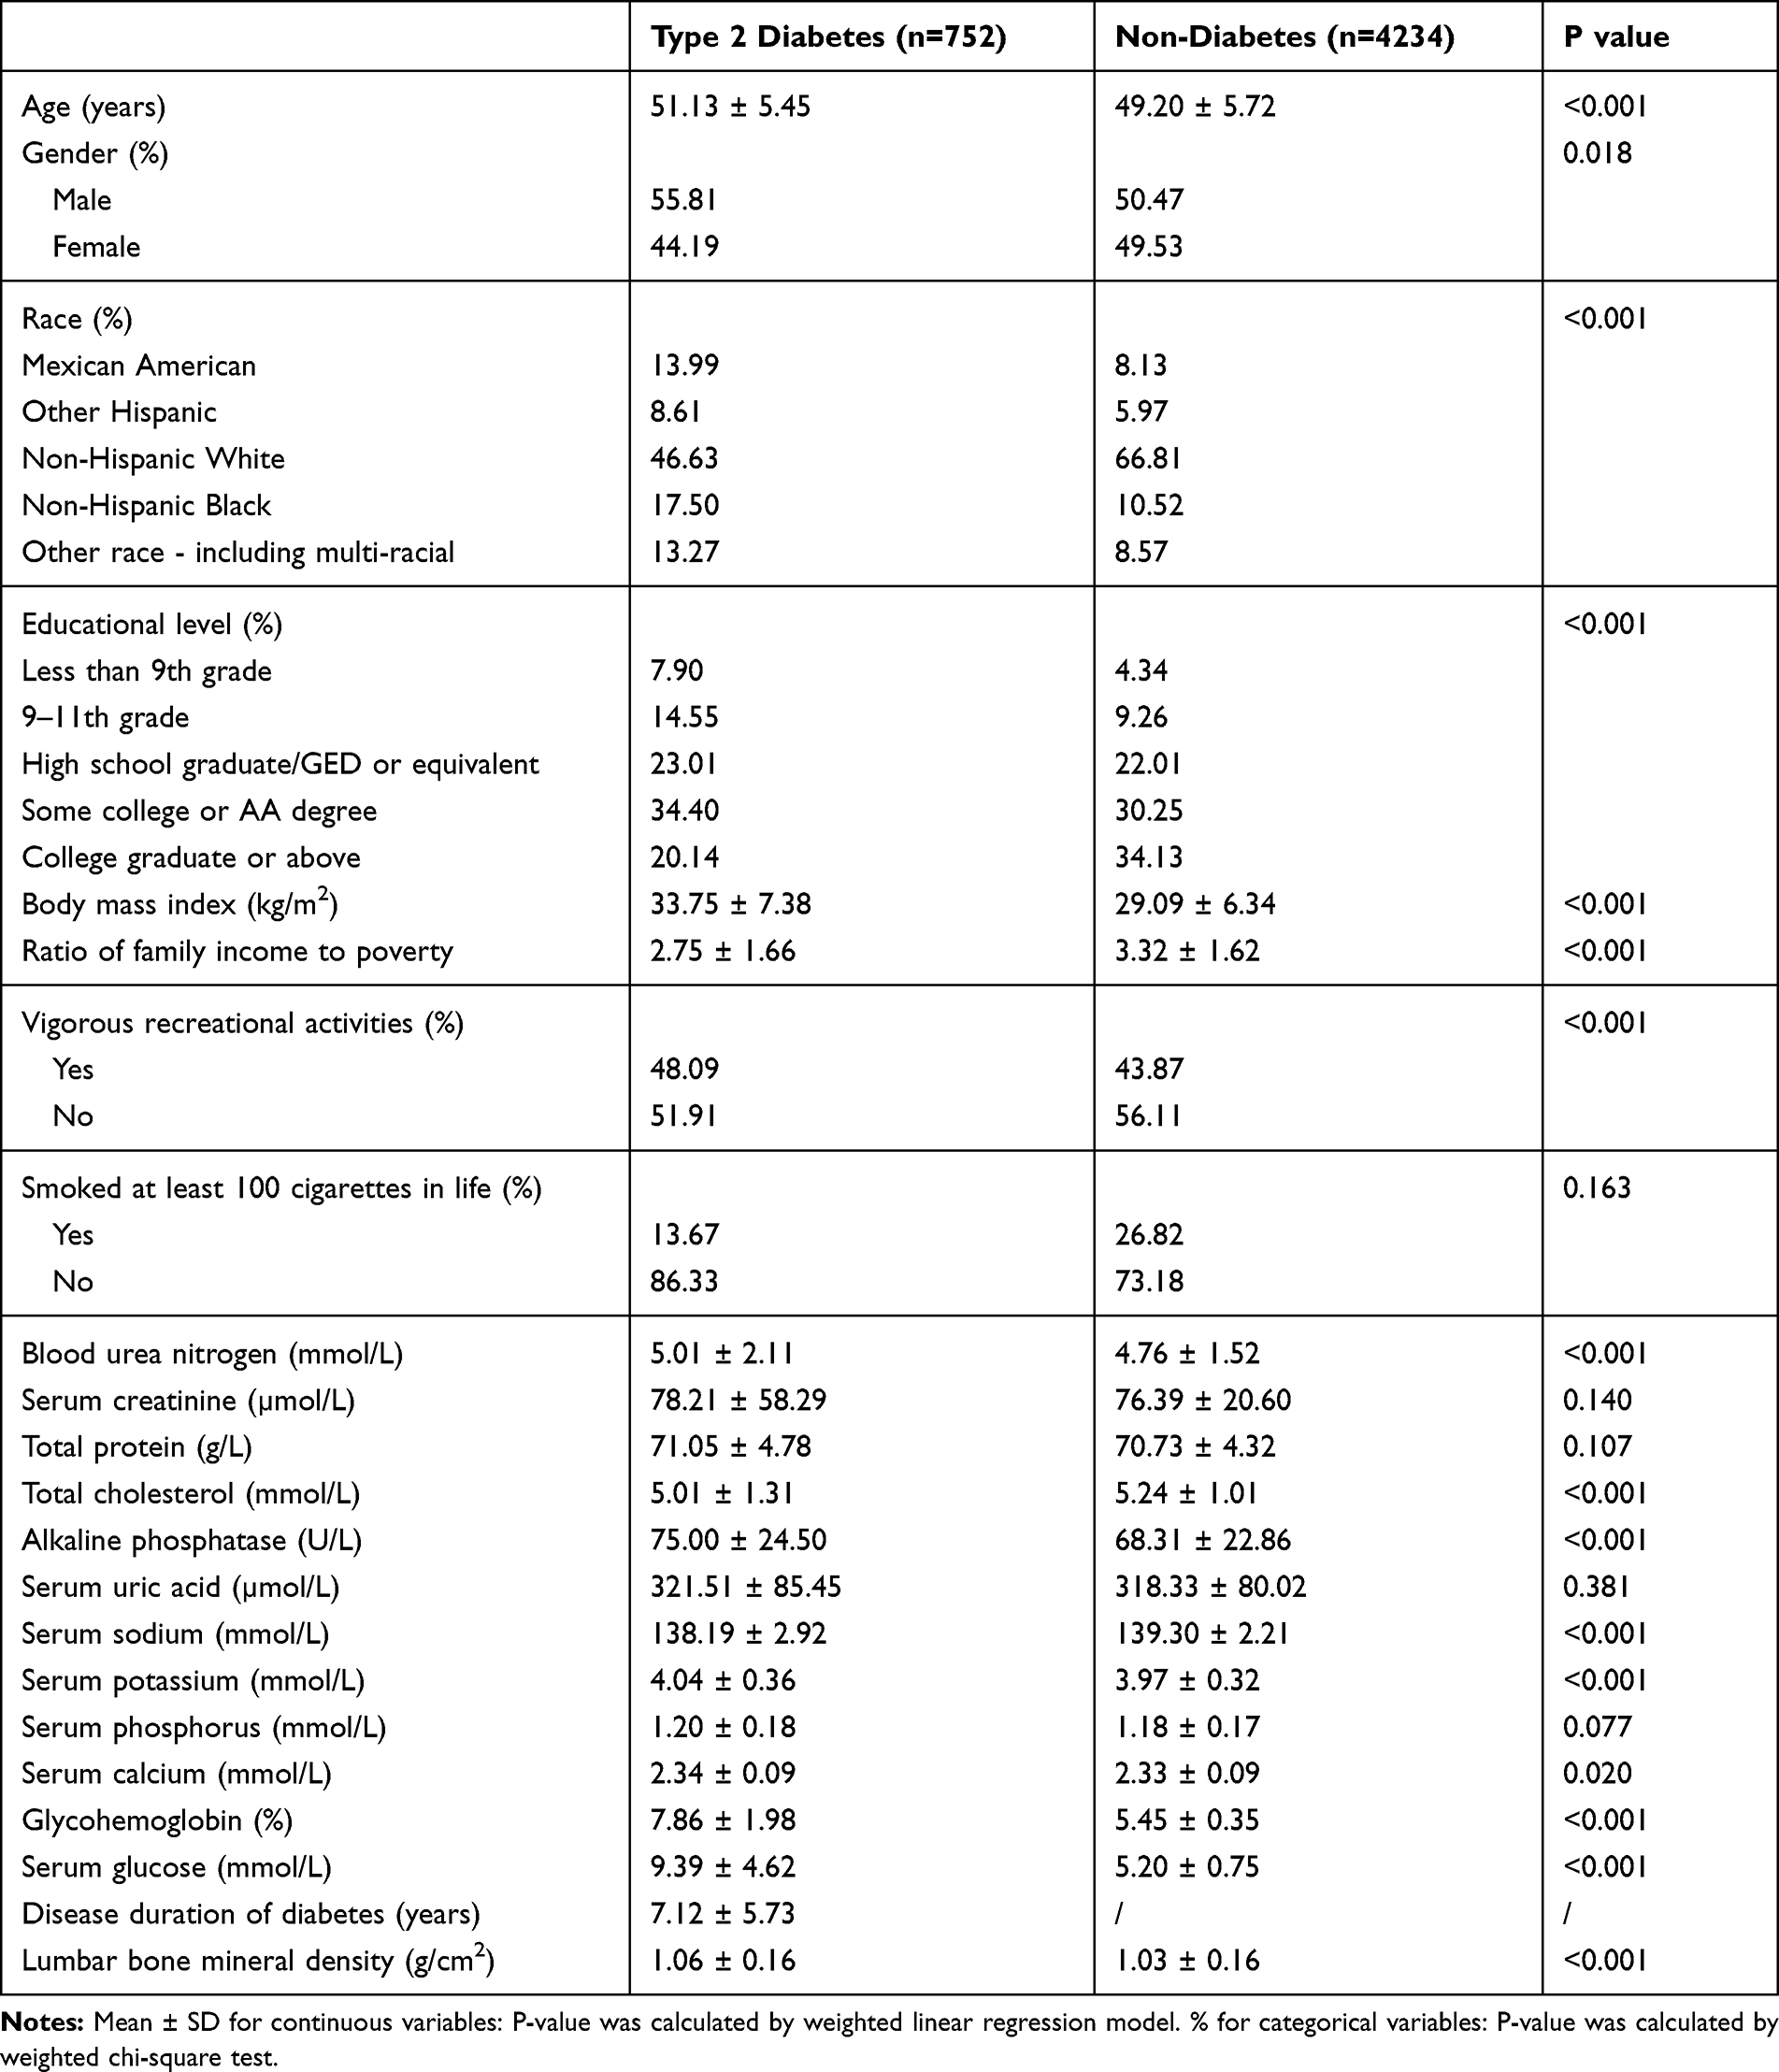 |
Table 1 Weighted Characteristics of Study Sample with and without Type 2 Diabetes |
Results
Adults with T2DM differed from those without DM on a number of demographic and healthcare access characteristics (Table 1). Compared with those without DM, the participants with T2DM were older, more were non-Hispanic black and fewer were non-Hispanic white. Adults with T2DM have higher BMI, lower vigorous recreational activities, ratio of family income to poverty, and educational level. Besides, alkaline phosphatase, total cholesterol, blood urea nitrogen, serum sodium, serum potassium, serum calcium, serum glucose, and HbA1c were all significantly different between the two groups (p< 0.05 for each). It is noteworthy that the lumbar BMD in adults with T2DM was higher compared with those without DM.
Associations of T2DM Status with Lumbar BMD
We found a positive association between T2DM status and lumbar BMD in all three models (model 1: β=0.039, 95% CI: 0.025–0.052; model 2: β=0.045, 95% CI: 0.031–0.059; model 3: β=0.035, 95% CI: 0.014–0.055). In the subgroup analysis stratified by gender, this positive association existed in both gender after adjusting for confounders (males: β=0.033, 95% CI: 0.003–0.062; females: β=0.035, 95% CI: 0.008–0.062). These results are presented in Table 2.
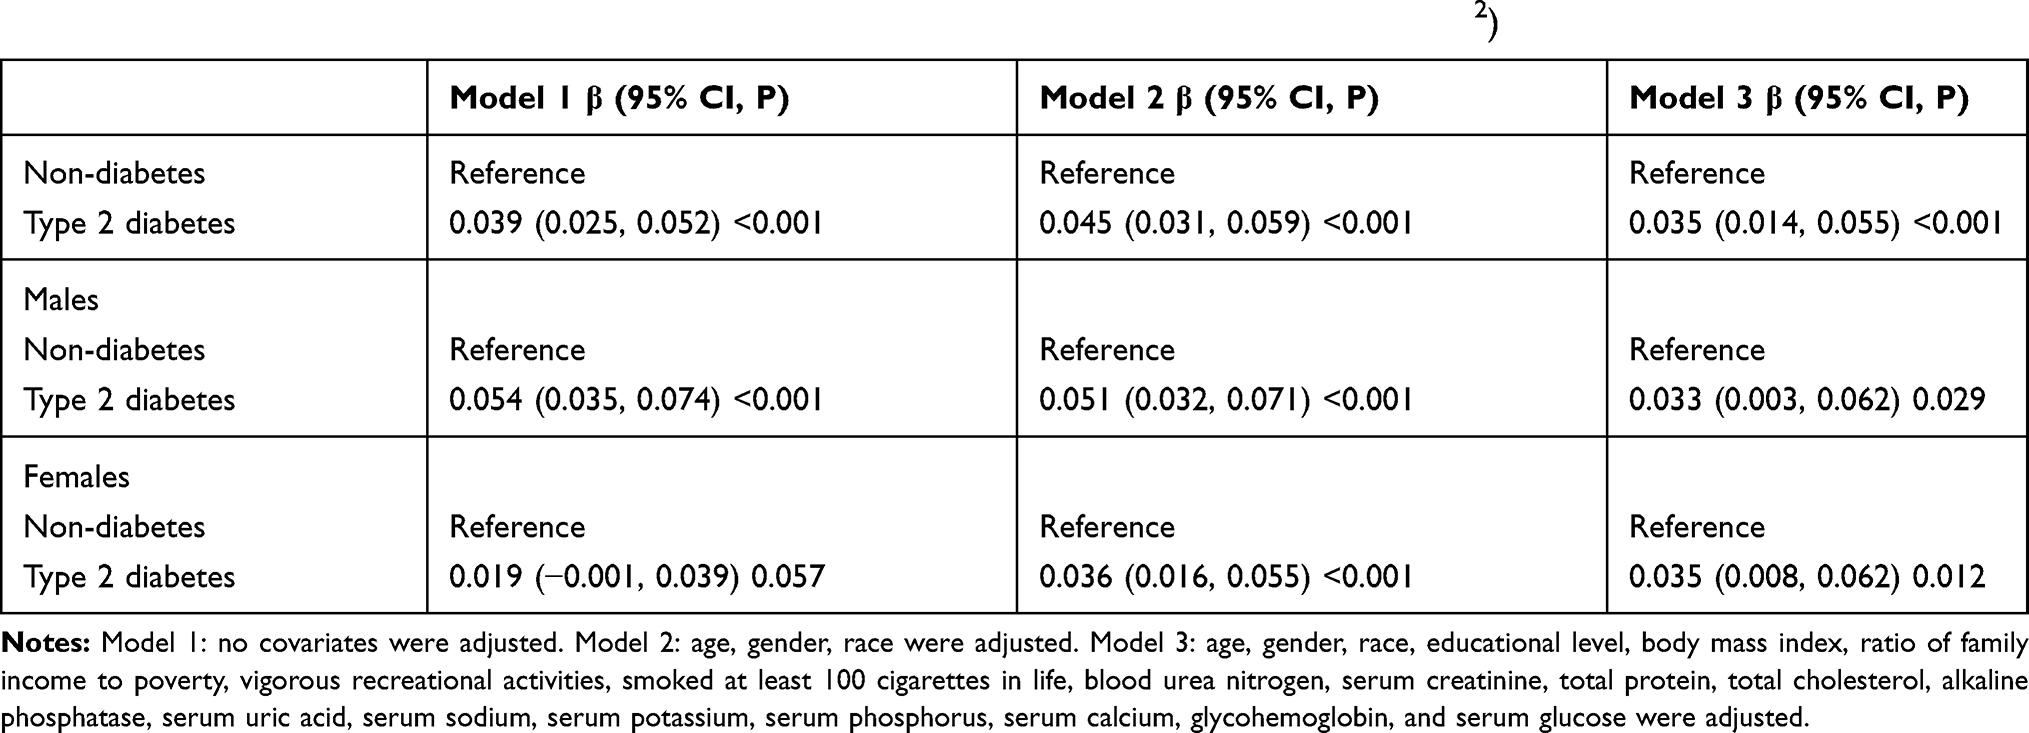 |
Table 2 Associations Between Type 2 Diabetes Status and Lumbar Bone Mineral Density (g/cm2) |
Associations of Serum Glucose with Lumbar BMD
After controlling for potential confounding factors, we found no significant association between serum glucose and lumbar BMD in both genders with or without T2DM (males with diabetes: β= 0.003, 95% CI: −0.004–0.010; females with diabetes: β= 0.001, 95% CI: −0.006–0.008; males without diabetes: β= −0.005, 95% CI: −0.014–0.005; females without diabetes: β= −0.006, 95% CI: −0.016–0.003). The results are shown in Table 3.
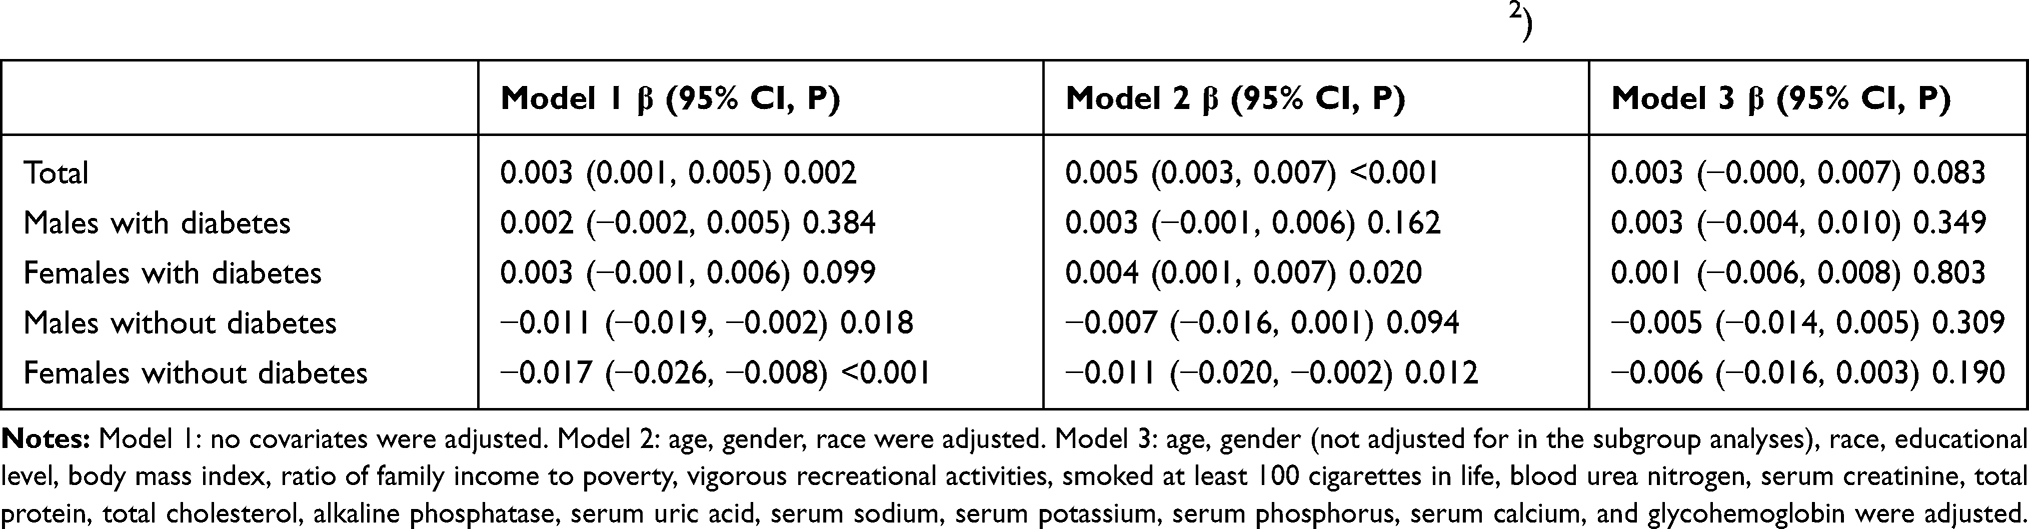 |
Table 3 Associations Between Serum Glucose (mmol/L) and Lumbar Bone Mineral Density (g/cm2) |
Associations of HbA1c with Lumbar BMD
After controlling for potential confounding factors, we found a negative association between HbA1c and lumbar BMD in females without DM (β= −0.030, 95% CI: −0.050–-0.009). No significant association was found in other groups stratified by gender and T2DM (males with diabetes: β= 0.003, 95% CI: −0.013–0.019; females with diabetes: β= 0.006, 95% CI: −0.009–0.021; males without diabetes: β= −0.002, 95% CI: −0.024–0.020). The results are shown in Table 4.
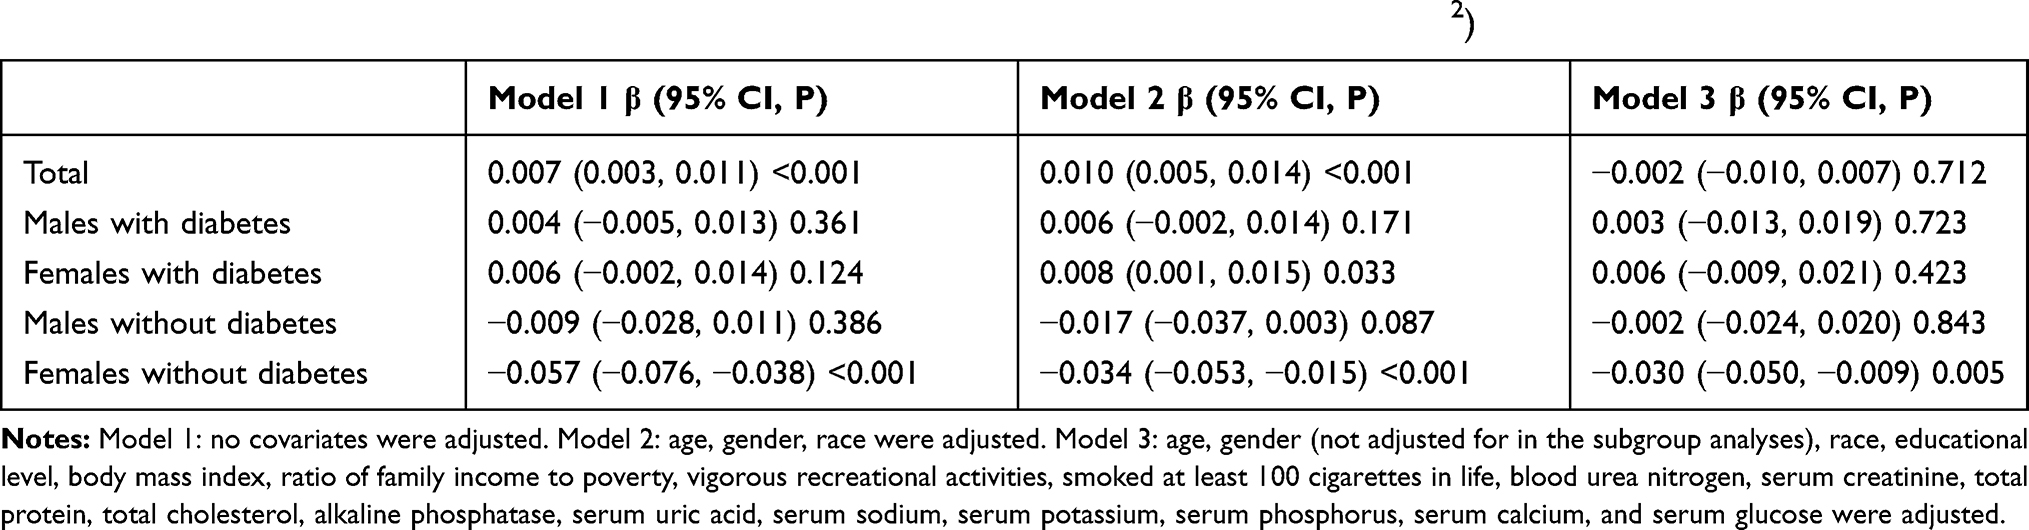 |
Table 4 Associations Between Glycohemoglobin (%) and Lumbar Bone Mineral Density (g/cm2) |
Associations of Disease Duration of T2DM and Lumbar BMD
There was no significant association between disease duration of T2DM and lumbar BMD in both genders in all three models (in the fully adjusted model, for males: β= 0.001, 95% CI: −0.003–0.006; for females: β= −0.001, 95% CI: −0.004–0.003). The results are shown in Table 5.
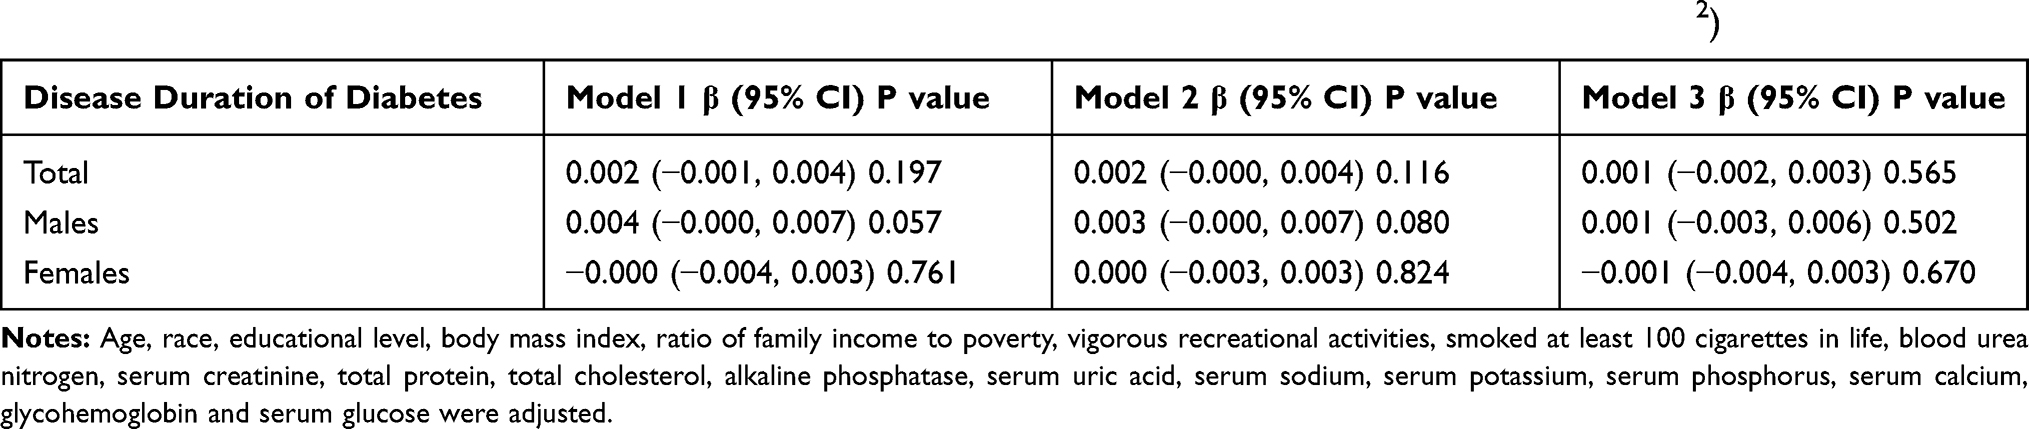 |
Table 5 Associations Between Disease Duration of Diabetes (Years) and Lumbar Bone Mineral Density (g/cm2) |
Discussion
This study investigated the relationships of T2DM, serum glucose, HbA1c, and disease duration of T2DM with lumbar BMD. In summary, our results mainly showed that participants with T2DM had significantly higher lumbar BMD compared with those without DM, and T2DM duration was not associated with lumbar BMD.
DM and osteoporosis are both frequent disorders. However, The correlation of T2DM with BMD remains unclear. Our results support the findings in which those individuals with T2DM had an increased BMD in comparison to those without DM.14–18 T2DM paradoxically associated with increased risk of fracture and normal or higher BMD.19,20 The reduction of bone strength associated with T2DM may not reflect in the BMD measurement. Clinically, DXA has been a gold standard tool to evaluate bone quality. However, DXA-based BMD is 2-dimensional and cannot express other indicators that reflect bone strength, such as advanced glycation end products in bone collagen.21,22 The results of the Vietnam Osteoporosis Study suggested that participants with T2DM have greater trabecular but lower cortical BMD that results in lower bone strength.23,24 For older adults with T2DM, more frequent falls caused by complications from poor balance resulting from neuropathy, cerebral ischemia, and impaired eyesight could also increase fracture risk.25 The different conclusions of the relationship between T2DM and BMD may be attributed to the differences in the selection of patients, BMD examination technology and sites, and study design. Patients with T2DM commonly had a higher BMI,26 which was a protective factor for osteoporosis.27 Therefore, in this study, we adjusted for many factors that might influence T2DM or BMD. Besides, gender may have a critical effect on the relationship of T2DM with BMD. Thus, we performed subgroup analyses stratified by gender in each multivariable logistic regression analysis.
Growing evidence suggested that hyperglycemia may impair bone matrix formation and biochemical competence.28 In a retrospective cross-sectional study in Taiwan, Li et al17 found a positive correlation between blood glucose level and BMD. However, another study conducted in China revealed that two-hour plasma glucose had a negative correlation with lumbar BMD.29 In our study, the mean serum glucose in the subjects with T2DM was much higher than those without DM. However, after controlling for the confounders, there was no significant association between serum glucose and lumbar BMD in both genders with or without DM. These conflicting conclusions may be attributed to the heterogeneity among these studies, including differences in participants selection, study size, study designs, and controlled confounders.
HbA1c has been used as a measure of DM control and the parameter in relation to the risk of complications for decades.30,31 Compared with oral glucose tolerance test, HbA1c level is more comfortable to determine because it is independent of patient prandial status.32 A retrospective case-control study conducted in Singapore showed that participants with HbA1c <6% exhibited an increased risk of hip fracture than those with HbA1c >8%.33 On the contrary, a cohort study in Taiwan showed that patients with T2DM whose HbA1c >9.0% were more likely to have a hip fracture.34 In our study, no significant association between HbA1c and lumbar BMD was found in both genders with T2DM.
The data collection in NHANES is carried out following standardized protocols, and NHANES is designed to provide nationally representative estimates. Therefore, the current findings had a high degree of generalizability. Our study has several limitations. First, duo to the smaller number of participants with measured fasting plasma glucose and unpublished fasting glucose data of NHANES 2017–2018, there is a possibility that participants with DM based on fasting plasma glucose levels were misclassified, which might cause bias in the estimation of the total number of DM. Second, there was no distinction between types of DM in the NHANES database. Following the method of previous studies,35,36 we excluded participants with age of DM onset before age 30 to minimize the number of participants with T1DM. Third, self-reported confounders might be susceptible to self-report bias. Fourth, the nature of the cross-sectional study limited the conclusions to an association and not causality.
In conclusion, this study indicated that middle-aged adults with T2DM had significantly higher lumbar BMD compared with those without DM. To better understand the mechanisms involved in explaining the relationship between T2DM and bone health, more longitudinal studies are needed. Besides, osteoporosis defined by DXA may have several limitations. Thus, the area of bone health in DM requires in-depth research in multiple areas such as diagnostic criteria for osteoporosis, alteration in bone quality, and methods to investigate bone microarchitecture.
Ethical Statement
The ethics review board of the National Center for Health Statistics approved all NHANES protocols and written informed consents were obtained from all participants.
Acknowledgments
The authors thank the staff and the participants of the NHANES study for their valuable contributions.
Author Contributions
All authors made a significant contribution to the work reported, whether that is in the conception, study design, execution, acquisition of data, analysis and interpretation, or in all these areas; took part in drafting, revising or critically reviewing the article; gave final approval of the version to be published; have agreed on the journal to which the article has been submitted; and agree to be accountable for all aspects of the work.
Funding
This study received no funding.
Disclosure
The authors report no conflicts of interest for this work.
References
1. Mohsin S, Baniyas MM, AlDarmaki RS, et al. An update on therapies for the treatment of diabetes-induced osteoporosis. Expert Opin Biol Ther. 2019;19(9):937–948. doi:10.1080/14712598.2019.1618266
2. American Diabetes Association. Report of the expert committee on the diagnosis and classification of diabetes mellitus. Diabetes Care. 2003;26(Suppl 1):S5–S20. doi:10.2337/diacare.26.2007.S5
3. Ham JR, Choi RY, Lee HI, et al. Methoxsalen and bergapten prevent diabetes-induced osteoporosis by the suppression of osteoclastogenic gene expression in mice. Int J Mol Sci. 2019;20(6):1298. doi:10.3390/ijms20061298
4. DeShields SC, Cunningham TD. Comparison of osteoporosis in US adults with type 1 and type 2 diabetes mellitus. J Endocrinol Invest. 2018;41(9):1051–1060. doi:10.1007/s40618-018-0828-x
5. van Daele PL, Stolk RP, Burger H, et al. Bone density in non-insulin-dependent diabetes mellitus. The Rotterdam Study. Ann Intern Med. 1995;122(6):409–414. doi:10.7326/0003-4819-122-6-199503150-00002
6. Yaturu S, Humphrey S, Landry C, et al. Decreased bone mineral density in men with metabolic syndrome alone and with type 2 diabetes. Med Sci Monit. 2009;15(1):Cr5–9.
7. Majima T, Komatsu Y, Yamada T, et al. Decreased bone mineral density at the distal radius, but not at the lumbar spine or the femoral neck, in Japanese type 2 diabetic patients. Osteoporos Int. 2005;16(8):907–913. doi:10.1007/s00198-004-1786-z
8. Mathen PG, Thabah MM, Zachariah B, et al. Decreased bone mineral density at the femoral neck and lumbar spine in south Indian patients with type 2 diabetes. J Clin Diagn Res. 2015;9(9):Oc08–Oc12. doi:10.7860/JCDR/2015/14390.6450
9. American Diabetes Association. 2. Classification and diagnosis of diabetes: standards of medical care in diabetes-2019. Diabetes Care. 2019;42(Suppl1):S13–S28. doi:10.2337/dc19-S002
10. Muntner P, Whelton PK, Woodward M, et al. A Comparison of the 2017 American College of Cardiology/American Heart Association Blood Pressure Guideline and the 2017 American Diabetes Association Diabetes and Hypertension Position Statement for U.S. Adults With Diabetes. Diabetes Care. 2018;41(11):2322–2329. doi:10.2337/dc18-1307
11. Kanis JA, Johnell O. Requirements for DXA for the management of osteoporosis in Europe. Osteoporos Int. 2005;16(3):229–238. doi:10.1007/s00198-004-1811-2
12. Centers for Disease Control and Prevention, 2018 Centers for Disease Control and Prevention. National Health and Nutrition Examination Survey; 2018. Available from: https://www.cdc.gov/nchs/nhanes/index.htm.
13. von Elm E, Altman DG, Egger M, et al. The strengthening the reporting of observational studies in epidemiology (STROBE) statement: guidelines for reporting observational studies. Lancet (London, England). 2007;370(9596):1453–1457. doi:10.1016/S0140-6736(07)61602-X
14. de Liefde II, van der Klift M, de Laet CE, et al. Bone mineral density and fracture risk in type-2 diabetes mellitus: the Rotterdam Study. Osteoporos Int. 2005;16(12):1713–1720. doi:10.1007/s00198-005-1909-1
15. Leidig-Bruckner G, Grobholz S, Bruckner T, et al. Prevalence and determinants of osteoporosis in patients with type 1 and type 2 diabetes mellitus. BMC Endocr Disord. 2014;14:33. doi:10.1186/1472-6823-14-33
16. Janghorbani M, Van Dam RM, Willett WC, et al. Systematic review of type 1 and type 2 diabetes mellitus and risk of fracture. Am J Epidemiol. 2007;166(5):495–505. doi:10.1093/aje/kwm106
17. Li KH, Liu YT, Yang YW, et al. A positive correlation between blood glucose level and bone mineral density in Taiwan. Arch Osteoporos. 2018;13(1):78. doi:10.1007/s11657-018-0494-9
18. Jang M, Kim H, Lea S, et al. Effect of duration of diabetes on bone mineral density: a population study on East Asian males. BMC Endocr Disord. 2018;18(1):61. doi:10.1186/s12902-018-0290-y
19. Bonds DE, Larson JC, Schwartz AV, et al. Risk of fracture in women with type 2 diabetes: the Women’s Health Initiative Observational Study. J Clin Endocrinol Metab. 2006;91(9):3404–3410. doi:10.1210/jc.2006-0614
20. Jackuliak P, Payer J. Osteoporosis, fractures, and diabetes. Int J Endocrinol. 2014;2014:820615. doi:10.1155/2014/820615
21. Vestergaard P. Discrepancies in bone mineral density and fracture risk in patients with type 1 and type 2 diabetes–a meta-analysis. Osteoporos Int. 2007;18(4):427–444. doi:10.1007/s00198-006-0253-4
22. Vashishth D. The role of the collagen matrix in skeletal fragility. Curr Osteoporos Rep. 2007;5(2):62–66. doi:10.1007/s11914-007-0004-2
23. Ho-Pham LT, Chau PMN, Do AT, et al. Type 2 diabetes is associated with higher trabecular bone density but lower cortical bone density: the Vietnam Osteoporosis Study. Osteoporos Int. 2018;29(9):2059–2067. doi:10.1007/s00198-018-4579-5
24. Ho-Pham LT, Tran B, Do AT, et al. Association between pre-diabetes, type 2 diabetes and trabecular bone score: the Vietnam Osteoporosis Study. Diabetes Res Clin Pract. 2019;155:107790. doi:10.1016/j.diabres.2019.107790
25. Schwartz AV, Hillier TA, Sellmeyer DE, et al. Older women with diabetes have a higher risk of falls: a prospective study. Diabetes Care. 2002;25(10):1749–1754. doi:10.2337/diacare.25.10.1749
26. Seiglie JA, Marcus ME, Ebert C, et al. Diabetes prevalence and its relationship with education, wealth, and BMI in 29 low- and middle-income countries. Diabetes Care. 2020;43(4):767–775. doi:10.2337/dc19-1782
27. Franco-Trepat E, Guillan-Fresco M, Alonso-Perez A, et al. Visfatin connection: present and future in osteoarthritis and osteoporosis. J Clin Med. 2019;8(8):1178. doi:10.3390/jcm8081178
28. Starup-Linde J, Vestergaard P. Management of endocrine disease: diabetes and osteoporosis: cause for concern? Eur J Endocrinol. 2015;173(3):R93–R99. doi:10.1530/EJE-15-0155
29. Jia X, Liu L, Wang R, et al. Relationship of two-hour plasma glucose and abdominal visceral fat with bone mineral density and bone mineral content in women with different glucose metabolism status. Diabetes Metab Syndr Obes. 2020;13:851–858. doi:10.2147/DMSO.S245096
30. UK Prospective Diabetes Study (UKPDS) Group. Intensive blood-glucose control with sulphonylureas or insulin compared with conventional treatment and risk of complications in patients with type 2 diabetes (UKPDS 33). Lancet (London, England). 1998;352(9131):837–853. doi:10.1016/S0140-6736(98)07019-6
31. Holman RR, Paul SK, Bethel MA, et al. 10-year follow-up of intensive glucose control in type 2 diabetes. N Engl J Med. 2008;359(15):1577–1589. doi:10.1056/NEJMoa0806470
32. Khaw KT, Wareham N, Bingham S, et al. Association of hemoglobin A1c with cardiovascular disease and mortality in adults: the European prospective investigation into cancer in Norfolk. Ann Intern Med. 2004;141(6):413–420. doi:10.7326/0003-4819-141-6-200409210-00006
33. Puar TH, Khoo JJ, Cho LW, et al. Association between glycemic control and hip fracture. J Am Geriatr Soc. 2012;60(8):1493–1497. doi:10.1111/j.1532-5415.2012.04052.x
34. Li CI, Liu CS, Lin WY, et al. Glycated hemoglobin level and risk of hip fracture in older people with Type 2 diabetes: a competing risk analysis of Taiwan Diabetes Cohort Study. J Bone Miner Res. 2015;30(7):1338–1346. doi:10.1002/jbmr.2462
35. Andary R, Fan W, Wong ND. Control of cardiovascular risk factors among US adults with type 2 diabetes with and without cardiovascular disease. Am J Cardiol. 2019;124(4):522–527. doi:10.1016/j.amjcard.2019.05.035
36. Wong ND, Patao C, Wong K, et al. Trends in control of cardiovascular risk factors among US adults with type 2 diabetes from 1999 to 2010: comparison by prevalent cardiovascular disease status. Diab Vasc Dis Res. 2013;10(6):505–513. doi:10.1177/1479164113496828
 © 2020 The Author(s). This work is published and licensed by Dove Medical Press Limited. The
full terms of this license are available at https://www.dovepress.com/terms
and incorporate the Creative Commons Attribution
- Non Commercial (unported, 3.0) License.
By accessing the work you hereby accept the Terms. Non-commercial uses of the work are permitted
without any further permission from Dove Medical Press Limited, provided the work is properly
attributed. For permission for commercial use of this work, please see paragraphs 4.2 and 5 of our Terms.
© 2020 The Author(s). This work is published and licensed by Dove Medical Press Limited. The
full terms of this license are available at https://www.dovepress.com/terms
and incorporate the Creative Commons Attribution
- Non Commercial (unported, 3.0) License.
By accessing the work you hereby accept the Terms. Non-commercial uses of the work are permitted
without any further permission from Dove Medical Press Limited, provided the work is properly
attributed. For permission for commercial use of this work, please see paragraphs 4.2 and 5 of our Terms.