")
Back to Journals » Diabetes, Metabolic Syndrome and Obesity » Volume 16
The Correlation Between Thyroid Parameters and the Ratios of Neutrophil/Lymphocyte and Platelet/Lymphocyte in Euthyroid Type 2 Diabetic Patients
Authors Chen H , Ju JQ, Qian XW, Zhu ZT, Zhao CZ, Liu Z
Received 2 September 2023
Accepted for publication 8 November 2023
Published 22 November 2023 Volume 2023:16 Pages 3763—3771
DOI https://doi.org/10.2147/DMSO.S431941
Checked for plagiarism Yes
Review by Single anonymous peer review
Peer reviewer comments 2
Editor who approved publication: Prof. Dr. Muthuswamy Balasubramanyam
Hui Chen, Jun-Qiang Ju, Xiao-Wu Qian, Zheng-Tai Zhu, Chun-Zhi Zhao, Zhe Liu
Department of Geriatrics, Taizhou People’s Hospital Affiliated to Nanjing Medical University, Taizhou, Jiangsu, People’s Republic of China
Correspondence: Hui Chen, Department of Geriatrics, Taizhou People’s Hospital Affiliated to Nanjing Medical University, No. 399 Hailing South Road, Taizhou, Jiangsu, People’s Republic of China, Tel +86 15996006135, Email [email protected]
Purpose: To investigate the thyroid parameters (thyroid stimulating hormone (TSH), free triiodothyronine (FT3), and free thyroxine (FT4)) and their relationship with inflammatory indicators (neutrophil/lymphocyte ratio (NLR) and platelet/lymphocyte ratio (PLR)) in euthyroid individuals with type 2 diabetes mellitus (T2DM).
Patients and Methods: Our study included 672 participants diagnosed with T2DM, and 336 healthy individuals matched in terms of age and gender. The laboratory inspection data of both type 2 diabetic patients and healthy individuals as controls were analyzed separately.
Results: Compared with a control group, the individuals with T2DM presented elevated levels of inflammatory indicators, including white blood cells (WBC), neutrophils (NEUT), neutrophil/lymphocyte ratio (NLR), and platelet/lymphocyte ratio (PLR). The levels of TSH are elevated in the T2DM group, whereas the levels of FT3 or FT4 are reduced. TSH levels were significantly positively correlated with NLR or PLR, while the levels of FT3 and FT4 were significantly negatively correlated with NLR or PLR. Furthermore, thyroid parameters were correlated with gender, age, and blood lipid metabolism. Multiple stepwise regression analysis identified gender, NLR, PLR, and low-density lipoprotein (LDL) as significant contributing factors for TSH. Additionally, gender, age, NLR, PLR, glycated hemoglobin A1c (HbA1c), and LDL were identified as contributing factors for FT3, while PLR and total cholesterol (TC) were identified as contributing factors for FT4.
Conclusion: Abnormal metabolism of thyroid parameters is associated with increased inflammatory activity and impaired glycolipid metabolism in euthyroid type 2 diabetic patients.
Keywords: thyroid parameters, thyroid function, type 2 diabetes mellitus, neutrophil/lymphocyte ratio, platelet/lymphocyte ratio
Introduction
Diabetes mellitus (DM) is a common chronic disease of the endocrine system, which has become an important public health issue that badly influences people’s physical and mental health.1 According to the latest data from the International Diabetes Federation (IDF), the worldwide incidence of DM among people aged 20–79 in 2021 stands at 536.6 million (10.5%). China alone accounts for approximately 140.9 million cases, making it the highest in the world.2 Apart from the acute and chronic complications, DM can be complexed by the co-morbidity of other endocrine disorders, with thyroid disease (TD) being the most commonly observed. The association between DM and TD is marked by a complex interdependence.3,4
Thyroid hormones (THs) regulate various metabolic processes, including glucose homeostasis and insulin secretion.5 Thyroid dysfunction can affect the metabolism of carbohydrates, proteins, and lipids, worsen diabetes, and promote the development of diabetic complications.6 Numerous epidemiological studies have demonstrated a higher incidence of thyroid dysfunction in individuals with DM in comparison to those with normal glucose tolerance (NGT).7–10 Conversely, individuals with TD have a comparatively high risk of developing DM,11–13 and even variations within the normal range of thyroid function have been reported as additional risk factors for DM.14,15 These changes are also closely linked to an increased risk of diabetic complications.16,17
Earlier studies have suggested that the variations of thyroid markers are most likely influenced by circulating inflammatory markers.18–20 Low-grade inflammation is a common feature of DM. Studies have shown that increased inflammatory activity plays a crucial role in thyroid function abnormalities in both type-1 and type-2 DM.21–23 Based on these findings, we hypothesized that there is a mutual relationship between the variation of thyroid parameters and circulating inflammatory indicators in Chinese individuals with type-2 DM (T2DM). To test the hypothesis, we first calculated the disparity in thyroid markers between euthyroid individuals with T2DM and NGT. Then, we evaluated the correlation between thyroid parameters and markers of inflammation, specifically the neutrophil/lymphocyte ratio (NLR) and the platelet/lymphocyte ratio (PLR), as well as impaired glycolipid metabolism in individuals with T2DM.
Materials and Methods
Participants
This study is a cross-sectional study conducted in hospitals. We recruited all patients diagnosed with T2DM with normal thyroid function and aged ≥18 years who attended the Department of Endocrinology and Department of Geriatrics at Taizhou People’s Hospital between January 2021 and December 2022 as study participants. The participants listed below were excluded: 1) acute complications of T2DM; 2) history of thyroid disorders, such as hyperthyroidism, hypothyroidism, or subacute thyroiditis; 3) thyroid tumor or previous treatment with radioactive iodine or surgery; 4) other metabolic disorders, such as pituitary adenoma, hypopituitarism, and hypothalamic disease; 5) use of thyroid drugs or any other medication that may affect thyroid function; 6) history of diseases associated with a proinflammatory condition, such as inflammatory, autoimmune, hematological, and connective tissue diseases; 7) history of illnesses related to euthyroid sick syndrome, including severe liver or kidney disease, cardiopulmonary failure, and malignant tumor; 8) recent acute illness, such as trauma, surgery, and acute cerebrovascular disease within the past six months. A total of 672 individuals with a diagnosis of T2DM, aged ≥18 years, and with normal thyroid function were included in this study. The control group consisted of 336 individuals with NGT and normal thyroid function. These individuals were recruited from healthy individuals who underwent physical examinations during the same period and were paired by age and gender. Ethics approval was obtained from the Ethics Committee of Taizhou People’s Hospital Affiliated to Nanjing Medical University (KY 2022-115-01), and the research followed the principles set out in the Declaration of Helsinki. All participants provided written informed consent.
Data Collection
General clinical parameters, such as age, gender, height, weight, duration of diabetes mellitus (DM duration), history of hypertension and hyperlipidemia, medication history, and the existence of chronic complications (retinopathy, nephropathy, neuropathy, and lower extremity arterial disease), were obtained from the case histories. The calculation of the body mass index (BMI) entails the division of an individual’s weight in kilograms by the square of their height in meters. Blood pressure, encompassing both systolic (SBP) and diastolic (DBP) measurements, was assessed following a period of sitting and resting for more than 10 minutes. We also obtained the following biochemical parameters: fasting blood glucose (FBG) and lipid parameters (triglyceride [TG], total cholesterol [TC], low-density lipoprotein cholesterol [LDL], and high-density lipoprotein [HDL]). These parameters were measured by a fully automated biochemical analyzer. Additionally, glycated hemoglobin (HbA1c) was determined using high-performance liquid chromatography. Blood routine parameters, including white blood cells (WBC), neutrophils (NEUT), lymphocytes (LY), and platelets (PLT), were analyzed using an automated blood cell analyzer. The calculation of the NLR involved determining the ratio between the absolute number of neutrophils (NEUT) and lymphocytes (LY). Similarly, the PLR was calculated by dividing the count of platelets (PLT) by the count of lymphocytes (LY). THs, namely free triiodothyronine (FT3) and free thyroxine (FT4), and thyroid stimulating hormone (TSH) were quantified using chemiluminescence immunoassays. Reference ranges for thyroid function were established for FT3 (3.28–6.547pmol/L), FT4 (7.64–16.03pmol/L), and TSH (0.49–4.91mU/L). The normal range of thyroid function is defined as a state in which the levels of FT3, FT4, and TSH are within their respective normal limits.
Statistical Analysis
To conduct data analysis, we have obtained the SPSS 26.0 statistical software. Continuous variables were represented as either mean ± standard deviation (SD) or median (interquartile range). Discontinuous variables were quantified in terms of frequency (percentage). The Student’s t-test was conducted to compare the means of continuous variables. Spearman correlation analysis was used to evaluate the relationship between TSH, FT3, and FT4 levels and other variables, including inflammatory indicators. Multiple stepwise regression analysis was performed in order to identify the independent contributing factors for TSH, FT3, and FT4. P value below 0.05 was considered to indicate statistical significance.
Results
Clinical and Laboratory Characteristics of the Type 2 Diabetes Group and the Control Group
The average duration of diabetes was 8.52±6.03 years. The patients with T2DM experienced various complications, including hyperlipidemia (55.4%), hypertension (45.2%), retinopathy (29.6%), nephropathy (37.2%), neuropathy (47.0%), and lower extremity arterial disease (30.4%). Except for a minority of recently diagnosed patients who controlled their diabetes through dietary measures (10.5%), the majority of patients were prescribed oral hypoglycemic drugs (46.4%), insulin (28.6%), or a combination of oral medications and insulin (14.4%).
The clinical and laboratory characteristics of the T2DM group and the control group were summarized in Table 1. These two groups were paired by gender and age. Compared with a control group, individuals with T2DM exhibited significant increases in BMI, FBG, HbA1c, TG, TC, LDL, WBC, NEUT, NLR, and PLR, while HDL levels decreased (P<0.05). Additionally, the levels of TSH were found to be elevated in individuals with T2DM compared with the control group. Conversely, a notable reduction in the levels of FT3 and FT4 was observed among individuals with T2DM (P<0.05).
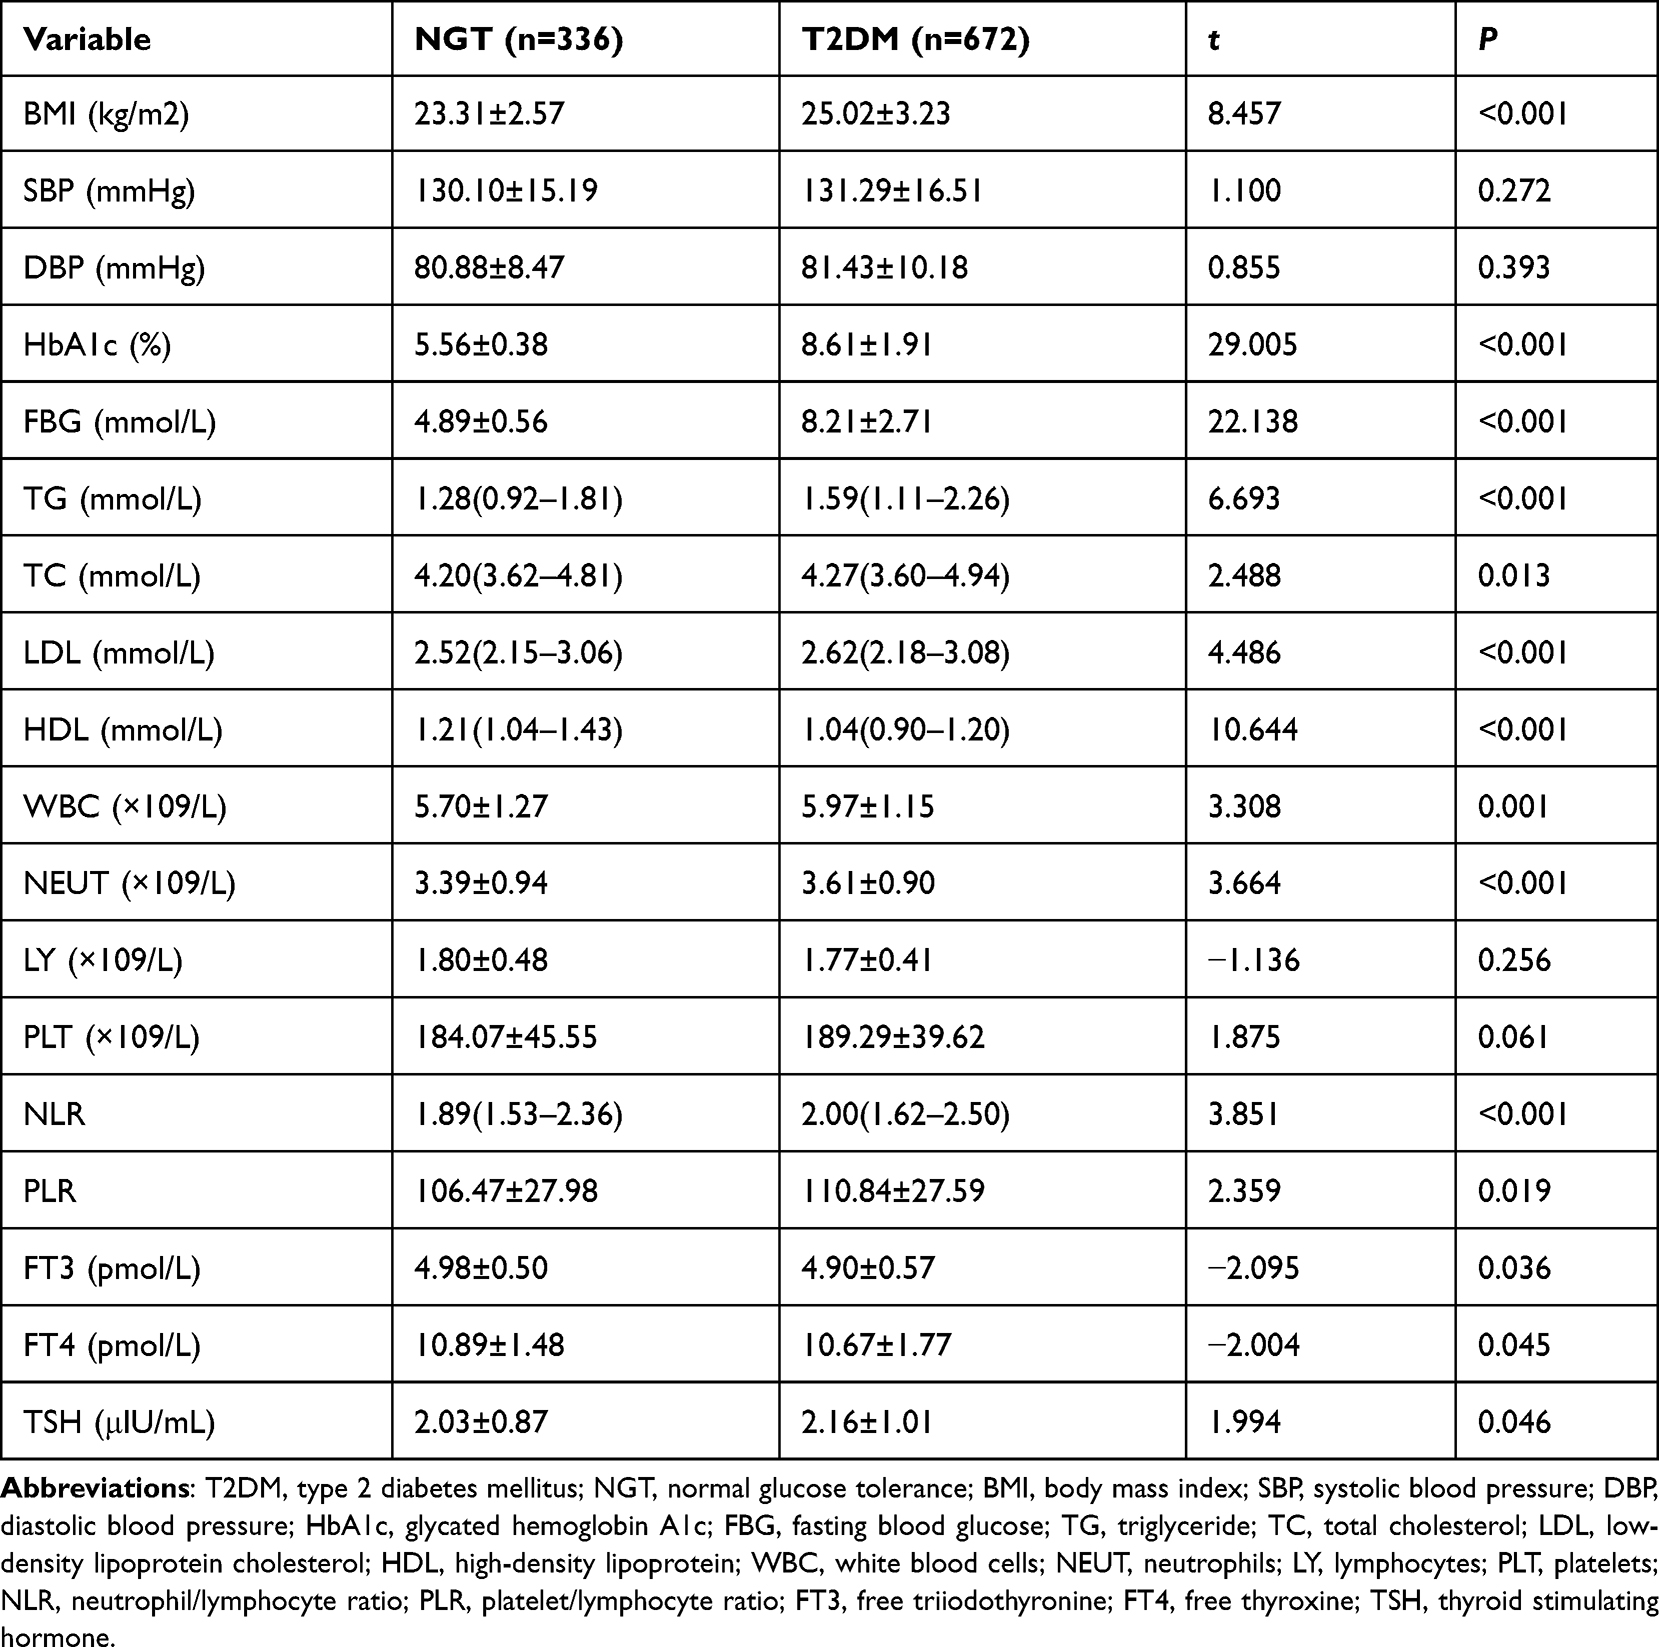 |
Table 1 Clinical and Laboratory Characteristics of the Type 2 Diabetes Group and the Control Group |
Correlation Between Thyroid Parameters and Glycolipid Metabolic Parameters and Inflammatory Markers in Individuals with Type 2 Diabetes
Table 2 presented the findings of the Spearman correlation analysis conducted to examine the relationship between thyroid parameters, glycolipid metabolic parameters, and inflammatory indicators in individuals with T2DM. TSH showed a significant positive correlation with TG, TC, LDL, NEUT, NLR, and PLR (P<0.05). Conversely, TSH exhibited a negative correlation with LY (P<0.05). The FT3 levels exhibited significantly negatively correlated with age, DM duration, HbA1c, TG, TC, LDL, HDL, NEUT, NLR, and PLR (P<0.05). A positive association was found between FT3 levels and LY (P<0.05). Additionally, the levels of FT4 exhibited a significant negative association with TG, TC, LDL, HDL, NLR, and PLR (P<0.05). A positive association was found between levels of FT4 and LY (P<0.05).
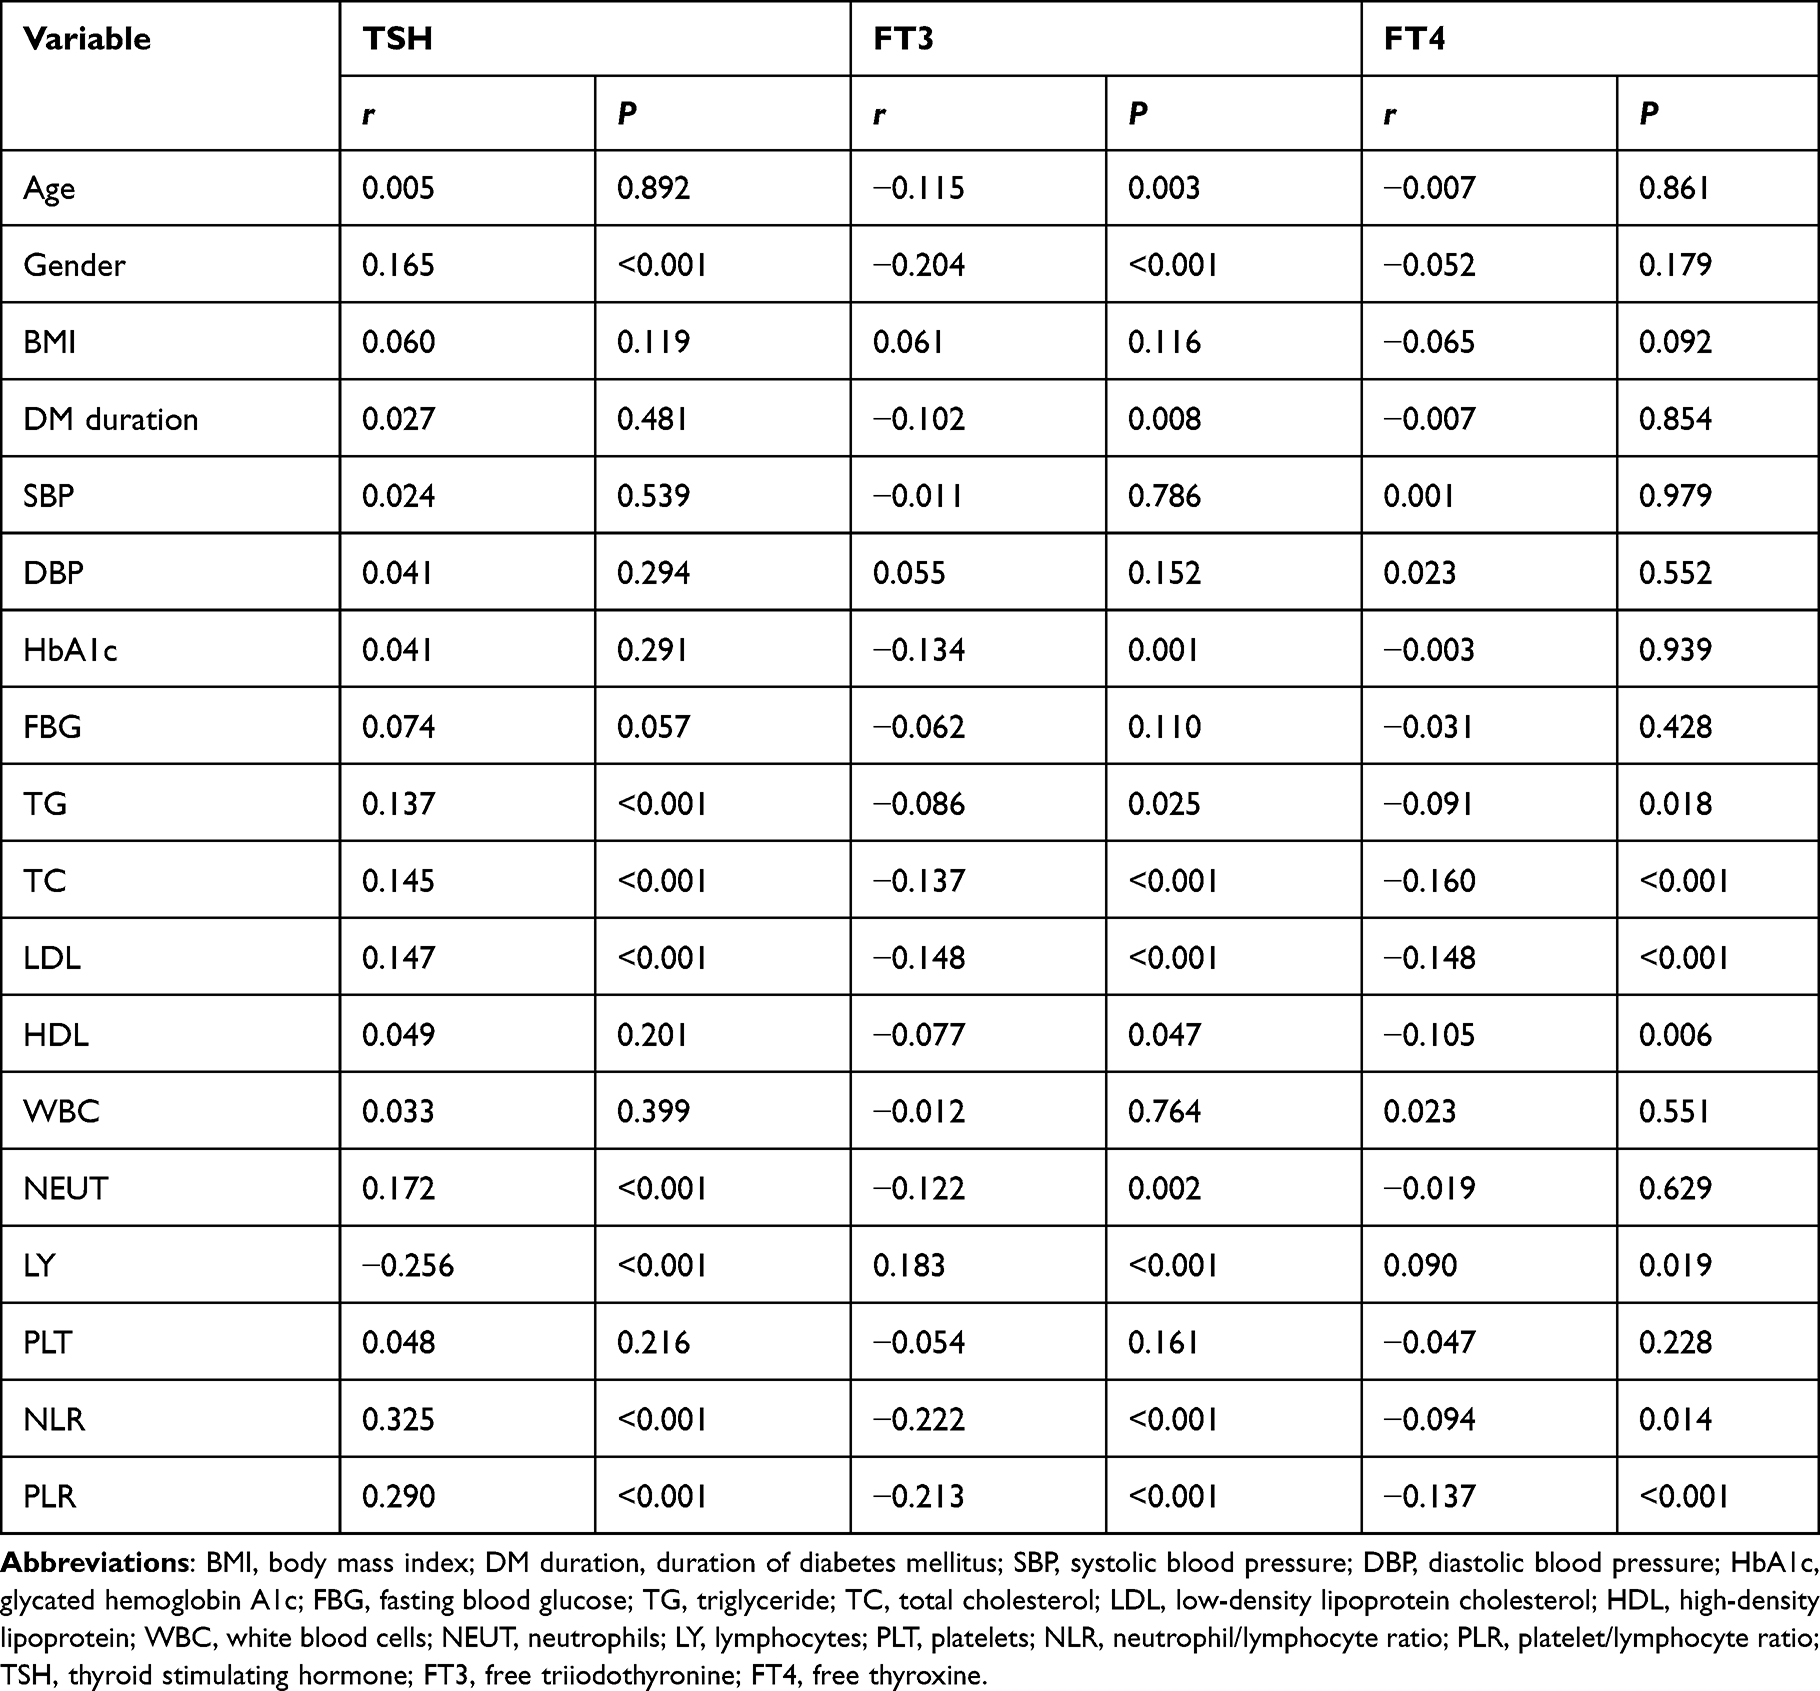 |
Table 2 Correlation Between Thyroid Parameters and Glycolipid Metabolic Parameters and Inflammatory Markers in Individuals with Type 2 Diabetes |
Multiple Stepwise Regression Analysis for Thyroid Parameters in Individuals with Type 2 Diabetes
Multiple stepwise regression analyses were conducted with TSH, FT3, and FT4 as dependent variables, respectively, and gender (coded as 0 for male and 1 for female), age, BMI, DM duration, glycolipid metabolic parameters, and inflammatory indicators as independent variables in patients with T2DM. We calculated the regression coefficient, accompanied by 95% confidence intervals. Multiple stepwise regression analysis demonstrated that gender, NLR, PLR, and LDL were found to be independent contributing factors for TSH in patients with T2DM (Table 3). Additionally, gender, age, NLR, PLR, HbA1c, and LDL were identified as independent contributing factors for FT3 (Table 4). On the other hand, PLR and TC were found to be independent contributing factors for FT4 (Table 5).
 |
Table 3 Multiple Stepwise Regression Analysis of Contributing Factors for TSH in Individuals with Type 2 Diabetes |
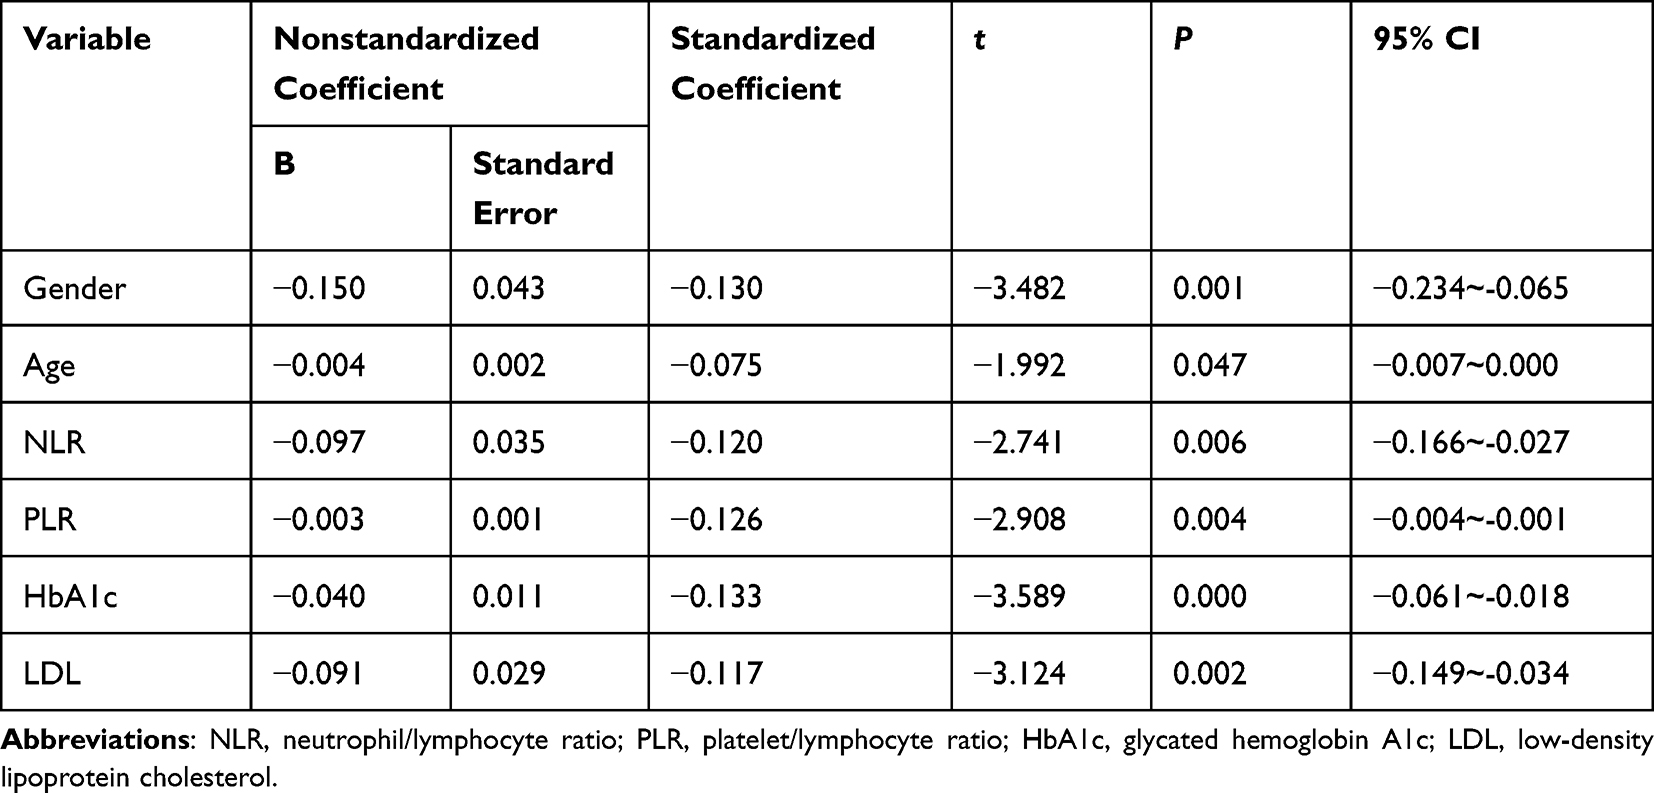 |
Table 4 Multiple Stepwise Regression Analysis of Contributing Factors for FT3 in Individuals with Type 2 Diabetes |
 |
Table 5 Multiple Stepwise Regression Analysis of Contributing Factors for FT4 in Individuals with Type 2 Diabetes |
Discussion
The primary objective of this investigative study was to evaluate the correlation between thyroid markers and inflammatory indicators, specifically NLR and PLR, in euthyroid individuals with T2DM. This study’s findings revealed that individuals with T2DM exhibited heightened TSH levels and decreased levels of FT3 or FT4 in comparison to healthy individuals of similar age and gender. We have also demonstrated a significant correlation between elevated TSH levels or reduced levels of FT3 and FT4 in individuals with T2DM and increased circulating levels of NLR or PLR.
THs are secreted by thyroid gland and regulated by pituitary TSH. THs can promote growth and development, as well as regulate various physiological processes, including lipid, protein, and carbohydrate metabolism. Our study revealed that individuals with T2DM exhibited elevated TSH levels and reduced levels of FT3 or FT4, which is partially consistent with previous findings.24–26 The relationship between DM and TD is intricate and mutually dependent.3,4 THs can impact the progression of diabetes by enhancing carbohydrate absorption in the gastrointestinal tract, stimulating gluconeogenesis, and regulating insulin sensitivity.27–29 Conversely, DM can also affect thyroid markers through hypothalamic regulation of TSH levels and transformation of thyroxine (T4) to triiodothyronine (T3) in peripheral organs and tissues.26,30 THs exist in two forms: T3 and T4. Under the enzymatic activity of deiodinase, T4 undergoes conversion into T3 and serves a crucial physiological function. This process is tightly regulated by the deiodinases D1 and D2. Research indicates that hyperglycemia has been found to impair the activity and level of deiodinase, reducing the conversion of T4 to T3. Consequently, this can lead to a decrease in the consistency of peripheral T3 levels.23
In the present study, a notable positive association was identified between TSH levels and NLR or PLR in individuals with T2DM. Conversely, a significant inverse relationship was observed between FT3 and FT4 levels and NLR or PLR in the same patient group. Moreover, multiple stepwise regression analysis revealed that NLR and PLR were independent contributing factors for TSH and FT3. PLR was identified as an independent contributing factor for FT4. This discovery confirms the earlier hypothesis that there is a correlation between the variation of thyroid parameters and the levels of circulating inflammatory indicators in patients with T2DM. It is believed that DM and its associated complications are closely related to leukocytes and their diverse subtypes. Compared to WBC, NEUT, LY, and PLT, the NLR and PLR can be calculated from a blood routine, providing a convenient and cost-effective detection method that is less influenced by various physiological and pathological states. Recently, the use of NLR and PLR as novel inflammatory markers has gained attention in various cardiovascular diseases, inflammatory diseases, tumors, as well as diabetes and its complications.31–33 Previous studies have demonstrated that abnormalities in THs in diabetic patients are associated not only with glycemic control but also with an increased inflammatory response. This inflammatory response, in turn, is associated with an imbalance in deiodinase activity.22,23 While these findings provide an initial explanation for the correlation between thyroid markers and inflammatory activity in euthyroid individuals with T2DM, further study is needed to accurately identify the fundamental mechanisms implicated.
Dyslipidemia represents a notable risk factor in the pathogenesis of arteriosclerosis among individuals diagnosed with diabetes. Elevated LDL levels and reduced HDL levels are the primary contributors to the pathogenesis of coronary heart disease. A vital role is played by THs in regulating lipid metabolism, such as digestion, absorption, catabolism, and synthesis.34,35 Specifically, TSH has been found to have a direct impact on cholesterol synthesis and is essential for the clearance of LDL.36 Previous studies have demonstrated a positive correlation between the levels of TSH and TG, TC, and LDL, while the relationship between TSH and HDL remains undefined37,38 Additionally, recent research has indicated that lipid metabolism can reciprocally influence thyroid markers. Both clinically diagnosed hypothyroidism and subclinical hypothyroidism have been found to be correlated with the occurrence of dyslipidemia.24 Studies have shown that elevated levels of circulating TG or TC can potentially lead to thyroid dysfunction.39,40
In the current investigation, it was observed that individuals with T2DM exhibited elevated levels of serum TC, TG, and LDL compared to non-diabetic individuals. Positively and significantly, a correlation was found between TSH and TG, TC, and LDL. However, the levels of FT3 and FT4 exhibited a negative correlation with TG, TC, LDL, and HDL. Multiple stepwise regression analysis demonstrated that LDL levels were independently associated with the levels of TSH and FT3 in individuals with T2DM. Hence, a strong correlation exists between thyroid function and lipid metabolism in individuals with T2DM. Our research findings indicate that elevated TSH levels and decreased FT3 or FT4 levels, even within the normal range, may affect lipid metabolism in euthyroid individuals with T2DM, potentially contributing to the development of atherosclerosis.
The present study necessitates consideration of the following limitations during the interpretation process. Firstly, it is important to note that the study’s cross-sectional design limits the ability to establish causal relationships. Additionally, due to the constraints of detection conditions and associated expenses, we opted not to measure CRP, procalcitonin, interleukin, and other inflammatory indicators. Routine blood counts are not adequately represented as indicators of inflammation. In addition, the sample size of this study is relatively small. The validation of these findings necessitates further longitudinal clinical studies in the future.
Conclusion
In brief, we demonstrate in our research that elevated TSH and reduced FT3 or FT4 levels in euthyroid individuals with T2DM were related to increased NLR or PLR, as well as glucose or lipid disorders. These results show a connection between the dysregulation of thyroid hormone metabolism and abnormalities in glycolipid metabolism, as well as inflammatory responses. These findings suggest the potential for future interventions targeting inflammatory activity to reduce the incidence of thyroid dysfunction in Type 2 diabetic patients.
Ethics Approval and Consent for Participation
This study was carried out after obtaining approval from the Ethics Committee of Taizhou People’s Hospital Affiliated to Nanjing Medical University (KY 2022-115-01). The study followed the guidelines stated in the Declaration of Helsinki. Prior to participation, all individuals provided written informed consent.
Acknowledgments
Thanks are due to all the members of the team and participants in this study.
Funding
There is no funding to report.
Disclosure
There are no conflicts of interest or personal relationships between the authors that could have influenced the study.
References
1. Hohberg V, Kreppke JN, Kohl J, et al. Effectiveness of a personal health coaching intervention (diabetescoach) in patients with type 2 diabetes: protocol for an open-label, pragmatic randomised controlled trial. BMJ Open. 2022;12(6):e057948. doi:10.1136/bmjopen-2021-057948
2. Magliano DJ, Boyko EJ; IDF Diabetes Atlas 10th edition scientific committee. IDF Diabetes Atlas.
3. Mohammed Hussein SM, AbdElmageed RM. The relationship between type 2 diabetes mellitus and related thyroid diseases. Cureus. 2021;13(12):e20697. doi:10.7759/cureus.20697
4. Eom YS, Wilson JR, Bernet VJ. Links between thyroid disorders and glucose homeostasis. Diabetes Metab J. 2022;46(2):239–256. doi:10.4093/dmj.2022.0013
5. Mullur R, Liu YY, Brent GA. Thyroid hormone regulation of metabolism. Physiol Rev. 2014;94(2):355–382. doi:10.1152/physrev.00030.2013
6. Biondi B, Kahaly GJ, Robertson RP. Thyroid dysfunction and diabetes mellitus: two closely associated disorders. Endocr Rev. 2019;40(3):789–824. doi:10.1210/er.2018-00163
7. Vamshidhar IS, Rani SSS. A study of association of thyroid dysfunctions in patients with type 2 diabetes mellitus. Maedica. 2020;15(2):169–173. doi:10.26574/maedica.2020.15.2.169
8. Khassawneh AH, Al-Mistarehi AH, Zein Alaabdin AM, et al. Prevalence and predictors of thyroid dysfunction among type 2 diabetic patients: a case-control study. Int J Gen Med. 2020;13:803–816. doi:10.2147/IJGM.S273900
9. Sotak S, Felsoci M, Lazurova I. Type 2 diabetes mellitus and thyroid disease: a two-sided analysis. Bratisl Lek Listy. 2018;119(6):361–365. doi:10.4149/BLL_2018_067
10. Elgazar EH, Esheba NE, Shalaby SA, Mohamed WF. Thyroid dysfunction prevalence and relation to glycemic control in patients with type 2 diabetes mellitus. Diabetes Metab Syndr. 2019;13(4):2513–2517. doi:10.1016/j.dsx.2019.07.020
11. Chen R-H, Chen H-Y, Man K-M, et al. Thyroid diseases increased the risk of type 2 diabetes mellitus: a nation-wide cohort study. Medicine. 2019;98(20):e15631. doi:10.1097/MD.0000000000015631
12. Rong F, Dai H, Wu Y, et al. Association between thyroid dysfunction and type 2 diabetes: a meta-analysis of prospective observational studies. BMC Med. 2021;19(1):257. doi:10.1186/s12916-021-02121-2
13. Roa Dueñas OH, Van der Burgh AC, Ittermann T, et al. Thyroid function and the risk of prediabetes and type 2 diabetes. J Clin Endocrinol Metab. 2022;107(6):1789–1798. doi:10.1210/clinem/dgac006
14. Jun JE, Jin SM, Jee JH, et al. TSH increment and the risk of incident type 2 diabetes mellitus in euthyroid subjects. Endocrine. 2017;55(3):944–953. doi:10.1007/s12020-016-1221-1
15. Gu Y, Li H, Bao X, et al. The relationship between thyroid function and the prevalence of type 2 diabetes mellitus in euthyroid subjects. J Clin Endocrinol Metab. 2017;102(2):434–442. doi:10.1210/jc.2016-2965
16. Wang J, Li H, Tan M, et al. Association between thyroid function and diabetic nephropathy in euthyroid subjects with type 2 diabetes mellitus: a cross-sectional study in China. Oncotarget. 2019;10(2):88–97. doi:10.18632/oncotarget.26265
17. Zou J, Li Z, Tian F, et al. Association between normal thyroid hormones and diabetic retinopathy in patients with type 2 diabetes. Biomed Res Int. 2020;2020:8161797. doi:10.1155/2020/8161797
18. Rozing MP, Westendorp RGJ, Maier AB, et al. Serum triiodothyronine levels and inflammatory cytokine production capacity. Age (Dordr). 2012;34(1):195–201. doi:10.1007/s11357-011-9220-x
19. Gómez-Zamudio JH, Mendoza-Zubieta V, Ferreira-Hermosillo A, et al. High thyroid-stimulating hormone levels increase proinflammatory and cardiovascular markers in patients with extreme obesity. Arch Med Res. 2016;47(6):476–482. doi:10.1016/j.arcmed.2016.10.007
20. Lei Y, Yang J, Li H, Zhong H, Wan Q. Changes in glucose-lipid metabolism, insulin resistance, and inflammatory factors in patients with autoimmune thyroid disease. J Clin Lab Anal. 2019;33(7):e22929. doi:10.1002/jcla.22929
21. Moura Neto A, Parisi MC, Tambascia MA, et al. The influence of body mass index and low-grade systemic inflammation on thyroid hormone abnormalities in patients with type 2 diabetes. Endocr J. 2013;60(7):877–884. doi:10.1507/endocrj.EJ13-0030
22. Moura Neto A, Parisi MCR, Alegre SM, Pavin EJ, Tam-bascia MA, Zantut-Wittmann DE. Relation of thyroid hormone abnormalities with subclinical inflammatory activity in patients with type 1 and type 2 diabetes mellitus. Endocrine. 2016;51(1):63–71. doi:10.1007/s12020-015-0651-5
23. Siddiqui K, George TP, Joy SS, Mujammami M. Variation in the level of thyroid markers in association with Inflammation in patients with type 2 diabetes. Endocr Metab Immune Disord Drug Targets. 2020;20(6):924–929. doi:10.2174/1871530319666191125150929
24. Wolide AD, Zawdie B, Alemayehu T, Tadesse S. Association between thyroid hormone parameters and dyslipidemia among type 2 diabetes mellitus patients: comparative cross-sectional study. Diabetes Metab Syndr. 2017;11(Suppl 1):S257–S262. doi:10.1016/j.dsx.2016.12.041
25. Zhao W, Li X, Liu X, Lu L, Gao Z. Thyroid function in patients with type 2 diabetes mellitus and diabetic nephropathy: a single center study. J Thyroid Res. 2018;2018:9507028. doi:10.1155/2018/9507028
26. Ogbonna SU, Ezeani IU, Okafor CI, Chinenye S. Association between glycemic status and thyroid dysfunction in patients with type 2 diabetes mellitus. Diabetes Metab Syndr Obes. 2019;12:1113–1122. doi:10.2147/DMSO.S204836
27. Jali MV, Kambar S, Jali SM, Pawar N, Nalawade P. Prevalence of thyroid dysfunction among type 2 diabetes mellitus patients. Diabetes Metab Syndr. 2017;11(Suppl 1):S105–S108. doi:10.1016/j.dsx.2016.12.017
28. Kalra S, Aggarwal S, Khandelwal D. Thyroid dysfunction and type 2 diabetes mellitus: screening strategies and implications for management. Diabetes Ther. 2019;10(6):2035–2044. doi:10.1007/s13300-019-00700-4
29. Li Q, Lu M, Wang NJ, et al. Relationship between free thyroxine and islet beta-cell function in euthyroid subjects. Curr Med Sci. 2020;40(1):69–77. doi:10.1007/s11596-020-2148-6
30. Nishi M. Diabetes mellitus and thyroid diseases. Diabetol Int. 2018;9(2):108–112. doi:10.1007/s13340-018-0352-4
31. He P, Yang H, Lai Q, et al. The diagnostic value of blood cell-derived indexes in subacute thyroiditis patients with thyrotoxicosis: a retrospective study. Ann Transl Med. 2022;10(6):322. doi:10.21037/atm-22-719
32. Dziedzic EA, Gąsior JS, Tuzimek A, Kochman W. Blood count-derived inflammatory markers and acute complications of ischemic heart disease in elderly women. J Clin Med. 2023;12(4):1369. doi:10.3390/jcm12041369
33. Wen H, Yu H. Correlation analysis of carotid plaque in young patients with newly diagnosed type 2 diabetes and platelet-to-lymphocyte ratio and neutrophil-lymphocyte ratio. Vascular. 2023;31(1):90–97. doi:10.1177/17085381211052362
34. Sinha RA, Singh BK, Yen PM. Direct effects of thyroid hormones on hepatic lipid metabolism. Nat Rev Endocrinol. 2018;14(5):259–269. doi:10.1038/nrendo.2018.10
35. Liu F, Hwang J, Kuo C, Ko Y, Chen S, Lin J-D. Subclinical hypothyroidism and metabolic risk factors association: a health examination-based study in northern Taiwan. Biomed J. 2018;41(1):52–58. doi:10.1016/j.bj.2018.02.002
36. Chang YC, Hua SC, Chang CH, et al. High TSH level within normal range is associated with obesity, dyslipidemia, hypertension, inflammation, hypercoagulability, and the metabolic syndrome: a novel cardiometabolic marker. J Clin Med. 2019;8(6):817. doi:10.3390/jcm8060817
37. Luxia L, Jingfang L, Songbo F, et al. Correlation between serum TSH levels within normal range and serum lipid profile. Horm Metab Res. 2021;53(1):32–40. doi:10.1055/a-1191-7953
38. Kus´ A, Marouli E, Del Greco MF, et al. Variation in normal range thyroid function affects serum cholesterol levels, blood pressure, and type 2 diabetes risk: a Mendelian randomization study. Thyroid. 2021;31(5):721–731. doi:10.1089/thy.2020.0393
39. Gao M, Cao L, Wang H, et al. Correlation between subclinical hypothyroidism and dyslipidemia in women in northeast China. Acta Endocrinol (Buchar). 2021;17(2):282–285. doi:10.4183/aeb.2021.282
40. Song Y, Liu J, Zhao K, Gao L, Zhao J. Cholesterol-induced toxicity: an integrated view of the role of cholesterol in multiple diseases. Cell Metab. 2021;33(10):1911–1925. doi:10.1016/j.cmet.2021.09.001
 © 2023 The Author(s). This work is published and licensed by Dove Medical Press Limited. The full terms of this license are available at https://www.dovepress.com/terms.php and incorporate the Creative Commons Attribution - Non Commercial (unported, v3.0) License.
By accessing the work you hereby accept the Terms. Non-commercial uses of the work are permitted without any further permission from Dove Medical Press Limited, provided the work is properly attributed. For permission for commercial use of this work, please see paragraphs 4.2 and 5 of our Terms.
© 2023 The Author(s). This work is published and licensed by Dove Medical Press Limited. The full terms of this license are available at https://www.dovepress.com/terms.php and incorporate the Creative Commons Attribution - Non Commercial (unported, v3.0) License.
By accessing the work you hereby accept the Terms. Non-commercial uses of the work are permitted without any further permission from Dove Medical Press Limited, provided the work is properly attributed. For permission for commercial use of this work, please see paragraphs 4.2 and 5 of our Terms.