Back to Journals » Diabetes, Metabolic Syndrome and Obesity » Volume 16
The Correlation Between Health Risk Factors and Diabesity and Lipid Profile Indicators: The Role Mediator of TSH
Authors Zhang Y, Zhang Y, Zhu L, Yu Z, Lu F, Wang Z, Zhang Q ![]()
Received 18 November 2022
Accepted for publication 2 March 2023
Published 2 May 2023 Volume 2023:16 Pages 1247—1259
DOI https://doi.org/10.2147/DMSO.S398124
Checked for plagiarism Yes
Review by Single anonymous peer review
Peer reviewer comments 2
Editor who approved publication: Dr Konstantinos Tziomalos
Yi Zhang,1,2 Yulin Zhang,3,* Li Zhu,4,* Zixiang Yu,5 Fangting Lu,1 Zhen Wang,1 Qiu Zhang1
1Department of Endocrinology, The First Affiliated Hospital of Anhui Medical University, Hefei, Anhui Province, People’s Republic of China; 2Department of Maternal, Child and Adolescent Health, School of Public Health, Anhui Medical University, Hefei, Anhui Province, People’s Republic of China; 3The Second Clinical Medical College, Anhui Medical University, Hefei, Anhui Province, People’s Republic of China; 4Department of Endocrinology, Chaohu Hospital of Anhui Medical University, Hefei, Anhui Province, People’s Republic of China; 5The First Clinical Medical College, Anhui Medical University, Hefei, Anhui Province, People’s Republic of China
*These authors contributed equally to this work
Correspondence: Qiu Zhang, Department of Endocrinology, the First Affiliated Hospital of Anhui Medical University, Hefei, 230022, People’s Republic of China, Email [email protected]
Introduction: Obesity in adults is a problem, particularly when paired with other metabolic abnormalities. Previous research have linked various screening approaches to diabetes, but additional evidence points to the relevance of combining diabetes screening methods with obesity and its effects. This research examined the impact of thyroid hormones (TSHs) and health risk factors (HRFs) in screening for obesity and diabetes in Chinese populations, and whether age can modulate this association.
Methods: From March to July 2022, the Hefei Community Health Service Center connected with the First Affiliated Hospital of Anhui Medical University was chosen, and the multi-stage cluster sample approach was utilized to test adults aged 21– 90 in each community. Latent category analysis (LCA) was performed to investigate the clustering patterns of HRFs. A one-way ANOVA was used to examine waist circumference (WC), biochemical markers, and general data. Furthermore, multivariate logistic regression analysis was utilized to investigate the relationship between health risk variables and WC.
Results: A total of 750 individuals without a history of major problems who had a community health physical examination were chosen, with missing data greater than 5% excluded. Finally, 708 samples were included in the study with an effective rate of 94.4%. The average WC was (90.0± 10.33) cm, the prevalence in the >P75, P50~P75, P25~P50, and ≤P25 groups were 24.7%, 18.9%, 28.7% and 27.7%, respectively. The average TSH was (2.76± 2.0) μIU/mL. Male (β=1.91), HOMA-IR (β=0.06), TyG (β=2.41), SBP (β=0.08), TG (β=0.94) and UA (β=0.03) were more likely to have a higher prevalence of WC level. The analyses revealed significant correlations between HRFs, TSH, age, other metabolic indexes and WC (P < 0.05).
Discussion: Our findings suggest that the quality of metabolic-related indicators used to successfully decrease diabetes in Chinese individuals with high HRFs levels should be prioritized. Comprehensive indicators might be a useful and practical way for measuring the metabolic evolution of diabetes level levels.
Keywords: health risk factors, diabetes mellitus, metabolic indicators, TSH, WC, diabesity
Introduction
Diabesity is a common name for the kind of diabetes that develops later in life and is connected with fat. The link between body mass index (BMI) and diabetes mellitus (diabesity) is widely documented.1 Insulin resistance (IR) in peripheral tissues has been identified as a pathophysiology, which may be described as a condition of reduced biological response to normal circulating insulin concentrations.2 Although most clinical investigations and public health researchers identify disability as a disease caused by multiple factors, these factors do not fully explain the occurrence of the disease, that is, the interaction between factors that contribute to the long-term high incidence and unnecessary morbidity of diabesity due to health risk factors (HRFs). As a result, it is required to identify the components of HRFs that contribute to diabesity, and this assumption should be founded on theories that are relevant to diverse behaviors in order to be implemented. Given that type 2 diabetes mellitus (T2DM) and obesity share an etiology, obesity is a major risk factor for T2DM, we will explore how long-term changes in the primary risk variables lead to the “diabesity” epidemic below.3
TyG-BMI is connected with diabetes, and this independent connection was considerably stronger in young adults, middle-aged people, and non-obese people.4 Among them, the subgroup analysis revealed that comparing with middle-aged and older people, young and middle-aged individuals were more likely to develop TyG-BMI-related diabetes; and comparing with overweight and obese people, non-obese people were more likely to develop TyG-BMI-related diabetes. According to a 22-year retrospective analysis, the incidence of T2DM was found to be substantially linked with the TyG index.5 Concerning the relationship between hypertension and lipid profile, some studies suggested that identifying infrared status may be more beneficial than relying solely on traditional obesity indicators; four indicators (TyG, TyG-BMI, TyG-WC, and TyG-WHtR) were found to be positively associated with systolic and diastolic blood pressure.6 The TyG index can be used as a surrogate indicator for the IR assessment indicators7 and risk of diabetes, which means TyG index can be utilized as a monitoring tool because it has a linear relationship with the probability of acquiring T2DM in the Japanese population.8
Important glucose homeostasis regulators include thyroid hormones, there was a correlation between thyroid hormones and T2DM, a 7-year longitudinal study showed that individual changes in TSH and thyroid hormone are also associated with the development of type 2 diabetes, even within the normal reference range.9 Serum levels of thyroid-stimulating hormone and T3 are dramatically increased in obese versus lean individuals.10 However, it is not clear about the casual association of that the correlation between altered thyroid function and fat excess among diabetes.11 As previous study stated,9 the metabolism of glucose and the emergence of insulin resistance are significantly impacted by thyroid hormones;12 however, there were also unfavorable findings, which failed to acknowledge that the existence of aberrant thyroid hormone levels may be a fundamental cause of inadequate treatment of T2DM.13
The evidence that lowering HRFs reduces the risk of diabetes is convincing, and special focus has been placed on the relationship between HRFs and diabetes. Furthermore, T2DM has been found to be preventive, with weight control being the most important component, as well as other contributing variables such as TSH levels. These studies on HRFs may, to some extent, encourage the creation and development of diabetes as well as supply indirect and direct confirmation of this. On the other hand, a comprehensive model for HRFs and the construction of HRFs-diabesity is required, and a thorough investigation of the diabetes phenomena is necessary. Given that a large sample of comprehensive tests is difficult to distribute in certain basic community hospitals and there are few relevant research on comprehensive HRFs for screening diabetes, we performed a large-scale, multi-center, cross-sectional research on three Chinese communities to address this problem.14 The goal of this study was to look into the link between HRFs, TSH levels, and diabetes. Furthermore, in this case of HRF exposure, those whose other indices were associated with diabetes. Consequently, the goal of this research was to analyze the relationship between waist circumference (WC), HRFs, TSH levels, and age in order to determine the influence of different risk factors on WC and its relationship to diabetes. The author also wanted to research how extensive HRFs are applied in measuring diabetes prevalence on a wide scale in the Chinese population by performing extensive HRFs in community hospitals.
Methods
Study Design
This notion that HRFs is strongly associated to pre-diabetes, diabetic complications, and diabesity is the foundation for this research. This theory is backed by comprehensive diabetes approaches, as well as in the community. This cross-sectional study’s objective was to investigate the connection between complete HRFs (including metabolic markers) and the prevalence of diabetes and the problems associated with it using a cross-sectional research design. The checklist for Strengthening the Reporting of Observational Studies in Epidemiology (STROBE) was used to guide the design of the current research as well as the reporting of its findings.
Settings
People ranging in age from 21 to 90 years old were tested at three community health care facilities in Hefei, Anhui province, that had signed a medical association agreement with our hospital. Those who had been definitively diagnosed with severe stages of diabetes and other diseases were barred from participation. Trained researchers employed a questionnaire form that was consistently structured to collect the participants’ gender, age, height, weight, belly circumference, blood pressure, smoking history, medical history, and other information. The form was used by trained investigators. In addition, measurements were taken at 7:30 in the morning for fasting blood sugar (FPG), hemoglobin A1c (HbA1C), C-peptide, cholesterol (TC), and triglyceride (TG) levels. During this time, an oral glucose tolerance test, also known as an OGTT, was carried out to determine the levels of glucose and C-peptide in the veins following a glucose loading period that lasted for two hours. We used the same methodology that was used in earlier research.14,15
Exposure and Outcomes
In accordance with established protocols, participants were subjected to comprehensive physical exams that included measurements of their height, weight, and blood pressure, as well as the collection of blood and urine samples by medical professionals and other personnel who had received specialized training in authorized physical examination facilities. Recordings were made of a variety of patient variables, including gender, age, height, weight, waist circumference, hip circumference, and blood pressure. We used Soehnle electronic scales to measure the participants’ weight to the closest 0.1 kg, and we used a stadiometer to measure their height in bare feet to the nearest 1 mm. Both measurements were done with precision to the nearest 0.1 kg. We also determined the body mass index (BMI) and the waist-to-hip ratio (WHR). Using Hawksley random zero sphygmomanometers, systolic and diastolic blood pressure were recorded twice in a sitting position after a 5-minute rest interval. Both measurements were taken before and after the sat posture. The blood pressure that was taken was determined by taking the average of the two separate measurements. Blood was drawn from a vein while the subject was fasting in order to determine levels of FBG, 2-hour plasma glucose (2hPG), HbA1c, insulin, total cholesterol, triglycerides, high-density lipoprotein (HDL-C), creatinine (Cr), and urea acid (UA). An oral glucose tolerance test (OGTT) was also performed. In addition to it, blood serum was used to assess other potential indications. The term “metabolic indices” is used to refer to all of these potential dangers combined.14,15
Criteria for Risk Factors
It was determined that someone was obese if their BMI was between 24 and 28. According to Chinese criteria, a body mass index (BMI) of more than 28 kg/m2 constituted obesity.16 SBP of 140 mmHg or DBP of 90 mmHg was considered hypertension (WHO 1999 criteria)17 or the therapy that is being used for hypertension at the moment. Patients who have been treated with drugs for decreasing lipids or who had blood values of TC more than 5.69 mmol/L or TG greater than 1.68 mmol/L or HDL greater than 1.03 mmol/L were considered to have hyperlipidemia. The abnormally high HbA1c level was more than 7.0%.18 Serum UA values of 416 mmol/L (7.0 mg/dL) in males and 386 mmol/L (6.5 mg/dL) in women were considered to be indicative of hyperuricemia, as was the use of allopurinol in an effort to reduce uric acid levels in patients.19 Diabetes was defined as FBG ≥7.0 mmol/L, and impaired glucose control was defined as FPG ≥ 6.1 mmol/L or < 7.0 mmol/L or 2hPG > 7.8 mmol/L or < 11.1 mmol/L.14,20
The list of requirements for acceptance was as follows: 1) participants gave their informed permission, 2) participants did not have a history of mental illness, 3) participants were at least 18 years old and had resided in the survey area for at least 6 months in the preceding 12 months, and 4) participants independently completed the survey.
Criteria for disqualification were as follows: Participants having a history of substantial complications from diabetes, cardiovascular disease, cerebrovascular disease, major impairments in liver and renal function due to infection or stress, and those at the terminal stages of their respective diseases.
Sample Size Estimation
According to earlier studies, the prevalence of obesity was 20–40%,21 with a relative precision of 15%(ɛ), α = 0.05, and Z1-α/2 = 1.96. The minimal sample size was determined using the following formula: 161. Analyses and future follow-up are required when considering a multi-center design with varied ages and communities. This minimal criteria was applied for grade sampling in all areas to guarantee that each community’s study was completed at several stratification levels.14 Hence, a survey of 500 participants was conducted.

Statistics Analysis
Statistical Packages for the Social Sciences (SPSS) version 23.0 was used for the purpose of doing the analysis on all of the data. For data that were skewed, participants’ demographic and clinical characteristics were reported as mean standard deviation or median with interquartile range (IQR). A multivariate logistic regression analysis was performed to investigate the relationships between various characteristics and the risk of prediabetes and diabetes after any confounding factors were removed.
There were three stages involved in carrying out the statistical analysis.14 In Step 1, descriptive data on the health risk factor were collected from the four WC groups, and the chi-square test was used to compare categorical variables. Step 2 involves assessing the associations between health risk factors and the four WC categories using multilevel logistic regression. In step three 3, the PROCESS software from model 59 was used to conduct a mediate moderation analysis. To assess the moderate and mediate impact, the following associations have to be significant: (a) direct predictor effect (HRFs) on the four WC groups, (b) direct moderator effect (gender), independent (HRFs) on the four WC groups, and (c) indirect interaction effect (TSH) on the four WC groups. The program in SPSS PROCESS determines automatically both the interactive impact and the amount of variation explained by the moderating effect of gender (R2 increases due to interaction). In the mediating moderation model, sociodemographic factors were adjusted for (gender, DBP, and hip circumference). Furthermore, we investigated whether age mediated the association between HRFs and the four WC groups: HOMA-IR.14 When the 95% CI did not contain zero, the moderating impact was judged significant.22 The hospital’s ethics committee gave its stamp of approval to this research project (Ethics Approval No. PJ2019-09-05), and all of the participants gave their written informed permission.
Sensitivity Analysis
Sensitivity analysis was utilized in this work to examine the model’s robustness: (1) model 1 did not account for covariables; model 2 did account for covariables; (2) We also looked at the interaction between HOMA-IR, age, TSH level, and WC level in this investigation. (3) Use the following methods to compute the co-occurrence of HRF: to SBP, DBP, FBG, P2hBG, HbA1c, TC, TG, HDL, and UA of 9 types of actions performed in accordance with the presence of risk classification, divided into four groups, according to standards based on the variable will occur for each HRF risk, the number of all HRFs in each research object was added up to form a “co-occurrence index”23 which divided the co-occurrence of HRFs into 3 and less, 4, 5 and 6 and more types.
Results
Prevalence Characteristics of the Four WC Groups
The sample consisted of 750 people who had had a community health physical examination and had no history of serious health issues. Those with missing data larger than 5% were disqualified from the analysis. Finally, 708 samples with an efficacy rate of 94.4% were included in the research. The average WC was (90.0 10.33) cm, with prevalences of 23.3%, 23.7%, 26.4%, and 25.9% in the >P75, P50~P75, P25~P50, and ≤ P25 groups, respectively. The average age was (55.34±14.19) years. Females (β= −1.91) had a greater incidence of WC, whereas HOMA-IR, TyG, TG, and FBG were all associated with WC. Other data are provided in Table 1. There was no link between age and WC (β= 0.004), and there was a marginal correlation between HbA1c and WC (β= 0.005, P=0.07).
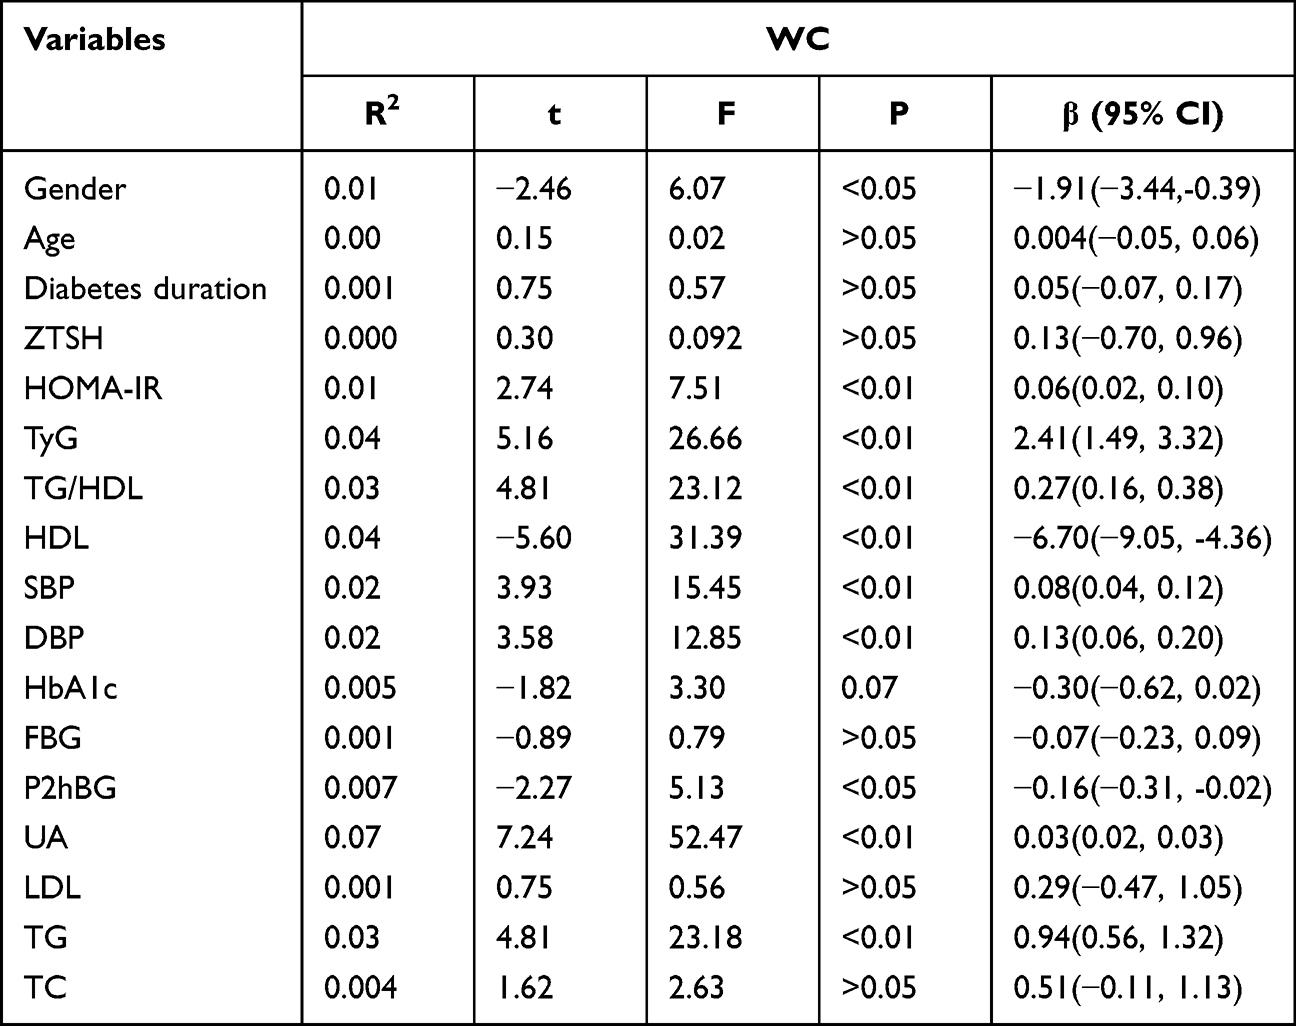 |
Table 1 The Multilevel Linear Regression Between Dependent HRFs and WC |
Table 2 presents the results of the influence factor and four BMI, which showed that higher BMI level, younger (β = −0.03), HOMA-IR (β = 0.02), TyG (β = 0.94), SBP (β = 0.022), TG (β = 0.38), and older age (β = 25.06) were more likely to have a higher prevalence of BMI level; other factors such as gender, TSH, FBG and TC were not correlated with the BMI levels. Table 2 shows the linear regression correlation between influence factor and BMI levels.
 |
Table 2 The Multilevel Linear Regression Between Dependent Health Risk Factors and BMI |
Class Enumeration and Characteristics of the Final Three Class Model
Table 3 displays the model fit statistics, which vary from one to nine classes. The three-class solution was picked as the final, best-fitting model because its AIC, BIC, and aBIC values were the lowest. In addition, we enumerated the development of aBIC values and found that the three-class distribution contains aBIC values that are most dramatically decreasing. Regarding model 3, bootstrap validation approaches demonstrated that it suited the data well (p < 0.001). All following results are presented in a way unique to the three-class solution.
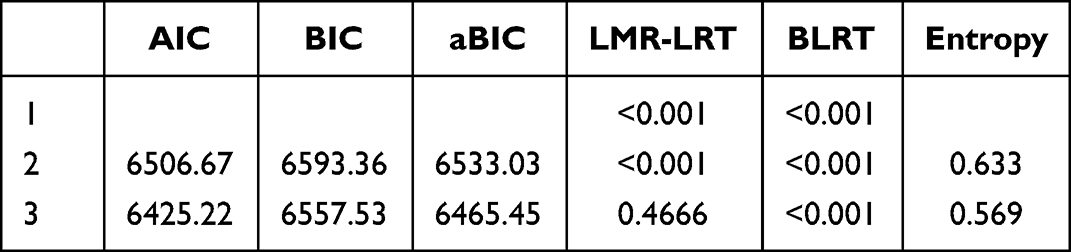 |
Table 3 Screening Results of Latent Categories Clustering of Health Risk Behaviors |
Figure 1 depicts the two-class model of HRFs and item-response probabilities for each class’s nine HRFs, which include SBP, DBP, FBG, P2hBG, HbA1c, TC, TG, HDL, and UA. Class 1 has a high likelihood of exposure to each of the 9 HRFs; so, we named this latent class “high risk” (26.4%); Class 2 has a low probability of exposure to each of the 9 HRFs; thus, we labeled this latent class “low risk” (73.6%).
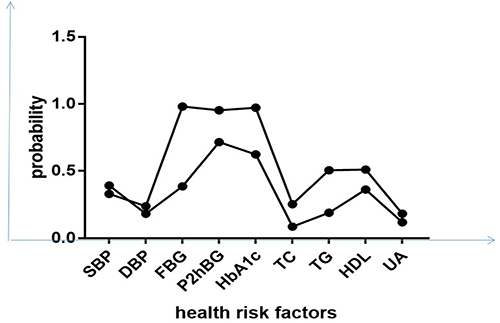 |
Figure 1 The type of HRBs. |
Multilevel Logistic Regression Between the Risk Factors and WC Group
According to multivariate variable analysis, HRFs was not positively correlated with the WC group: P25 (odds ratio [OR] =0.86, 95% CI: 0.48, 1.54), P50–P75 (OR = 1.25, 95% CI: 0.76, 2.05), and >P75 (OR = 1.62, 95% CI: 0.99, 2.63). There was a significant correlation between HRF co-occurrence and WC (Table 4).
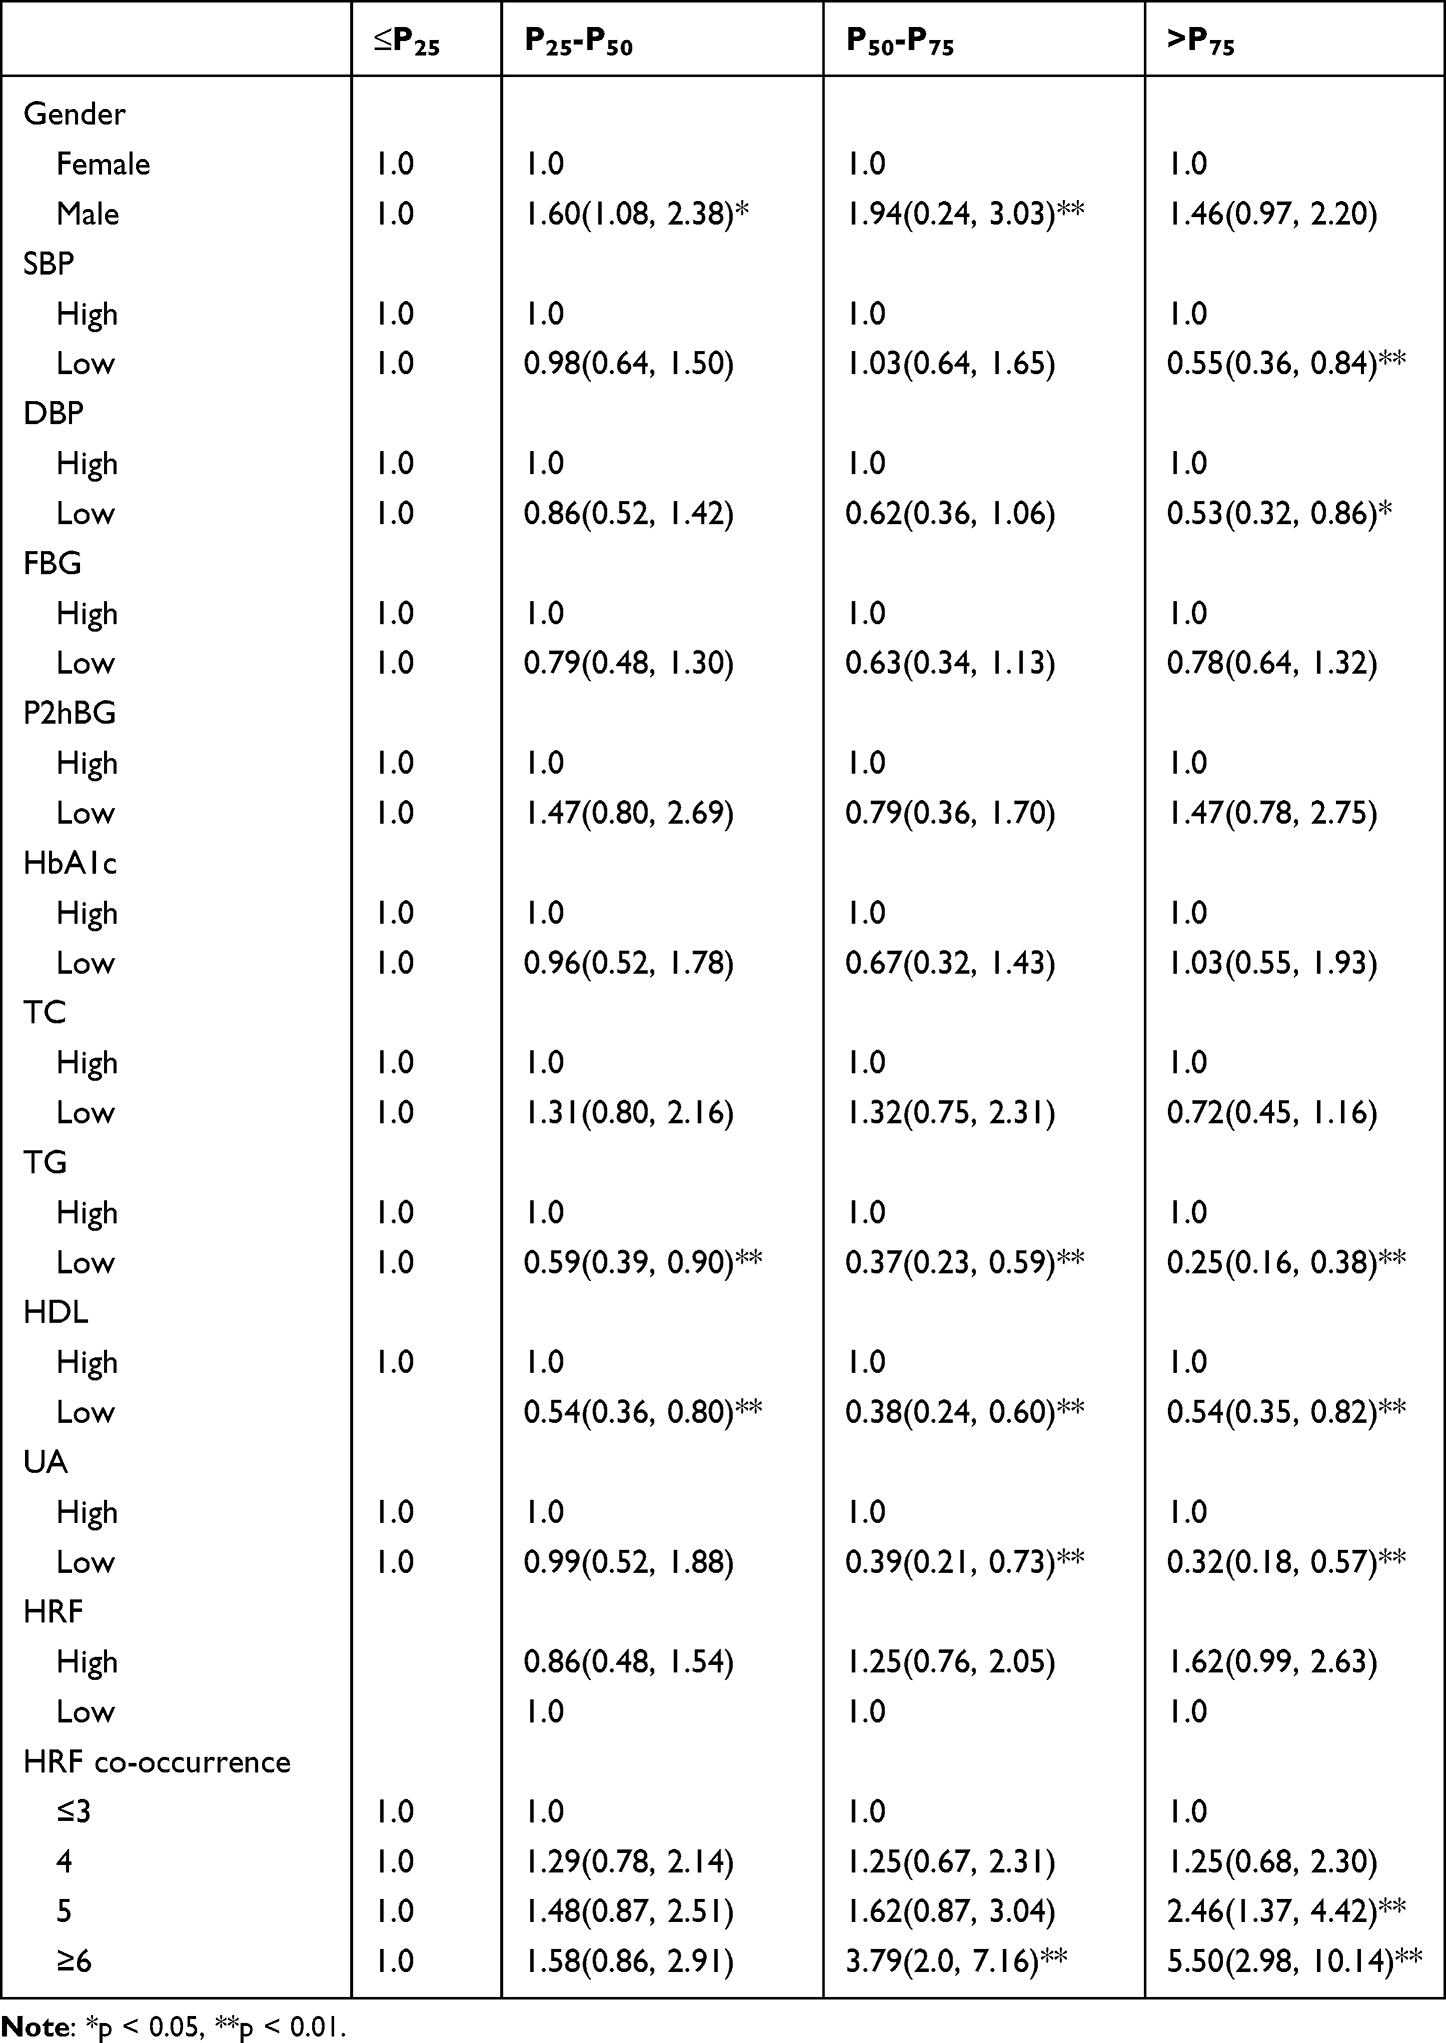 |
Table 4 The Logistic Correlation Factors and Four WC Groups |
The interaction between low UA (OR = 0.32, 95% CI: 0.18, 0.57) and lower TG (OR = 0.25, 95% CI: 0.16, 0.38) was negatively correlated with the high WC group. Similar results were also found in SBP (OR = 0.55, 95% CI: 0.36, 0.84) and DBP (OR = 0.55, 95% CI: 0.36, 0.84). The results are shown in Table 4.
Mediate Moderation Analysis
Mediate moderation analyses were performed with process, the results are shown in Table 5 and Table 6. The results demonstrated that the effect of HRFs on WC was not significantly moderated by age (β=−0.0075, P > 0.05). Particularly, the mediation of TSH on WC was significantly moderated by age (β=−0.062, P > 0.05).
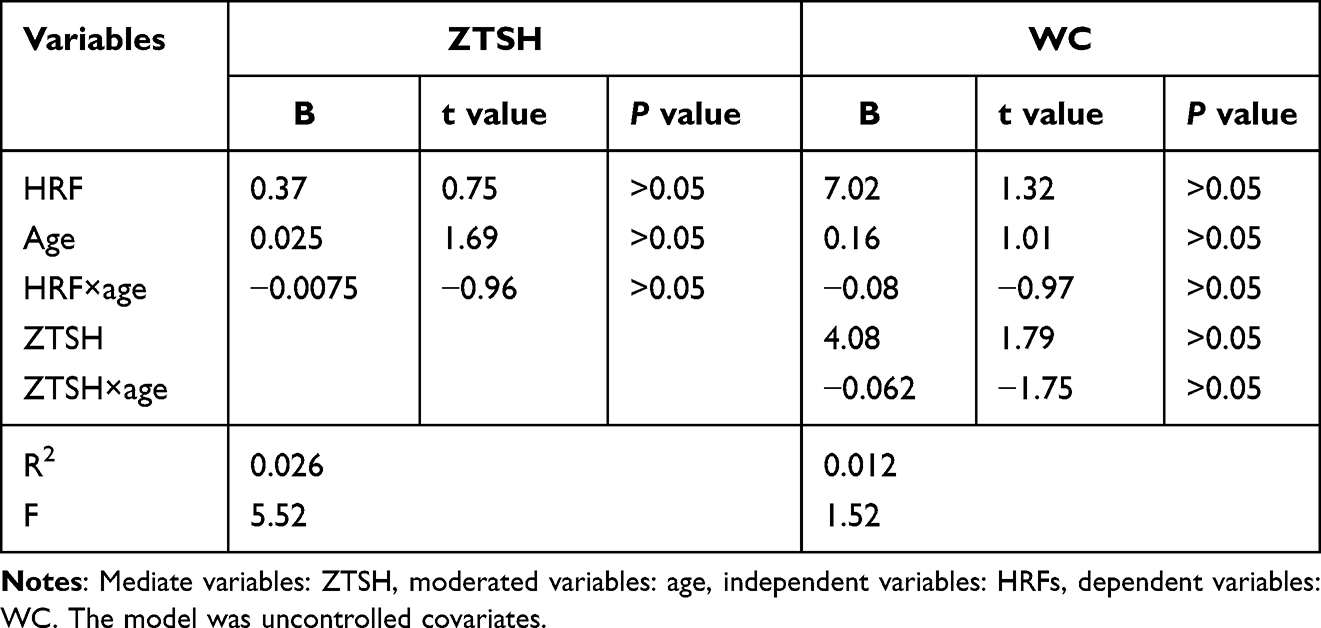 |
Table 5 The Correlation Between ZTSH, HRF, Age and WC |
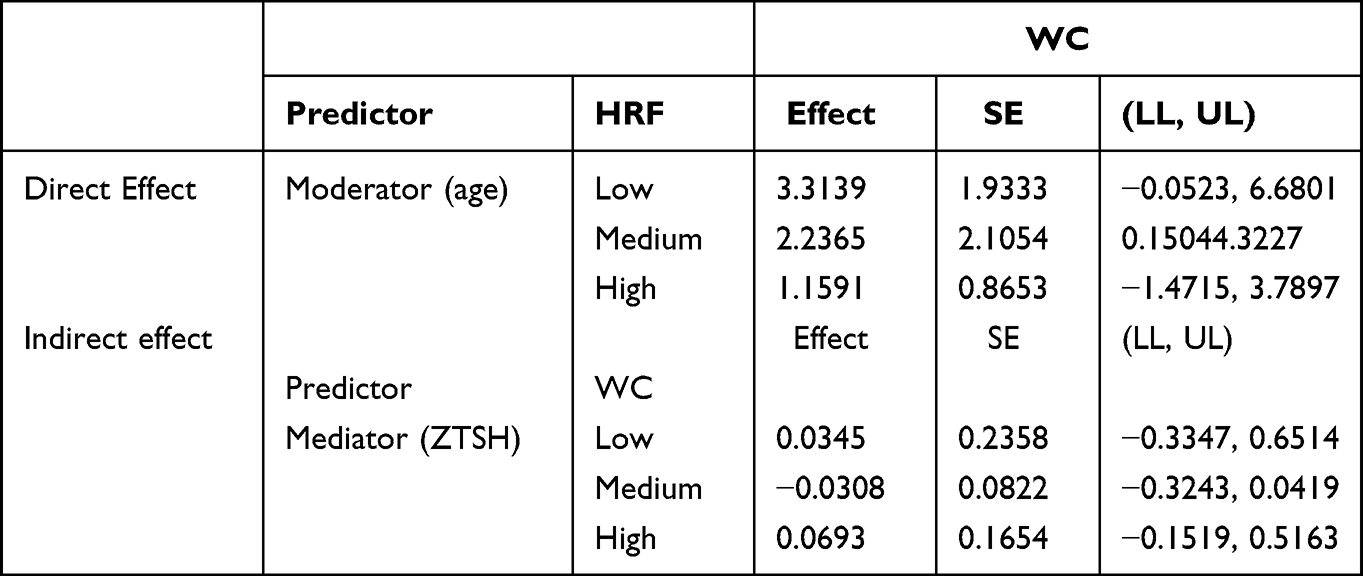 |
Table 6 Bootstrapped Conditional Direct and Indirect Effects (The Correlation Between ZTSH, HRF, Age and WC) |
Sensitivity Analysis (BMI)
Similar results were shown in Table 7 and Table 8, The results demonstrated that the effect of HOMA-IR on WC was significantly moderated by gender (β=1.06, p < 0.01). Particularly, the mediation of AGE on WC was significantly moderated by gender (β=−1.84, p < 0.05).
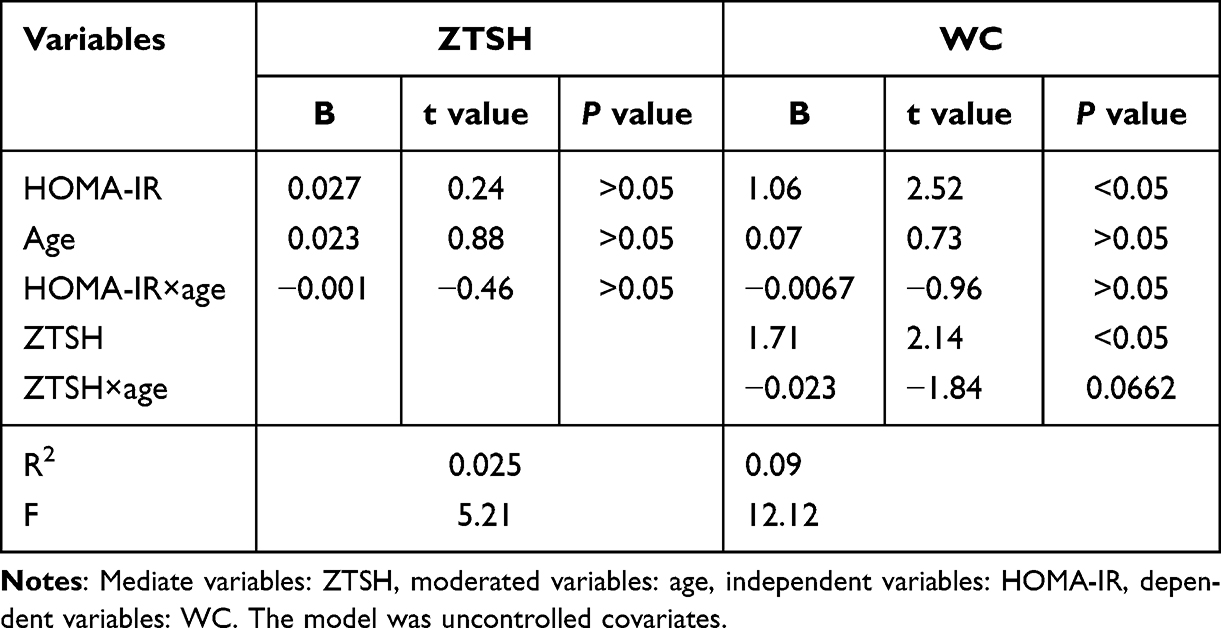 |
Table 7 The Correlation Between ZTSH, HOMA-IR, Age and WC |
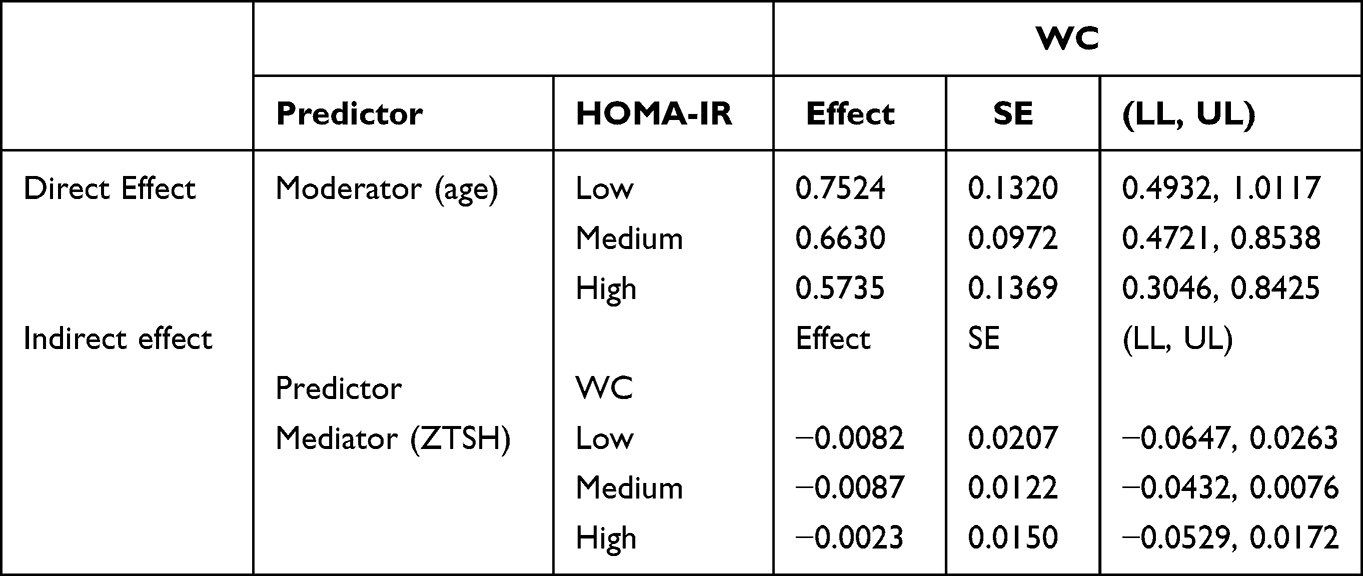 |
Table 8 Bootstrapped Conditional Direct and Indirect Effects (The Correlation Between ZTSH, HOMA-IR, Age and WC) |
In addition, we conducted moderated mediation analyses by adjusting for the previously mentioned factors. The findings showed that the effect of HRF clustering on WC was not substantially mitigated by age. TSH mediation on WC, in particular, was not substantially modulated by age (Table 9 and Table 10). Age considerably mitigated the effect of HRF co-occurrence on WC. Age, in particular, considerably attenuated the mediation of TSH on WC (Table 11 and Table 12).
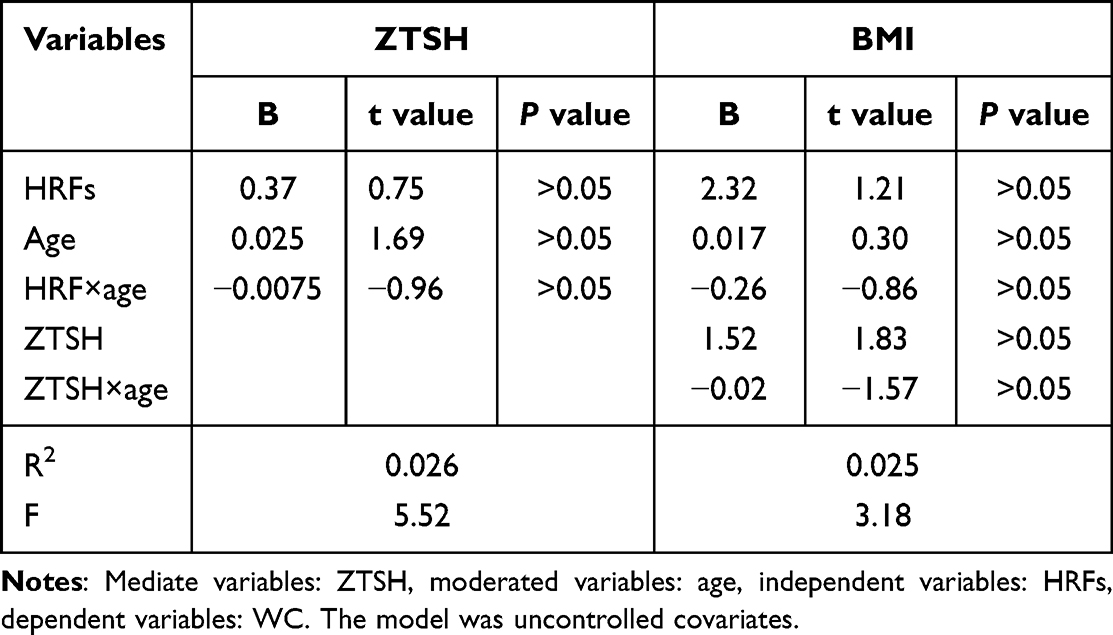 |
Table 9 The Correlation Between ZTSH, HRF, Age and BMI |
 |
Table 10 Bootstrapped Conditional Direct and Indirect Effects (The Correlation Between ZTSH, HRF, Age and BMI) |
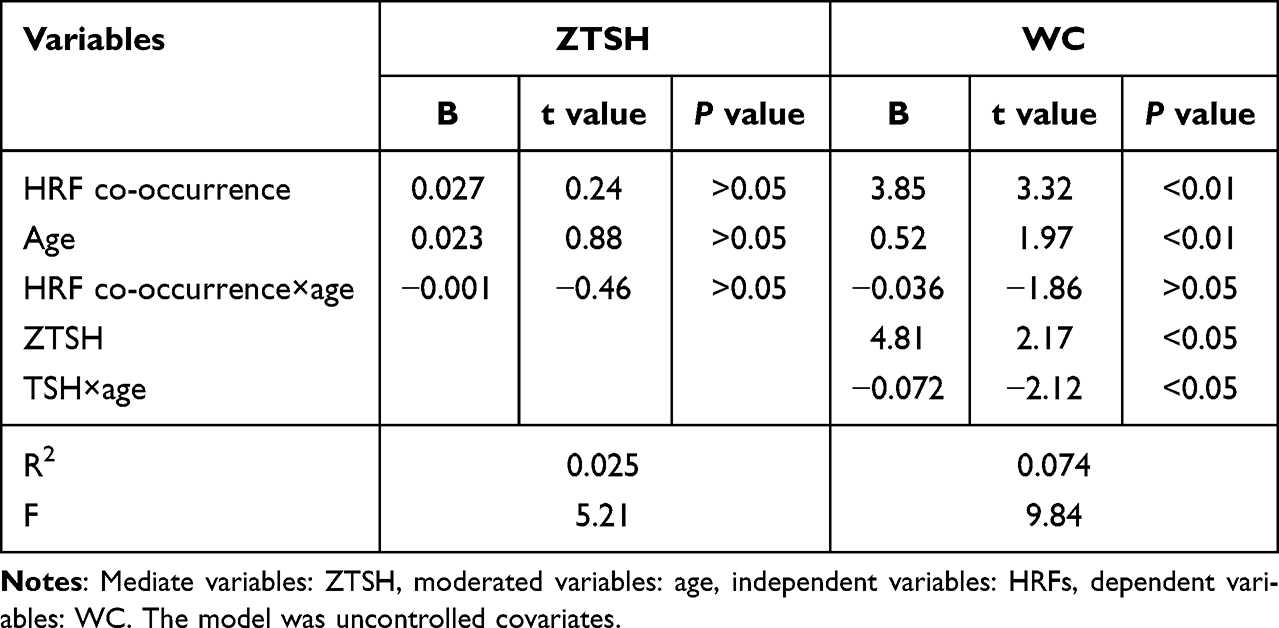 |
Table 11 The Correlation Between ZTSH, HRF Co-occurrence, Age and WC |
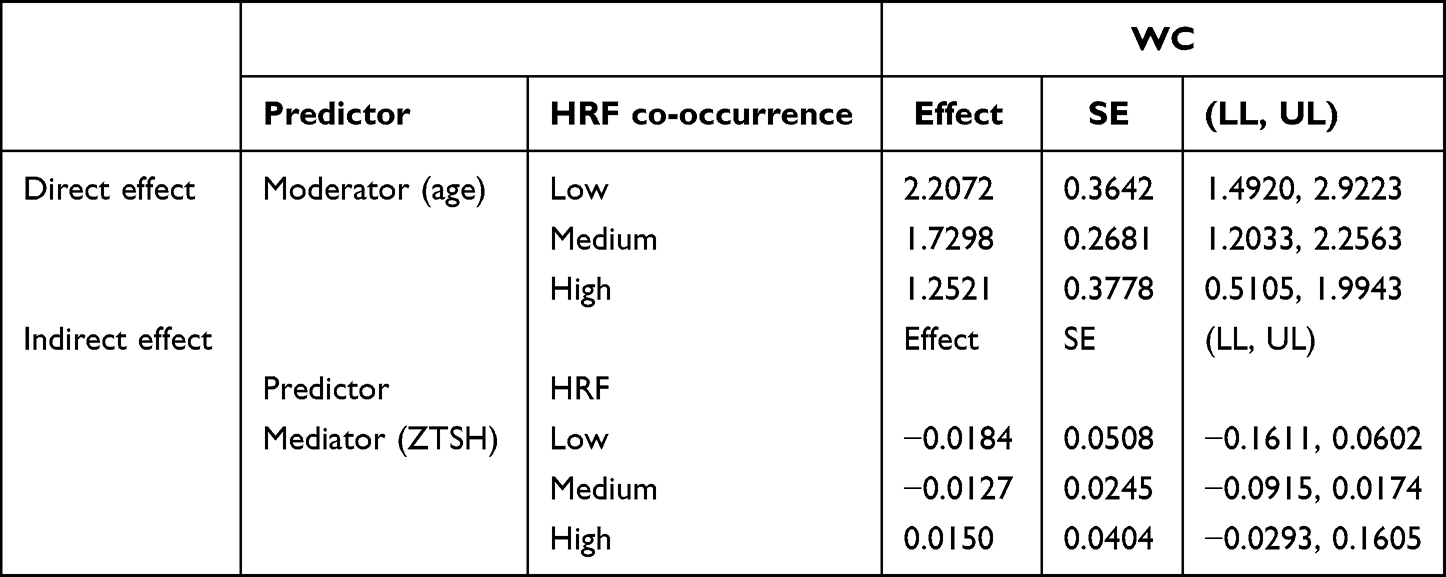 |
Table 12 Bootstrapped Conditional Direct and Indirect Effects (The Correlation Between ZTSH, HRF Co-occurrence, Age and WC) |
Discussion
Research Significance
The current study looked at the correlation between HRFs, age and their respective associations with TSH as well as diabesity in a community-based sample of patients. First, we discovered that HRFs were connected with the WC group, and that there was an age trend between HRFs and the WC group. The average WC was (90.0 ± 10.33) cm, the overall prevalence in the >P75, P50~P75, P25~P50 and ≤ P25 groups were 23.3%, 23.7%, 26.4% and 25.9%, respectively. Furthermore, using the LCA technique, many HRF indicators were analyzed inside a theoretically generated model of impact variables on class membership. The high incidence of HRF clustering in our research was 26.4%. There was an interacting relationship between HRFs, age, TSH levels, and WC group, which is confirmed by prior research that established strategies of avoiding diabetes risk by modeling risk variables, with thyroid function as a probable mechanism (thyroid hormones have an effect on the body’s energy expenditure because they control cellular respiration and thermogenesis, as well as the pace at which the body burns calories at rest).24,25
Second, younger age (β=−0.20) and gender difference (β=−0.35) are associated with HRFs; as a result, preventative actions for elderly individuals with higher problems are required.26 Younger age and female are also associated with high WC levels.27–29 Finally, there is a mediating link between age, metabolic indices, and HRFs, and age moderated the association between HRFs and WC levels. Age also moderated TSH and WC. Diabetes preventive strategies are also available, motivating current analyses of risk scores (including those explored here) to predict diabetes.24
Finally, we used the sensitivity analysis’s results to evaluate our robustness. Furthermore, we discovered a moderate relationship between HRFs, age, TSH level, and diabetes, and TSH coupled HRFs may show to be a complete evaluation approach for assessing metabolic disease development across all glycemic strata.
Correlations Between the Thyroid Function, Age, HRFs and Four WC Group
Obesity is a complicated condition that is caused by a number of variables, including but not limited to genetics, epigenetics, dietary and food environment, physical activity, metabolism, psychological impacts, and environmental factors.3,30 The justification for their focus on the causation of disease based on metabolic indicators and thyroid function is that, while disability has been acknowledged, few research study key components and underlying regulatory mechanisms, such as the hypothalamic-pituitary-thyroid (HPT) axis and obesity,25 so in this study, we looked at the correlation between TSH and obesity, the relationship between HRFs and TSH, as well as age and WC. Previous examined that a slight increase in serum levels of the thyroid-stimulating hormone (TSH) and a higher rate of conversion of thyroxine (T4) to triiodothyronine (T3) in obesity.31 One data from the National Health and Nutrition Examination Survey (NHANES) reported that a positive association between dietary inflammatory (DII) and total T4,32 which DII were also correlated with obesity.33 There was also related correlation between TSH and metabolic syndrome, which stated that clinically hypothyroid subjects had the highest prevalence of MetS (41.6%), abdominal obesity (45%), and hypertriglyceridemia (58%) compared to other groups, and there was higher risk of Mets in subclinically hypothyroid subjects, aged>50.34 Furthermore, HRFs that remain normal have been clearly recognized as viable targets for public health initiatives, not only because HRFs and aging are significantly linked to obesity, but also because they provide a combined effect with TSH value.
In our research, we also looked at the relationship between thyroid function and lipid profiles.35 Previous study has revealed that local T3 affects the expression of several proteins involved in lipid metabolic cycle, and lipogenesis is essential for the maintenance of lipid storage, which is necessary to provide free fatty acids to activate UCP1.36 In addition, the AMPK signal is also involved in the above correlation. Activation of AMPK increases fatty acid oxidation.37 In a cross-sectional study of a Chinese population, it was discovered that women in the subclinical and overt hypothyroidism groups had significantly higher BMI, waist circumference, TGs, SBP, and DBP levels than those in the euthyroid group.38 These almost verified that metabolic syndrome incidence is significantly influenced by thyroid function.38
Limitations and Strength
However, the present study has some limitations that should be taken into consideration. To begin, this was a one-time study that did not involve any long-term follow-up, thus the relative risk could not be evaluated. As a result, to assess the relative risk of FT3 levels within the normal range and obesity in people with type 2 diabetes, additional prospective and longitudinal studies are required. Second, metabolic indicators and thyroid function were only assessed once, which might have resulted in incorrect classifications. Third, we did not measure the population’s reverse triiodothyronine level (rT3). Because diabetes is linked with a low triiodothyronine (T3) syndrome, which predisposes to hypothyroidism, the connection between hypothyroidism and other variables may have been overestimated in this research. Furthermore, the proportion of male patients was substantially higher than the percentage of female patients, which may have an impact on the relationship between thyroid hormone levels and obesity in female patients.
There were also some strengths in our study, the study used the correlation between health risk factors and TSH level to study diabesity and lipid profiles, which can provide a solid theoretical basis for the subsequent combined treatment of behavioral intervention in diabetic patients. This research group will conduct additional studies in the future to further explore the predictive value of these HRFs for clinical outcomes and ultimately as a potential surrogate value for the growing cohort of diabetic patients worldwide. In addition, this study adopted a multicenter and multilevel design and included participants from 4 regions, which was representative to a certain extent.
Implication and Future Direction
The findings of the present study have clinical relevance. First, we show that higher-level HRFs are more likely to show diabesity. Identifying individuals at risk for diabesity based on their HRFs would enable early intervention, addressing their different exposure to environments. Second, different HRFs are factors associated with negative TSH level, and further deepening and guiding our understanding can improve the prevention, diagnosis, and treatment of thyroid problems. Third, the size of the relationship between HRFs, age and diabesity is probably not small, which is expected given the complexity of the different factors that influence the onset and maintenance of diabesity. In the future, we will further determine the possible reasons for the correlation between the comprehensive different influencing factors interact with each other background and diabesity.
Conclusions
Glycolipids and thyroid function are modifiable risk factors for diabetes and metabolic illnesses, as well as for promoting healthy metabolism. Most health surveys now include waist circumference, which is slightly more associated with body fat and also indicates body fat distribution.39 According to research demonstrating that WC and BMI can be used as indicators to predict the severity of diabetes, they were employed as outcome variables in this study to observe the influencing factors that may contribute to diabetes combined with obesity (diabesity).40,41 Early detection of the impact of diabetes on the HPT system would allow for the most effective prevention of metabolic syndrome. Future research is needed to investigate the prognostic value of these health risk factors for clinical outcomes and, ultimately, as potential alternative HRF end-points in the growing global cohort of diabetic patients.
Data Sharing Statement
The datasets generated for this study are available on request to the corresponding author.
Ethics Approval and Consent to Participate
The study was approved by the Ethics Committee of Anhui Medical University. Our study complies with the Declaration of Helsinki. All focus group participants provided signed informed consent prior to the start of the focus groups.
Acknowledgments
We would like to acknowledge all hospital action teams, the staff and participants from the participating hospitals, and our cooperators, for assistance in data collection. We also thanks to Yijing Xu and Yunxia Lu, they are responsible for polishing the language part of the paper in this round of revision.
Author Contributions
All authors made a significant contribution to the work reported, whether that is in the conception, study design, execution, acquisition of data, analysis and interpretation, or in all these areas; took part in drafting, revising or critically reviewing the article; gave final approval of the version to be published; have agreed on the journal to which the article has been submitted; and agree to be accountable for all aspects of the work.
Funding
This research was funded by the Anhui Province Clinical Medical research transformation Project (202204295107020027) and National Natural Science Foundation of China (81970703).
Disclosure
The authors declare there are no competing interests in this work.
References
1. Sutkowska E, Sutkowski K, Sokolowski M, Franek E, Dragan SS. Distribution of the highest plantar pressure regions in patients with diabetes and its association with peripheral neuropathy, gender, age, and BMI: one centre study. J Diabetes Res. 2019;2019:7395769. doi:10.1155/2019/7395769
2. Riobo SP. Obesity and diabetes. Nutr Hosp. 2013;28(Suppl 5):138–143. doi:10.3305/nh.2013.28.sup5.6929
3. Bhupathiraju SN, Hu FB. Epidemiology of obesity and diabetes and their cardiovascular complications. Circ Res. 2016;118(11):1723–1735.
4. Wang X, Liu J, Cheng Z, et al. Triglyceride glucose-body mass index and the risk of diabetes: a general population-based cohort study. Lipids Health Dis. 2021;20(1):99.
5. Zou S, Yang C, Shen R, et al. Association between the triglyceride-glucose index and the incidence of diabetes in people with different phenotypes of obesity: a retrospective study. Front Endocrinol. 2021;12:784616.
6. Zeng ZY, Liu SX, Xu H, et al. Association of triglyceride glucose index and its combination of obesity indices with prehypertension in lean individuals: a cross-sectional study of Chinese adults. J Clin Hypertens. 2020;22(6):1025–1032.
7. Jeong S, Lee JH. The verification of the reliability of a triglyceride-glucose index and its availability as an advanced tool. Metabolomics. 2021;17(11):97.
8. Liu EQ, Weng YP, Zhou AM, Zeng CL. Association between triglyceride-glucose index and type 2 diabetes mellitus in the Japanese population: a secondary analysis of a retrospective cohort study. Biomed Res Int. 2020;2020:2947067.
9. Jun JE, Jee JH, Bae JC, et al. Association between changes in thyroid hormones and incident type 2 diabetes: a seven-year longitudinal study. Thyroid. 2017;27(1):29–38.
10. Pearce EN. Thyroid hormone and obesity. Curr Opin Endocrinol Diabetes Obes. 2012;19(5):408–413. doi:10.1097/MED.0b013e328355cd6c
11. Longhi S, Radetti G. Thyroid function and obesity. J Clin Res Pediatr Endocrinol. 2013;5(Suppl1):40–44. doi:10.4274/jcrpe.856
12. Gierach M, Gierach J, Junik R. Insulin resistance and thyroid disorders. Endokrynol Pol. 2014;65(1):70–76. doi:10.5603/EP.2014.0010
13. Rai S, Kumar JA, K P, et al. Thyroid function in type 2 diabetes mellitus and in diabetic nephropathy. J Clin Diagn Res. 2013;7(8):1583–1585. doi:10.7860/JCDR/2013/6216.3299
14. Jiang T, Zhang Y, Dai F, et al. Advanced glycation end products and diabetes and other metabolic indicators. Diabetol Metab Syndr. 2022;14(1):104. doi:10.1186/s13098-022-00873-2
15. Zhang Y, Jiang T, Liu C, et al. Effectiveness of early advanced glycation end product accumulation testing in the diagnosis of diabetes: a health risk factor analysis using the body mass index as a moderator. Front Endocrinol. 2022;12:766778. doi:10.3389/fendo.2021.766778
16. Zhou B-F. Predictive values of body mass index and waist circumference for risk factors of certain related diseases in Chinese adults--study on optimal cut-off points of body mass index and waist circumference in Chinese adults. Biomed Environ Sci. 2002;15(1):83–96.
17. Chalmers J. 1999 World Health Organization-international society of hypertension guidelines for the management of hypertension. Guidelines subcommittee. J Hypertens. 1999;17(2):151–183.
18. Fouad M, Fathy H, Zidan A. Serum uric acid and its association with hypertension, early nephropathy and chronic kidney disease in type 2 diabetic patients. Jornal Brasileiro de Nefrologia. 2016;38(4):403–410. doi:10.5935/0101-2800.20160065
19. Zoppini G, Targher G, Chonchol M, et al. Serum uric acid levels and incident chronic kidney disease in patients with type 2 diabetes and preserved kidney function. Diabetes Care. 2012;35(1):99–104. doi:10.2337/dc11-1346
20. Alwakeel JS, Isnani AC, Alsuwaida A, et al. Factors affecting the progression of diabetic nephropathy and its complications: a single-center experience in Saudi Arabia. Ann Saudi Med. 2011;31(3):236–242. doi:10.4103/0256-4947.81528
21. Molitch ME, DeFronzo RA, Franz MJ, et al. Nephropathy in diabetes. Diabetes Care. 2004;27(Suppl 1):S79–83.
22. Hayes AF, Rockwood NJ. Regression-based statistical mediation and moderation analysis in clinical research: observations, recommendations, and implementation. Behav Res Ther. 2017;98:39–57.
23. Hausdorf K, Eakin E, Whiteman D, et al. Prevalence and correlates of multiple cancer risk behaviors in an Australian population-based survey: results from the Queensland cancer risk study. Cancer Causes Control. 2008;19(10):1339–1347.
24. Talmud PJ, Hingorani AD, Cooper JA, et al. Utility of genetic and non-genetic risk factors in prediction of type 2 diabetes: Whitehall II prospective cohort study. BMJ. 2010;340:b4838.
25. Walczak K, Sieminska L. Obesity and thyroid axis. Int J Environ Res Public Health. 2021;18(18):1.
26. Vlassara H, Uribarri J. Advanced glycation end products (AGE) and diabetes: cause, effect, or both? Curr Diab Rep. 2014;14(1):453.
27. Iglay K, Hannachi H, Joseph HP, et al. Prevalence and co-prevalence of comorbidities among patients with type 2 diabetes mellitus. Curr Med Res Opin. 2016;32(7):1243–1252.
28. Thijssen DH, Carter SE, Green DJ. Arterial structure and function in vascular ageing: are you as old as your arteries? J Physiol. 2016;594(8):2275–2284.
29. Cooper AJ, Gupta SR, Moustafa AF, Chao AM. Sex/gender differences in obesity prevalence, comorbidities, and treatment. Curr Obes Rep. 2021;10(4):458–466.
30. Theilade S, Christensen MB, Vilsboll T, Knop FK. An overview of obesity mechanisms in humans: endocrine regulation of food intake, eating behaviour and common determinants of body weight. Diabetes Obes Metab. 2021;23(Suppl 1):17–35.
31. Zupo R, Castellana F, Panza F, et al. Adherence to a Mediterranean diet and thyroid function in obesity: a cross-sectional apulian survey. Nutrients. 2020;12:10.
32. Liu N, Ma F, Feng Y, Ma X. The association between the dietary inflammatory index and thyroid function in U.S. adult males. Nutrients. 2021;13:10.
33. Hariharan R, Odjidja EN, Scott D, et al. The dietary inflammatory index, obesity, type 2 diabetes, and cardiovascular risk factors and diseases. Obes Rev. 2022;23(1):e13349.
34. Mehran L, Amouzegar A, Rahimabad PK, et al. Thyroid function and metabolic syndrome: a population-based thyroid study. Horm Metab Res. 2017;49(3):192–200.
35. Volke L, Krause K. Effect of thyroid hormones on adipose tissue flexibility. Eur Thyroid J. 2021;10(1):1–9.
36. Christoffolete MA, Linardi CC, de Jesus L, et al. Mice with targeted disruption of the Dio2 gene have cold-induced overexpression of the uncoupling protein 1 gene but fail to increase brown adipose tissue lipogenesis and adaptive thermogenesis. Diabetes. 2004;53(3):577–584.
37. Lombardi A, de Lange P, Silvestri E, et al. 3,5-Diiodo-L-thyronine rapidly enhances mitochondrial fatty acid oxidation rate and thermogenesis in rat skeletal muscle: AMP-activated protein kinase involvement. Am J Physiol Endocrinol Metab. 2009;296(3):E497–502.
38. He J, Lai Y, Yang J, et al. The relationship between thyroid function and metabolic syndrome and its components: a cross-sectional study in a Chinese population. Front Endocrinol. 2021;12:661160.
39. Han Q, Zhang J, Wang Y, et al. Thyroid hormones and diabetic nephropathy: an essential relationship to recognize. Nephrology. 2019;24(2):160–169.
40. Rosique-Esteban N, Papandreou C, Romaguera D, et al. Cross-sectional associations of objectively-measured sleep characteristics with obesity and type 2 diabetes in the PREDIMED-Plus trial. Sleep. 2018;41:12.
41. Ortega MA, Fraile-Martinez O, Naya I, et al. Type 2 diabetes mellitus associated with obesity (diabesity). the central role of gut microbiota and its translational applications. Nutrients. 2020;12:9.
 © 2023 The Author(s). This work is published and licensed by Dove Medical Press Limited. The
full terms of this license are available at https://www.dovepress.com/terms
and incorporate the Creative Commons Attribution
- Non Commercial (unported, 3.0) License.
By accessing the work you hereby accept the Terms. Non-commercial uses of the work are permitted
without any further permission from Dove Medical Press Limited, provided the work is properly
attributed. For permission for commercial use of this work, please see paragraphs 4.2 and 5 of our Terms.
© 2023 The Author(s). This work is published and licensed by Dove Medical Press Limited. The
full terms of this license are available at https://www.dovepress.com/terms
and incorporate the Creative Commons Attribution
- Non Commercial (unported, 3.0) License.
By accessing the work you hereby accept the Terms. Non-commercial uses of the work are permitted
without any further permission from Dove Medical Press Limited, provided the work is properly
attributed. For permission for commercial use of this work, please see paragraphs 4.2 and 5 of our Terms.