Back to Journals » Diabetes, Metabolic Syndrome and Obesity » Volume 17
The Correlation Between Glycation Gap and Renal Complications in Patients with Type 2 Diabetes Mellitus
Authors Le TQ ![]() , Thanh KM
, Thanh KM ![]() , Tran TV, Nguyen DTB, Nguyen LT, Pham DT, Dam LTP
, Tran TV, Nguyen DTB, Nguyen LT, Pham DT, Dam LTP ![]() , Hoang MT
, Hoang MT ![]() , Huynh TQ
, Huynh TQ ![]()
Received 16 October 2023
Accepted for publication 16 January 2024
Published 23 January 2024 Volume 2024:17 Pages 333—341
DOI https://doi.org/10.2147/DMSO.S439800
Checked for plagiarism Yes
Review by Single anonymous peer review
Peer reviewer comments 2
Editor who approved publication: Prof. Dr. Muthuswamy Balasubramanyam
Tuan Quoc Le,1 Khanh Minh Thanh,1 Tien Van Tran,2 Dao Thi Bich Nguyen,3 Le Thi Nguyen,4 Diep Thao Pham,5 Lan Thi Phuong Dam,6 Minh Thị Hoang,6 Thuan Quang Huynh6
1Department of Physiology-Pathophysiology-Immunology, Faculty of Medicine, University of Medicine and Pharmacy at Ho Chi Minh City, Ho Chi Minh City, Vietnam; 2Department of Nephrology, Ho Chi Minh City Hospital for Rehabilitation - Professional Diseases, Ho Chi Minh City, Vietnam; 3Tam Duc Heart Hospital, Ho Chi Minh City, Vietnam; 4Nephrology Department, University Medical Center, Ho Chi Minh City, Vietnam; 5Biochemistry Department, Viet Duc Hospital, Ha Noi, Vietnam; 6Biochemistry Department, 103 Military Medical Hospital, Vietnam Military Medical University (VMMU), Ha Noi City, Vietnam
Correspondence: Thuan Quang Huynh, Biochemistry Department, 103 Military Medical Hospital, Vietnam Military Medical University (VMMU), No. 160, Phung Hung Street, Phuc La Ward, Ha Dong District, Hanoi City, Vietnam, Tel +84904175342, Email [email protected]
Purpose: The aim of this study was to investigate the correlations between the glycation gap (GG) and renal complications such as urinary albumin–creatinine ratio (UACR) and estimated glomerular filtration rate (eGFR) in type 2 diabetes mellitus patients.
Materials and Methods: A cross-sectional study was conducted on 104 individuals (52 males and 52 females), aged 36– 93 years old. Fasting blood glucose (FBG), HbA1c, and serum fructosamine were measured simultaneously. GG was calculated as the difference between the measured and fructosamine-based predicted HbA1c levels (FHbA1c).
Results: There was a moderately positive correlation between HbA1c and fructosamine concentration (r = 0.488; p < 0.001). GG was positively correlated with UACR (r = 0.3275; p = 0.0007), negatively correlated with eGFR (r = − 0.3400; p = 0.0004). HbA1c was positively correlated with UACR (r = 0.2437; p = 0.0127) but not correlated with eGFR (r = − 0.444; p = 0.6542). Fructosamine has a positive correlation with eGFR (r = 0.2426; p = 0.0131) but not with UACR (r = − 0.1021; p = 0.3025).
Conclusion: GG was positively correlated with UACR and inversely correlated with eGFR in type 2 Diabetes mellitus patients. This suggests that GG is a valuable index for predicting kidney complications due to diabetes.
Keywords: type 2 diabetes, HbA1c, fructosamine, glycated gap, glomerular filtration rate, urinary albumin-creatinine ratio
Introduction
Globally, the prevalence of diabetes mellitus (DM) has been rising disproportionately in low- and middle-income countries.
As reported by the International Diabetes Federation in 2021, the prevalence estimates of diabetes among people aged 20–79 years old was 10.5% (536.6 million people) and is predicted to increase to 12.2% (783 million) by 2045.1
Hemoglobin A1c (HbA1c) is the standardized measurement of glycemic control used for patients with DM, because of its standardization and high correlation with the average blood glucose value.2 Despite the advantages of HbA1c, it is not a conclusive indicator for ascertaining long-term blood sugar levels, as it does not consider the variations in the correlation between HbA1c and average glucose level among individuals. Therefore, using HbA1c as the sole indicator to monitor blood glucose control can lead to mistakes in treatment planning and the prevention of DM complications, particularly chronic kidney disease.3–5 The variations in potential underlying mechanisms can result in HbA1c concentrations that do not accurately reflect prevailing glycemia, as they are the net product of multiple reactions and processes.
Consequently, it is essential to use a collection of indicators for monitoring blood glucose control. Studies on glycation gap (GG) have been conducted with initial promising results. GG is defined as the difference between the measured concentration of HbA1c and the concentration that would be predicted from its regression on the fructosamine concentration. Fructosamine presents several advantages over mean blood glucose when assessing non-glycemic determinants of HbA1c. First, fructosamine level is more stable than glucose itself. Second, fructosamine represents the two-week blood glucose exposure, whereas frequent seven-point blood glucose profiles or continuous blood glucose monitoring is required to evaluate mean glucose. Fructosamine, in contradistinction to mean blood glucose, allows for the comparison of the protein glycation difference between extracellular space (fructosamine) and intracellular space (HbA1c in red blood cells and, by assumption, in target tissues).
Studies conducted in several countries have shown associations between GG and the risk of occurrence and progression of diabetic renal complications, with numerous advantages over using single indicators such as fasting blood glucose or HbA1c.3,5–7 This study was conducted to investigate the GG and its association with some markers of renal complication in patients with type 2 DM in Vietnam.
Materials and Methods
Sample Size
Our study to investigate the correlation of GG between renal complications including UACR and eGFR in diabetes mellitus patients. To calculate the sample sizes needed to detect relevant correlations with a probability of type I error (α-level) of 0.05, a probability of type II error (β-level) of 0.1 (power is 90%), the following formula was used:
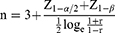
With:
n: a minimum sample size would be required for a simple correlation
α: a probability of type I error (α-level), so Z1-α/2 = 1.96
β: a probability of type II error (β-level). So Z1-β = 1.282
r: expected correlation between the two variables.
Previous studies reported a correlation between GG and UACR (r = 0.622) by Mishra et al.8 GG and eGFR (r = 0.318) by Kim et al.9 Therefore, the minimum required sample size for each correlation is 47 and 100, respectively.
Subjects
A cross-sectional study was conducted on 104 diagnosed type 2 DM patients attending University Medical Center-Branch 2, Ho Chi Minh City, Viet Nam from November 2019 to November 2021. The patients diagnosed with type 2 DM were chosen based on Classification and Diagnosis of Diabetes: Standards of Medical Care in Diabetes-2019 of the American Diabetes Association in 2019,10 aged more than 18 years old and voluntarily consented to participate in the study.
The exclusion criteria include patients with diagnosed hemoglobinopathies or anemia of any other causes (hemoglobin < 11.8 g/dL), hypoproteinemia (<6.6 g/dL) or hypoalbuminemia (<3.4 g/dL), non-diabetic glomerulonephritis, nephrotic syndrome, continued or recurring hematuria for more than 3 months indicated by urinalysis, acute kidney injury or rapidly progressive renal failure, kidney transplantation, serum creatinine abnormalities unrelated to chronic kidney disease (muscle hypertrophy, bodybuilders, pregnancy, children, amputation, muscular atrophy, muscular dystrophy), endocrine disorders (thyroid dysfunction, pregnancy, prolonged use of corticosteroids), and malignant conditions.
Clinical Examination and Testing
All the participants’ clinical characteristics were documented when they had their routine assessments in the hospital. Blood pressure measurements were taken in the right arm with a sphygmomanometer after the patient had been resting for 20 minutes in a seated position. Height and body weight were measured by a constant electronic scale. The body mass index (BMI) is calculated. Blood pressure (BP) including systolic blood pressure (SBP) and diastolic blood pressure (DBP) were recorded sequentially in three separate one-minute intervals. The average of the three measurements of diastolic and systolic blood pressure was taken for analysis.
Blood samples with 10 mL were collected after the patients had fasted for a minimum of eight hours. The biochemical indicators were analyzed on the automatic analyzer system Cobas 6000 analyzer (Roche Diagnostics, Switzerland). Fasting blood glucose concentration was measured by the hexokinase method using Cobas 6000 analyzer (Roche Diagnostics, Switzerland) (mg/dL). Fructosamine concentration was measured by the colorimetric method using Cobas 8000 (Roche Diagnostics, Switzerland) (µmol/L). HbA1c measurement was determined by the high-performance liquid chromatography (HPLC) assay on a Bio-Rad D-10 analyzer (Bio-Rad Laboratories, USA) (%). Serum creatinine concentration was measured by the two-point kinetic method (mg/dL). Serum cystatin C concentration was measured by the latex particle-enhanced immunoturbidimetry assay (mg/L). The spot urine specimens were taken to measure urinary albumin and creatinine concentrations by a Mission® U500 urine analyzer (ACON Laboratories, USA).
Definitions of Variables
Variables for Renal Outcome
Urinary albumin and creatinine concentrations were determined in the urine specimens that are collected early in the morning with approximately 15–30 mL of urine. Urinary albumin to creatinine ratio (UACR) was divided into 3 groups: Normal (<3 mg/mmol), microalbuminuria (3–30 mg/mmol) and macroalbuminuria (≥30 mg/mmol).
In the research, creatinine-based eGFR was used to assess renal function via the 2021 CKD-EPI Creatinine-Cystatin C: 135 × min(Scr/κ,1)α × max(Scr/κ,1)−0.544 × min(Scys/0.8,1)−0.323 × max(Scys/0.8,1)−0.778 × 0.9961Age × 0.963 [if female].
Abbreviations/Units:
Scr (Serum creatinine) = mg/dL
Scys (Serum cystatin C) = mg/L
κ = 0.7 (females) or 0.9 (males)
α = −0.219 (females) or −0.144 (males)
min = indicates the minimum of SCr/κ or 1
max = indicates the maximum of SCr/κ or 1 age = years
Calculation of Glycation Gap Based on Fructosamine Concentration and HbA1c
GG was calculated by the method introduced by David R. Macdonald et al.11
Each fructosamine value is converted into its standard normal deviate (SND):

Fructosamine SNDs were converted to HbA1c equivalents (FHbA1c) using the mean and SD for HbA1c:

The GG was the difference between the true HbA1c and FHbA1c:

Ethical Consideration
The protocol of the study was approved by the Review Board of Ethics in Biomedical Research, University of Medicine and Pharmacy at Ho Chi Minh City (No: 394/ĐHYD-HĐĐĐ). Written consent was acquired before any patients were recruited into the study.
Statistical Analysis
The data were analyzed using SPSS 22.0 (IBM Corporation, Armonk, N.Y., USA). Data distributions were evaluated using the Kolmogorov–Smirnov test. The ANOVA test was applied to differentiate the mean of more than two groups with normal distributions. Non-normally distributed variables were examined through the Mann–Whitney U-test, one-way Kruskal–Wallis analysis of variance, and the Friedman test. Correlation and linear regression within variables were analyzed by using Pearson’s or Spearman’s analysis. The two-tailed p < 0.05 was determined to be statistically significant.
Results
Characteristics of Participants
The baseline characteristics of study population are shown in Table 1. The mean age of the study group was 66.30 ± 13.60 years old. No statistically significant differences in mean age, SBP, DBP and duration of DM between male and female groups were observed.
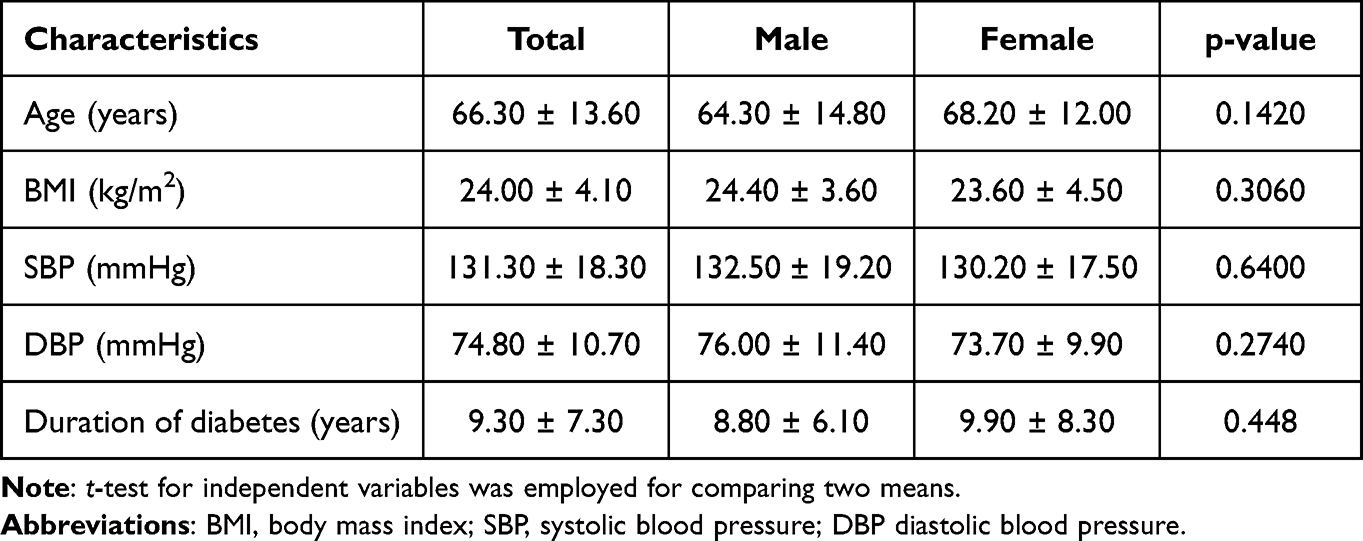 |
Table 1 Clinical Characteristics of Study subjects |
Correlation Between HbA1c and Fructosamine and Glycation Gap
There was a moderate positive correlation between HbA1c and fructosamine (r = 0.4883, p < 0.001) (Figure 1). In the study population, fructosamine 245.40 ± 88.60 (mol/L), HbA1c was 7.40 ± 1.80 (%). Our study shows that the regression of HbA1c on fructosamine using the 208 measurements from the 104 patients produced the following relationship:

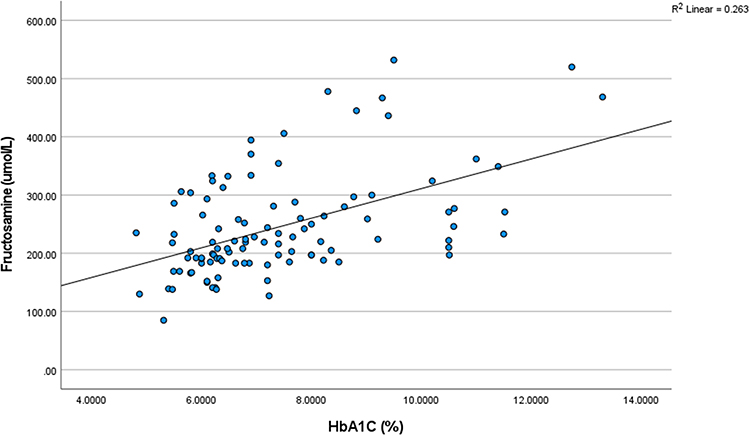 |
Figure 1 The correlation between HbA1c and serum fructosamine. |
So that, GG can be calculated by the following formula:

After calculating GG values of individual patients, our study showed a moderate correlation between GG and HbA1c (r = 0.3187; p = 0.010) (Figure 2).
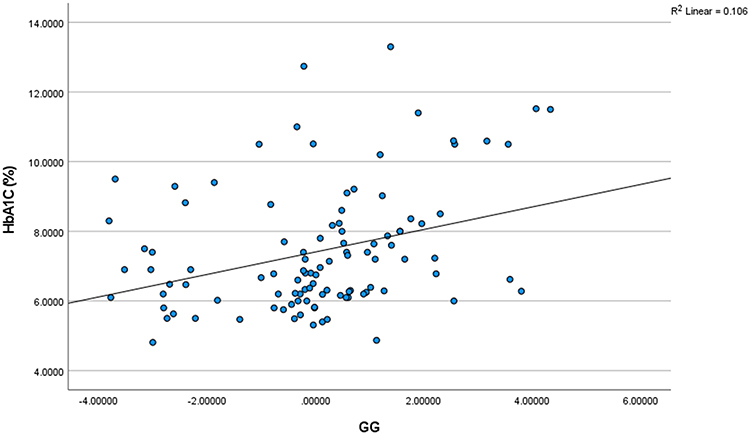 |
Figure 2 The correlation between GG and HbA1c. Abbreviation: GG, glycation gap. |
The Association Between Some Glycemic Parameters and UACR
In Table 2 and Figure 3, we observed a moderate positive correlation (r = 0.3275; p = 0.0007) between GG and UACR. However, there was a weak positive correlation between HbA1c and UACR (r = 0.2437; p = 0.0127). FBG (r = 0.1846; p = 0.0607); and serum fructosamine (r = −0.1021; p = 0.3025) were not significantly correlated with UACR.
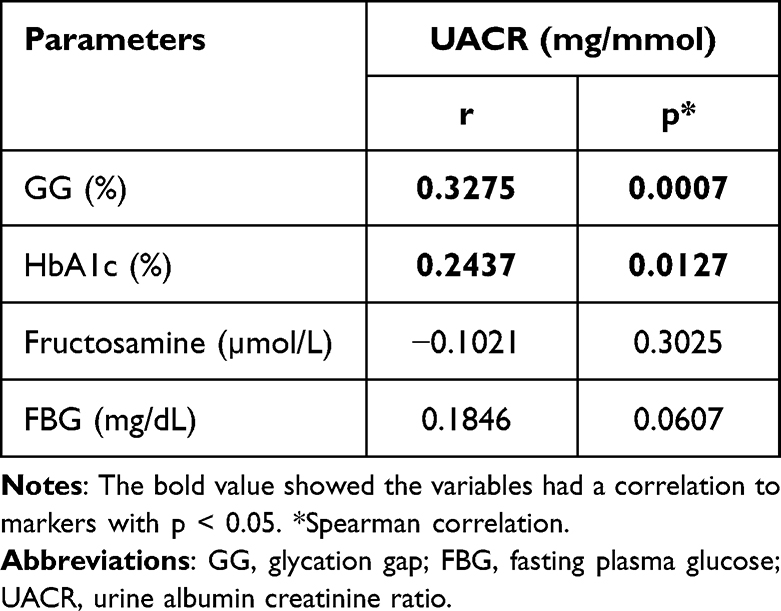 |
Table 2 Correlation Between UACR and Some Glycemic Parameters |
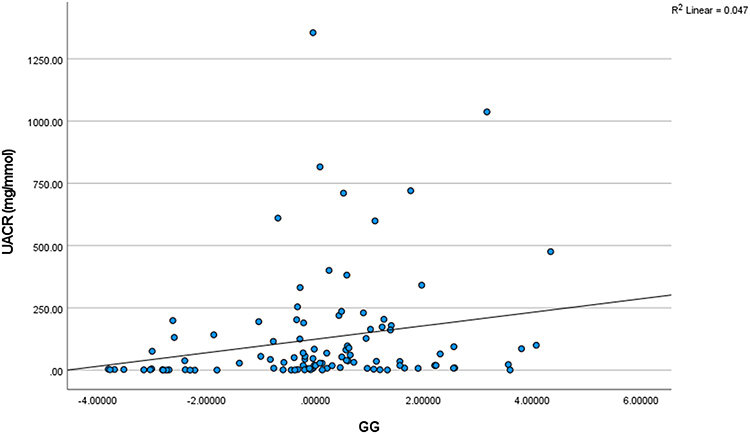 |
Figure 3 The correlation between GG and UACR. Abbreviations: GG, glycation gap; UACR, urinary albumin creatinine ratio. |
In Table 3, regarding categories for albuminuria, there was a significant difference (p < 0.001) in the means of GG among the 3 albuminuria-based groups: A1 (−1.52 ± 1.50), A2 (0.49 ± 1.60) and A3 (0.40 ± 1.60). The means of GG were significantly (p = 0.0155) higher in macroalbuminuria group (−0.48 ± 1.84) compared to non-macroalbuminuria group (0.40 ± 1.60). HbA1c value showed a significant rise (p = 0.048) in macroalbuminuria group (7.7 ± 2.0) in comparison with non-macroalbuminuria group (7.10 ± 1.50).
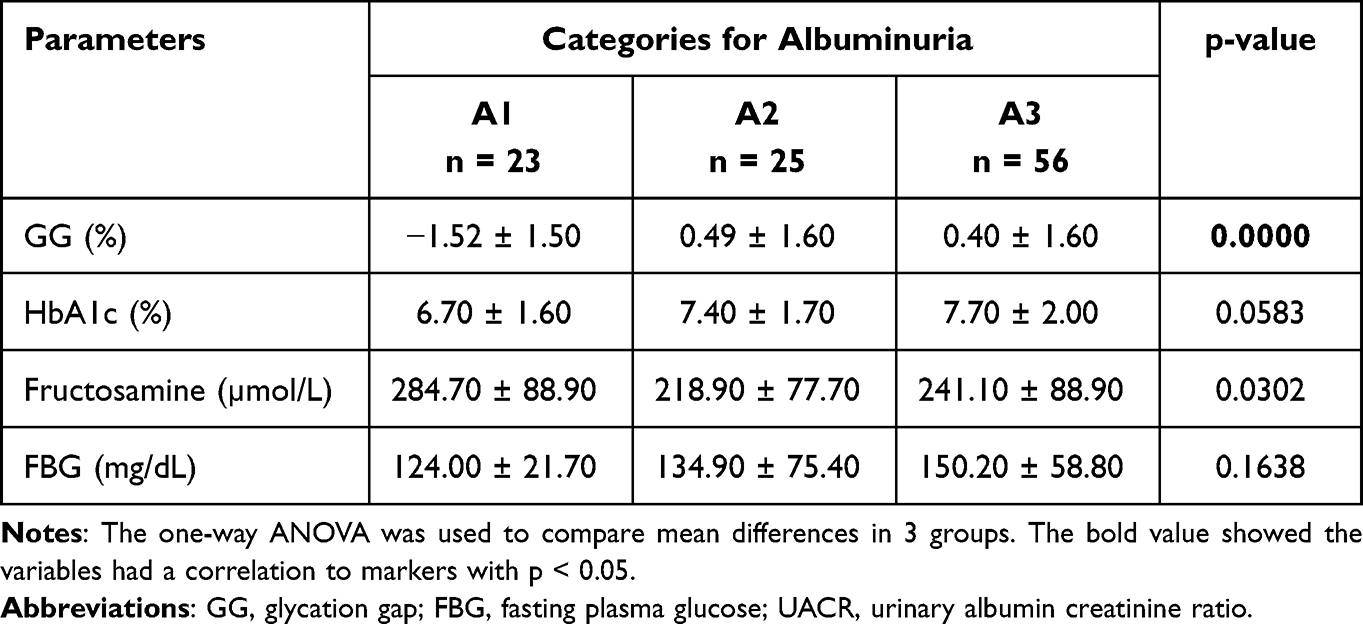 |
Table 3 Relationships Between Some Glycemic Parameters and UACR |
The Association Between Some Glycemic Parameters and eGFR
Our study showed a moderate negative correlation between GG and eGFR and it was significant statistically (r = −0.3400; p = 0.0004) as presented in Table 4 and Figure 4. There was a weak positive correlation between plasma fructosamine concentration and eGFR (r = 0.2426; p = 0.0131). Both of FBG (r = 0.1249; p = 0.2065) and HbA1c (r = −0.444; p = 0.6542) were not significantly correlated with eGFR.
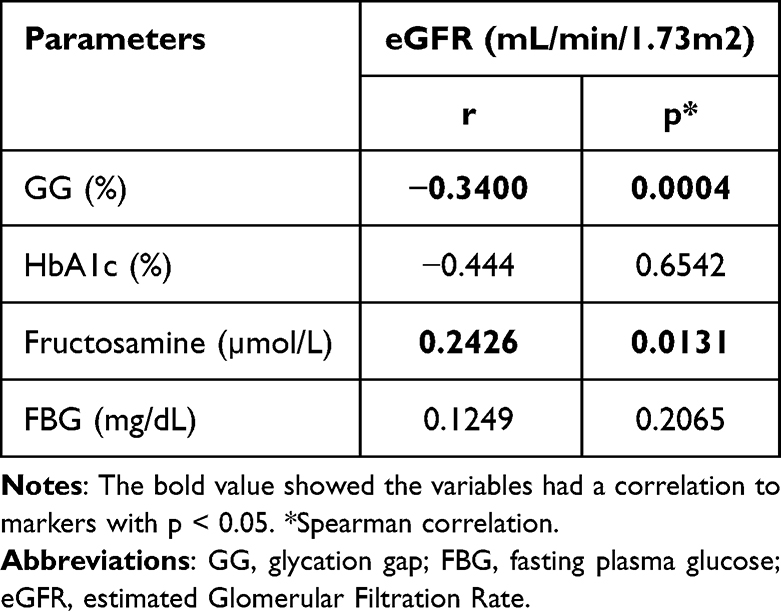 |
Table 4 Correlation Between Some Glycemic Parameters and eGFR |
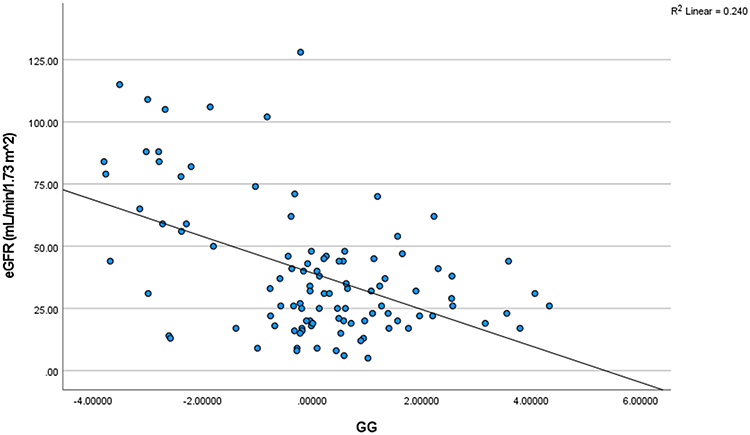 |
Figure 4 The correlation between GG and eGFR. Abbreviations: GG, glycation gap; eGFR, estimated glomerular filtration rate. |
In Table 5, regarding an eGFR of less than 60 mL/min/1.73 m2, there was a significant difference (p < 0.001) in the means of GG among 2 groups of patients, eGFR < 60 group (0.32 ± 1.55) and eGFR ≥ 60 group (−1.44 ± 1.96).
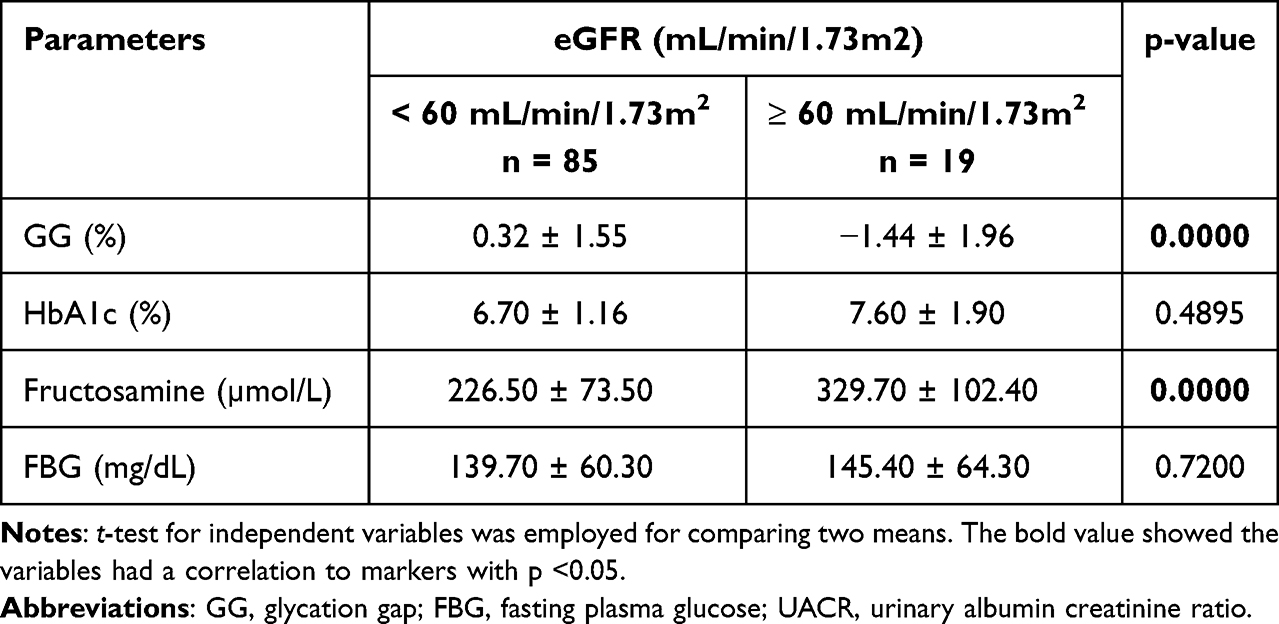 |
Table 5 Relationships Between Some Glycemic Parameters and eGFR |
Discussion
Glycation is a continuous process In diabetes that targets hemoglobin and serum proteins. In fact, non-enzymatic glycation is closely linked to hyperglycemia and leads to chronic diabetes-related complications as well as the fragmentary changes that occur during aging.12 Currently, although HbA1c is useful for monitoring blood glucose, clinicians still encounter discordance between HbA1c and other measures of blood glucose control among their patients. Besides, HbA1c is not considered a reliable marker due to the longer lifespan of red blood cells and in people with diseases related to hemoglobin metabolism.13 Fructosamine (1-amino-1-deoxy fructose), is a stable ketoamine, formed by the reaction between glucose and the amino group of protein (predominantly albumin, but also including globulins and lipoprotein); it is a measure of average glycemic control over a shorter period of time (2–3 weeks).14 Reducing HbA1c and fructosamine will help reduce the risk of chronic complications in diabetic patients, including kidney disease.15 In this study, we found that HbA1c and fructosamine have a moderate correlation. This result is also similar to the research findings of Cohen et al reporting that HbA1c and fructosamine are highly correlated in diabetic nephropathy.3 Similarly, Neelofar et al also showed a positive association between the percentage of glycosylated hemoglobin and fructosamine in patients with type 2 diabetes and chronic kidney disease.13 This suggests that fructosamine is a reliable Marker for monitoring glycemic control and has an important role in diabetes onset.
GG is defined as the difference between measured HbA1c and HbA1c predicted from another measure of glycemic control such as fructosamine, based on population regression of HbA1c on fructosamine.3 In a clinical study, GG was detected is currently a better index than HbA1c in assessing the risk of death and hospitalization in diabetic hemodialysis patients.16 Other clinical reports also support that GG is considered a better indicator than HbA1c to assess the progression of renal dysfunction.17 Our study shows a moderate correlation between the glycation gap and HbA1c (Figure 2). This positive correlation between GG and HbA1c was lower compared to the study by Rodriguez-Segade et al.18 Nayak et al also observed a coefficient correlation between GG and HbA1c that was quite similar to our study.7 These differences might arise because that the study by Rodriguez-Segade et al used the old method to calculate the GG by using the linear regression model between HbA1c and fructosamine developed by Cohen et al3,18 while both of our study and study by U. Nayak used method using SDNs of fructosamine.7
Diabetic kidney disease is a serious microvascular complication of diabetes and has become a major cause of chronic renal failure.19 Early detection of diabetic kidney disease and implementation of the most effective targeted interventions are important steps to prevent the development chronic complications of diabetes mellitus. Diabetic patients should be screened through albuminuria and eGFR testing to detect early signs of diabetic kidney disease at a stage when effective therapies can be applied.20 In fact, the correlation between GG and diabetes complication rates has been proven through many studies. Results from research by a Robert Cohen et al have suggested that each 1% increase in GG predicts a 2.9-fold increase in the frequency of progression of diabetic nephropathy.3 Nayak et al conducted research and demonstrated that positive GG is associated with a more severe progression of complications of retinopathy (OR 1.96; p = 0.001), kidney disease (OR 1.85; p = 0.012) and macrovascular complications (OR 1.91; p = 0.008).7 In the present study, a moderate positive correlation between the GG and UACR (Figure 3). Study by Cosson et al observed a similar result with a positive correlation between GG and UACR.21 Meanwhile, we recorded only a weak positive correlation between HbA1c and UACR. FBG and serum fructosamine did not show significant correlations with GG (Table 2). Our findings indicate a significant difference in mean GG among three groups of patients A1, A2 and A3 (Table 3). There is a significant difference in the mean GG between non-macroproteinuria group and macroproteinuria group. Besides, the results of our study indicate that there is a moderate negative correlation between eGFR and GG (Figure 4) but a weak positive correlation with fructosamine and not a significant correlation with FBG, HbA1c (Table 4 and Table 5). Therefore, it is evident that GG provides a superior advantage compared to other glycemic indices when evaluating the decline of renal function in diabetic patients. It is necessary to explore potential factors affecting rapid kidney function decline for type 2 diabetic patients. It should be noted that, however, our study employed a cross-sectional descriptive study, which made it impossible to evaluate the cause-and-effect relationships. Further prospective validation studies should be conducted to investigate and facilitate the causal relationship between GG and renal complications in diabetes mellitus patients.
Conclusion
There were significant correlations between GG with eGFR and UACR, suggesting that GG may be a useful clinical research tool to evaluate renal complications in type 2 Diabetes mellitus patients.
Acknowledgments
We thank all patients for their participation in this study. We appreciate the support of University of Medicine and Pharmacy at Ho Chi Minh City. We also would like to thank University Medical Center-Branch 2 for support during the implementation of our study.
Author Contributions
All authors made a significant contribution to the work reported, whether that is in the conception, study design, execution, acquisition of data, analysis and interpretation, or in all these areas; took part in drafting, revising or critically reviewing the article; gave final approval of the version to be published; have agreed on the journal to which the article has been submitted; and agree to be accountable for all aspects of the work.
Disclosure
The authors report no conflicts of interest in this work.
References
1. Saeedi P, Petersohn I, Salpea P, et al. Global and regional diabetes prevalence estimates for 2019 and projections for 2030 and 2045: results from the International Diabetes Federation Diabetes Atlas, 9(th) edition. Diabet Res Clin Pract. 2019;157:107843. doi:10.1016/j.diabres.2019.107843
2. Diabetes Care. 6. Glycemic Targets: standards of Medical Care in Diabetes-2019. Diabetes Care. 2019;42(Suppl 1):S61–S70. doi:10.2337/dc19-S006
3. Cohen RM, Holmes YR, Chenier TC, Joiner CH. Discordance between HbA1c and fructosamine: evidence for a glycosylation gap and its relation to diabetic nephropathy. Diabetes Care. 2003;26(1):163–167. doi:10.2337/diacare.26.1.163
4. Gerber SM, Stickle DF, Ahmed I, Jabbour SA. Glycated hemoglobin, serum proteins, and other markers as tools for monitoring. International Textbook of Diabetes Mellitus. Wiley Online Library; 2015:853–871.
5. Nayak AU, Singh BM, Dunmore SJ. Potential clinical error arising from use of HbA1c in diabetes: effects of the glycation gap. Endocrine Reviews. 2019;40(4):988–999. doi:10.1210/er.2018-00284
6. Cohen RM, Franco RS, Smith EP, Higgins JM. When HbA1c and blood glucose do not match: how much is determined by race, by genetics, by differences in mean red blood cell age? J Clin Endocrinol Metab. 2019;104(3):707–710. doi:10.1210/jc.2018-02409
7. Nayak AU, Nevill AM, Bassett P, Singh BM. Association of glycation gap with mortality and vascular complications in diabetes. Diabetes Care. 2013;36(10):3247–3253. doi:10.2337/dc12-1040
8. Mishra S, Das UK, Rattan R, Mandal MK, Baliarsingh AK. Study on association of glycation gap in diabetes mellitus with renal complication. Int J Res Rev. 2020;7(11):252–257.
9. Kim MK, Yun KJ, Kwon HS, Baek KH, Song KH. Discordance in the levels of hemoglobin A1C and glycated albumin: calculation of the glycation gap based on glycated albumin level. J Diabetes Complicat. 2016;30(3):477–481. doi:10.1016/j.jdiacomp.2015.12.022
10. American Diabetes Association. 2. Classification and diagnosis of diabetes: standards of medical care in diabetes-2019. Diabetes Care. 2019;42(Suppl 1):S13–S28. doi:10.2337/dc19-S002
11. Macdonald DR, Hanson AM, Holland MR, Singh BM. Clinical impact of variability in HbA1c as assessed by simultaneously measuring fructosamine and use of error grid analysis. Ann Clin Biochem. 2008;45(4):421–425. doi:10.1258/acb.2008.007259
12. Priego Capote F, Sanchez JC. Strategies for proteomic analysis of non-enzymatically glycated proteins. Mass Spectrom Rev. 2009;28(1):135–146. doi:10.1002/mas.20187
13. Neelofar K, Ahmad J. Glycosylation gap in patients with diabetes with chronic kidney disease and healthy participants: a comparative study. Indian J Endocrinol Metab. 2017;21(3):410–414. doi:10.4103/ijem.IJEM_2_17
14. Neelofar K, Ahmad J. Amadori albumin in diabetic nephropathy. Indian J Endocrinol Metab. 2015;19(1):39–46. doi:10.4103/2230-8210.146863
15. Valeri C, Pozzilli P, Leslie D. Glucose control in diabetes. Diabetes Metab Res Rev. 2004;20 Suppl 2(S2):S1–S8. doi:10.1002/dmrr.512
16. Freedman BI, Andries L, Shihabi ZK, et al. Glycated albumin and risk of death and hospitalizations in diabetic dialysis patients. Clin J Am Soc Nephrol. 2011;6(7):1635–1643. doi:10.2215/cjn.11491210
17. Nayak AU, Holland MR, Macdonald DR, Nevill A, Singh BM. Evidence for consistency of the glycation gap in diabetes. Diabetes Care. 2011;34(8):1712–1716. doi:10.2337/dc10-1767
18. Rodríguez-Segade S, Rodríguez J, Cabezas-Agricola JM, Casanueva FF, Camiña F. Progression of nephropathy in type 2 diabetes: the glycation gap is a significant predictor after adjustment for glycohemoglobin (Hb A1c). Clin Chem. 2011;57(2):264–271. doi:10.1373/clinchem.2010.144949
19. American Diabetes Association. 11. Microvascular Complications and Foot Care: standards of Medical Care in Diabetes-2021. Diabetes Care. 2021;44(Suppl 1):S151–S167. doi:10.2337/dc21-S011
20. American Diabetes Association. 11. Microvascular complications and foot care: standards of medical care in diabetes-2019. Diabetes Care. 2019;42(1):S124–S138. doi:10.2337/dc19-S011
21. Cosson E, Banu I, Cussac-Pillegand C, et al. Glycation gap is associated with macroproteinuria but not with other complications in patients with type 2 diabetes. Diabetes Care. 2013;36(7):2070–2076. doi:10.2337/dc12-1780
 © 2024 The Author(s). This work is published and licensed by Dove Medical Press Limited. The
full terms of this license are available at https://www.dovepress.com/terms
and incorporate the Creative Commons Attribution
- Non Commercial (unported, 3.0) License.
By accessing the work you hereby accept the Terms. Non-commercial uses of the work are permitted
without any further permission from Dove Medical Press Limited, provided the work is properly
attributed. For permission for commercial use of this work, please see paragraphs 4.2 and 5 of our Terms.
© 2024 The Author(s). This work is published and licensed by Dove Medical Press Limited. The
full terms of this license are available at https://www.dovepress.com/terms
and incorporate the Creative Commons Attribution
- Non Commercial (unported, 3.0) License.
By accessing the work you hereby accept the Terms. Non-commercial uses of the work are permitted
without any further permission from Dove Medical Press Limited, provided the work is properly
attributed. For permission for commercial use of this work, please see paragraphs 4.2 and 5 of our Terms.
Recommended articles
Data-Driven Identification of Long-Term Glycemia Clusters and Their Individualized Predictors in Finnish Patients with Type 2 Diabetes
Lavikainen P, Chandra G, Siirtola P, Tamminen S, Ihalapathirana AT, Röning J, Laatikainen T, Martikainen J
Clinical Epidemiology 2023, 15:13-29
Published Date: 5 January 2023
A Patient-Centered Self-Management Intervention to Improve Glycemic Control, Self-Efficacy and Self-Care Behaviors in Adults with Type 2 Diabetes Mellitus: A SPIRIT Compliant Study Protocol for Randomized Controlled Trial
Asmat K, Dhamani K, Froelicher ES, Gul R
Diabetes, Metabolic Syndrome and Obesity 2023, 16:225-236
Published Date: 26 January 2023
Explainable Prediction of Long-Term Glycated Hemoglobin Response Change in Finnish Patients with Type 2 Diabetes Following Drug Initiation Using Evidence-Based Machine Learning Approaches
Chandra G, Lavikainen P, Siirtola P, Tamminen S, Ihalapathirana A, Laatikainen T, Martikainen J, Röning J
Clinical Epidemiology 2025, 17:225-240
Published Date: 8 March 2025
Normoglycemia and Weight Reduction: Perspectives of People with Type 2 Diabetes in Australia
Newson RS, Barraclough H, Lapthorn J, Stewart M, Colman S, D’Emden M
Patient Preference and Adherence 2025, 19:897-905
Published Date: 4 April 2025
Association Between Serum Vitamin D Levels and Metformin Efficacy in Obese Type 2 Diabetes Patients: A Retrospective Cohort Study Based on HbA1c Reduction
Wang Y, Liu H, Li Y, Wnag X, He C, Wei Z
Therapeutics and Clinical Risk Management 2026, 22:565034
Published Date: 13 February 2026