Back to Journals » Journal of Pain Research » Volume 16
The Consistency Between the Preoperative 3D-Reconstructed Meckel’s Cave and the Intraoperative Balloon Results in Percutaneous Balloon Compression
Authors Cheng R, Wang T, Cai Y, Chai S, Shen L, Xu D, Yang J, Yue C, Pu J, Xiong N
Received 16 May 2023
Accepted for publication 17 August 2023
Published 28 August 2023 Volume 2023:16 Pages 2929—2937
DOI https://doi.org/10.2147/JPR.S420283
Checked for plagiarism Yes
Review by Single anonymous peer review
Peer reviewer comments 2
Editor who approved publication: Dr Krishnan Chakravarthy
Runqi Cheng,1 Tiansheng Wang,1 Yuankun Cai,1 Songshan Chai,1 Lei Shen,1 Dongyuan Xu,1 Jingyi Yang,1 Chuqiao Yue,1 Jianzhang Pu,2 Nanxiang Xiong1
1Department of Neurosurgery, Zhongnan Hospital of Wuhan University, Wuhan, Hubei Province, People’s Republic of China; 2Department of Neurosurgery, Beijing Shunyi District Hospital, Shunyi Teaching Hospital of Capital Medical University, Beijing, People’s Republic of China
Correspondence: Nanxiang Xiong, Email [email protected]
Objective: To predict the volume and shape of the balloon before PBC by reconstructing the Meckel’s cave (MC) and establishing a volumetric measurement model, supporting preoperative preparation and intraoperative decisions.
Methods: The clinical data of 31 patients with good therapeutic effects who underwent PBC are retrospectively collected, including preoperative MRI, the volume of contrast agent injected into the balloon, and intraoperative lateral X-ray images. The MC on the affected side of the 31 patients is reconstructed based on MRI using 3D Slicer, while the volume of the MC is calculated to compare with the volume of contrast agent. The width (W) and length (L) of the model of the MC in lateral view are measured and used to classify the shape of the MC based on W/L. The consistency between the W/L of the model of the MC and the W/L of the intraoperative balloon is evaluated.
Results: For volume, the mean value of the models of the MC (V1) in 31 patients is 399.77± 155.13 mm³, while the mean value of the contrast agent injected during PBC (V2) is 539.03± 111.93 mm³. The formula obtained by linear regression is V2= 392.1 + 0.3676×V1. Based on the value of W/L, the shape of the MC is classified into thin “pear” in 5 patients (16.13%), standard “pear” in 22 patients (70.97%), and square “pear” in 4 patients (12.90%). There is no significant difference in W/L between the models of the MC and the intraoperative balloons in 31 patients (P=0.221).
Conclusion: In 31 patients with good efficacy, it is verified that the prediction of the MC before PBC by 3D Slicer is consistent with the actual situation of the intraoperative balloon. This method can provide certain basis for preoperative preparation and intraoperative judgment.
Keywords: trigeminal neuralgia, percutaneous balloon compression, Meckel’s cave, 3D Slicer, reconstruction
Introduction
Trigeminal neuralgia (TN) is a common neuropathic pain syndrome characterized by sudden and usually unilateral severe transient stinging recurrent pain within the distribution range of one or more branches of the trigeminal nerve.1 According to statistics, the incidence of TN is between 0.03% and 0.3%.2,3 Carbamazepine is the first choice for the initial treatment of TN. It is common, however, for the drugs’ effect to wane over time.4 When medication fails to relieve the pain, a variety of surgical methods can be considered for treatment, such as microvascular decompression and percutaneous puncture.5
Percutaneous treatments for TN include percutaneous balloon compression (PBC), glycerol rhizotomy, and percutaneous radiofrequency thermocoagulation.6 Among them, PBC has certain advantages. It provides immediate pain relief after surgery, and is performed under general anesthesia, reducing patients’ discomfort. Besides, PBC has an acceptable recurrence rate and tolerable complications, making it one of the most widely used methods for percutaneous treatment of TN.5,6 Lately, robotic-assisted stereotactic PBC makes the operation of PBC simpler and more accurate, and easier for physicians to operate.7
Previous studies have shown that the efficacy of PBC is related to factors such as balloon volume, balloon compression time, and balloon shape.8 The formation of a typical “pear” balloon is considered a key to successful PBC.9–11 Currently, during the operation, clinical doctors mainly observe the shape of the balloon from lateral X-ray images, which has limitations because similar false “pear” may occur with different puncture locations, leading to poor postoperative outcomes. Whether a “pear” is achieved depends on the experience of the doctor and is short of objective basis to support it.12 Thus, there is a lack of methods that can assist operators in accurately judging the shape and volume of the balloon during the surgery.
In this study, 3D Slicer is used to reconstruct the Meckel’s cave (MC) and calculate its volume based on preoperative MRI of 31 patients who had favorable outcomes after PBC within the past 1.5 years. Additionally, we compare the consistency between the MC and the intraoperative balloon, aiming to provide better preoperative preparation and intraoperative decision-making basis for clinical practice.
Methods
Selection and Collection of the Patients’ Data
Patients were included if: (1) diagnosed with TN; (2) refused microvascular decompression and accepted PBC only. Patients were excluded if: (1) image data was unavailable; (2) MRI sequences could not be imported into 3D Slicer; (3) intraoperative lateral X-ray images did not show a typical “pear”; (4) TN recurred within six months. Finally, we selected 31 patients with good surgical outcomes in the Department of Neurosurgery at Zhongnan Hospital of Wuhan University from May 2021 to November 2022. Preoperative MRI, intraoperative lateral X-ray images and the volume of the balloon were collected for all patients. The mean age is 70.67 years ± 7.62 (range, 59–82 years) for male patients and 69.26 years ± 8.32 (range, 52–84 years) for female patients, and an overall mean age of 69.81 years ± 7.96 (range, 52–84 years). Other relevant information is shown in Table 1. Since this is a retrospective study that does not involve exposure of patient privacy, the Ethics Committee of Zhongnan Hospital of Wuhan University approved the exemption of patient informed consent. The privacy of all patients is protected and complies with the Declaration of Helsinki.
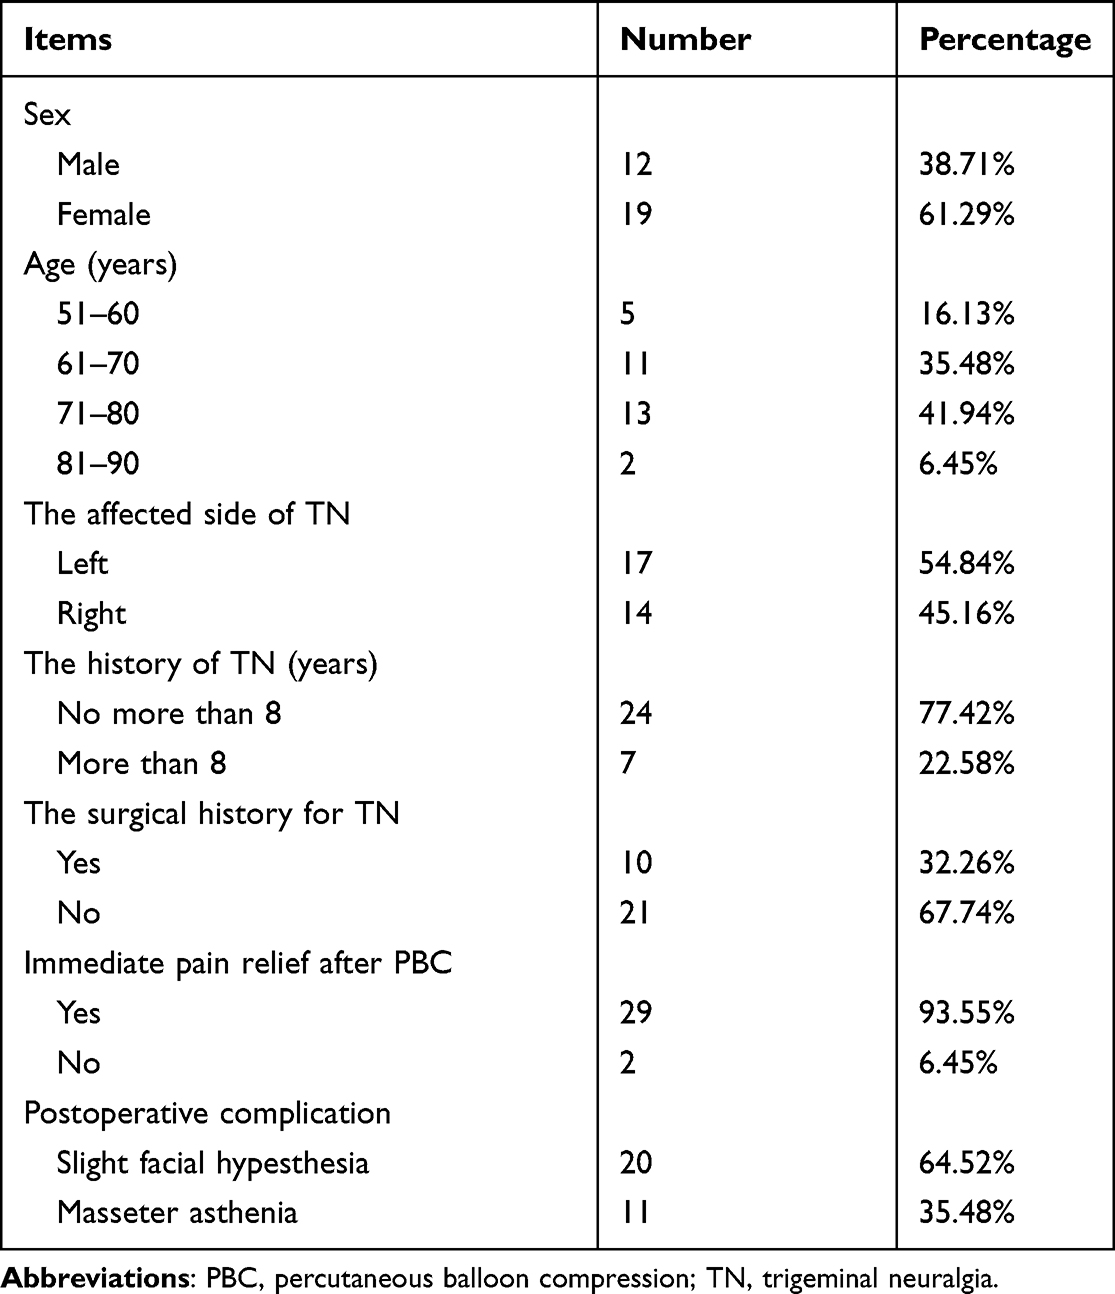 |
Table 1 The Information of 31 Patients and Their Outcomes After PBC |
Surgical Procedure
After successful general anesthesia, the patient was placed in the supine position with the head slightly tilted back. According to the Hartel anterior approach, the needles were punctured into the foramen ovale at the intersection of the vertical line of the outer orbital margin and the labial line. After evacuation of air from the balloon, the balloon was placed into MC under C arm or digital subtraction angiography guidance. Subsequently, the balloon was slowly filled with an iohexol contrast agent. On the lateral view, the surgeons adjusted the balloon position to obtain a standard pear shape. When the “pear” appeared, continuous compression was applied for 2.5 minutes. After compression, the contrast was drained to remove the compression on the ganglion. Then, the catheter and puncture needle were withdrawn, and the puncture site was compressed for 5 minutes. The volume of the injected contrast agent was recorded as the intraoperative balloon volume. After the procedure, the patients were monitored for 6 hours and discharged after being determined to be free of risk.
Reconstruction of the MC on the Affected Side Based on Preoperative MRI and Calculation of Its Volume
First, import the patient’s MRI data into 3D Slicer and open T2-SPACE or CISS sequence. Second, choose the Segment Editor tool and delineate the image of the MC layer by layer from three directions: sagittal, coronal, and axial. Third, open Conventional Widescreen to view the established model of the MC, and compare it with the contour of the MC on MRI to modify the parts where the delineating is not accurate (Figure 1). After confirming the completion of the model of the MC, choose the Data module, export the established model from Segment to Models, and then choose the Models module to check the volume and record it. All model construction and volume measurement are performed by the same doctor.
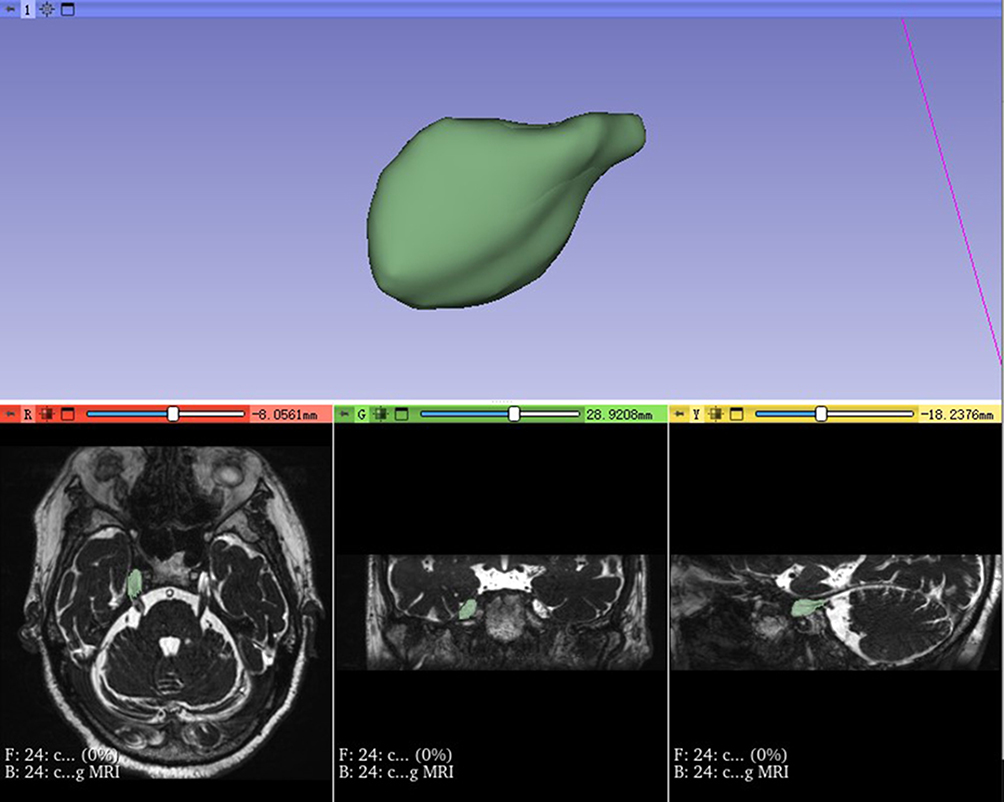 |
Figure 1 Reconstruction of the Meckel’s cave. In 3D Slicer, the Meckel’s cave on the affected side is delineated layer by layer from the sagittal, coronal and axial position based on preoperative MRI. |
Measurement of the Width (W) and Length (L) of the Model of the MC in Lateral View and the Intraoperative Balloon
Adjust the view of the MC model in 3D Slicer to match the direction of the corresponding intraoperative lateral X-ray image and take a screenshot. Open the lateral view of the model and intraoperative balloon from the same patient in Adobe Photoshop 2022 and use the ruler tool to measure the W and L of both (Figure 2). For the lateral view of the model of the MC, L1 is defined as the maximum length from the entrance of the MC to the tail of it. W1 is defined as the maximum width from the top to the bottom of the MC, which is perpendicular to L1 (Figure 2A and B). For the intraoperative balloon, L2 is defined as the maximum length from the head of the balloon to the tail of it. W2 is defined as the maximum width from the top to the bottom of the balloon, which is perpendicular to L2 (Figure 2C and D). All measurements of W and L are performed by the same doctor as in the previous step.
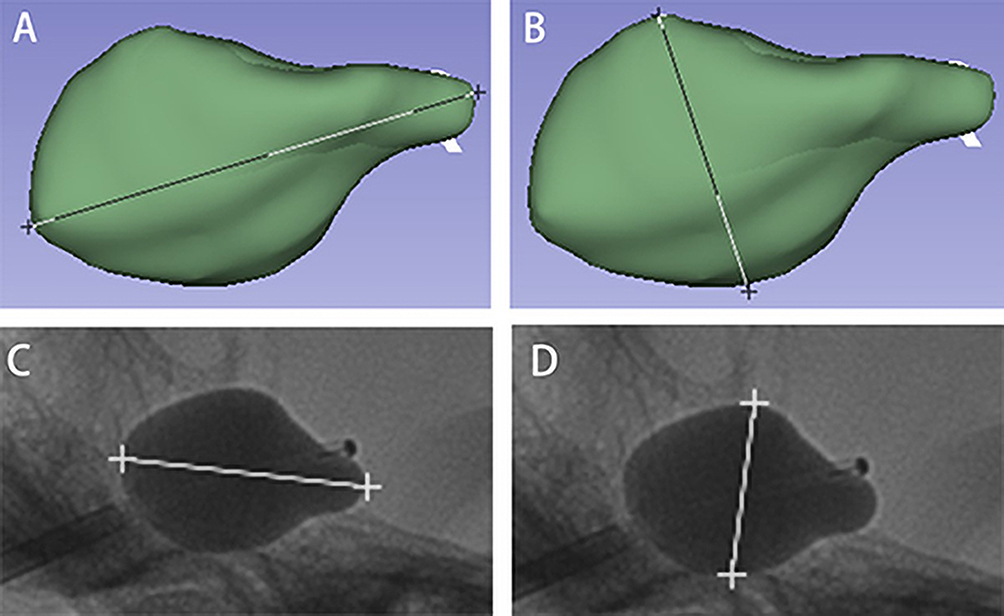 |
Figure 2 Measurement of the length and width. (A and B): The measurement of the length and width of the model of the Meckel’s cave in lateral view; (C and D): The measurement of the length and width of the intraoperative balloon. |
Shape Classification and Consistency Comparison of the Model of the MC in Lateral View
In order to better explore the consistency between preoperative reconstruction of the MC and intraoperative balloon, the values of W1/L1 and W2/L2 are calculated for each patient after the measurement is completed. Subsequently, shape classification and consistency comparison are performed based on W1/L1 and W2/L2.
Data Analysis
A box plot is used to describe the overall distribution of the volume of the MC model (V1) and the volume of the intraoperative balloon (V2), as well as W1/L1 and W2/L2. Shapiro–Wilk test, Pearson correlation coefficient test, Mann–Whitney U-test and Bartlett test were used to verify the normality, linearity, independence and equal variance of V1 and V2. Then, V1 is used as the independent variable and V2 as the dependent variable for linear regression analysis to test the correlation between the two. Independent samples t-test is performed to compare the difference between W1/L1 and W2/L2. All of the above analyses are conducted using GraphPad Prism 9.
Results
The Correlation Between V1 and V2
The mean value of V1 in 31 patients is 399.77±155.13 mm³ (range, 139.99–645.30 mm³), while the mean value of V2 is 539.03±111.93 mm³ (range, 300.00–800.00 mm³). After the normality, linearity, independence and equal variance of V1 and V2 were verified by Shapiro–Wilk test, Pearson correlation coefficient test, Mann–Whitney U-test and Bartlett test, linear regression analysis was performed on V1 and V2. The formula for linear regression is V2= 392.1 + 0.3676×V1 (Figure 3). F-test conducted on the formula indicates that V1 certainly has an influence on V2 (F=10.921, p=0.003<0.05), which indicates that it is appropriate to use the linear model to describe the relationship between them.
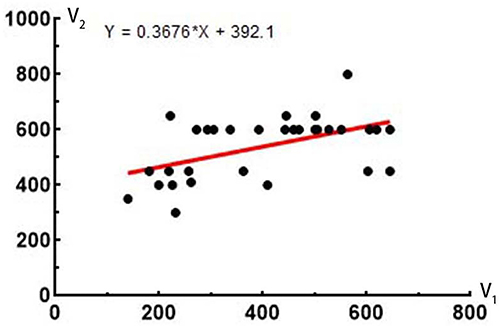 |
Figure 3 The result of linear regression analysis. According to the results of linear regression analysis, there is a correlation between V1 and V2, and the fitted equation is V2= 392.1 + 0.3676×V1. |
The Consistency Between W1/L1 and W2/L2
The mean value of W1/L1 in 31 patients is 0.61±0.13 (range, 0.38–0.89), while the mean value of W2/L2 is 0.65±0.10 (range, 0.42–0.81). The overall distribution of W1/L1 and W2/L2 are shown in the box plot (Figure 4A). The result of t-test shows that there is no significant difference between W1/L1 and W2/L2 (P=0.221>0.05) (Figure 4B), which indicates that the result of the MC model in lateral view is consistent with the result of the intraoperative balloon in the patients with good efficacy after PBC.
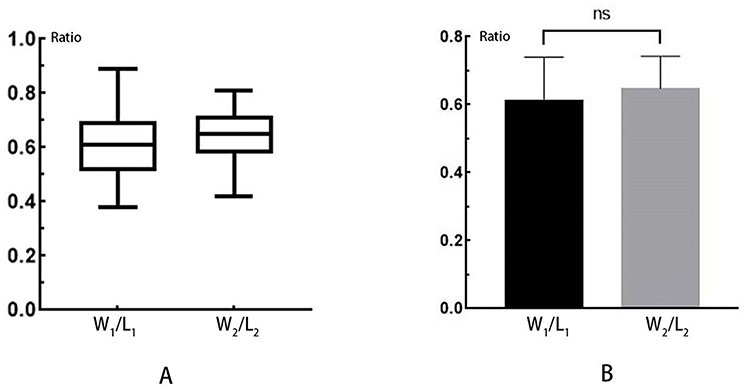 |
Figure 4 The consistency between W1/L1 and W2/L2. (A): The overall distribution of W1/L1 and W2/L2; (B): The result of t-test shows that there is no significant difference between the two. |
The Classification of the MC Model in Lateral View Based on W1/L1
When 0<W1/L1≤0.5, the MC model in lateral view is defined as thin “pear” in 5 patients (16.13%) (Figure 5A and D). When 0.5<W1/L1≤0.75, the MC model in lateral view is defined as standard “pear” in 22 patients (70.97%) (Figure 5B and E). When 0.75<W1/L1<1.0, the MC model in lateral view is defined as square “pear” in 4 patients (12.90%) (Figure 5C and F).
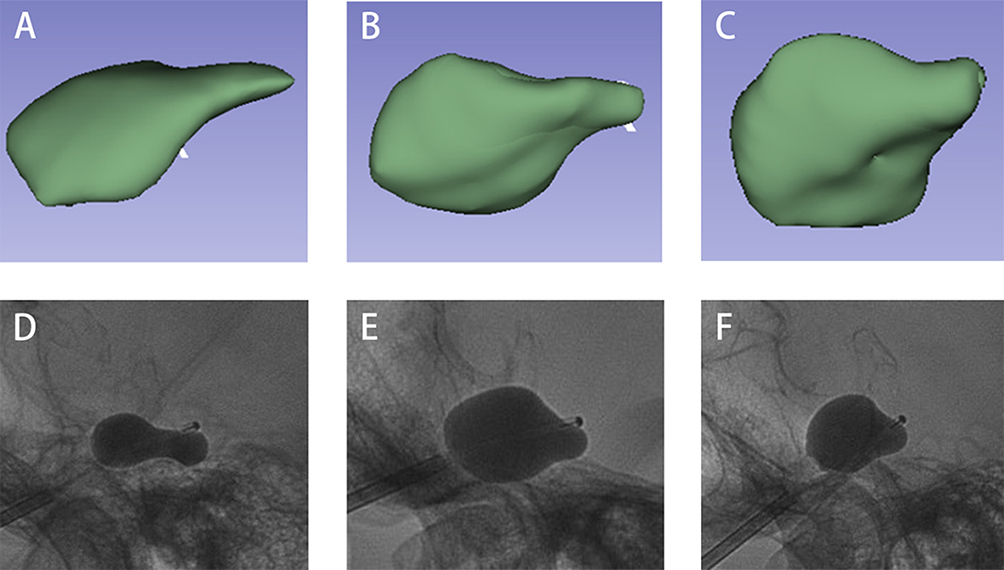 |
Figure 5 The classification of the model in lateral view. (A–C): The shape of the model of the Meckel’s cave is classified into thin “pear”, standard “pear” and square “pear” based on W1/L1; (D–F): The corresponding intraoperative balloons for each kind of “pear”. |
Discussion
In 1983, Mullan and Lichtor first proposed the use of PBC to treat TN by mechanically compressing the trigeminal ganglion inside the MC.13 This method aims to relieve pain by selectively damaging larger myelinated nerve fibers associated with pain transmission, while preserving smaller unmyelinated nerve fibers.13,14
Since PBC has been used for the treatment of TN, numerous factors have been reported to affect its efficacy. Studies have shown that a lack of long-term history of TN, absence of multiple sclerosis, involvement of only a single trigeminal nerve branch, typical “pear” balloon during surgery, balloon compression time less than 5 minutes, sufficient balloon volume, and absence of delayed pain relief after PBC are indicative of good outcomes.8,15,16 This study uses 3D Slicer to establish a predictive model for balloon shape and volume, providing surgeons with information on the expected “pear” appearance as a basis for judging whether the shape achieved during operation is satisfactory.
In the exploration of the correlation between the volume of the model of the MC and the volume of the balloon, a linear regression analysis is conducted on V1 and V2. The results show that there is a certain correlation between the two, and the volume of contrast agent needed is estimable based on the volume prediction formula obtained from linear regression. It is worth noting that the balloon volume of most patients (25/31, 80.65%) is larger than the volume of the model of the MC. The anatomical structure of the MC itself may be the reason for this result. The MC is formed by continuous dura mater, which separates the contents of the trigeminal nerve and trigeminal ganglion from the middle cranial fossa below and the temporal lobe above.17 In order to cause sufficient compression to the trigeminal nerve during PBC, a small amount of contrast agent may still need to be injected after the balloon is initially filled in the MC, which may displace the surrounding tissues of the MC and result in changes in its volume. This indicates that the volume required to achieve the ideal “pear” during PBC is often larger than the volume of the MC. The results estimated based on the volume prediction formula are more reliable than predicting the volume based on the volume of the model of the MC alone.
In previous studies of the MC, Lin et al reconstructed the MC based on images to study the relationship between the flatness of the MC and TN, and mentioned that the intraoperative balloon can be predicted by establishing a model of the MC.18 However, there is no research comparing the consistency between the model of the MC and the result of intraoperative balloon. In this study, after reconstructing a model of the MC, the W and L of the model and intraoperative balloon are measured to quantify the shape characteristics of both by calculating the value of W/L, which simplify the comparison. According to the results, there is no significant difference between W1/L1 and W2/L2 (P=0.221), which indicates that the lateral view of the MC model can assist neurosurgeons to some extent in judging whether the balloon is inflated to an appropriate shape, instead of relying solely on the experience and feeling of themselves. When the shape of the balloon is similar to the lateral view of the model, combined with the volume of contrast agent calculated by the formula, if the volumes are close, it suggests that the ideal compression situation has been achieved. At this time, the next step can be decided based on the operator’s feelings and experience.
The size of the MC has been measured using axial and sagittal MRI in former studies.19,20 Tsutsumi et al classified the MC into bulbous, oval, and flat shapes based on the ratio of the height of the MC to the width of its entrance on the sagittal images.20 In contrast, in this article, the MC is divided into thin “pear”, standard “pear”, and square “pear” on the basis of W1/L1. This classification provides better assistance in determining whether the intraoperative balloon reaches the desired situation. Obtaining a “pear” balloon in PBC is a crucial step. Sun et al described the reasons for different balloon shapes on lateral X-ray during PBC and the significance of different shapes, which helps identify suboptimal balloon shapes other than the “pear” to achieve the optimal effect of PBC.21 However, different patients have different MC, and the “pear” they can obtain also have their own characteristics. Our classification can not only assist in identifying atypical balloon shape caused by abnormal balloon positioning but also help understand the feature of each patient’s MC, so as to form a balloon shape that is more suitable for each patient during the surgery. For example, if a patient with a thin “pear” MC gets a standard “pear” or even square “pear” in PBC, it may indicate excessive compression of the trigeminal nerve and trigeminal ganglion, which could increase the incidence of sensory disturbances, severe numbness, and masseter weakness, thus affecting the efficacy of PBC.22 Conversely, inadequate compression may result in decreased pain relief rate and increased recurrence of TN.23
The preceding study by Fan et al also reconstructed the MC and obtained formula to forecast the intraoperative balloon volume.24 The mean volume of the MC in the patients with good prognosis counted in their study is 440.00 ± 110.00 mm³, which is almost the same with the results for the patients included in this study (399.77±155.13 mm³). The reason for this small volume difference may be that the two experiments were modeled by different operators, so there may be habitual bias or inconsistent interpretation of the scope of the MC when plotting. In addition, different modeling software may have different resolutions, which may also affect the plotting.
In other related studies, the measurement of the size of the MC has also been used to investigate whether it is associated with diseases. Kamali et al found that patients with idiopathic intracranial hypertension had larger and distinctively shaped MC, the shape and size of which could serve as sensitive and specific diagnostic imaging markers for the diagnosis of idiopathic intracranial hypertension.25 The mean volume of both MC was not significantly different in TN patients and the control group in the study of Hořínek et al. This suggests that there is no association between TN and the size of the MC.26
During the reconstruction, it is important to carefully delineate the extent of the MC, extending slightly beyond the entrance of it. Otherwise, it may lead to improper estimation of the balloon shape. Due to the narrow entrance of the MC compared to the cave itself, a small protrusion can form by the balloon around the entrance, causing compression and damage to the trigeminal nerve roots. In cases where this protrusion is not formed, the analgesic effect may be worse.12 Therefore, when reconstructing the MC, this protrusion should be taken into consideration to achieve satisfactory therapeutic results.
This study has certain limitations. First, it is a single-center retrospective study with a limited number of cases. The number of cases in this study met the basic requirements for calculation. However, a multicenter study with a large sample size may acquire better linear regression results and more accurate estimation of the required contrast agent volume. Second, the distinguishability of 3D Slicer is limited, which may result in small deviations when delineating the MC, and this can be improved by using more precise delineation tools.
Conclusion
By comparing the results of the 3D-reconstructed MC before PBC with the results of intraoperative balloon, a consistency is proved between the two. On the one hand, this method helps to predict the approximate volume of contrast agent for PBC and the shape of the patient’s balloon on lateral X-ray. On the other hand, it contributes to identifying undesirable balloon shapes formed during the surgery and assists in determining whether the “pear” formed during PBC conforms to the patient’s MC, thereby providing better basis for preoperative preparation and intraoperative decisions.
Author Contributions
All authors made a significant contribution to the work reported, whether that is in the conception, study design, execution, acquisition of data, analysis and interpretation, or in all these areas; took part in drafting, revising or critically reviewing the article; gave final approval of the version to be published; have agreed on the journal to which the article has been submitted; and agree to be accountable for all aspects of the work.
Funding
This study was not funded.
Disclosure
The authors have no competing interests to declare that are relevant to the content of this article.
References
1. Garg RK, Malhotra HS, Verma R. Trigeminal neuralgia. J Indian Med Assoc. 2011;109(9):631–636.
2. De toledo IP, Conti RJ, Fernandes M, et al. Prevalence of trigeminal neuralgia: a systematic review. J Am Dent Assoc. 2016;147(7):570–576. doi:10.1016/j.adaj.2016.02.014
3. Mueller D, Obermann M, Yoon MS, et al. Prevalence of trigeminal neuralgia and persistent idiopathic facial pain: a population-based study. Cephalalgia. 2011;31(15):1542–1548. doi:10.1177/0333102411424619
4. Zakrzewska JM, Linskey ME. Trigeminal neuralgia. BMJ. 2015;350:h1238. doi:10.1136/bmj.h1238
5. Jones MR, Urits I, Ehrhardt KP, et al. A comprehensive review of trigeminal neuralgia. Curr Pain Headache R. 2019;23(10). doi:10.1007/s11916-019-0810-0
6. Cheng JS, Lim DA, Chang EF, Barbaro NM. A review of percutaneous treatments for trigeminal neuralgia. Neurosurgery. 2014;10 Suppl 1:25–33, 33. doi:10.1227/NEU.00000000000001687
7. Graciolli Cordeiro J, Assumpcao de monaco B, Theodotou CB, Luther E, Benjamin CG, Jagid JR. Robotic-assisted stereotactic percutaneous balloon compression for trigeminal neuralgia treatment. Clin Neurol Neurosurg. 2022;221:107412. doi:10.1016/j.clineuro.2022.107412
8. Kouzounias K, Schechtmann G, Lind G, Winter J, Linderoth B. Factors that influence outcome of percutaneous balloon compression in the treatment of trigeminal neuralgia. Neurosurgery. 2010;67(4):925–934. doi:10.1227/NEU.0b013e3181eb5230
9. Asplund P, Linderoth B, Bergenheim AT. The predictive power of balloon shape and change of sensory functions on outcome of percutaneous balloon compression for trigeminal neuralgia. J Neurosurg. 2010;113(3):498–507. doi:10.3171/2010.2.JNS091466
10. Goerss SJ, Atkinson JL, Kallmes DF. Variable size percutaneous balloon compression of the gasserian ganglion for trigeminal neuralgia. Surg Neurol. 2009;71(3):388–390, 391. doi:10.1016/j.surneu.2007.09.040
11. Stomal-Slowinska M, Slowinski J, Lee TK, et al. Correlation of clinical findings and results of percutaneous balloon compression for patients with trigeminal neuralgia. Clin Neurol Neurosurg. 2011;113(1):14–21. doi:10.1016/j.clineuro.2010.08.005
12. Xia Y, Yu G, Min F, Xiang H, Huang J, Leng J. The focus and new progress of percutaneous balloon compression for the treatment of trigeminal neuralgia. J Pain Res. 2022;15:3059–3068. doi:10.2147/JPR.S374433
13. Mullan S, Lichtor T. Percutaneous microcompression of the trigeminal ganglion for trigeminal neuralgia. J Neurosurg. 1983;59(6):1007–1012. doi:10.3171/jns.1983.59.6.1007
14. Brown JA, Hoeflinger B, Long PB, et al. Axon and ganglion cell injury in rabbits after percutaneous trigeminal balloon compression. Neurosurgery. 1996;38(5):993–1003, 1003–1004. doi:10.1097/00006123-199605000-00028
15. Lv W, Hu W, Chi L, Zhang L. Factors that may affect recurrence of trigeminal neuralgia after percutaneous balloon compression. J Clin Neurosci. 2022;99:248–252. doi:10.1016/j.jocn.2022.03.022
16. Montano N, Papacci F, Cioni B, Di Bonaventura R, Meglio M. The role of percutaneous balloon compression in the treatment of trigeminal neuralgia recurring after other surgical procedures. Acta Neurol Belg. 2014;114(1):59–64. doi:10.1007/s13760-013-0263-x
17. Li Y, Zhang XA, Qi S. Anatomic characteristics of the dural sheath of the trigeminal nerve. Head Neck. 2016;38(Suppl 1):E185–E188. doi:10.1002/hed.23968
18. Lin J, Zhang Y, Li W, Yan J, Ke Y. Flatness of the Meckel cave may cause primary trigeminal neuralgia: a radiomics-based study. J Headache Pain. 2021;22(1):104. doi:10.1186/s10194-021-01317-4
19. Sen S, Bilgin S, Atasever A. Morphometric evaluation of trigeminal nerve and Meckel cave with 3.0 magnetic resonance imaging. J Anat Soc India. 2020;69(1):31. doi:10.4103/JASI.JASI_38_19
20. Tsutsumi S, Ono H, Ishii H. Meckel cave: an anatomical study using magnetic resonance imaging. J Comput Assist Tomogr. 2021;45(5):743–748. doi:10.1097/RCT.0000000000001185
21. Sun C, Zheng W, Zhu Q, Du Q, Yu W. The transformation of the balloon shape in percutaneous balloon compression for trigeminal neuralgia. J Pain Res. 2021;14:3805–3814. doi:10.2147/JPR.S343783
22. Lobato RD, Rivas JJ, Sarabia R, Lamas E. Percutaneous microcompression of the gasserian ganglion for trigeminal neuralgia. J Neurosurg. 1990;72(4):546–553. doi:10.3171/jns.1990.72.4.0546
23. Zanusso M, Curri D, Landi A, Colombo F, Volpin L, Cervellini P. Pressure monitoring inside meckel’s cave during percutaneous microcompression of gasserian ganglion. Stereotact Funct Neurosurg. 1991;56(1):37–43. doi:10.1159/000099391
24. Fan X, Lu Z, Ren H, et al. Meckel’s cave size measured by magnetic resonance imaging in the prognosis of percutaneous balloon compression for trigeminal neuralgia. Pain Phys. 2022;25(8):E1279–E1287.
25. Kamali A, Sullivan KC, Rahmani F, et al. Indentation and transverse diameter of the Meckel cave: imaging markers to diagnose idiopathic intracranial hypertension. Am J Neuroradiol. 2020;41(8):1487–1494. doi:10.3174/ajnr.A6682
26. Hořínek D, Brezová V, Nimsky C, et al. The mri volumetry of the posterior fossa and its substructures in trigeminal neuralgia: a validated study. Acta Neurochir. 2009;151(6):669–675. doi:10.1007/s00701-009-0283-8
 © 2023 The Author(s). This work is published and licensed by Dove Medical Press Limited. The
full terms of this license are available at https://www.dovepress.com/terms
and incorporate the Creative Commons Attribution
- Non Commercial (unported, 3.0) License.
By accessing the work you hereby accept the Terms. Non-commercial uses of the work are permitted
without any further permission from Dove Medical Press Limited, provided the work is properly
attributed. For permission for commercial use of this work, please see paragraphs 4.2 and 5 of our Terms.
© 2023 The Author(s). This work is published and licensed by Dove Medical Press Limited. The
full terms of this license are available at https://www.dovepress.com/terms
and incorporate the Creative Commons Attribution
- Non Commercial (unported, 3.0) License.
By accessing the work you hereby accept the Terms. Non-commercial uses of the work are permitted
without any further permission from Dove Medical Press Limited, provided the work is properly
attributed. For permission for commercial use of this work, please see paragraphs 4.2 and 5 of our Terms.
Recommended articles
The Focus and New Progress of Percutaneous Balloon Compression for the Treatment of Trigeminal Neuralgia
Xia Y, Yu G, Min F, Xiang H, Huang J, Leng J
Journal of Pain Research 2022, 15:3059-3068
Published Date: 29 September 2022
Robot-Assisted Percutaneous Balloon Compression in Elderly Patients with Trigeminal Neuralgia

Tan K, Li J, Peng Y, Wu W, Yang Z, Wang Y, Wang Y
Journal of Pain Research 2023, 16:1161-1168
Published Date: 6 April 2023