")
Back to Journals » Diabetes, Metabolic Syndrome and Obesity » Volume 16
The Combination of Remnant Cholesterol and Waist Circumference Offers Predictive Value for Nonalcoholic Fatty Liver Disease: A Cross-Sectional Study from a Medical Examination Center
Received 11 July 2023
Accepted for publication 25 October 2023
Published 2 November 2023 Volume 2023:16 Pages 3459—3469
DOI https://doi.org/10.2147/DMSO.S429963
Checked for plagiarism Yes
Review by Single anonymous peer review
Peer reviewer comments 2
Editor who approved publication: Prof. Dr. Juei-Tang Cheng
Zhuoya Jia,1,2 Xiaoyu Pan,1,2 Shuchun Chen2,3
1Graduate School of Hebei Medical University, Shijiazhuang, People’s Republic of China; 2Department of Endocrinology, Hebei General Hospital, Shijiazhuang, People’s Republic of China; 3Key Laboratory of Metabolic Diseases of Hebei Province, Shijiazhuang, People’s Republic of China
Correspondence: Shuchun Chen, Department of Endocrinology, Hebei General Hospital, 348 Heping West Road, Shijiazhuang, 050051, People’s Republic of China, Tel/Fax +86 31185988406, Email [email protected]
Objective: To explore the association between levels of remnant cholesterol (RC) and the incidence of non-alcoholic fatty liver disease (NAFLD) in the general population, ultimately leading to the assessment of a novel proposed model combining RC and waist circumference (R-W) as a predictor of NAFLD incidence.
Methods: A cross-sectional analysis was conducted of 4913 subjects undergoing physical examinations at Hebei General Hospital, with ultrasound findings being used to classify patients into individuals with and without NAFLD. Median RC values were used to separate subjects into those with low and high levels of RC, after which the predictive performance of RC and the novel R-W model when used to assess NAFLD risk was assessed through multifactorial logistic regression analyses and receiver operating characteristic curves.
Results: Subjects exhibiting higher RC levels were found to exhibit an elevated risk of NAFLD incidence with or without adjusting for confounding factors. The binary logistic regression analysis-based R-W model may thus offer utility as a tool to gauge the risk of NAFLD in the general population, as it outperformed RC or WC alone, particularly when assessing women or individuals < 45 years of age. The area under the ROC curve for this combined R-W model was 0.813 (0.802, 0.824), with respective sensitivity and specificity values of 83.86% and 63.91%, all of which were significantly higher than corresponding values for RC and WC (P < 0.001).
Conclusion: The present supports a strong association between RC levels and NAFLD in the general populace, and the combined R-W model exhibits greater utility as a tool to predict NAFLD incidence relative to RC or WC in isolation, particularly for individuals who are female or < 45 years old.
Keywords: residual cholesterol, waist circumference, non-alcoholic fatty liver disease
Introduction
Liver disease is the 11th leading cause of mortality and the 15th most prominent cause of illness in the world. Non-alcoholic fatty liver disease (NAFLD) is the most common etiological form of liver disease, as it is more prevalent than autoimmune conditions, alcoholic hepatitis, or viral hepatitis.1 Since it was first identified in 1987, NAFLD incidence rates have risen dramatically.2 At present, NAFLD affects an estimated 30–32% of the global population, and it is thought to represent an increasingly important cause of liver-related morbidity, mortality, and transplantation.3 NAFLD is also independently associated with a greater risk of cancer, cardiovascular disease (heart failure, stroke, atrial fibrillation), type 2 diabetes, and chronic kidney disease.4–7 High NAFLD prevalence and progression rates impose a substantial burden on societies and healthcare systems, yet treatment options for affected individuals remain limited. As such, there is a clear need for efforts to screen for NAFLD and to prevent its incidence in a timely manner.
NAFLD is defined as the presence of fat in the liver, seen on imaging and/or liver biopsy, after the exclusion of other obvious causes of liver damage (eg, excessive alcohol consumption, hepatotoxic medication, toxins, viral infections, and genetic hepatic diseases).8 NAFLD risk is closely related to lipid dysregulation as a result of visceral fat deposition. A higher waist circumference (WC) has been shown to be associated greater NAFLD risk.9 Relative to healthy subjects, NAFLD patients tend to exhibit elevated triglycerides (TG) and lower high-density lipoprotein cholesterol (HDL-C) levels.10 However, some patients present with normal TG, HDL-C, and WC values in the clinic such that further analyses are needed to clarify their association with NAFLD incidence.
Remnant cholesterol (RC) has been a growing focus of research interest in recent years, being defined as the cholesterol content of all triglyceride (TG)-rich lipoproteins.11 RC has been identified as a risk factor for cardiovascular events and atherosclerosis.12 There have been few reports, however, systematically evaluating whether RC can predict the incidence of NAFLD in the general population or whether this predictive performance can be improved by combining RC levels and WC values. The present study was thus designed with the goal of constructing a single, noninvasive, inexpensive index suitable for use in general screening and the early treatment of NAFLD.
Materials and Methods
Study Participants
This was a cross-sectional analysis performed at the Medical Examination Center of Hebei General Hospital in July 2023. In total, 6321 consecutive individuals were recruited for this study, which entailed the completion of a questionnaire, laboratory testing, anthropometric measurements, and liver ultrasonography. All participants who voluntarily agreed to participate provided written informed consent. The Ethics Committee of Hebei General Hospital approved this study (Ethics Committee No. 2023090), which was consistent with the Helsinki Declaration. In total, this study enrolled 4913 participants (Figure 1), of whom 2811 and 2102 were males and females, respectively, ranging from 21–92 years of age.
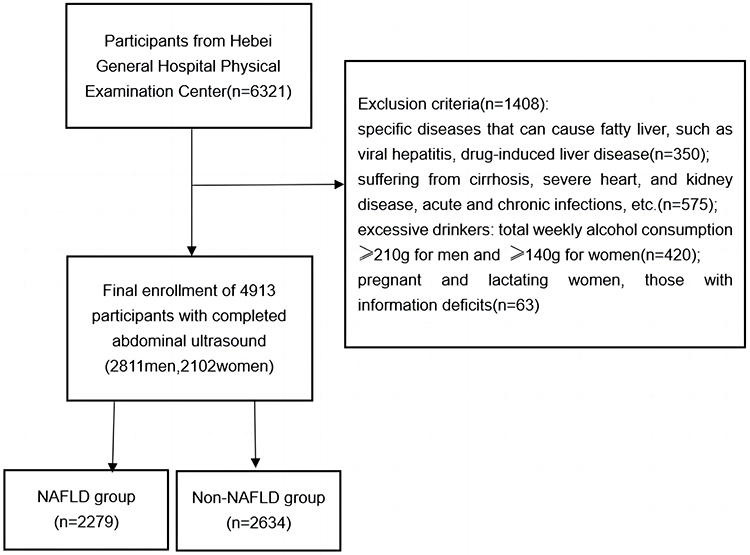 |
Figure 1 Study subject flowchart. |
Data Collection
Anthropometric measurements, blood testing, and ultrasonography analyses of all participants were performed in the morning following overnight fasting. Basic participant characteristics including age, gender, smoking history, and history of alcohol consumption were collected with a survey. Measurements of weight, height, and waist circumference (WC) were taken while participants were standing barefoot in light clothing. WC was measured around the navel. Blood pressure measurements were only taken following a 10-minute rest period. Analyzed blood biomarkers included fasting blood glucose (FBG), total cholesterol (TC), TG, HDL-C, low-density lipoprotein cholesterol (LDL-C), aspartate aminotransferase (AST), alanine aminotransferase (ALT), and serum uric acid (SUA). Body mass index (BMI) = weight (kg) / height2 (m2). TC minus HDL-C and LDL-C to calculate RC.13
NAFLD Diagnosis
NAFLD assessments for the study population were performed via ultrasonography. Liver sonograms were generated by experienced technicians, and following these comprehensive assessments, final diagnoses were based on four criteria: deep enhancement, liver echo contrast, liver brightness, and vascular echogenicity. The criteria for diagnosing NAFLD using ultrasound are as follows: 1. Diffuse enhancement of near-field echoes in the hepatic region (stronger than in the kidneys and spleen) with gradual attenuation of far-field echoes. 2. Intrahepatic ductal structures are poorly visualized. 3. The liver is mild to moderately enlarged with rounded marginal angles. 4. Color Doppler flow imaging suggests that the intrahepatic color flow signal is reduced or not easily demonstrated, but the intrahepatic vascular course is normal. 5. The right lobe of the liver peritoneum and transverse septal echoes are poorly or incompletely displayed. Mild hepatic steatosis is defined as the presence of 1 and 1 out of 2–4 criteria; moderate hepatic steatosis is defined as the presence of 1 and 2 out of 2–4 criteria; and severe hepatic steatosis is defined as the presence of 1 and 2 out of 2–4 criteria and 5th criterion.14
Statistical Analyses
Baseline data were compared between patients with and without NAFLD, or between patients with low and high RC levels when using the median RC value to divide patients into these two groups. Normally distributed and skewed continuous data were compared between groups with independent samples t-tests and Mann–Whitney U-tests, respectively, and were presented as means ± standard deviation and medians (interquartile range). Categorical data were compared with χ2 tests and presented as percentages. Multifactorial logistic regression analyses were employed when assessing associations between RC levels and NAFLD under particular conditions, and this approach was used to establish a combined binary logistic regression incorporating both RC and WC. Receiver operating characteristic (ROC) curves were employed to gauge the predictive performance of this R-W model, RC, and WC when assessing NAFLD incidence in the overall study population and in subgroups of participants stratified according to age and gender using the DeLong test. P < 0.05 served as the cut-off for significance. SPSS 27.0 and MedCalc statistical software were used for all analyses, while figures were constructed with GraphPad Prism 8.0.
Results
Participant Characteristics as a Function of NAFLD Status
In total, this study enrolled 2634 and 2279 participants without and with NAFLD, respectively. Relative to subjects without NAFLD, those exhibiting comorbid NAFLD were significantly older (P<0.001) and more likely to be male, smoke, and drink alcohol (P<0.001). These patients with comorbid NAFLD also presented with higher WC, BMI, SBP, and DBP levels relative to patients without NAFLD (P < 0.001). Significantly higher FBG, TC, TG, LDL-C, ALT, AST, and SUA levels were also observed in patients with NAFLD (P < 0.001), whereas their HDL-C levels were significantly decreased as compared to patients without NAFLD (P < 0.001). This study also found for the first time that individuals with comorbid NAFLD exhibited significantly elevated RC levels (P<0.001). Baseline participant characteristics and clinical outcomes for these two groups are presented in Table 1, while RC and WC comparisons between these groups are presented in Figure 2.
 |
Table 1 Participant Characteristics Grouped According to NAFLD Status |
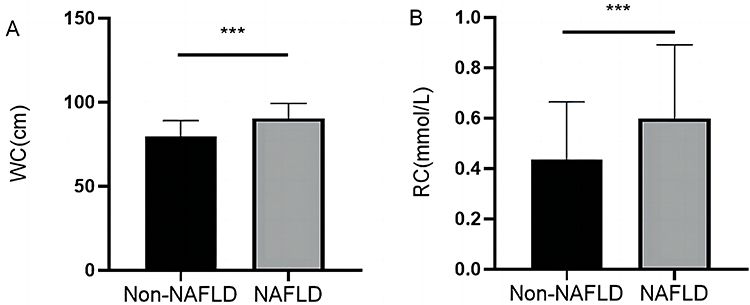 |
Figure 2 Comparisons of WC and RC between individuals with and without NAFLD. (A) WC, (B) RC. Abbreviations: WC, waist circumference; RC, residual cholesterol; NAFLD, nonalcoholic fatty liver disease. Note: ***P < 0.001. |
Participant Clinical Characteristics as a Function of RC Levels
Participants were divided into high- and low-RC groups according to the median RC value. The high-RC group exhibited a significantly higher percentage of males, age, smoking, and alcohol consumption than the low-RC group (P < 0.001). WC, BMI, SBP, DBP, FBG, TC, TG, LDL-C, ALT, AST, SUA, and NAFLD levels in the high-RC group were also significantly elevated as compared to the low-RC group (P < 0.001). The clinical characteristics of these patients are shown in Table 2, and WC and the prevalence of NAFLD in these groups is shown in Figure 3.
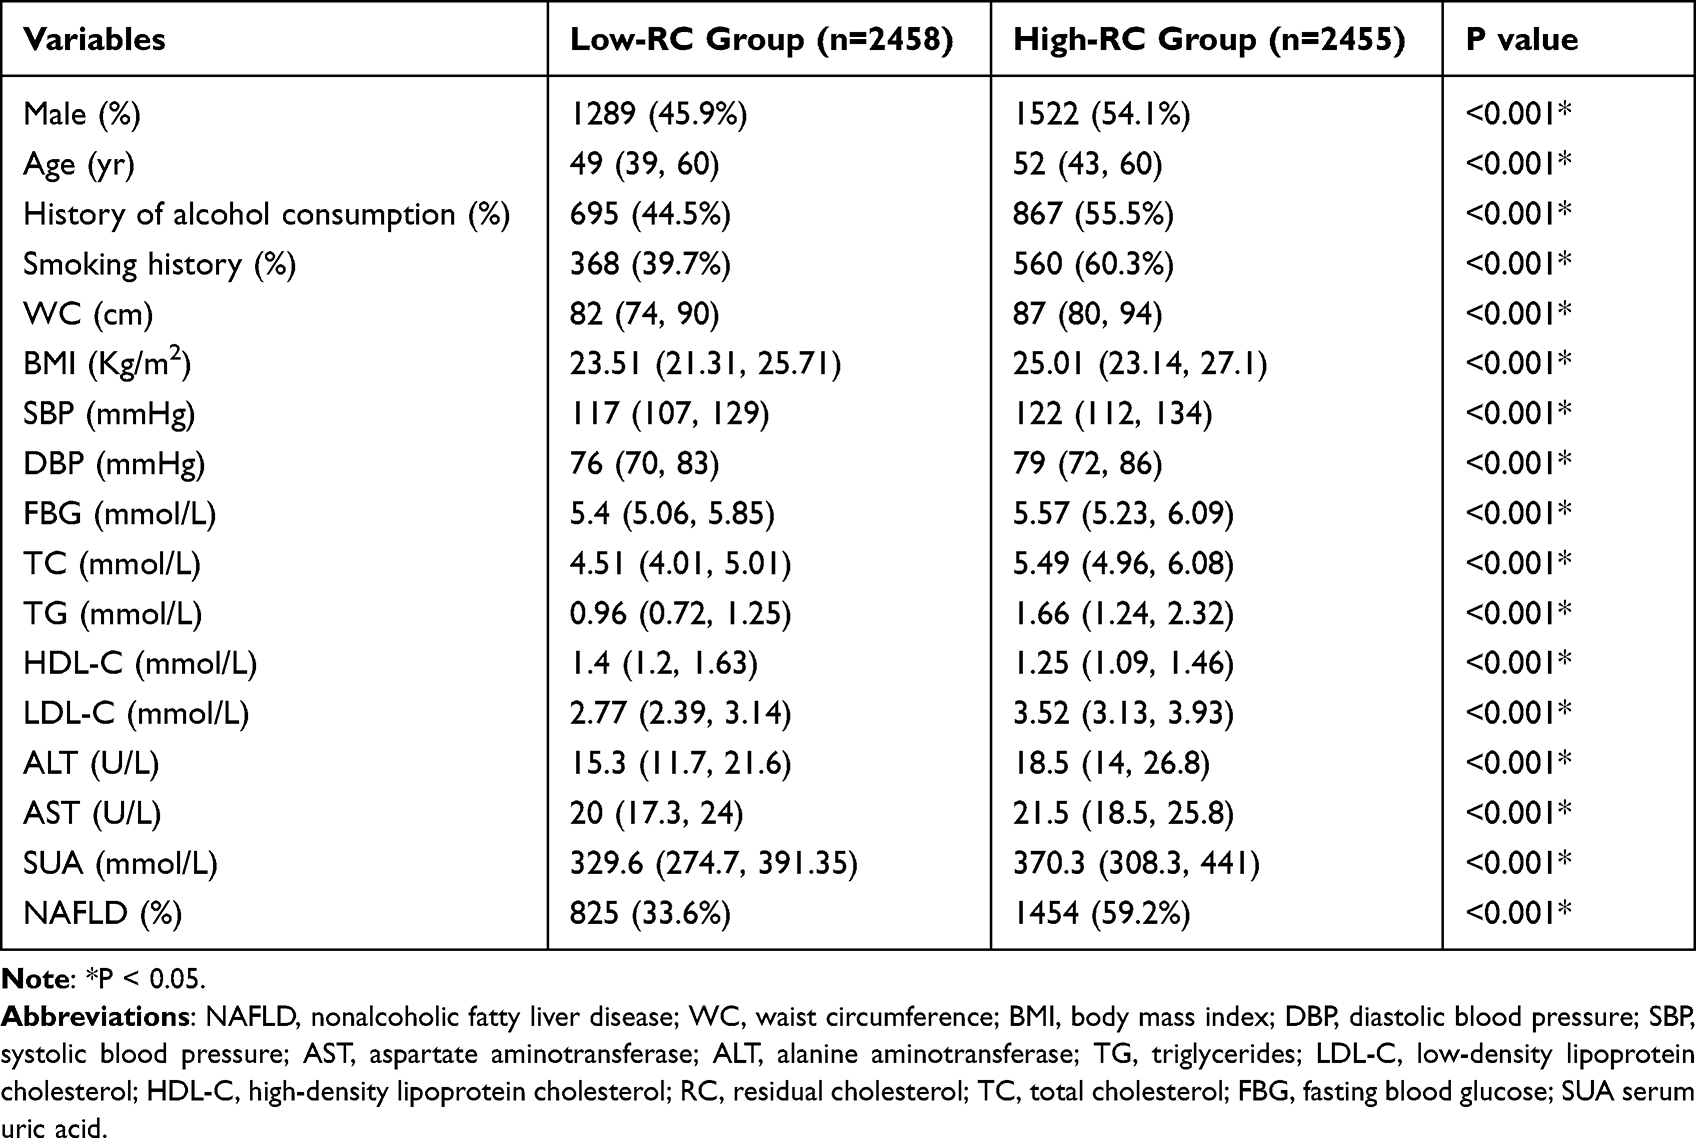 |
Table 2 Participant Characteristics Grouped According to RC Levels |
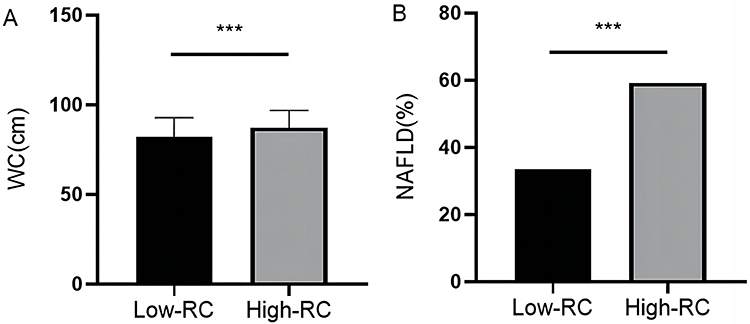 |
Figure 3 Comparisons of WC and NAFLD prevalence among individuals with low and high RC levels. (A) WC, (B) NAFLD. Abbreviations: WC, waist circumference; NAFLD, nonalcoholic fatty liver disease; RC, residual cholesterol. Note: ***P < 0.001. |
Multifactorial Logistic Regression Analyses of the Relationship Between RC Levels and NAFLD Risk
Multivariate logistic regression analyses were next employed to additionally probe the association between RC and NAFLD incidence, revealing a strong association between the two (Table 3). Higher RC levels were significantly associated with greater NAFLD risk under Model 1 (unadjusted), Model 2 (adjusted for age and sex), Model 3 (further adjusted for smoking history, drinking history, WC, and BMI), and Model 4 (further adjusted for SBP, DBP, FBG, SUA, TC, HDL-C, LDL-C, ALT, and AST) (P < 0.001). The ORs for a 1-SD rise in RC under these four models were 14.333 (11.06, 18.574), 12.58 (9.635, 16.425), 6.085 (4.546, 8.144), and 3.186 (2.082, 4.876), respectively.
Evaluation of the Utility of RC as a Predictor of NAFLD Incidence
When used to predict NAFLD incidence in the overall study population, RC exhibited an area under the curve (AUC) of 0.679 (0.666, 0.692) (P < 0.001), yielding a sensitivity of 62.97% and a specificity of 62.55% at a cut-off value of 0.48. Similarly, this model exhibited an AUC of 0.653 (0.636, 0.671) and 0.7 (0.68, 0.72) (P < 0.001) when predicting NAFLD incidence in males and females, respectively, with corresponding sensitivities of 62.44% and 61.8% and specificities of 59.91% and 67.76%, at cut-off values of 0.48 and 0.5. When used to predict NAFLD incidence in subjects ≥45 and <45 years of age, the respective AUC values for RC were 0.631 (0.614, 0.648) and 0.755 (0.735, 0.776) (P < 0.001), with corresponding sensitivity values of 63.04% and 71.41% and specificities of 55.58% and 67.37%, at corresponding cut-off values of 0.48 and 0.44 (Table 4, Figure 4). RC was a better predictor of NAFLD incidence in females and subjects < 45 years of age as compared to males or subjects ≥ 45 years old (Figure 4) (P=0.004, P<0.001).
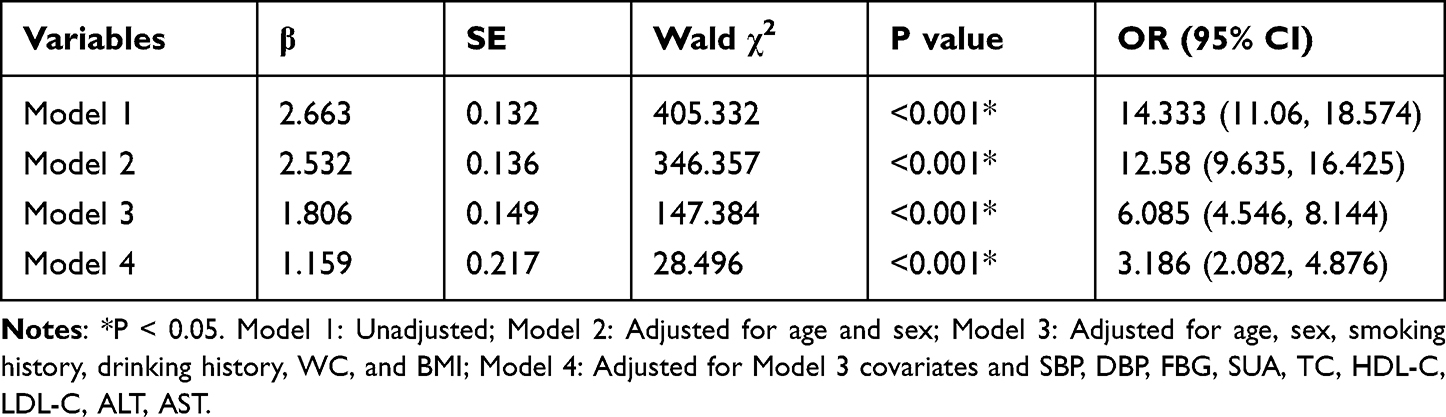 |
Table 3 Multifactorial Logistic Regression Analysis of the Relationship Between RC and NAFLD Risk |
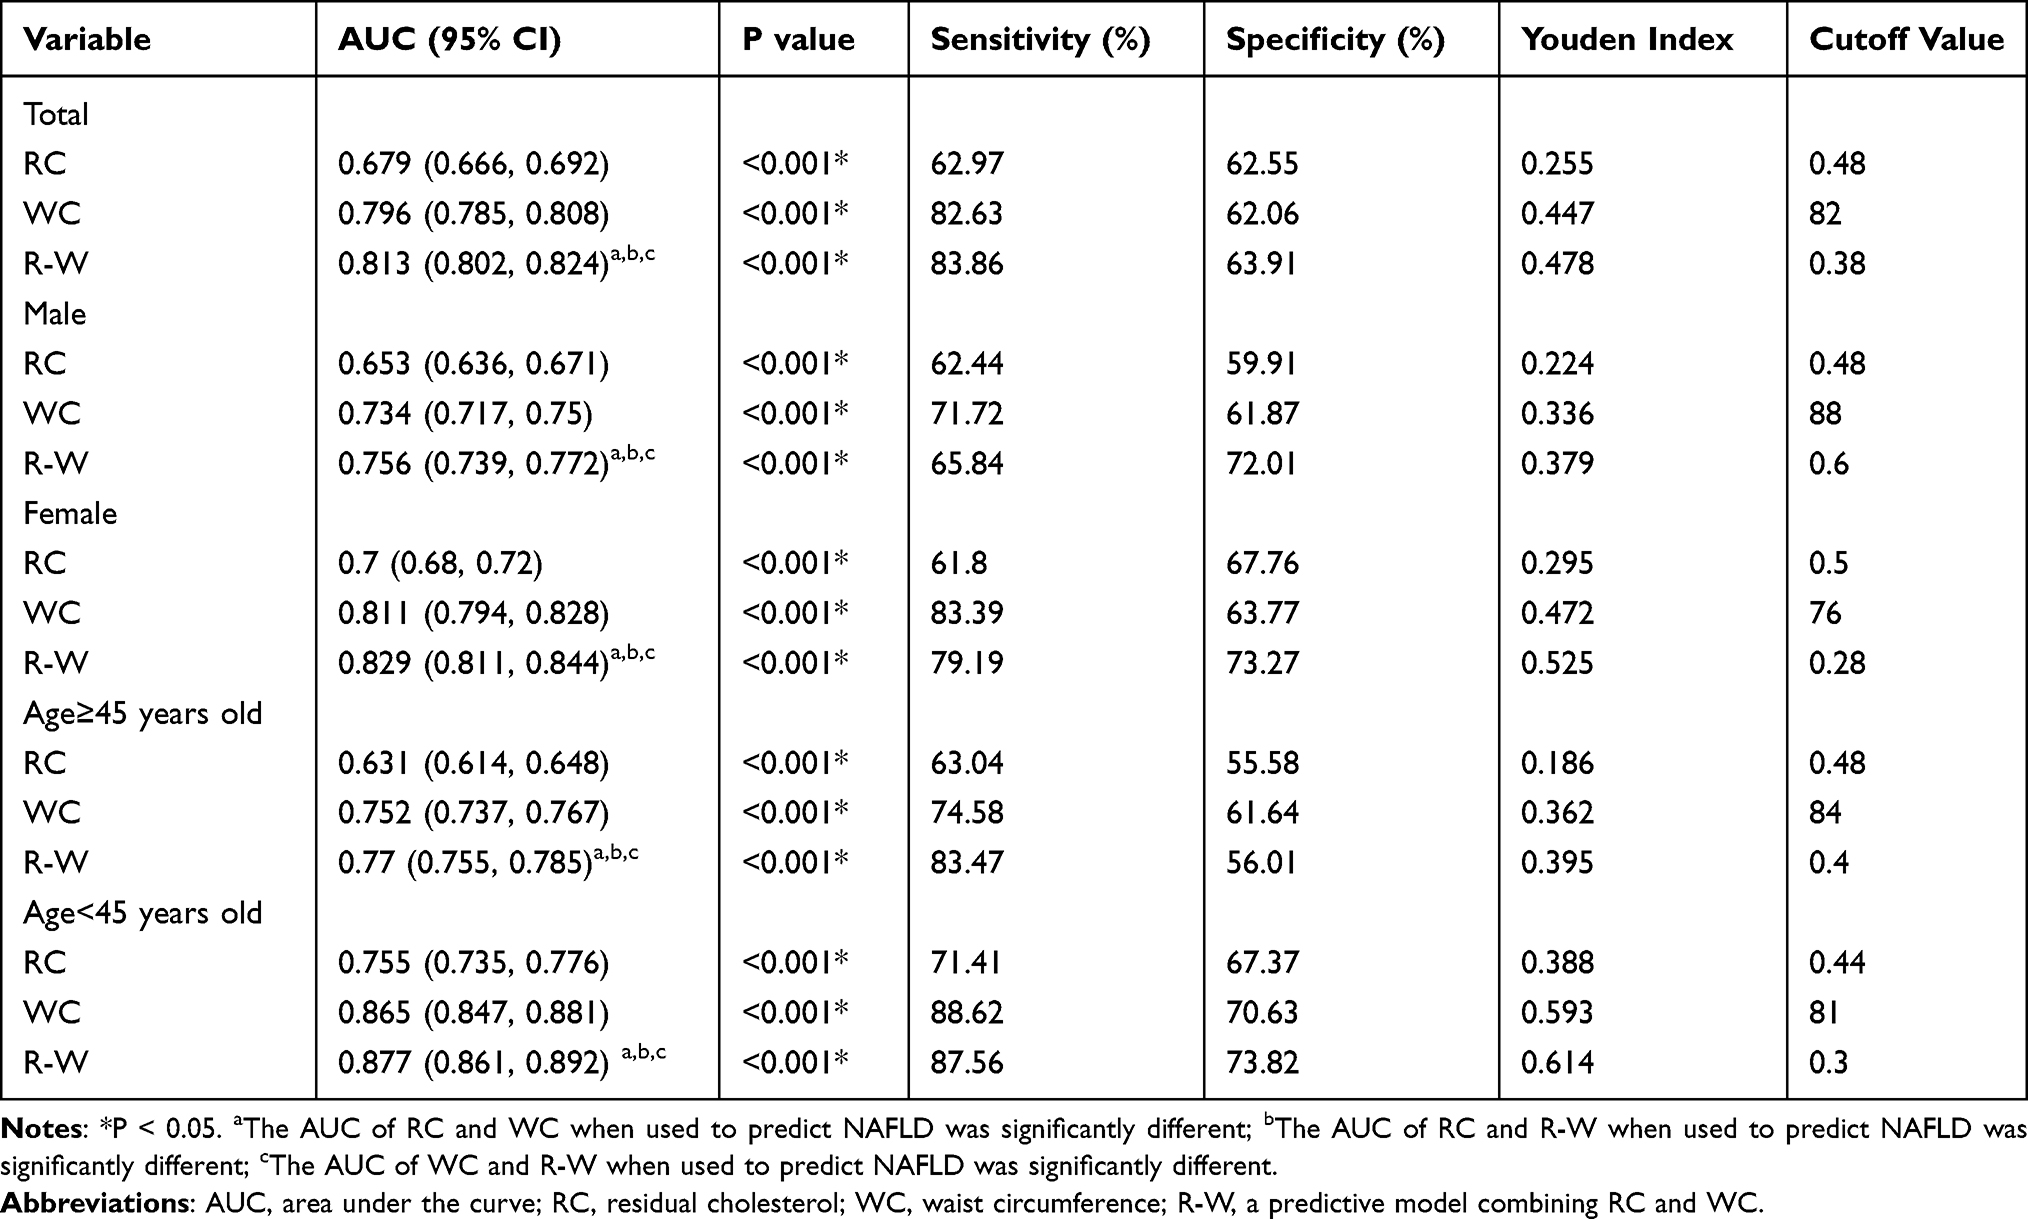 |
Table 4 Analyses of the Predictive Performance of RC, WC, and R-W for NAFLD in All Participant Subgroups |
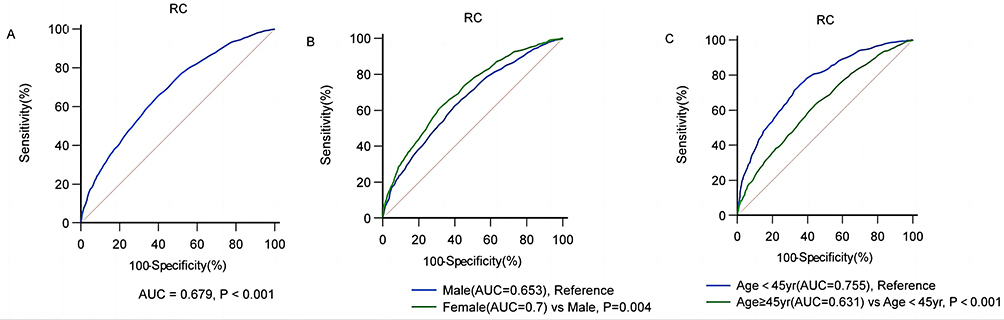 |
Figure 4 ROC curves for the RC-based prediction of NAFLD status in the overall study population and in individual subgroups. (A) Total population, (B) sex subgroup, (C) age subgroup. |
Development and Validation of an R-W Predictive Model for NAFLD
To predict NAFLD incidence with even greater accuracy, RC and WC were combined in a binary logistic regression model, thereby enabling the formulation of a new R-W predictive model with the following equation: logit(R-W) = −11.342 + 1.894 × RC + 0.12 × WC (Table 5).
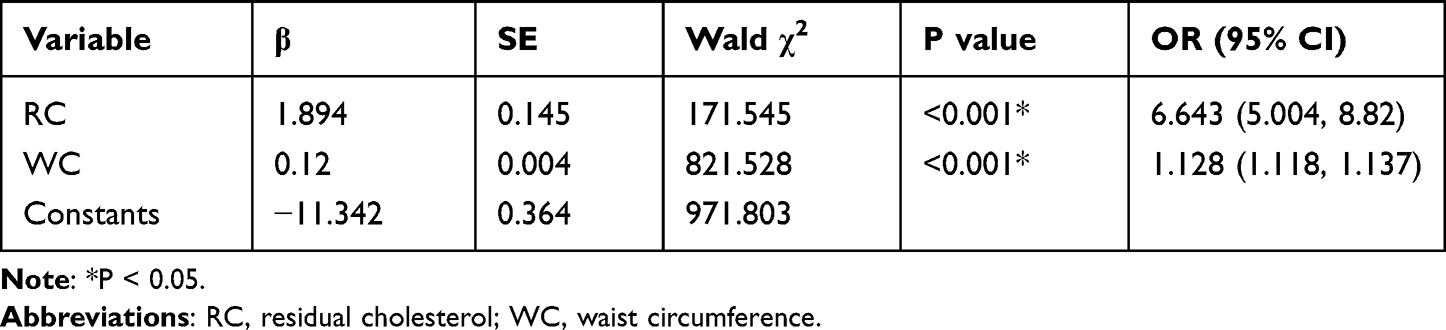 |
Table 5 Binary Logistic Regression Analysis for R-W Model Construction |
When used to predict NAFLD incidence in the overall population, this R-W model yielded an AUC of 0.813 (0.802, 0.824) (P < 0.001), while the respective AUC values when it was used to evaluate males and females were 0.756 (0.739, 0.772) and 0.829 (0.811, 0.844) (P < 0.001). Similarly, the AUC values when this model was used to assess individuals ≥45 and <45 years of age were 0.77 (0.755, 0.785) and 0.877 (0.861, 0.892), respectively (P < 0.001) (Table 4, Figure 5). The R-W model was better able to predict NAFLD incidence in females and subjects < 45 years of age as compared to males or subjects ≥ 45 years old (Figure 5) (P < 0.001).
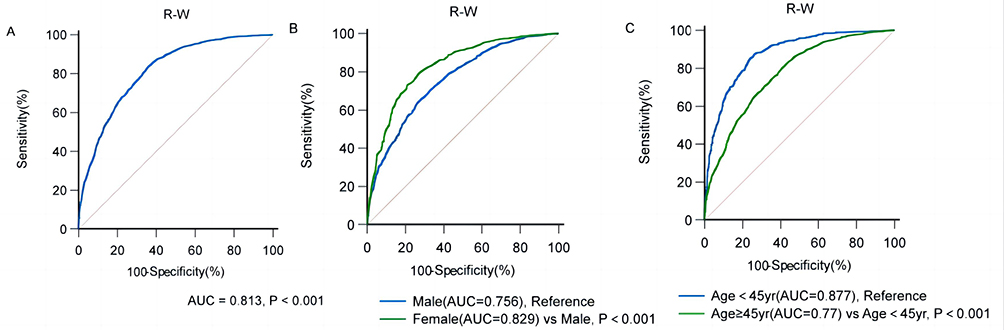 |
Figure 5 ROC curves for the R-W-based prediction of NAFLD status in the overall study population and in individual subgroups. (A) Total population, (B) sex subgroup, (C) age subgroup. |
To better assess the performance of this R-W model when predicting NAFLD risk, the DeLong test was employed to compare AUC values for the RC, WC, and R-W models in the overall study population and in each subgroup (Figure 6). This analysis revealed significant differences in AUC values among these groups (P < 0.05), with the combined R-W model exhibiting superior predictive performance relative to RC and WC, yielding a sensitivity of 83.86% and a specificity of 63.91% at a cut-off value of 0.38 (Table 4).
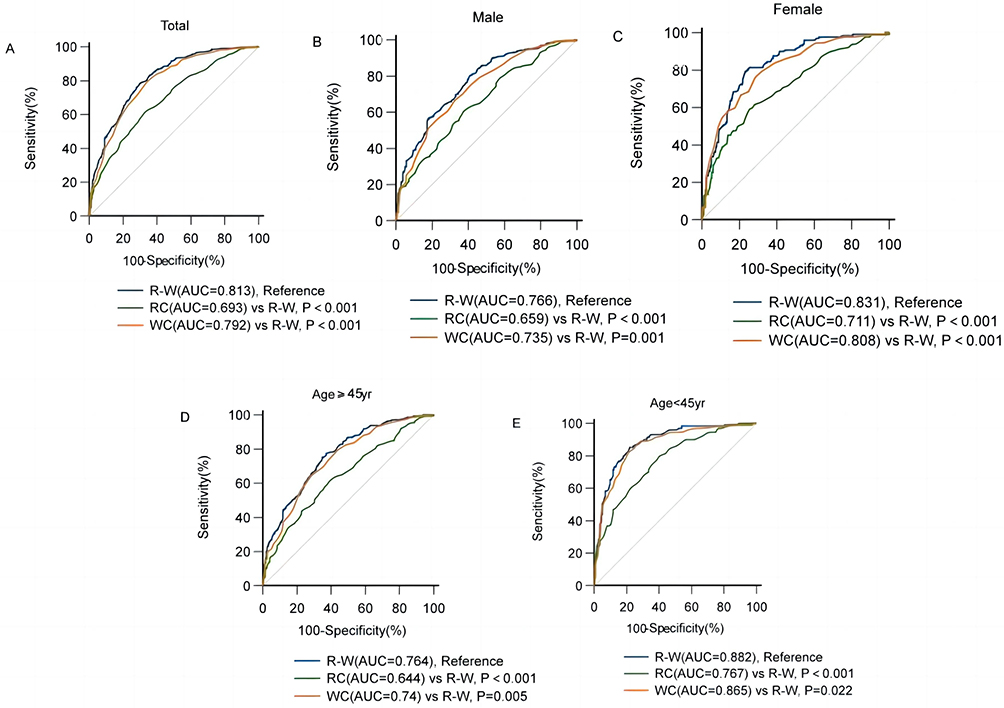 |
Figure 6 Comparisons of AUC values for the RC, WC, and R-W models when used to predict NALFD incidence in the overall study population and in each participant subgroup. (A) Total, (B) male, (C) female, (D) age ≥ 45 years, (E) age < 45 years. |
Discussion
The present study is the first systematic evaluation of the association between RC and NAFLD in the general population, and it confirmed that RC can be used to predict the risk of NAFLD incidence. RC was then further combined with WC through the formulation of the noninvasive R-W model, which was subsequently found to exhibit greater predictive utility than RC or WC alone when used to gauge the odds of NAFLD incidence. The optimal R-W model cut-off values were additionally calculated for subgroups of individuals stratified according to age or sex, potentially enhancing the performance of this index when used to detect NAFLD in its early stages of development in the clinic.
Factors known to be strongly associated with NAFLD risk include elevated TG levels, lower HDL-C levels, and higher WC.15,16 When these values are within the normal range, however, their predictive utility is limited. While ultrasonography is often employed to diagnose NAFLD in the clinic, it is limited in its use as a means of screening large patient populations or conducting epidemiological surveys. This study was thus formulated to evaluate the predictive value of a non-invasive and clinically accessible index when used to gauge NAFLD risk in the general population. RC levels are closely tied to atherosclerosis, hypertension, cardiovascular disease, and diabetes,12 and there have been prior research efforts documenting the relationship between RC and NAFLD in healthy non-diabetic populations or younger individuals.17,18 Here, higher RC levels were significantly associated with greater NAFLD risk under both adjusted and unadjusted models. Dyslipidemia is a precursor to NAFLD, and insulin resistance is closely tied to the incidence of this disease.10 RC levels are also closely related to insulin resistance,19 potentially explaining the observed relationship linking RC levels and NAFLD. Excessive accumulation of lipids in hepatocytes resulting from disordered lipid metabolism is a pivotal factor in the onset and progression of NAFLD. Previous research suggests that Ophiopogonin D (OP-D), the main active component of Ophiopogon japonicus, can ameliorate NAFLD in obese mice by modulating lipid metabolism.20 Furthermore, inhibition of lymphocyte antigen 6 family member D (Ly6d), a primary regulator of hepatic steatosis, can also reduce hepatic steatosis in a diet-induced mouse model of NAFLD.21 In terms of abnormal lipid metabolism, the RC index, as a composite measure, maybe both more effective and reliable as a predictive indicator of NAFLD compared to relying on a single lipid index.
Previous research has demonstrated that individuals over 45 years of age are at an increased risk of NAFLD progression.22 In a meta-analysis of 10 peer-reviewed studies, including case series and retrospective cohort studies, Argo et al determined that age served as an independent predictor of advanced fibrosis in NAFLD. Younger patients were found to be less likely to develop advanced fibrosis.23 Furthermore, a study on 144 patients with non-alcoholic steatohepatitis (NASH) revealed that advanced age is a significant predictor of severe liver fibrosis (bridging/cirrhosis), with the optimal age threshold based on the ROC curve being 45 years.24 Therefore, we selected age 45 as the threshold to categorize the study population in this paper.
These results confirmed that WC exhibits good predictive performance when assessing NAFLD status, in line with prior reports. However, no published studies to date have examined the predictive performance of RC combined with WC in this setting, prompting an exploration of the predictive utility of the combined R-W model in this participant population. The resultant logistic regression-based R-W model was able to effectively identify patients with NAFLD while outperforming RC or WC alone, particularly among females and patients < 45 years old.
In conclusion, the present analysis offers many key advantages over prior studies. For one, this analysis confirmed the significant association between higher RC levels and greater NAFLD risk, suggesting that measuring RC may represent an effective means of predicting NAFLD risk in the general populace. Secondly, the R-W model developed herein is highly novel, and it exhibited superior predictive utility relative to RC or WC alone. This model is non-invasive, convenient, and economical such that it may prove invaluable as a tool for both the clinical detection of NAFLD and for large-scale epidemiologic analyses of NAFLD incidence rates in various populations.
The 2020 Panel recommended that NAFLD be redefined as metabolic-associated fatty liver disease (MAFLD), with the diagnosis of MAFLD based on a set of “positive” criteria, namely, hepatic steatosis accompanied by overweight/obesity or type 2 diabetes mellitus (T2DM) or at least 2 of 7 metabolic abnormalities. MAFLD, in contrast to NAFLD, highlights the important roles of obesity, insulin resistance, dyslipidemia, T2DM, and metabolic inflammation in the pathogenesis of fatty liver disease and the importance of addressing these conditions to combat liver disease and its comorbidities.25 However, as we did not collect information on high-sensitivity C-reactive protein as part of the diagnostic criteria of MAFLD, we were unable to study the relationship between RC and R-W and MAFLD, but intend to do so in future investigations.
This study is subject to some limitations. As these analyses were cross-sectional in design, they cannot be used to assess the causality of the association between the R-W model and NAFLD risk. Secondly, data pertaining to other potentially relevant covariates such as dietary patterns and exercise were not collected for this study population. Thirdly, this was a single-center study. Lastly, ultrasonography exhibits limited sensitivity as a means of diagnosing NAFLD such that some patients with milder disease may have been overlooked. As such, additional large-scale prospective multicenter validation of these results will be essential to further reveal the predictive performance of RC and R-W when seeking to detect NAFLD.
Conclusion
The present results reveal that higher RC levels in the general population are associated with a significant increase in NAFLD risk. The novel R-W model developed herein exhibited greater predictive utility than RC or WC alone when seeking to detect NAFLD, particularly when assessing women and adults < 45 years of age. Given the low costs associated with assessing this R-W biomarker, it may offer value as a diagnostic marker in the clinic, an index that can guide NAFLD early intervention efforts, and a tool for robust epidemiological investigation.
Ethics Approval and Informed Consent
This study was conducted by the principles of the Declaration of Helsinki. Approved by the Ethics Committee of the Hebei General Hospital (Ethics Committee No. 2023090). Informed consent was obtained from all individuals participating in the study.
Disclosure
The authors report no conflicts of interest in this work.
References
1. Huang DQ, Terrault NA, Tacke F, et al. Global epidemiology of cirrhosis - aetiology, trends and predictions. Nat Rev Gastroenterol Hepatol. 2023;20(6):388–398. doi:10.1038/s41575-023-00759-2
2. Clayton-Chubb D, Kemp W, Majeed A, Lubel JS, Hodge A, Roberts SK. Understanding NAFLD: from case identification to interventions, outcomes, and future perspectives. Nutrients. 2023;15(3):687. doi:10.3390/nu15030687
3. Golabi P, Isakov V, Younossi ZM. Nonalcoholic fatty liver disease: disease burden and disease awareness. Clin Liver Dis. 2023;27(2):173–186. doi:10.1016/j.cld.2023.01.001
4. Jaiswal V, Ang SP, Huang H, et al. Association between nonalcoholic fatty liver disease and atrial fibrillation and other clinical outcomes: a meta- analysis. J Investig Med. 2023;71(6):591–602. doi:10.1177/10815589231164777
5. Björkström K, Widman L, Hagström H. Risk of hepatic and extrahepatic cancer inNAFLD: a population-based cohort study. Liver Int. 2022;42(4):820–828. doi:10.1111/liv.15195
6. Roderburg C, Krieg S, Krieg A, et al. Non-alcoholic fatty liver disease (NAFLD) is associated with an increased incidence of chronic kidney disease (CKD). Eur J Med Res. 2023;28(1):153. doi:10.1186/s40001-023-01114-6
7. Bardugo A, Bendor CD, Zucker I, et al. Adolescent nonalcoholic fatty liver disease and type 2 diabetes in young adulthood. J Clin Endocrinol Metab. 2021;106(1):e34–e44. doi:10.1210/clinem/dgaa753
8. Boccatonda A, Andreetto L, D’Ardes D, et al. From NAFLD to MAFLD: definition, pathophysiological basis and cardiovascular implications. Biomedicines. 2023;11(3):883. doi:10.3390/biomedicines11030883
9. Kong LX, Yang Y, Li HD, Shan YL, Wang X, Shan XF. Prevalence of nonalcoholic fatty liver disease and the related risk factors among healthy adults: a cross-sectional study in Chongqing, China. Front Public Health. 2023;11:1127489. doi:10.3389/fpubh.2023.1127489
10. Duan SJ, Ren ZY, Zheng T, et al. Atherogenic index of plasma combined with waist circumference and body mass index to predict metabolic-associated fatty liver disease. World J Gastroenterol. 2022;28(36):5364–5379. doi:10.3748/wjg.v28.i36.5364
11. Ganda OP. Triglyceride-rich lipoproteins, remnant-cholesterol, and atherosclerotic cardiovascular disease. Curr Opin Lipidol. 2023;34(3):105–113. doi:10.1097/MOL.0000000000000875
12. Baratta F, Cocomello N, Coronati M, et al. Cholesterol remnants, triglyceride-rich lipoproteins and cardiovascular risk. Int J Mol Sci. 2023;24(5):4268. doi:10.3390/ijms24054268
13. Mach F, Baigent C, Catapano AL, et al. ESC/EAS Guidelines for the management of dyslipidaemias: lipid modification to reduce cardiovascular risk. Eur Heart J. 2020;41(1):111–188. doi:10.1093/eurheartj/ehz455
14. Graif M, Yanuka M, Baraz M, et al. Quantitative estimation of attenuation in ultrasound video images: correlation with histology in diffuse liver disease. Invest Radiol. 2000;35(5):319–324. doi:10.1097/00004424-200005000-00006
15. Li RF, Liu J, Han P, Shi RF, Zhao LL, Li J. Associations between abdominal obesity indices and pathological features of non-alcoholic fatty liver disease: Chinese visceral adiposity index. J Gastroenterol Hepatol. 2023;38(8):1316–1324. doi:10.1111/jgh.16196
16. Cabrera D, Moncayo-Rizzo J, Cevallos K, Alvarado-Villa G. Waist circumference as a risk factor for non-alcoholic fatty liver disease in older adults in Guayaquil, Ecuador. Geriatrics. 2023;8(2):42. doi:10.3390/geriatrics8020042
17. Zou Y, Lan JY, Zhong YJ, Yang S, Zhang HM, Xie GB. Association of remnant cholesterol with nonalcoholic fatty liver disease: a general population-based study. Lipids Health Dis. 2021;20(1):139. doi:10.1186/s12944-021-01573-y
18. Chin J, Mori TA, Adams LA, et al. Association between remnant lipoprotein cholesterol levels and non-alcoholic fatty liver disease in adolescents. JHEP Rep. 2020;2(6):100150. doi:10.1016/j.jhepr.2020.100150
19. Ohnishi H, Saitoh S, Takagi S, et al. Relationship between insulin-resistance and remnant-like particle cholesterol. Atherosclerosis. 2002;164(1):167–170. doi:10.1016/s0021-9150(02)00057-6
20. Huang X, Ji Q, She CY, Cheng Y, Zhou JR, Wu QM. Ophiopogonin D ameliorates non-alcoholic fatty liver disease in high-fat diet-induced obese mice by improving lipid metabolism, oxidative stress and inflammatory response. Exp Ther Med. 2023;26(3):418. doi:10.3892/etm.2023.12116
21. Lee J, Kim H, Kang YW, et al. LY6D is crucial for lipid accumulation and inflammation in nonalcoholic fatty liver disease. Exp Mol Med. 2023;55(7):1479–1491. doi:10.1038/s12276-023-01033-w
22. Hegazy M, Saleh SA, Ezzat A, Behiry ME. Novel application of the traditional lipid ratios as strong risk predictors of NASH. Diabetes Metab Syndr Obes. 2020;13:297–305. doi:10.2147/DMSO.S229590
23. Argo CK, Northup PG, Al-Osaimi AMS, Caldwell SH. Systematic review of risk factors for fibrosis progression in non-alcoholic steatohepatitis. J Hepatol. 2009;51(2):371–379. doi:10.1016/j.jhep.2009.03.019
24. Angulo P, Keach JC, Batts KP, Lindor KD. Independent predictors of liver fibrosis in patients with nonalcoholic steatohepatitis. Hepatology. 1999;30(6):1356–1362. doi:10.1002/hep.510300604
25. Eslam M, Newsome PN, Sarin SK, et al. A new definition for metabolic dysfunction-associated fatty liver disease: an international expert consensus statement. J Hepatol. 2020;73(1):202–209. doi:10.1016/j.jhep.2020.03.039
 © 2023 The Author(s). This work is published and licensed by Dove Medical Press Limited. The full terms of this license are available at https://www.dovepress.com/terms.php and incorporate the Creative Commons Attribution - Non Commercial (unported, v3.0) License.
By accessing the work you hereby accept the Terms. Non-commercial uses of the work are permitted without any further permission from Dove Medical Press Limited, provided the work is properly attributed. For permission for commercial use of this work, please see paragraphs 4.2 and 5 of our Terms.
© 2023 The Author(s). This work is published and licensed by Dove Medical Press Limited. The full terms of this license are available at https://www.dovepress.com/terms.php and incorporate the Creative Commons Attribution - Non Commercial (unported, v3.0) License.
By accessing the work you hereby accept the Terms. Non-commercial uses of the work are permitted without any further permission from Dove Medical Press Limited, provided the work is properly attributed. For permission for commercial use of this work, please see paragraphs 4.2 and 5 of our Terms.