")
Back to Journals » OncoTargets and Therapy » Volume 13
The Clinical Significance of PPEF1 as a Promising Biomarker and Its Potential Mechanism in Breast Cancer
Authors Ye T , Wan X, Li J, Feng J, Guo J, Li G, Liu J
Received 1 September 2019
Accepted for publication 17 December 2019
Published 8 January 2020 Volume 2020:13 Pages 199—214
DOI https://doi.org/10.2147/OTT.S229432
Checked for plagiarism Yes
Review by Single anonymous peer review
Peer reviewer comments 2
Editor who approved publication: Prof. Dr. Takuya Aoki
Ting Ye,* Xue Wan,* Jingyuan Li, Jia Feng, Jinglan Guo, Guangrong Li, Jinbo Liu
Department of Laboratory Medicine, The Affiliated Hospital of Southwest Medical University, Sichuan 646000, People’s Republic of China
*These authors contributed equally to this work
Correspondence: Jinbo Liu
Department of Laboratory Medicine, The Affiliated Hospital of Southwest Medical University, No. 25, Taiping Street, Jiangyang District, Luzhou, Sichuan 646000, People’s Republic of China
Tel +86-0830-3165730
Email [email protected]
Background: Breast cancer (BC) is the leading cause of malignancy death in females worldwide. While intense efforts have been made to elucidate the pathogeny, the molecular mechanism of BC remains elusive. Thus, this study aimed to investigate the role of PPEF1 in the progression of BC and further explore the better clinical significance.
Methods: The diagnostic and prognostic values of elevated PPEF1 expression in BC were unveiled via public databases analysis. In addition, Gene Ontology (GO), Gene Set Enrichment Analysis (GSEA) and Protein–protein interaction (PPI) analysis were performed to explore the potential functions and molecular mechanisms of PPEF1 in BC progression. Experimentally, transwell and CCK-8 assays were carried out to estimate the effects of PPEF1 on the BC metastasis. Meanwhile, the differential expressions of PPEF1 in paraffin-embedded tissues and serum samples were, respectively, analyzed by Immunohistochemical (IHC) analysis and enzyme-linked immunosorbent assay (ELISA) kit.
Results: The transcriptional levels of PPEF1 were higher in BC than in normal breast tissues or adjacent normal tissues. Moreover, survival analysis revealed that higher PPEF1 expression was negatively associated with overall survival (OS), all events-free (AE-free) and metastatic recurrence-free (MR-free) survival, and further was an independent risk factor of unfavorable prognosis in BC patients. Additionally, the present study provided the first evidence that PPEF1 participated in multiple biological processes and underly signaling pathways involving in tumorigenesis and development of BC. Furthermore, PPEF1 promotes the BC progression and can be used as a noninvasive diagnostic marker. Noteworthy, the combined determination of serum PPEF1 and traditional tumor markers can enhance diagnostic accuracy thus is of vital importance in the early diagnosis of BC.
Conclusion: PPEF1 exerted a tumorigenic role and involved in molecular mechanism of tumorigenesis in BC which served as a promising biomarker for prognosis and diagnosis.
Keywords: PPEF1, breast cancer, biomarker, molecular function, signaling pathway
Introduction
Breast cancer (BC) is the most common malignancy with high morbidity in females and remains a major cause of cancer‑associated mortality worldwide.1,2 The risk factors for BC have been indicated to be associated with the complex effects involving heterogeneity of reproductive, hormonal, obesity, drinking and many other potential factors.3,4 In recent years, research on BC has progressed in advancement of surgical techniques, development of anticancer drugs, and targeted therapeutic strategies, but the long-term survival of patients is still very poor due to frequent recurrence and metastasis.5,6 Therefore, there is an urgent need to identify new diagnostic biomarkers and/or therapeutic targets for the BC management.
PPEF1 gene encoding protein serine/threonine protein phosphatase was localized on chromosome Xp22, which was shown to be associated with excessive cell proliferation, cell growth and signal transduction.7–11 In addition, PPEF1 overexpression increased the tumorigenic growth of A549 cells, suggesting that PPEF1 can act as an oncogene in lung cancer development by preventing cancer cell death.12 A recent research has also shown that PPEF1 could be a potential target for diagnosis or therapy of lymphoma.7 However, the role of PPEF1 in BC has not been previously reported.
In the present study, through bioinformatics analyses of Oncomine, GEPIA and TCGA database, we revealed that PPEF1 was elevated in BC tissues compared with normal counterparts. Meanwhile, PPEF1 overexpression was proved to be an independent prognostic factor and a good diagnostic index for patients with BC. Furthermore, we explored the potential functions, signal pathways and co-expression genes network of PPEF1 in BC using GO, GSEA and PPI analysis, which suggested the potential molecular mechanisms underlying the oncogenic activity of PPEF1. And lastly, we provide the convincing experimental evidence supporting a rather definitive role of PPEF1 in metastasis of BC as well as the vital clinical implications. This is the first research to identify key genes and pathways related with PPEF1 which were in the occurrence of BC and explored the potential biomarker for prognosis, diagnosis and drug targets.
Materials and Methods
Oncomine Database Analysis
The expression levels of PPEF1 gene in the selected cancers were analyzed using Oncomine database (https://www.oncomine.org/). In order to reduce our false discovery rate, we selected P < 0.0001, Fold Change > 2 and gene rank with the top 10% as a threshold.13,14
GEPIA Database Analysis
GEPIA (http://gepia.cancer-pku.cn/) is a visualization site based on GTEx and TCGA data integration.15 Searching for keywords such as ‘PPEF1ʹ and “BRCA” in GEPIA to retrieve differential expression data for PPEF1 in BC and normal breast tissue.
Analysis of Breast Cancer Data in TCGA Public Database
The breast cancer dataset, including mRNA expression and overall survival times, was obtained from TCGA (https://portal.gdc.cancer.gov/). The original data from TCGA was normalized and analyzed by the edgeR analysis method.
The Prognostic and Diagnostic Analysis of PPEF1
Kaplan-Meier analysis of TCGA-BRCA data was used to analyze the 10-year overall survival of BC patients. Log-rank test was used to calculate P value.16 Additionally, online analysis database bc-GenExMiner v4.2 including 36 annotated genomic datasets (http://bcgenex.centregauducheau.fr/) was used to assess the association between PPEF1 and survival of BC patients.17,18
Gene Ontology Function Enrichment Analysis of PPEF1
After normalizing the TCGA-BRCA dataset, we distinguished between PPEF1 high group and PPEF1 low group according to the mRNA expression level. The differences of GO functional enrichment between the two groups were obtained by Gene Set Variation Analysis (GSVA).19
Gene Set Enrichment Analysis of PPEF1
GSEA was performed to annotate the Hallmark effector gene sets and the Kyoto Encyclopedia of Genes and Genomes (KEGG) signaling pathway associated with PPEF1 mRNA expression in the TCGA-BRCA dataset.20 GSEA software was obtained from the Broad Institute (http://www.broad.mit.edu/gsea).
Screening Co-Expressed Genes of PPEF1
Co-expressed genes of PPEF1 in BC were analyzed from TCGA-BRCA expression data. Using Pearson correlation analysis, the correlation coefficient ≥ 0.4 was used as the threshold to find the genes associated with higher levels of PPEF1.
Construction of Protein Interaction Network of PPEF1 Co-Expressed Genes
PPI network was constructed for PPEF1 co-expressed genes using the STRING v11.0 database (https://string-db.org/), and the protein interaction score ≥ 0.4, ie, medium and above reliability. To further analyze and screen the core genes in the PPI network.21
Cell Culture
MCF 10A, MCF7 and SK-BR-3 cells lines were purchased from the Cell Bank of the Chinese Academy of Sciences (Shanghai, China). MCF7 and SK-BR-3 were cultured in DMEM high glucose medium (Hyclone, USA) containing 10% fetal bovine serum (FBS) (Gibco, USA). MCF 10A were maintained in special culture medium (Procell, China).
RNA Extraction and RT-qPCR Analysis
RNA was extracted by TRIZOL (Takara, Japan) and reverse-transcribed into cDNA using PrimeScript RT reagent Kit (Takara, Japan). RT-PCR was conducted using SYBR Premix Ex Taq Kit (Takara, Japan) according to the manufacturer’s protocol with the following primers. PPEF1: forward, 5ʹ-GAAAGCGAACAGGACATGAGGGATAG-3ʹ and reverse, 5ʹ-GTGAGAGGAAATTGTAGCCGAGGAC-3ʹ; TBP: forward, 5ʹ-CCGGAATCCCTATCTTTAGTCC-3ʹ and reverse, 5ʹ-GCCTTTGTTGCTCTTCCAAAAT-3ʹ.
siRNA transient interference assay
The siRNAs were purchased from GeneBio (GeneBio, China). 1×10⁶ MCF7 and SK-BR-3 cells were, respectively, seeded in each well of a six-well culture plate (KIRGEN, USA). 7.5µL of siRNA combined with 7.5µL of EndoFectinTM-Max transfection reagent (GeneCopoeia, USA) were diluted in 250µL MEM medium (Gibco, USA) respectively, and incubated for 5 min. The mixture was then used for transient interference assay following the manufacturer’s protocol. The sequences of siRNAs are as follows:
5ʹ-UUCUCCGAACGUGUCACGUTT-3ʹ (siN.C.)
5ʹ-GCAUUAGUACCUACAUAUUTT-3ʹ (siPPEF1)
Cell Migration and Invasion Assays
Transwell chamber with a pore size of 8μm (Corning, USA) was used to perform cell invasion assay with Matrigel (100 μL, 1:8 dilution in serum-free medium) (Corning, USA) and migration assay without Matrigel. 5 × 10⁴ MCF7 or SK-BR-3 cells in 200 µL serum-free medium were seeded into the upper chamber and 600 µL medium with 10% FBS was added in lower chamber. After 24 h of incubation, cells on the upper surface of the membrane were removed with a cotton swab and cells on the lower surface of the inserts were fixed with methyl alcohol and stained with 0.1% crystal violet (Solarbio, China). Then, the stained cells were observed under light microscopy and 10 visual fields of each insert were randomly selected.
CCK-8 Cell Proliferation Assay
Cellular proliferation was determined with the cell counting kit-8 (CCK-8) assay (Beyotime, China). MCF7 or SK-BR-3 cells (2 × 10³/well) were seeded in 96-well plates (KIRGEN, USA). The absorbance of each well at 450nm was measured with an EnSpire multimode microplate reader (PerkinElmer, Singapore). Cell proliferation activity was examined for successive 6 days.
Immunohistochemical (IHC) Analysis
Paraffin-embedded BC tissues were obtained from the Pathology Department of the Affiliated Hospital of Southwest Medical University. Paraffin-embedded tissue slides were dewaxed and placed in normal goat serum (ZSGB-BIO, China) for nonspecific staining treatment, followed by incubation with the primary antibody anti-PPEF1 (1:250) (GeneTex, USA) overnight at 4°C. After that, the slides were treated with biotinylated secondary antibody and next with horseradish peroxidase-conjugated streptavidin complex (ZSGB-BIO, China). Finally, there were incubated with dimethylbenzidine and counterstained with hematoxylin. Immunostaining was expressed as the percentage of stained cells out of total number of tumor cells, and assigned to one of five categories: 0, <5%; 1, 5% ~ 25%; 2, 25% ~ 50%; 3, 50% ~ 75% and 4, >75%. The intensity of immunostaining was scored as: 1 weak (+); 2 moderate (++); 3 intense (+++). The two scores were multiplied and the product was defined as immunohistochemical score. The assessment of immunostaining was done without knowing results of other experiments.
Clinical Samples
A total of 114 serum samples were collected for PPEF1 analysis, among which 57 cases were healthy control and 57 cases were BC patients without therapy, respectively. All the clinical samples were obtained from the Laboratory Medicine Department of the Affiliated Hospital of Southwest Medical University. Patient Consent Forms were obtained according to protocols approved by the Institutional Review Board of the Affiliated Hospital of Southwest Medical University. Moreover, this study obtained written informed consent from the participants. PPEF1 were detected by commercial enzyme-linked immunosorbent assay (ELISA) kit according to the instructions (Zeye Bio, China). CEA, CA125 and CA153 in serum samples were detected by Roche Cobas e601 Electrochemiluminescence System (Roche, Switzerland).
Statistical Analysis
Student’s independent t test was utilized for normal distribution variables. Mann–Whitney U-test and K–S test were utilized for non‑normally distributed variables. Data were analyzed by GraphPad Prism software and presented as mean ± SEM indicated in figure legends. Differences were considered statistically significant when P < 0.05.
Results
The Clinicopathologic Importance of High PPEF1 Expression in BC
We first compared the transcriptional levels of PPEF1 in 20 types of cancers with their normal counterparts by using Oncomine database. As shown in Figure 1A, the PPEF1 expression was markedly upregulated only in two types of cancers, breast cancer and colorectal cancer. Further analysis revealed that PPEF1 mRNA expression was significantly increased in 5 types of BC, such as breast carcinoma in situ stroma, invasive breast carcinoma, invasive ductal breast carcinoma, invasive lobular breast carcinoma and male breast carcinoma (Figure 1B). To verify the findings of the Oncomine analysis, we conducted PPEF1 expression analysis using the GEPIA database and TCGA-BRCA datasets. PPEF1 was remarkably overexpressed due to increased mRNA in BC compared to normal individuals (Figure 1C and D). And the TCGA-BRCA data also demonstrated the mRNA expression levels of PPEF1 in BC tissues were significantly higher than that in the adjacent normal tissues (Figure 1E). These results indicated that PPEF1 expression is elevated in BC.
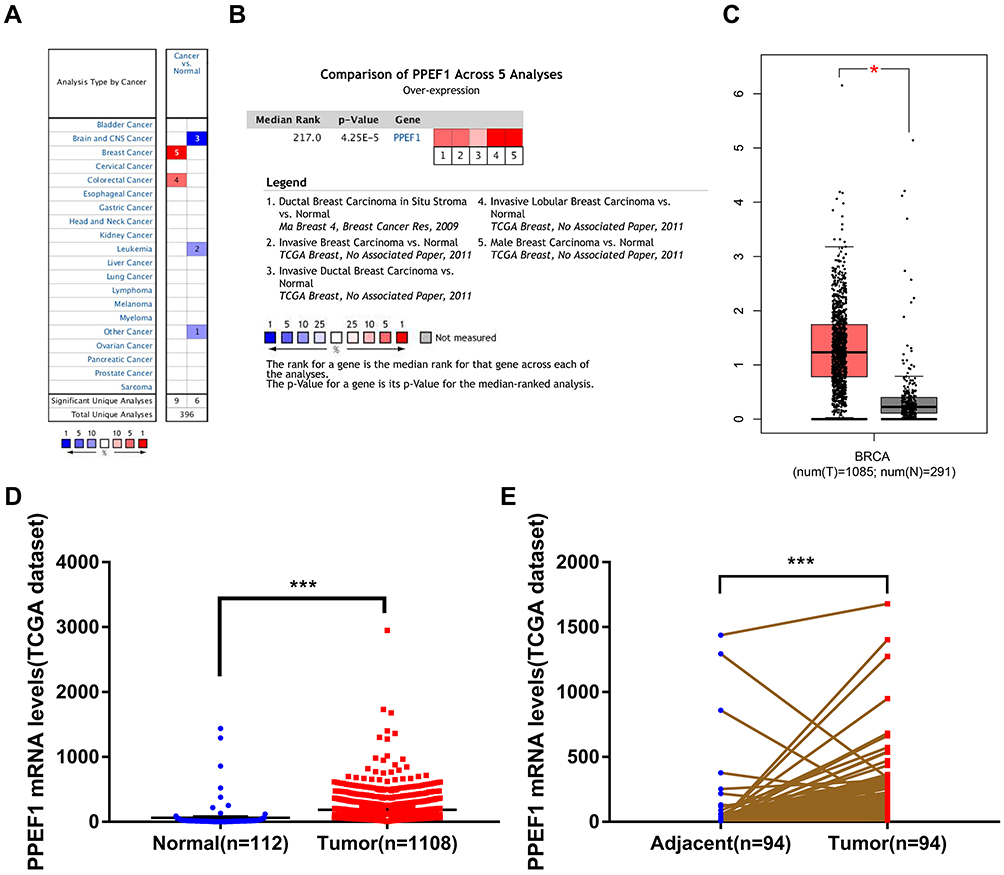 |
Figure 1 PPEF1 expression is increased in human breast cancer tissues. (A) Oncomine analysis of PPEF1 expression in human cancers. (B) The differential expression of PPEF1 between tumor and normal tissues in multiple types of breast cancer. (C) Boxplot of PPEF1 expression in BC tissues vs non-cancerous tissues from GEPIA analysis. (D, E) PPEF1 expression level in BC tissues is higher than that in the normal or pericarcinomatous tissues. The mRNA level of PPEF1 in unmatched BC and matched BC were download from TCGA datasets. *: P < 0.05, ***: P < 0.001. |
In addition, we compared the transcription levels of PPEF1 among groups of patients, according to different clinicopathological characteristics (Table 1). The results demonstrated that there was no significant difference in age, stage, tumor invasion and distant metastasis status. Notably, high PPEF1 expression was positive associated with lymphoid nodal(N) status (P = 0.009), estrogen receptor (ER) (P = 0.006), progesterone receptor (PR) (P = 0.012) and human epidermal growth factor receptor 2 (HER2) (P < 0.001).
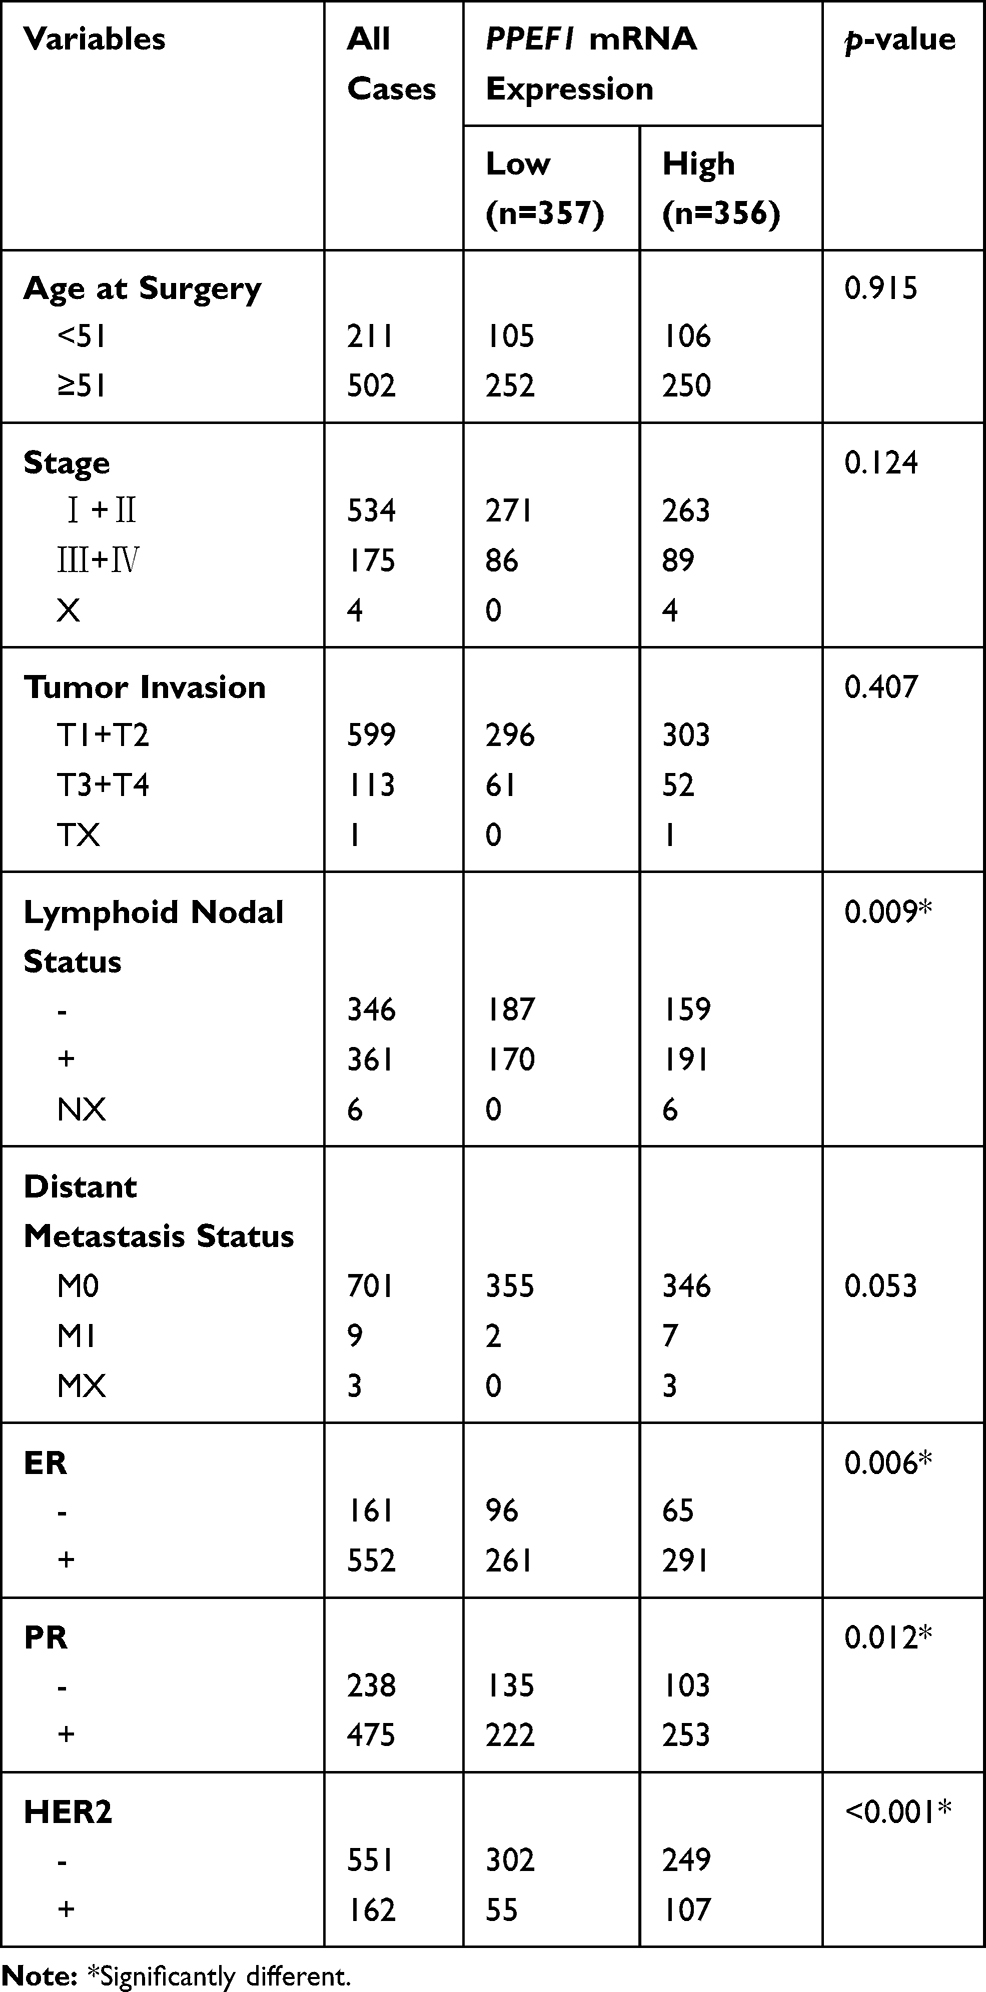 |
Table 1 Correlations Between mRNA Expression of PPEF1 and Clinicopathological Parameters of BC Patients |
The High Prognostic and Diagnostic Significances of PPEF1 in BC Patients
Kaplan-Meier Plotter tool was used to analyze the correlation between the PPEF1 expression and BC survival. High expression of PPEF1 was a poor prognostic marker for 10-year overall survival (OS) in TCGA cohort (HR = 1.45, 95% CI = 1.02–2.05, P = 0.037; Figure 2A). And integration analysis of multiple gene chip results from bc-GenExMiner between 2002 and 2019 confirmed higher PPEF1 expression negatively correlated with all events-free (AE-free) survival (HR = 1.12, 95% CI = 1.01–1.23, P = 0.0301) and metastatic recurrence-free (MR-free) survival (HR = 1.15, 95% CI = 1.00–1.31, P = 0.043) (Figure 2B and C). In addition, Cox univariate and multivariate survival analyses were performed including the PPEF1 expression levels and patients’ clinicopathological parameters. Univariate survival analysis suggested that differential expression levels, age and TNM stage were the important parameters affecting the survival time of BC patients. Furthermore, Cox multivariate revealed that PPEF1 over-expression was an independent risk factor of unfavorable prognosis in BC patients (HR = 1.001, 95% CI = 1.000–1.001, P = 0.012, Figure 2D, Table 2). To assess the diagnostic importance of PPEF1, we generated ROC curve using the mRNA expression data of BC patients and healthy individuals from TCGA-BRCA datasets (Figure 2E). The area under the ROC curve was 0.903 (AUC = 0.903, 95% CI = 0.858–0.947, P < 0.001), with a sensitivity of 93.1% and a specificity of 82.3%, which indicated that PPEF1 conferred well-diagnostic value.
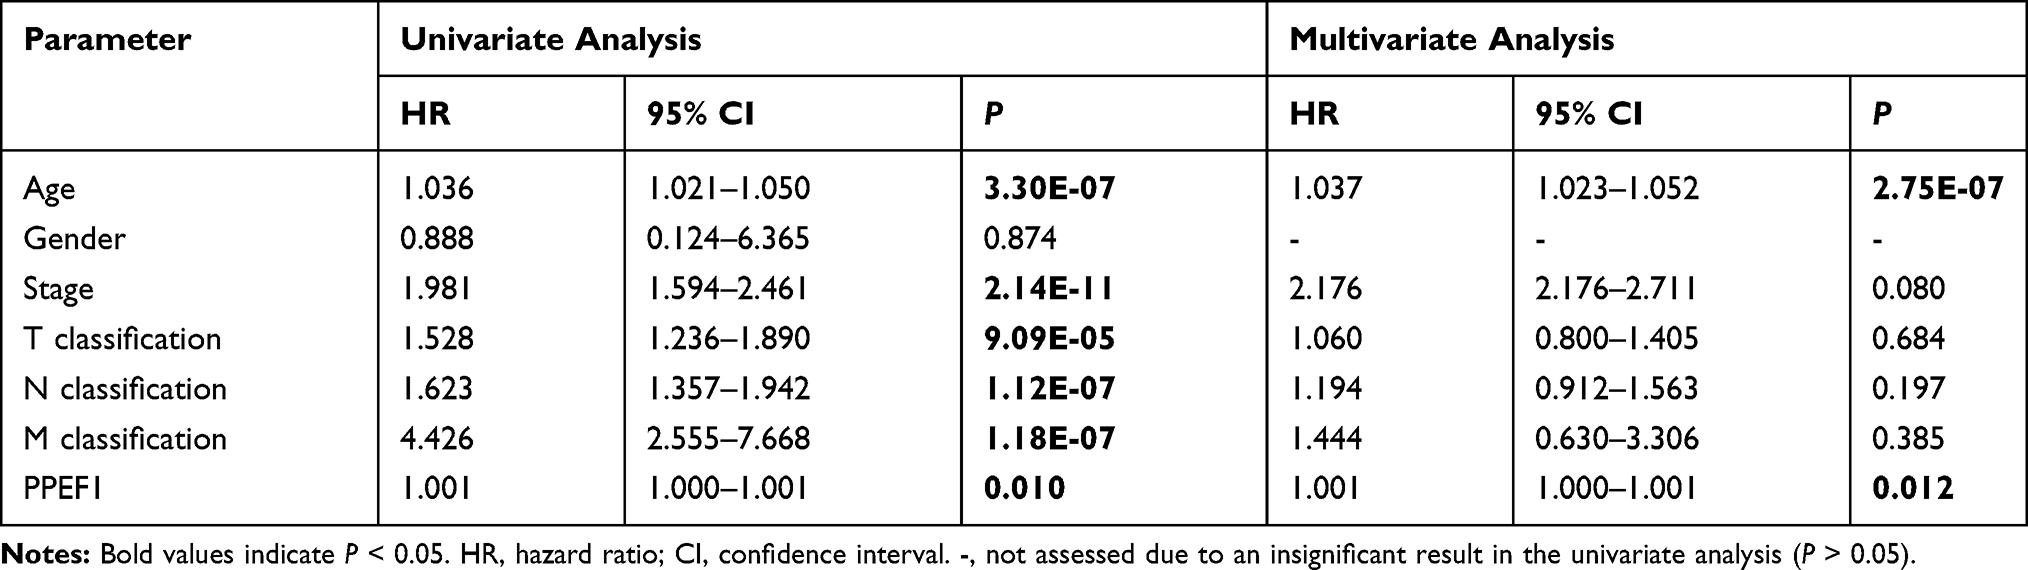 |
Table 2 Univariate and Multivariate OS Analysis of PPEF1 in Patients with BC |
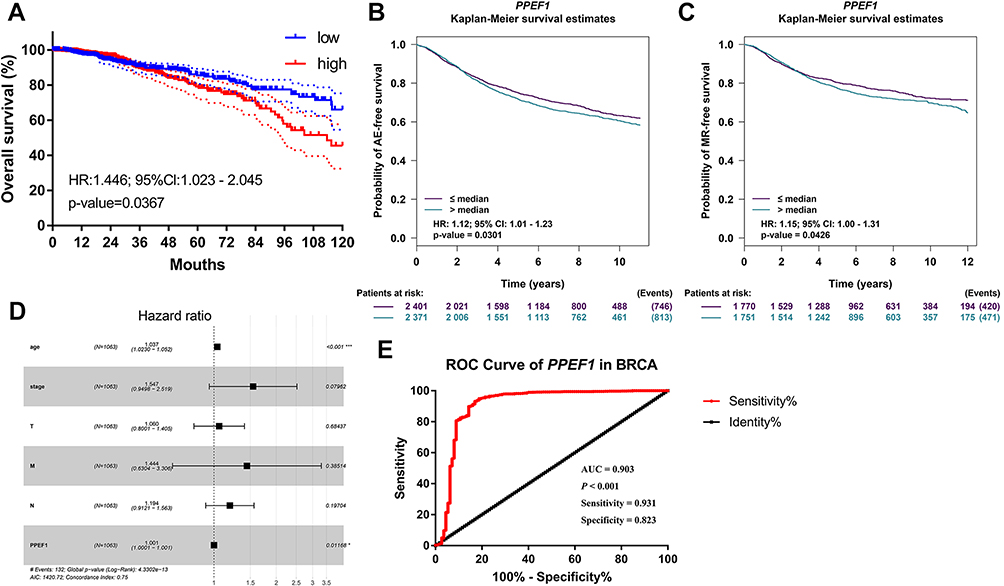 |
Figure 2 The prognostic and diagnostic significances of PPEF1 in BC. Elevated expression of PPEF1 indicated poor clinical outcome for BC patients; (A) Analysis of overall survival rates based on TCGA-BRCA data; (B, C) Analysis of events-free and metastatic recurrence-free survival rates based on bc-GenExMiner database. (D) Multivariate analysis of the correlation of PPEF1 expression with OS among breast cancer patients. (E) ROC curve of PPEF1 mRNA expression in BC patients. |
The Gene Ontology Functions Enrichment Analysis of PPEF1
In order to explore the biological significance and function of PPEF1, we used GSVA to perform GO functional enrichment analysis in TCGA-BRCA patients. GO enrichment analysis predicted the functional roles of PPEF1 on the basis of three aspects, including biological process (BP), molecular function (MF), and cellular components (CC). As illustrated in biological process functional enrichment, upregulated PPEF1 was significantly enriched in Autophagy, Negative Regulation of Response to DNA Damage Stimulus, Negative Regulation of Signal Transduction by P53 Class Mediator, Regulation of Response to Extracellular Stimulus and Post Translational Protein Modification, etc. (Figure 3A). For molecular function, upregulated PPEF1 was enriched in Arylsulfatase Activity, Sulfuric Ester Hydrolase Activity, Racemase and Epimerase Activity, Ubiquitin Like Protein Ligase Activity, Snap Receptor Activity, and participated in Platelet-Derived Growth Factor Binding, Ascorbic Acid Binding, Collagen Binding, etc. (Figure 3B). Furthermore, the cellular components associated with high expression of PPEF1 are located in Golgi-associated vesicle, Vesicle Coat, cis-Golgi network, β-catenin Destruction Complex, Ubiquitin Ligase Complex, etc. (Figure 3C).
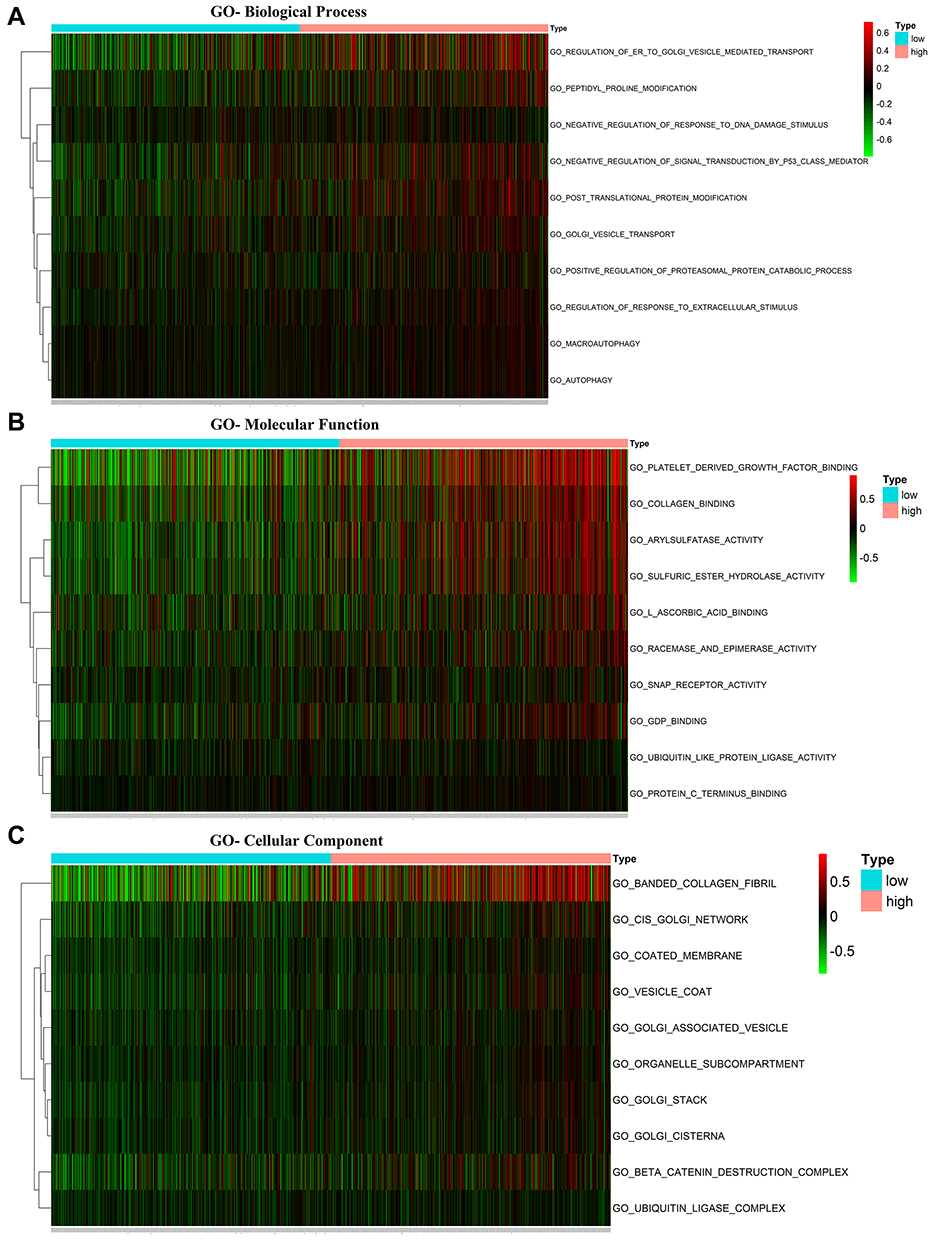 |
Figure 3 The Gene Ontology functions enrichment analysis of PPEF1. (A) Biological Process (BP); (B) Molecular Function (MF); (C) Cellular Components (CC). |
The Gene Set Enrichment Analysis of PPEF1 in BC
GSEA was performed to evaluate Hallmark effect gene sets and KEGG signaling pathway gene sets, which were associated with upregulated PPEF1 in the TCGA BC samples. The most valuable 10 pathways of each category were presented, respectively, in Figure 4A and B. For Hallmark gene sets, the most valuable top three were epithelial-mesenchymal transition (EMT), angiogenesis and TGF-β signaling, whereas the top three KEGG signaling pathways were ECM receptor interaction, TGF-β signaling pathway and Focal adhesion (Table 3). Notably, our data support that PPEF1 plays a vital role by regulating above classic cancer-related signaling pathways.
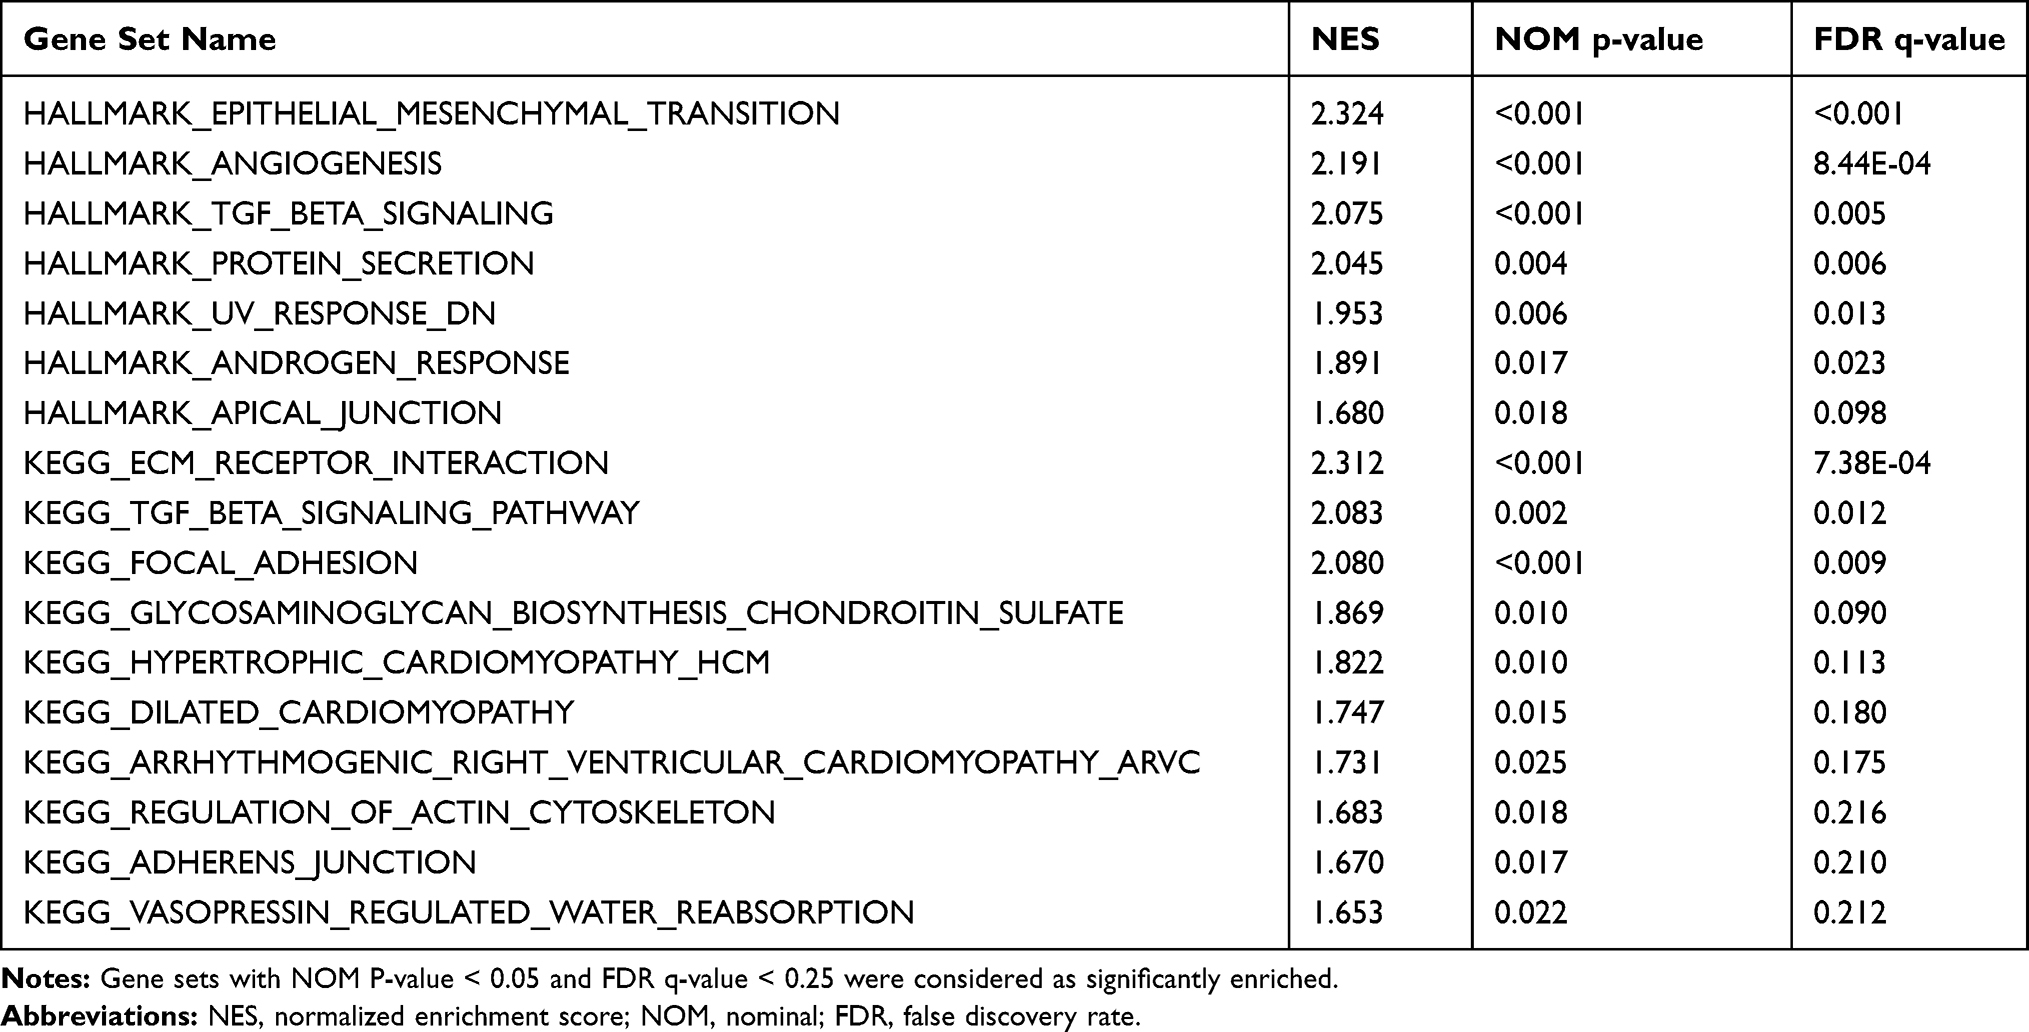 |
Table 3 Gene Sets Enriched in the High PPEF1 Expression Phenotype |
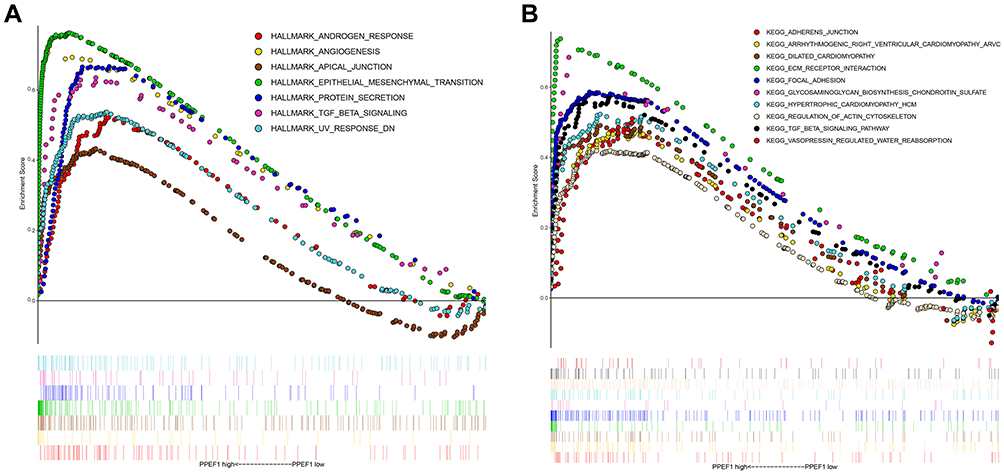 |
Figure 4 The GSEA analysis of PPEF1. (A) Hallmark effect gene sets; (B) KEGG signaling pathway gene sets. |
PPI Network Analysis of Genes Co-Expressed in PPEF1 in BC
Given the complex procedures of BC progression involving multiple genes and proteins, we first acquired 96 genes associated with PPEF1 expression in TCGA-BRCA datasets identified using Pearson correlation analysis. Then, PPI analyses of these co-expression genes were performed in STRING database to predict molecular regulation of PPEF1 in BC. The 20 nodes and 35 lines in the map of PPI network illustrated the interaction between PPEF1 related genes (Figure 5A). The node degree ≥ 2 was selected as the standard, and 9 of the top 10 core genes included COL6A1, COL6A2, ITGA5, MMP9, ADAMTS14, BMP1, RUNX2, TGFBI and THY1 were significantly up-regulated in breast cancer tissues compared with non-cancerous breast tissues, which is consistent with PPEF1 expression (Figure 5B and C). Noticeably, COL6A2, ITGA5, ADAMTS14, BMP1, TGFBI and THY1 associated with the EMT pathway were flagged by Hallmark pathway analysis, whereas COL6A1 and ITGA5 are key genes in the ECM Receptor Interaction pathway flagged by KEGG pathway analysis. Taken together, these core genes might also similarly interact with PPEF1 via various signaling pathways to perform the same function in BC.
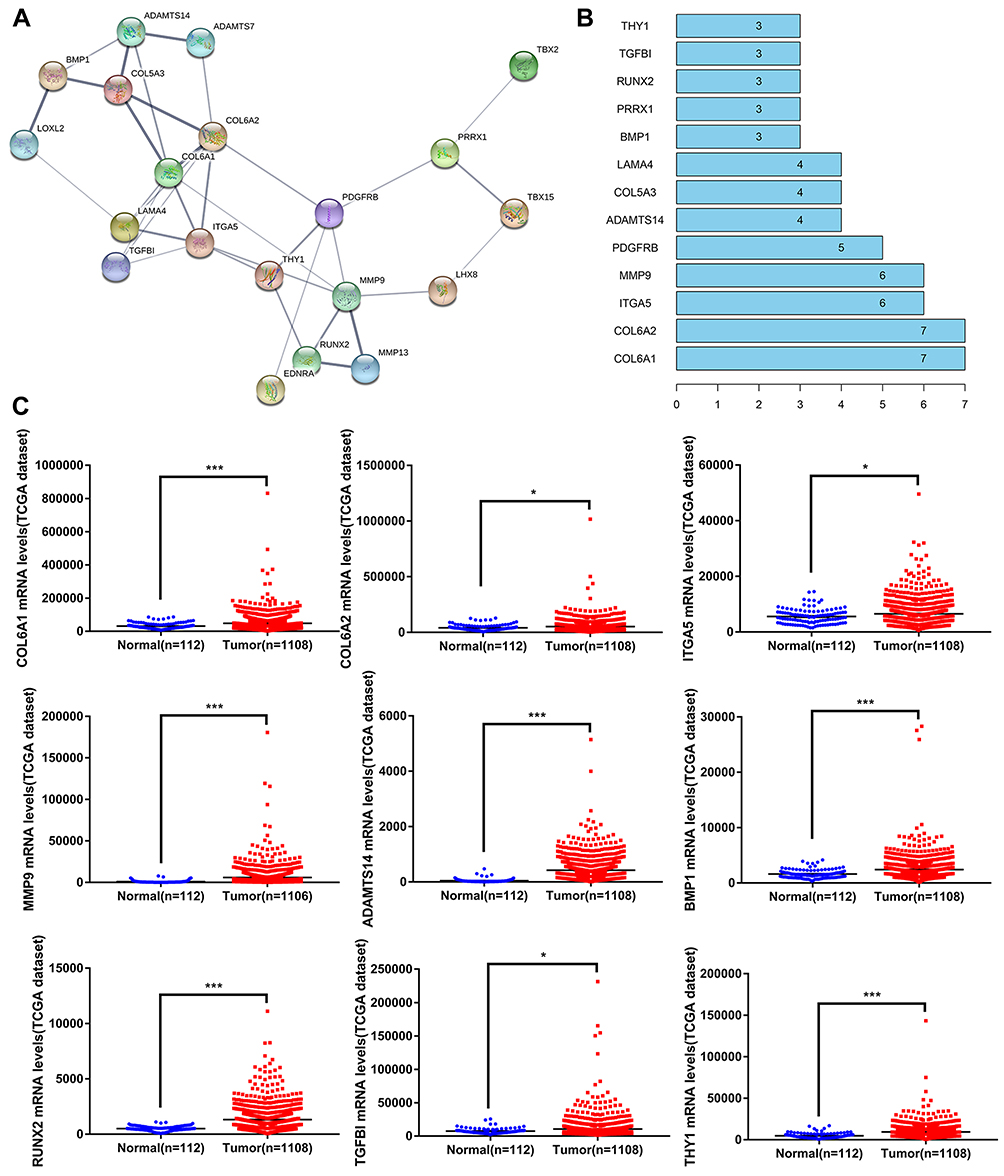 |
Figure 5 PPI network analysis of PPEF1 co-expressed genes in BC. (A) The PPI network of the co-expressed genes of PPEF1. (B) The top 10 core proteins of PPI network, the ordinate coordinates represent the name of the gene, and the abscissa represents the number of gene connections. (C) Analysis of core gene affecting breast cancer progression. *: P < 0.05, ***: P < 0.001. |
PPEF1 Promotes the Migration and Invasion of BC Cells
Prior to the present study, the role of PPEF1 as an oncogene in regulating BC migration and invasion has not been established. Using RT-qPCR, we found that the MCF7 and SK-BR-3 cells had elevated PPEF1 mRNA expression in comparison with the normal breast MCF 10A cells (Figure 6A). To investigate the relationship between elevated PPEF1and metastasis in BC cells, we first inhibited PPEF1 expression by transient siRNA interference and confirmed its effective silencing at the transcriptional level (Figure 6B). The effect of PPEF1 silencing on BC cells metastatic potential was measured by cell migration and invasion assays. Transient silencing of PPEF1 expression in MCF7-siPPEF1 and SK-BR-3- siPPEF1 cells significantly hindered the migration and invasion capabilities compared to control cells (Figure 6C and D). Notably, there is no marked difference of proliferation activities between the MCF7-siPPEF1 or SK-BR-3- siPPEF1 cells and control cells (Figure 6E), confirming the differences in cell migration and invasion were not due to alterations in cell proliferation. These observations collectively indicated that PPEF1 enhanced the metastasis of BC cells.
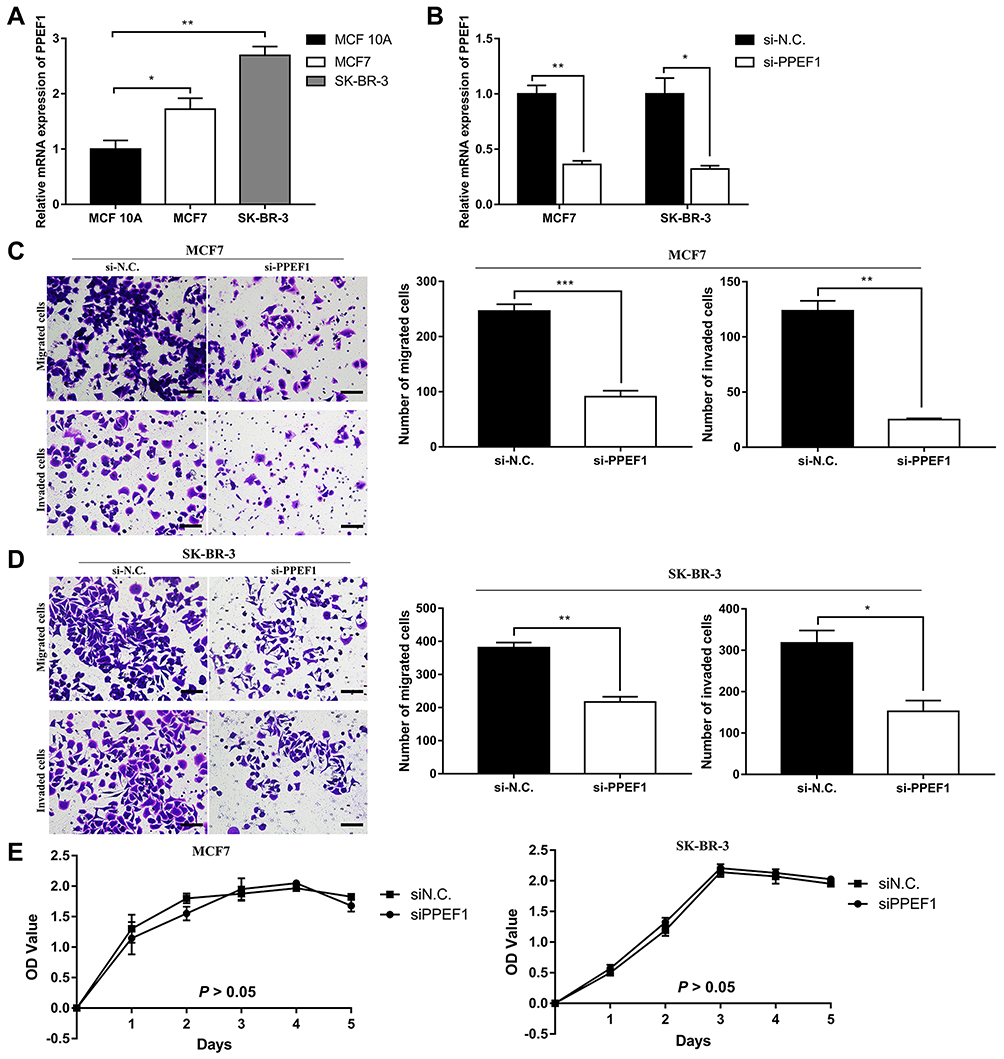 |
Figure 6 Functional verification of PPEF1 in representative BC cells. (A) The relative mRNA expression levels of PPEF1 in non-malignant MCF 10A and BC cells (MCF7 and SK-BR-3) were determined by RT-qPCR. (B) Efficiency of PPEF1 siRNA interference determined by RT-qPCR in MCF7 and SK-BR-3 cells, respectively. (C) Transwell migration and invasion assays in MCF7. Scale bar = 60μm. (D) Transwell migration and invasion assays in SK-BR-3. Scale bar = 60μm. (E) Proliferation activities of MCF7-siN.C. (SK-BR-3-siN.C.) and MCF7-siPPEF1 (SK-BR-3-siPPEF1) cells measured by the CCK-8 assay. *: P < 0.05, **: P < 0.01, ***: P < 0.001. |
The Expression of PPEF1 Could Be Regarded as a Promising Evaluation Index for Clinical Diagnosis
To further verify the clinical implications, we examined the protein expressions of PPEF1 in BC paraffin-embedded tissues by the immunohistochemistry (IHC). A total of 88 clinical samples were collected for PPEF1 analysis, including 44 BC cases and their matched adjacent normal tissues. The results indicated that the PPEF1 was upregulated and localized in the cytoplasmic and membranous of breast tumor cells, which was matched with the GO enrichment analysis of cellular component (Figure 7A). And it also showed a positive association between PPEF1 increased protein and N status (P = 0.033) and HER2 (P = 0.033) (Table 4).
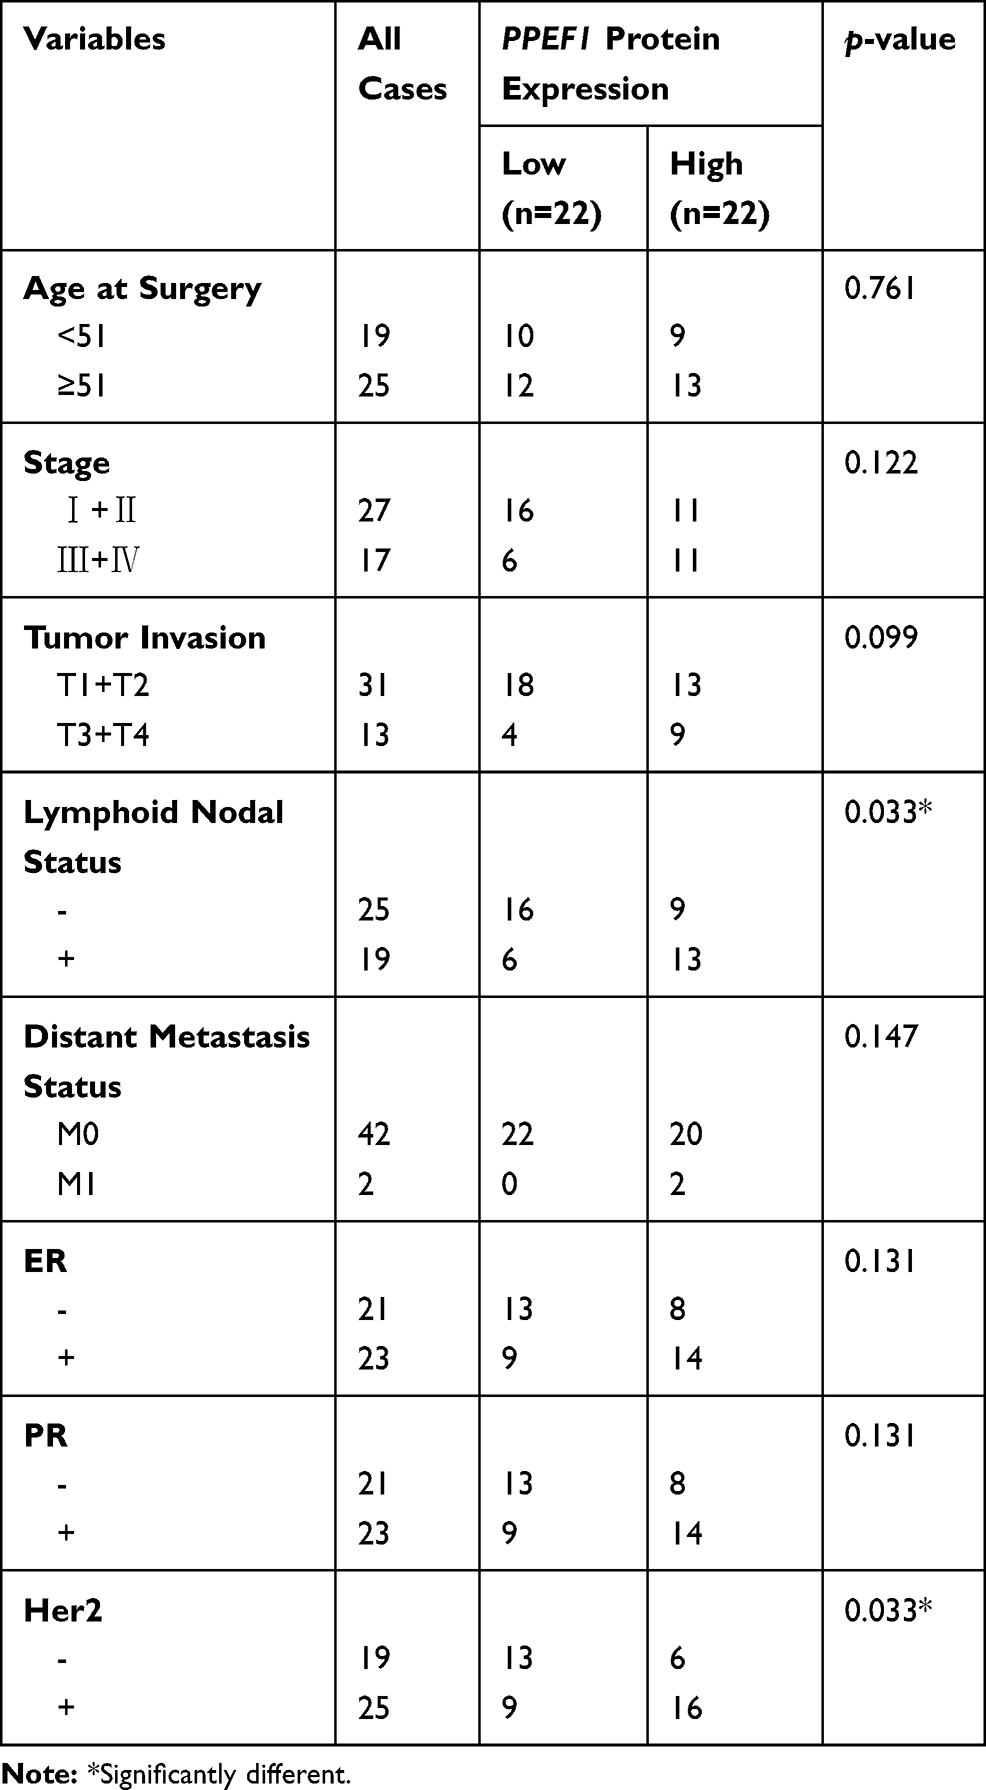 |
Table 4 Correlations Between PPEF1 in IHC and Clinicopathological Parameters of BC Patients |
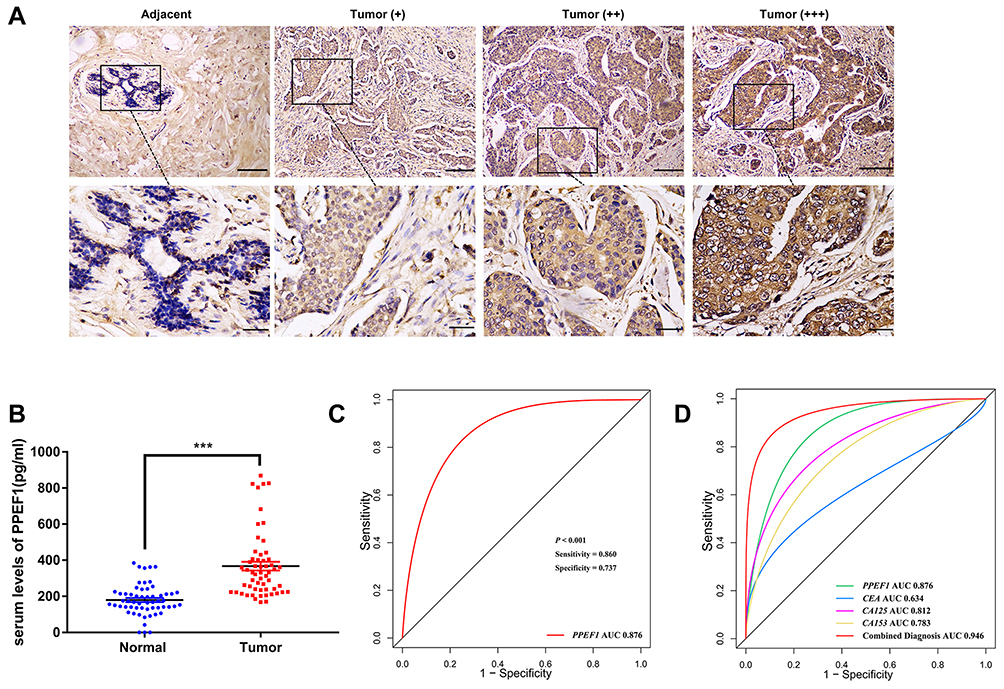 |
Figure 7 Clinical validation of PPEF1 in BC patients. (A) Representative immunohistochemical staining of PPEF1 expression. Scale bar = 60μm (upper panels), Scale bar = 30μm (lower panels). (B) Serum levels of PPEF1 in BC patients and healthy people. ***: P < 0.001. (C) ROC analysis for the PPEF1 in BC patient serum. (D) ROC curves for diagnostic models of the combination of PPEF1, CEA, CA125 and CA153. |
Additionally, the aberrant expression of PPEF1 in the serum was identified by the ELISA method and quantized on a standard curve. The immunoreactive PPEF1 amount in the serum of 57 healthy individuals was (179.6 ± 11.4) pg/mL (Mean ± SEM), whereas the average serum PPEF1 concentration in the 57 breast cancer patients was (366.5 ± 24.25) pg/mL (Mean ± SEM). Thus, the expression of PPEF1 was much higher in the serum of BC patients compared with that in healthy individuals (Figure 7B). Moreover, correlation analysis showed that high PPEF1 in serum was associated with HER2 (P = 0.025) (Table 5), which was consistent with database and IHC analysis.
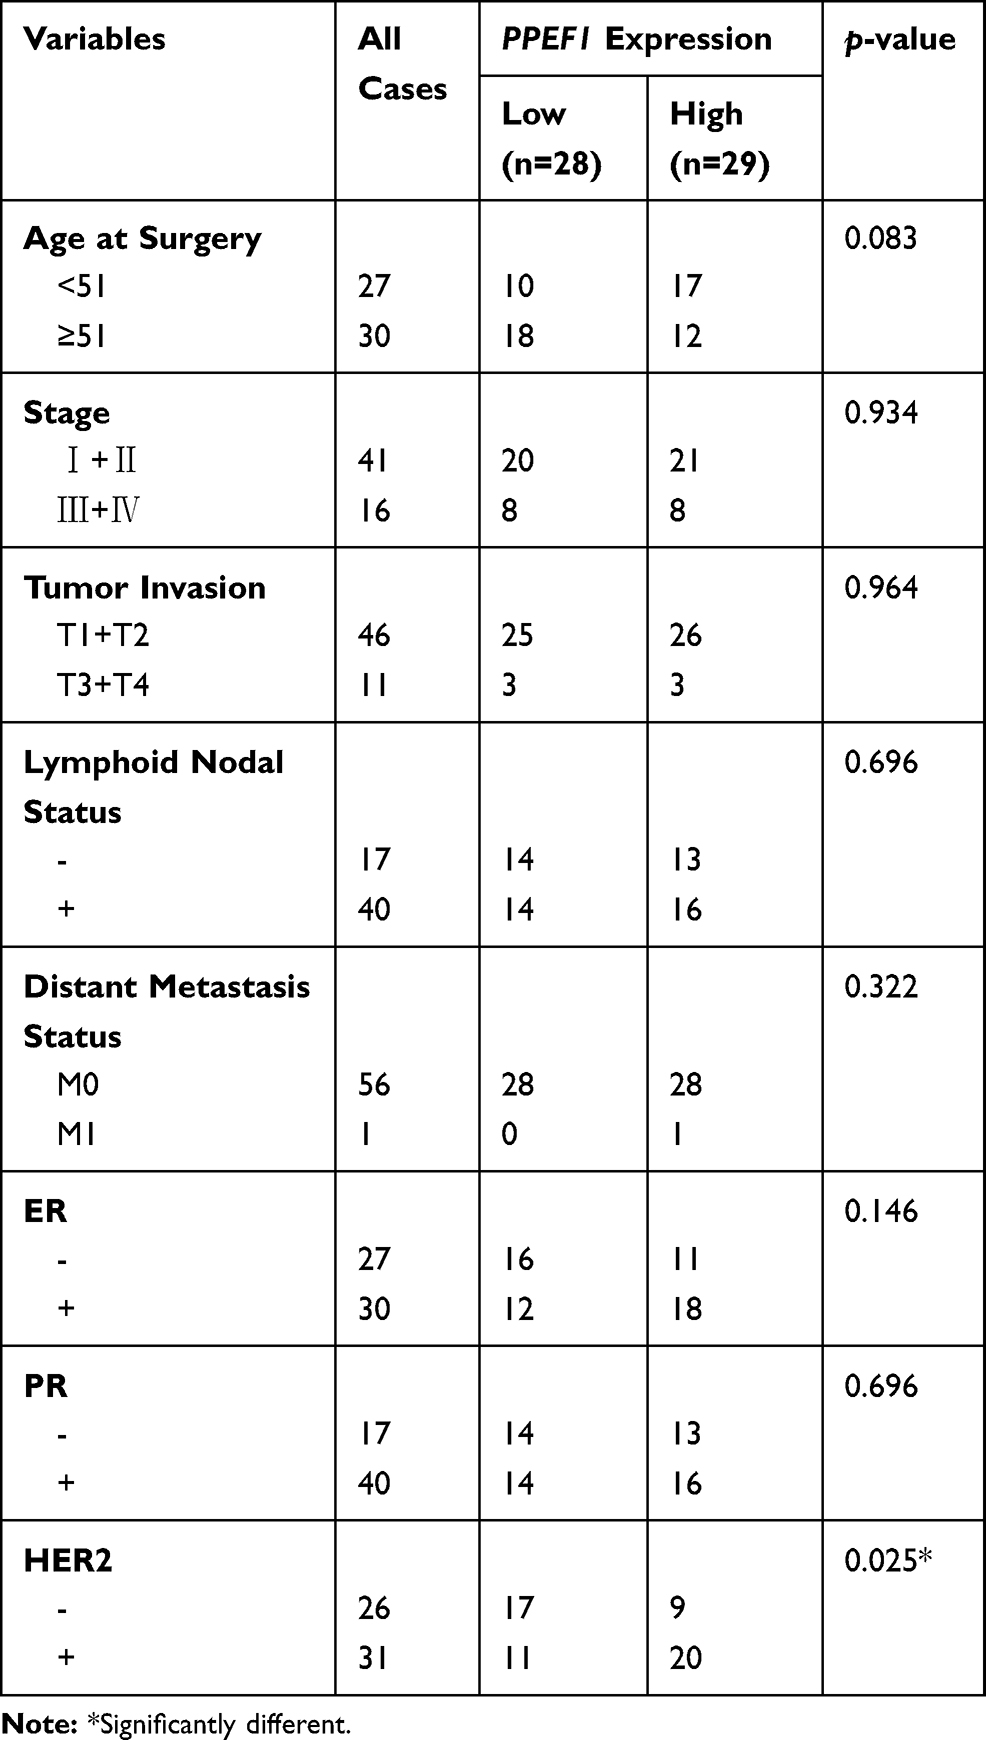 |
Table 5 Correlations Between PPEF1 Expression in Serum and Clinicopathological Parameters of BC Patients |
And the area under the ROC curve (AUC) of PPEF1 was 0.876 with a sensitivity of 86.0% and a specificity of 73.7%, which also demonstrates that PPEF1 has higher clinical value as a non-invasive biomarker in BC. Meanwhile, CEA, CA125 and CA153 in ELISA tested patient serum were analyzed by chemiluminescence measuring instrument. Astonishingly, the combined detection of PPEF1, CEA, CA125 and CA153 can improve the diagnosis efficiency of BC with both better sensitivity (93.0%) and specificity (82.5%) (Figure 7D, Table 6).
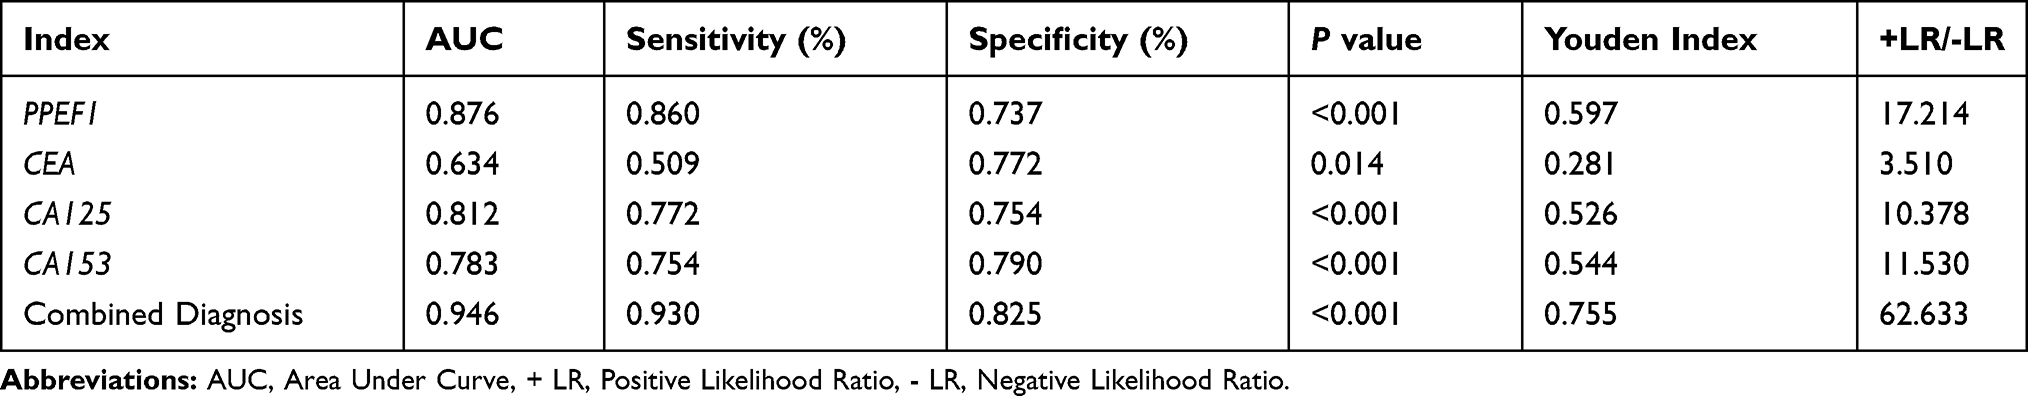 |
Table 6 Diagnostic Accuracy Based on Serum PPEF1 Levels Combined Detection of Tumor Markers CEA, CA125 and CA153 |
Discussion
Breast cancer management remains a challenge due to its characteristics of high metastasis and high mortality rates.22 It is known that phosphatases, as an oncogene or tumor suppressor, can modulate a variety of signaling pathways and dysregulation results in abnormal processes including uncontrolled proliferation, differentiation, angiogenesis, and metastasis.23 PPEF1, a member of the protein serine/threonine phosphatase gene family, can inhibit apoptosis in genotoxic stress, leading to uncontrolled overgrowth of cells,24 which may be involved in the progression of some malignancies.7,12 However, the potential role of PPEF1 in BC has not been established prior to the present study.
This study has made the following novel findings that contribute to provide an evidence for PPEF1 as an oncogene, which lay the foundation for further clinical and mechanistic understanding in BC:
First, the oncogene function of PPEF1 in BC has been uncovered by data mining of publicly available cancer clinical databases, including Oncomine, GEPIA and TCGA (Figure 1). Furthermore, high PPEF1 expression was positively associated with N+, ER+, PR+ and HER2+ in BC patients (Table 1). Prior to this study, the clinical relevance of PPEF1 has not been well explored and established. This study is the first to explore that PPEF1 could be a promising prognostic biomarker for BC thus is of high clinical relevance. We also found that the high PPEF1 expression was an independent predicted factor of unfavorable prognosis in patients with BC (Figure 2A-D, Table 2). Moreover, ROC analysis confirmed that the high expression of PPEF1 has the potential diagnostic value in patients with BC (Figure 2E).
Second, the present study provided the first evidence that PPEF1 participated in multiple biological processes involving in tumorigenesis and development (Figure 3). The GO analysis suggested that the high expression of PPEF1 could be involved in the negative feedback regulation of P53 signaling, leading to the development of BC. Consistent with our findings, Ho et al have found that PPEF1 can inhibit P53-mediated apoptosis through dephosphorylation, and increase tumorigenicity and drug resistance of human lung cancer cells.7 Meanwhile, accumulating evidence has suggested the participation of PPEF1 in negative feedback regulation of P53 signaling, autophagy, regulation of DNA damage, which play important roles in growth, invasion and metastasis of BC.25–27 Furthermore, PPEF1 is involved in a variety of molecular functions related to tumor microenvironment, such as proteases,28 platelet-derived growth factors and collagen.29,30
Third, we have innovatively predicted the potential signaling pathways underlying the oncogenic activity of PPEF1 in BC by GSEA. The high expression of PPEF1 is mainly enriched in EMT, angiogenesis, TGF-β pathway, Focal adhesion and ECM receptor interaction (Figure 4, Table 3). Among the above pathways, angiogenesis is the basic factor of tumor growth and metastasis.31 EMT, ECM and Focal adhesion pathways are involved in biological processes such as tumor adhesion, invasion and metastasis.32,33 Noteworthy, ECM can activate the Focal adhesion signaling pathway34 and RTK downstream signaling pathway, resulting in tumor growth, invasion, migration, and angiogenesis.35,36 TGF-β signaling pathway is one of the important pathways involved in the cancer cell proliferation, invasion, migration, angiogenesis, apoptosis, as well as in metastasis by agitation or invasion of metastasis-related factors, including epithelial-mesenchymal transition (EMT).37–39 The relationship between PPEF1 and these specific signaling pathways was not previously reported in the literature, thus and merits further studies.
Fourth, PPI analysis revealed that potential synergy or interaction of nine core genes with PPEF1 contributed to the progression and prognosis of BC (Figure 5). Among the core genes, COL6A1 can promote the metastasis of various tumors,40,41 and COL6A2 is a cancer-driven gene with a mutation rate of more than 5% in BC.42 ITGA5 promoted tumor invasion which was highly expressed in BC with migration, invasiveness and lung metastases.43 MMP9 overexpression hydrolyzes the basement membrane and promotes cancer cell invasion and migration.44 ADAMTS14 encodes a combination of integrin and metalloproteinases, which is linked to the progression of liver cancer.45 There are also reported that BMP1 associated with poor prognosis of renal clear cell carcinoma,46 and RUNX2 can promote breast cancer proliferation, migration, invasion and epithelial-mesenchymal transition.47 Moreover, THY1 encodes cell surface glycoprotein and protein immunoglobulin superfamily CD90, which is associated with breast cancer stem cells and EMT processes.48
Noteworthy, in our analysis, TGFBI was found highly expressed in BC as the co-expression gene of PPEF1. Inconsistent with our findings, some previous studies had shown that TGFBI can reduce the metastatic potential of lung and breast tumor cells in vitro and in vivo.49,50 This merits further investigation.
Fifth, PPEF1 expression is a promising biomarker for BC thus is of high clinical relevance. Firstly, we characterized the migration and invasion promoting effect of PPEF1 in BC cells, providing more experimental evidences for the role of PPEF1 in BC metastasis (Figure 6). Using IHC analysis, we evaluated the over-expression of PPEF1 protein, which was localized in the cytoplasmic and membranous. Further, we found that PPEF1 could be explored as non-invasive screening for BC patients with a better sensitivity and specificity (Figure 7). Noteworthy, the combined determination of serum PPEF1 and traditional tumor markers (CEA, CA125 and CA153) can enhance diagnostic accuracy thus is of vital importance in the early diagnosis of BC (Table 6). And lastly, we found that increased PPEF1 expression may play a role in BC aggressiveness following the positive expression of HER2 (Tables 4 and 5), which laid the foundation for future mechanism research.
In conclusion, to the best of our knowledge, our study is the first to provide convincing evidence that PPEF1 exerts its novel function on driving breast tumorigenesis and progression. Meanwhile, high PPEF1 expression could also serve as a biomarker for diagnosis and prognosis in BC patients.
Ethics Approval and Consent to Participate
All the clinical samples were obtained from the Laboratory Medicine Department of the Affiliated Hospital of Southwest Medical University. Patient Consent Forms were obtained according to protocols approved by the Institutional Review Board of the Affiliated Hospital of Southwest Medical University. Moreover, this study obtained written informed consent from the participants.
Acknowledgments
This work was supported by the Sichuan Science and Technology Program for International Cooperation, China (Grant No. 2017HH0105), Doctoral Research Initiation Fund of Affiliated Hospital of Southwest Medical University (Grant No.19077), the Sichuan Science and Technology Program for Foundation Platform, China (Grant No. 2018TJPT0023), and the Sichuan Science and Technology Program for Major Project, China (Grant No. 2019YFS0332; Grant No. 2019YFS0038). We would like to thank the members of the research group who are not listed in the authors.
Disclosure
The authors declare no conflicts of interest in this work.
References
1. Siegel RL, Miller KD, Jemal A. Cancer statistics, 2018. CA Cancer J Clin. 2018;68(1):7–30. doi:10.3322/caac.21442
2. Bray F, Ferlay J, Soerjomataram I, Siegel RL, Torre LA, Jemal A. Global cancer statistics 2018: GLOBOCAN estimates of incidence and mortality worldwide for 36 cancers in 185 countries. CA Cancer J Clin. 2018;68(6):394–424. doi:10.3322/caac.v68.6
3. Chlebowski RT, Manson JE, Anderson GL, et al. Estrogen plus progestin and breast cancer incidence and mortality in the Women’s Health Initiative Observational Study. J Natl Cancer Inst. 2013;105(8):526–535. doi:10.1093/jnci/djt043
4. Assi HA, Khoury KE, Dbouk H, Khalil LE, Mouhieddine TH, El Saghir NS. Epidemiology and prognosis of breast cancer in young women. J Thorac Dis. 2013;5(Suppl 1):S2–8. doi:10.3978/j.issn.2072-1439.2013.05.24
5. Cui X, Jing X, Long C, Tian J, Zhu J. Long noncoding RNA MEG3, a potential novel biomarker to predict the clinical outcome of cancer patients: a meta-analysis. Oncotarget. 2017;8(12):19049–19056. doi:10.18632/oncotarget.14987
6. DeSantis C, Ma J, Bryan L, Jemal A. Breast cancer statistics, 2013. CA Cancer J Clin. 2014;64(1):52–62. doi:10.3322/caac.21203
7. Ho P, Dai KS, Chen HL. Molecular cloning of a novel PPEF-1 gene variant from a T-cell lymphoblastic lymphoma cell line. Recent Pat DNA Gene Seq. 2012;6(1):72–77. doi:10.2174/187221512799303172
8. Saadat M, Mizuno Y, Takizawa N, Kakinoki Y, Rikuchi R. Neoplastic alterations in subcellular distribution of type 1 alpha protein phosphatase in rat ascites hepatoma cells. Cancer Lett. 1995;94(2):165–170. doi:10.1016/0304-3835(95)03846-O
9. Peng A, Maller JL. Serine/threonine phosphatases in the DNA damage response and cancer. Oncogene. 2010;29(45):5977–5988. doi:10.1038/onc.2010.371
10. Golden T, Aragon IV, Zhou G, Cooper SR, Dean NM, Honkanen RE. Constitutive over expression of serine/threonine protein phosphatase 5 (PP5) augments estrogen-dependent tumor growth in mice. Cancer Lett. 2004;215(1):95–100. doi:10.1016/j.canlet.2004.03.027
11. Li DW, Liu JP, Schmid PC, et al. Protein serine/threonine phosphatase-1 dephosphorylates p53 at Ser-15 and Ser-37 to modulate its transcriptional and apoptotic activities. Oncogene. 2006;25(21):3006–3022. doi:10.1038/sj.onc.1209334
12. Park SY, Seo J, Choi HK, et al. Protein serine/threonine phosphatase PPEF-1 suppresses genotoxic stress response via dephosphorylation of PDCD5. Sci Rep. 2017;7:39222. doi:10.1038/srep39222
13. Ma XJ, Dahiya S, Richardson E, Erlander M, Sgroi DC. Gene expression profiling of the tumor microenvironment during breast cancer progression. Breast Cancer Res. 2009;11(1):R7. doi:10.1186/bcr2222
14. Rhodes DR, Yu J, Shanker K, et al. ONCOMINE: a cancer microarray database and integrated data-mining platform. Neoplasia. 2004;6(1):1–6. doi:10.1016/S1476-5586(04)80047-2
15. Tang Z, Li C, Kang B, Gao G, Li C, Zhang Z. GEPIA: a web server for cancer and normal gene expression profiling and interactive analyses. Nucleic Acids Res. 2017;45(W1):W98–W102. doi:10.1093/nar/gkx247
16. Williams C, Lewsey JD, Briggs AH, Mackay DF. Cost-effectiveness analysis in R using a multi-state modeling survival analysis framework: a tutorial. Med Decis Making. 2017;37(4):340–352. doi:10.1177/0272989X16651869
17. Jezequel P, Frenel JS, Campion L, et al. bc-GenExMiner 3.0: new mining module computes breast cancer gene expression correlation analyses. Database (Oxford). 2013;2013:bas060. doi:10.1093/database/bas060
18. Jezequel P, Campone M, Gouraud W, et al. bc-GenExMiner: an easy-to-use online platform for gene prognostic analyses in breast cancer. Breast Cancer Res Treat. 2012;131(3):765–775. doi:10.1007/s10549-011-1457-7
19. Hanzelmann S, Castelo R, Guinney J. GSVA: gene set variation analysis for microarray and RNA-seq data. BMC Bioinformatics. 2013;14:7. doi:10.1186/1471-2105-14-7
20. Subramanian A, Tamayo P, Mootha VK, et al. Gene set enrichment analysis: a knowledge-based approach for interpreting genome-wide expression profiles. Proc Natl Acad Sci U S A. 2005;102(43):15545–15550. doi:10.1073/pnas.0506580102
21. Szklarczyk D, Gable AL, Lyon D, et al. STRING v11: protein-protein association networks with increased coverage, supporting functional discovery in genome-wide experimental datasets. Nucleic Acids Res. 2019;47(D1):D607–D613. doi:10.1093/nar/gky1131
22. Redig AJ, McAllister SS. Breast cancer as a systemic disease: a view of metastasis. J Intern Med. 2013;274(2):113–126. doi:10.1111/joim.2013.274.issue-2
23. Stebbing J, Lit LC, Zhang H, et al. The regulatory roles of phosphatases in cancer. Oncogene. 2014;33(8):939–953. doi:10.1038/onc.2013.80
24. Ramulu P, Nathans J. Cellular and subcellular localization, N-terminal acylation, and calcium binding of Caenorhabditis elegans protein phosphatase with EF-hands. J Biol Chem. 2001;276(27):25127–25135. doi:10.1074/jbc.M011712200
25. Paluch-Shimon S, Evron E. Targeting DNA repair in breast cancer. Breast. 2019;47:33–42. doi:10.1016/j.breast.2019.06.007
26. Macedo GS, Vieira IA, Vianna FSL, et al. p53 signaling pathway polymorphisms, cancer risk and tumor phenotype in TP53 R337H mutation carriers. Fam Cancer. 2018;17(2):269–274. doi:10.1007/s10689-017-0028-4
27. Zhang X, Hu P, Ding SY, et al. Induction of autophagy-dependent apoptosis in cancer cells through activation of ER stress: an uncovered anti-cancer mechanism by anti-alcoholism drug disulfiram. Am J Cancer Res. 2019;9(6):1266–1281.
28. Komi DEA, Redegeld FA. Role of mast cells in shaping the tumor microenvironment. Clin Rev Allergy Immunol. 2019. doi:10.1007/s12016-019-08753-w
29. Huong PT, Nguyen LT, Nguyen XB, Lee SK, Bach DH. The role of platelets in the tumor-microenvironment and the drug resistance of cancer cells. Cancers (Basel). 2019;11:2. doi:10.3390/cancers11020240
30. Natal RA, Paiva GR, Pelegati VB, et al. Exploring collagen parameters in pure special types of invasive breast cancer. Sci Rep. 2019;9(1):7715. doi:10.1038/s41598-019-44156-9
31. Hedlund EE, McDonald PC, Nemirovsky O, Awrey S, Jensen LDE, Dedhar S. Harnessing induced essentiality: targeting carbonic anhydrase IX and angiogenesis reduces lung metastasis of triple negative breast cancer xenografts. Cancers (Basel). 2019;11:7. doi:10.3390/cancers11071002
32. Humeres C, Frangogiannis NG. Fibroblasts in the infarcted, remodeling, and failing heart. JACC Basic Transl Sci. 2019;4(3):449–467. doi:10.1016/j.jacbts.2019.02.006
33. Marcus J, Bejerano-Sagie M, Patterson N, et al. Septin 9 isoforms promote tumorigenesis in mammary epithelial cells by increasing migration and ECM degradation through metalloproteinase secretion at focal adhesions. Oncogene. 2019;38(30):5839–59.
34. Zhang D, Huo J, Li R, Zhang Y, Wang Z, Li X. Altered levels of focal adhesion and extracellular matrix-receptor interacting proteins were identified in Hailey-Hailey disease by quantitative iTRAQ proteome analysis. J Cell Biochem. 2019;120(3):3801–3812. doi:10.1002/jcb.v120.3
35. Thomson S, Petti F, Sujka-Kwok I, et al. A systems view of epithelial-mesenchymal transition signaling states. Clin Exp Metastasis. 2011;28(2):137–155. doi:10.1007/s10585-010-9367-3
36. Danilkovitch-Miagkova A, Angeloni D, Skeel A, Donley S, Lerman M, Leonard EJ. Integrin-mediated RON growth factor receptor phosphorylation requires tyrosine kinase activity of both the receptor and c-Src. J Biol Chem. 2000;275(20):14783–14786. doi:10.1074/jbc.C000028200
37. Hong GP, Min SG, Jo YJ. Anti-oxidative and anti-aging activities of porcine by-product collagen hydrolysates produced by commercial proteases: effect of hydrolysis and ultrafiltration. Molecules. 2019;24:6. doi:10.3390/molecules24061104
38. Liu S, de Boeck M, van Dam H, Ten Dijke P. Regulation of the TGF-beta pathway by deubiquitinases in cancer. Int J Biochem Cell Biol. 2016;76:135–145. doi:10.1016/j.biocel.2016.05.001
39. Liang L, Wang X, Zheng Y, Liu Y. All-trans retinoic acid modulates TGFbetainduced apoptosis, proliferation, migration and extracellular matrix synthesis of conjunctival fibroblasts by inhibiting PI3K/AKT signaling. Mol Med Rep. 2019. doi:10.3892/mmr
40. Zhu H, Chen H, Wang J, Zhou L, Liu S. Collagen stiffness promoted non-muscle-invasive bladder cancer progression to muscle-invasive bladder cancer. Onco Targets Ther. 2019;12:3441–3457. doi:10.2147/OTT.S194568
41. Owusu-Ansah KG, Song G, Chen R, et al. COL6A1 promotes metastasis and predicts poor prognosis in patients with pancreatic cancer. Int J Oncol. 2019. doi:10.3892/ijo.2019.4825
42. Pongor L, Kormos M, Hatzis C, Pusztai L, Szabo A, Gyorffy B. A genome-wide approach to link genotype to clinical outcome by utilizing next generation sequencing and gene chip data of 6697 breast cancer patients. Genome Med. 2015;7:104. doi:10.1186/s13073-015-0228-1
43. Li Y, Xiao Y, Lin HP, et al. In vivo beta-catenin attenuation by the integrin alpha5-targeting nano-delivery strategy suppresses triple negative breast cancer stemness and metastasis. Biomaterials. 2019;188:160–172. doi:10.1016/j.biomaterials.2018.10.019
44. Klassen LMB, Chequin A, Manica GCM, et al. MMP9 gene expression regulation by intragenic epigenetic modifications in breast cancer. Gene. 2018;642:461–466. doi:10.1016/j.gene.2017.11.054
45. Sheu MJ, Hsieh MJ, Chou YE, et al. Effects of ADAMTS14 genetic polymorphism and cigarette smoking on the clinicopathologic development of hepatocellular carcinoma. PLoS ONE. 2017;12(2):e0172506. doi:10.1371/journal.pone.0172506
46. Xiao W, Wang X, Wang T, Xing J. Overexpression of BMP1 reflects poor prognosis in clear cell renal cell carcinoma. Cancer Gene Ther. 2019. doi:10.1038/s41417-019-0107-9
47. Zuo Z, Ye F, Liu Z, Huang J, Gong Y. MicroRNA-153 inhibits cell proliferation, migration, invasion and epithelial-mesenchymal transition in breast cancer via direct targeting of RUNX2. Exp Ther Med. 2019;17(6):4693–4702. doi:10.3892/etm.2019.7470
48. Lu H, Clauser KR, Tam WL, et al. A breast cancer stem cell niche supported by juxtacrine signalling from monocytes and macrophages. Nat Cell Biol. 2014;16(11):1105–1117. doi:10.1038/ncb3041
49. Wen G, Partridge MA, Li B, et al. TGFBI expression reduces in vitro and in vivo metastatic potential of lung and breast tumor cells. Cancer Lett. 2011;308(1):23–32. doi:10.1016/j.canlet.2011.04.010
50. Li B, Wen G, Zhao Y, Tong J, Hei TK. The role of TGFBI in mesothelioma and breast cancer: association with tumor suppression. BMC Cancer. 2012;12:239. doi:10.1186/1471-2407-12-239
 © 2020 The Author(s). This work is published and licensed by Dove Medical Press Limited. The full terms of this license are available at https://www.dovepress.com/terms.php and incorporate the Creative Commons Attribution - Non Commercial (unported, v3.0) License.
By accessing the work you hereby accept the Terms. Non-commercial uses of the work are permitted without any further permission from Dove Medical Press Limited, provided the work is properly attributed. For permission for commercial use of this work, please see paragraphs 4.2 and 5 of our Terms.
© 2020 The Author(s). This work is published and licensed by Dove Medical Press Limited. The full terms of this license are available at https://www.dovepress.com/terms.php and incorporate the Creative Commons Attribution - Non Commercial (unported, v3.0) License.
By accessing the work you hereby accept the Terms. Non-commercial uses of the work are permitted without any further permission from Dove Medical Press Limited, provided the work is properly attributed. For permission for commercial use of this work, please see paragraphs 4.2 and 5 of our Terms.