")
Back to Journals » Journal of Hepatocellular Carcinoma » Volume 9
The Clinical Relevance and Immune Correlation of SLC10 Family Genes in Liver Cancer
Authors Tian S, Li J, Xiang J, Peng P
Received 18 October 2022
Accepted for publication 15 December 2022
Published 30 December 2022 Volume 2022:9 Pages 1415—1431
DOI https://doi.org/10.2147/JHC.S392586
Checked for plagiarism Yes
Review by Single anonymous peer review
Peer reviewer comments 2
Editor who approved publication: Prof. Dr. Imam Waked
Shan Tian,1,* Jiao Li,2,* Jiankang Xiang,2 Pailan Peng3
1Department of Infectious Diseases, Union Hospital, Tongji Medical College, Huazhong University of Science and Technology, Wuhan, People’s Republic of China; 2Department of Gastroenterology, Renmin Hospital of Wuhan University, Wuhan, People’s Republic of China; 3Department of Gastroenterology, The Affiliated Hospital of Guizhou Medical University, Guiyang, People’s Republic of China
*These authors contributed equally to this work
Correspondence: Pailan Peng, Department of Gastroenterology, The Affiliated Hospital of Guizhou Medical University, No. 28 Guiyi Street, Guiyang, 550000, People’s Republic of China, Email [email protected]
Background and Aim: This study was aimed to reveal the clinical relevance and immune correlation of the SLC10 family genes in liver cancer.
Methods: A comprehensive bioinformatics analysis was utilized to determine the gene expression, genetic alterations, DNA methylation, clinical significance, survival association and immune correlation of seven SLC10 family genes in liver cancer. The multiplexed immunohistochemical technique was applied to determine the association between SLC10A3 protein expression and immune cells, and the correlation between SLC10A3 protein and immune checkpoints (PD1 and PD-L1) in a cohort of 32 individuals with liver cancer.
Results: The expression of SLC10 family genes was different between normal liver tissues and malignant liver tissues. SLC10A5 showed the highest alteration rate (8%), followed by SLC10A3 (2.8%). Low expression of SLC10A1 was indicative of poor tumor grade and advanced tumor stage in liver cancer. Scatter plots uncovered that expression of SLC10A3 was inversely associated with SLC10A1 and SLC10A5 expression in liver cancer. The expression of SLC10A1 and SLC10A5 was strongly associated with their DNA methylation. SLC10A1 expression was a reliable genetic biomarker for the prediction of survival outcomes in liver cancer population. Expression of SLC10 family genes was remarkably linked with the abundance of most immune infiltrating cells in liver cancer, and SLC10A3 was the most significant member. The multiplexed immunohistochemical technique confirmed that there existed the significant correlations between SLC10A3 protein expression and CD4 T cells, CD20 B cells and the close association with PD-1 in the stromal area from malignant tissues.
Conclusion: The expressions of SLC10 family genes were different between normal liver tissues and malignant liver tissues, and they were correlated with each other in liver cancer. SLC10A1 possesses the most significant correlation with survival outcomes. SLC10A3 exhibited the most significant relationship with immune cells, as revealed by bioinformatics analysis and multispectral imaging technique.
Keywords: the soluble carrier 10 family genes, liver cancer, immune correlation, multispectral imaging, prognostic biomarker
Introduction
Liver cancer is acknowledged as the third leading cause of cancer-related death, and over 1 million cases will be diagnosed with this disease by 2025,1 causing a major threat to the medical system and being a social burden.2 Viral hepatitis, nonalcoholic fatty liver disease, alcoholic liver disease and metabolic syndrome are the most common risk factors for liver cancer, and Asia has the highest incidence rate of liver cancer.3 Liver resection is the only curative treatment for individuals with liver cancer, and laparoscopic hepatectomy gradually becomes the widespread therapy among patients with liver cancer.4 However, this approach is only suitable for patients in the early-stage disease, which accounts for a small proportion of patients with liver cancer. The overall survival outcome of individuals with liver cancer is not optimistic with a 5-year survival rate of less than 20%.5 Hence, identification of reliable genetic biomarkers for the accurate prediction of prognosis for liver cancer individuals is quite imperative.
The soluble carrier (SLC) family occupies an essential role in cell metabolism via the transport of bile acid.6 Moreover, SLC10 is also responsible for influx transporters of steroidal hormones, specific agents, and comprised of seven family members, including SLC10A1, SLC10A2, SLC10A3, SLC10A4, SLC10A5, SLC10A6 and SLC10A7.7 A recent study uncovers that SLC10A1 is a promising target for drug design for patients infected with hepatitis B virus (HBV).8 Chen et al9 reported that genetic variants of SLC10A1 are not correlated with the risk of HBV infection or viral clearance. Moreover, SLC10A2 expression is reported to be an independent survival factor among patients with colorectal cancer10 and renal cancer.11 No study has specifically explored the prognostic role of SLC10A2 in liver cancer. Moreover, the clinical and immune correlations of SLC10 family genes in liver cancer remain unknown.
Under the microscopy, liver cancer tissues display a dense tumor cells mixed with infiltrated immune cells, and tumor-related immune cells can serve as a promising target for treating liver cancer.5 There is evidence that the immune response to solid tumors has a vital effect on the course of tumor progression even without any immunotherapy.12 A low density of CD8+ T cells is linked to survival outcomes in liver cancer. Thus, the immune microenvironment of liver cancer may have significant implications for survival assessment and therapeutic choice. Wen et al13 demonstrated that SLC10A2 is a survival gene that is closely associated with immune cells in colorectal cancer. However, whether SLC10A2 is also an immune related gene in liver cancer is largely unknown to us.
In the present study, we initially characterized the gene alterations and clinical relevance of seven SLC10 family genes in liver cancer. Then, we also analyzed the methylation profiles and survival significance of seven SLC10 family genes in liver cancer. Subsequently, we explored the potential correlation between SLC10 family genes and immune cells in liver cancer. Due to close association between SLC10A3 and immune cells, we applied multispectral imaging assay to further validate this association in a cohort of 32 liver cancer individuals. A systematic understanding of the clinical relevance and immune correlation of SLC10 family genes in liver cancer is necessary to identify the potential therapeutic targets against liver cancer.
Methods
Genetic Alteration, Genes Expression and Enrichment Analysis
We applied cBioPortal database (https://www.cbioportal.org/) to investigate the genetic alterations of SLC10 family genes based on TCGA-LIHC dataset. We entered the names of seven SLC10 family genes in cBioPortal research box and then selected the module of Oncoprint to determine the genetic alteration rates and mutation types of seven SLC10 family genes in liver cancer. We selected the module of Gene Expression Comparison. For the verification of the differential expressions, we also searched HCDDB database (http://lifeome.net/database/hccdb/search.html) which contains some liver cancer datasets from GEO. We entered the names of seven SLC10 family genes in HCDDB database and then selected the Go module. We used clusterProfiler package (R software, version 3.14.3) to identify the biological pathways of the co-expressed genes related to SLC10 family genes in liver cancer.
Methylation Profiles and Survival Analysis
We searched the UCXC Xena database (http://xena.ucsc.edu/) to download the methylation and gene expression data of seven SLC10 family genes in liver cancer via Launch Xena module. We also browsed the UALAN website (http://ualcan.path.uab.edu/index.html) to compare the methylation levels of seven SLC10 family genes between normal liver specimens and malignant liver tissues. We selected the module of Methylation under the part of TCGA in UALAN website.
As for survival analysis, we initially utilized the Kaplan–Meier Plotter database (http://kmplot.com/analysis/). We selected the module of Liver Cancer and modified the parameter to “autoselect best cutoff”. All the patients with liver cancer were divided into low and high expression groups to generate survival curves. For the conformation of survival significance of seven SLC10 family genes in liver cancer, we also searched HCDDB database (http://lifeome.net/database/hccdb/search.html) which contains GSE14520 and IGGC data.
Immune Correlation Analysis
We browsed TISIDB database (http://cis.hku.hk/TISIDB/index.php), which is an integrated web tool for tumor–immune system interaction. We entered the names of SLC10 family genes and then selected the module of Subtype, which included immune subtype and molecular subtype. In addition, we also explored the Tumor IMmune Estimation Resource (TIMER) database (https://cistrome.shinyapps.io/timer/) to ensure the potential correlations between SLC10 family genes and immune infiltration of all tumors in the TCGA-LIHC cohort. The abundances of six immune cells were calculated by TIMER algorithm, and we selected the Gene module to determine the relationship between the abundance of immune cells and SLC10 family genes in liver cancer. Correlation module was selected for the correlation analysis between SLC10A1 and PDCD1 along with CD274 in liver cancer. In particular, we utilized R software (version 3.6.3) to perform the ssGSEA via the GSVA package, which could directly exhibit the correlations between SLC10 family genes and many kinds of immune cells in liver cancer. In order to validate the relationship between SLC10 family gene expression and abundance of immune in liver cancer, we also utilized GSE25097 to perform ssGSEA via the GSVA package.
Multiplex Immunohistochemical Staining and Multispectral Imaging
A cohort of 32 cases of postoperative individuals with liver cancer from Renmin Hospital of Wuhan University was included in our validation section. All the participants experienced surgical removal, and we collected the formalin-fixed paraffin-embedded blocks from the department of pathology and then constructed a tissue microarray (TMA) for the subsequent seven-color immunohistochemical staining. Clinical information and pathological data of 32 cases of liver cancer individuals were abstracted from the medical records. All the liver cancer individuals gave their consents to take part in our clinical research, and this research outline was reviewed and approved by the clinical ethics research committee of Renmin Hospital of Wuhan University (No. WDRY-2019-K104). Our research was performed under the principles of the Declaration of Helsinki.
The TMA was deparaffinized and fixed with formaldehyde:methanol and then placed into antigen repair buffer for 20 min for antigen retrieval using a microwave. Each TMA was put through six rounds of staining, including a protein block (1% BSA), followed by primary antibody and the corresponding secondary antibody (Table 1). Each secondary antibody was conjugated to a different fluorophore using AlphaTSA Multiplex IHC kit (No. AXT37100031, Beijing, China). After six sequential reactions, the TMA was counterstained with DAPI for 15 min. After mounting, the TMA slide was scanned and then imaged for quantitative analysis using ZEN software (version 3.3).
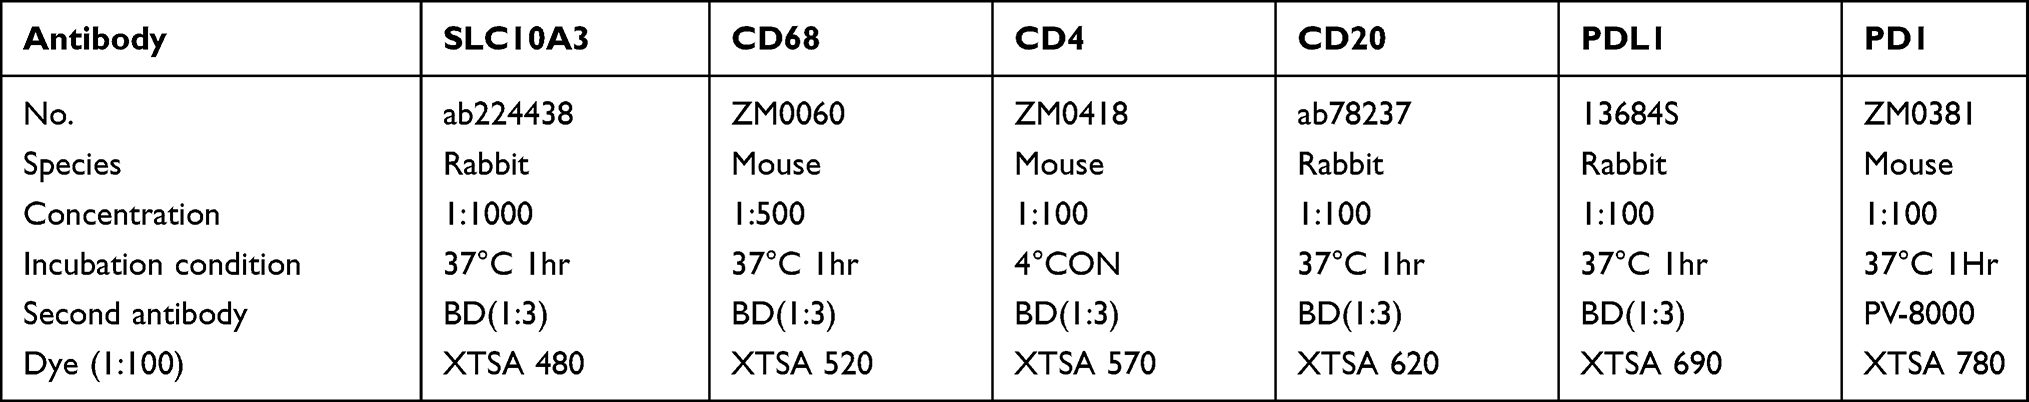 |
Table 1 The Detailed Information of the Primary and Second Antibodies in This Research |
Statistical Analysis
All the statistical tasks were finished by SPSS 20.0 in combination with GraphPad Prism (version 8.0). R software (3.6.3) and GraphPad Prism (version 8.0) was utilized to generate some figures. Expression levels of SLC10 family genes in malignant liver tissues and normal liver tissues were compared via t-test. Correlations among the seven SLC10 family genes (SLC10A1, SLC10A2, SLC10A3, SLC10A4, SLC10A5, SLC10A6, SLC10A7) were estimated by Spearman correlation analysis. Kaplan–Meier curves were used to investigate the survival time of liver cancer patients stratified based on low or high levels of the expressions of SLC10 family genes. A P value less than 0.05 was deemed as the significance threshold for statistical analyses.
Results
Gene Alterations and Expression Profiles of SLC10 Family Genes in Liver Cancer
We explored the gene alterations of SLC10 family genes in liver cancer via cBioPortal website. As listed in Figure 1A, SLC10A5 has the highest alteration rate (8%), followed by SLC10A3 (2.8%) and SLC10A2 (2.3%). Amplification type was the most common type of gene alteration among SLC10A2, SLC10A3, SLC10A4 and SLC10A5, while depletion was the most common type of gene alteration among SLC10A1, SLC10A6 and SLC10A7.
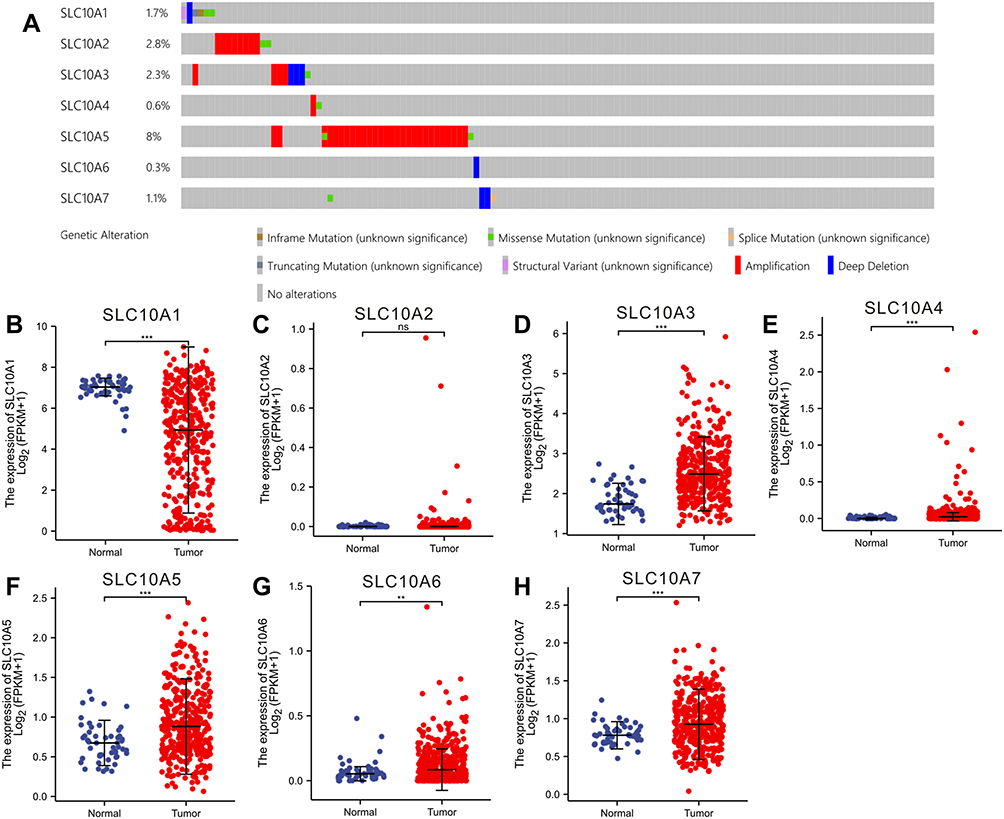 |
Figure 1 Gene alteration and expression profiles of SLC10 family genes in liver cancer. (A) Rates of genetic alteration of SLC10 family genes in live cancer based on TCGA-LIHC dataset. SLC10 family genes ((B) SLC10A1, (C) SLC10A2, (D) SLC10A3, (E) SLC10A4, (F) SLC105, (G) SLC10A6, (H) SLC10A7) were abnormally expressed between normal tissues and malignant liver tissues. **Stands for P<0.01, ***Stands for P<0.0001. Abbreviation: ns, no significance. |
Subsequently, we investigated the expression profiles of SLC10 family genes in normal tissues and malignant liver cancer (Figure 1B–H). Except for SLC10A2, other six members of SLC10 were abnormally expressed in HCC tissues. SLC10A1 was down-regulated in HCC specimens, but SLC10A3, SLC10A4, SLC10A5 and SLC10A6 were up-regulated in HCC tissues. For further verification of this conclusion, we also mined HCDDB database, which contains TCGA, GEO and IGGC data. Results from multiple datasets were almost consistent with the above conclusion (Figure S1). Collectively, expressions of SLC10 family genes were different between normal liver tissues and malignant tissues.
Clinical Relevance and Association of SLC10 Family Genes
We downloaded the original expression data of SLC10 family genes, along with clinical data, to reveal the clinical relevance of SLC10 family genes in liver cancer (Figure S2). Statistical analyses using one-way ANOVA revealed that the expression levels of SLC10A1, SLC10A3, and SLC10A6 were significantly different between groups with different tumor grades. As for TNM stage, statistical analyses using one-way ANOVA showed that the expression of SLC10A1, SLC10A3, SLC10A5, and SLC10A6 was significantly different between groups with different tumor stages. In summary, low SLC10A1 expression was indicative of poor tumor grade and advanced tumor stage in liver cancer.
Subsequently, we employed Spearman analysis to quantitatively measure the correlations between the seven SLC10 family genes in liver cancer, and we found that most genes were correlated with each other (Figure 2A). Scatter plots uncover that expression of SLC10A3 was inversely associated with SLC10A1 (r = −0.512, P < 0.001, Figure 2B) and SLC10A5 (r = −0.309, P < 0.001, Figure 2C) in liver cancer. Moreover, we also observed that SLC10A6 expression was positively correlated with SLC10A7 (r = 0.477, P < 0.001, Figure 2D).
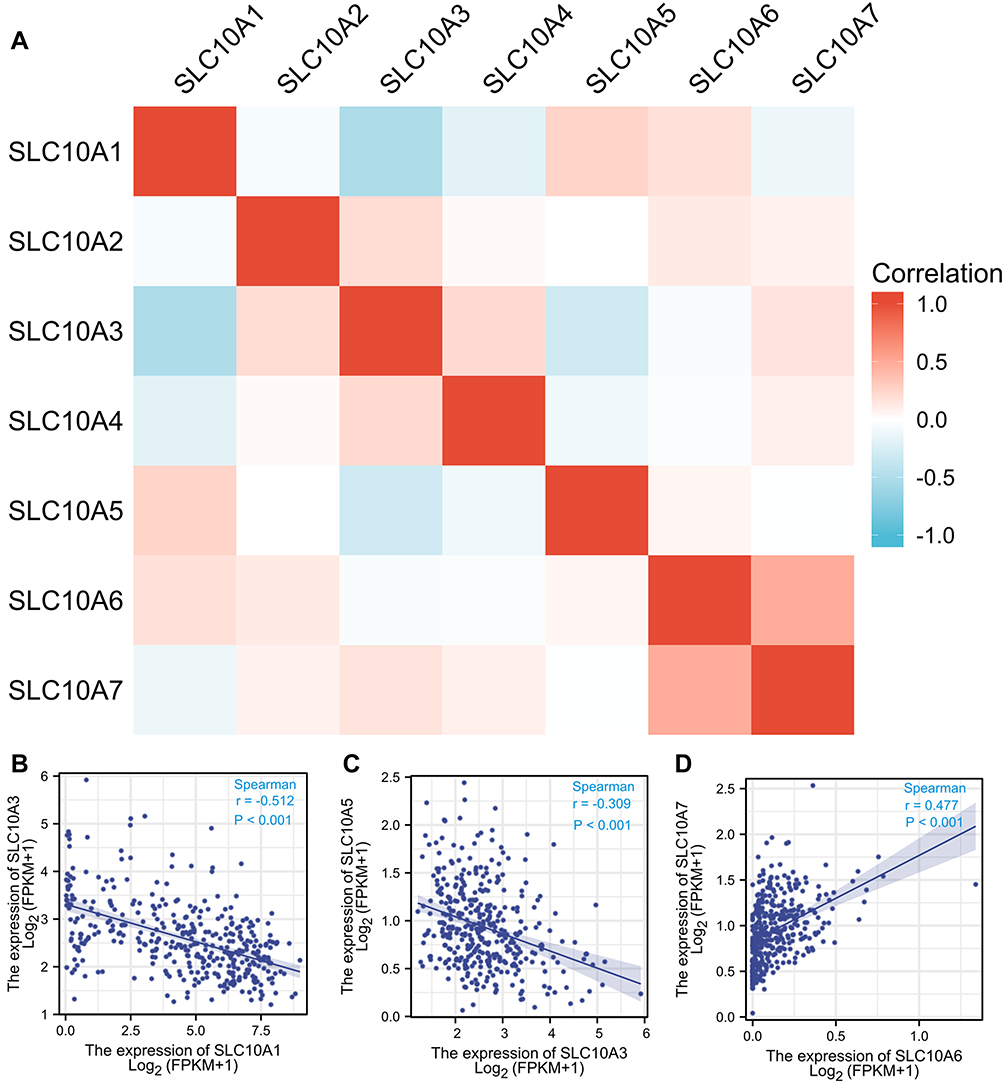 |
Figure 2 Correlation analysis of SLC10 family genes in liver cancer. Most members of SLC10 family genes were correlated with each other (A). Expression of SLC10A3 was reversely associated with SLC10A1 (B) and SLC10A5 (C). Expression of SLC10A6 was strongly correlated with SLC10A7 with a positive coefficient (D). |
Survival Analysis of SLC10 Family Genes in Liver Cancer
The prognostic values of SLC10 family genes in liver cancer were explored using the Kaplan–Meier Plotter. As for overall survival (Figure 3A–N), we found that high expression of SLC10A1, SLC10A2, SLC10A4, SLC10A5, SLC10A6 and SLC10A7 was positively linked to favorable overall survival, while high expression of SLC10A3 was negatively correlated with favorable overall survival among patients with liver cancer. As for disease-free survival, we observed that high expression levels of SLC10A1, SLC10A2 and SLC10A6 were positively associated with superior disease-free survival, while this significant association disappeared in SLC10A3, SLC10A5 and SLC10A7. As the data from the Kaplan-Meier Plotter were mainly based on TCGA-LIHC dataset, we also mined the HCDDB database which contains the GSE14520 and IGGC datasets. As shown in Figure S3, we also found that patients with over-expression of SLC10A1 were correlated with longer overall survival time than those with low expression in GSE14520 (Figure S3A) and IGGC-LIHC datasets (Figure S3B). In conclusion, SLC10A1 expression was a reliable genetic biomarker for the prediction of survival outcomes in liver cancer population.
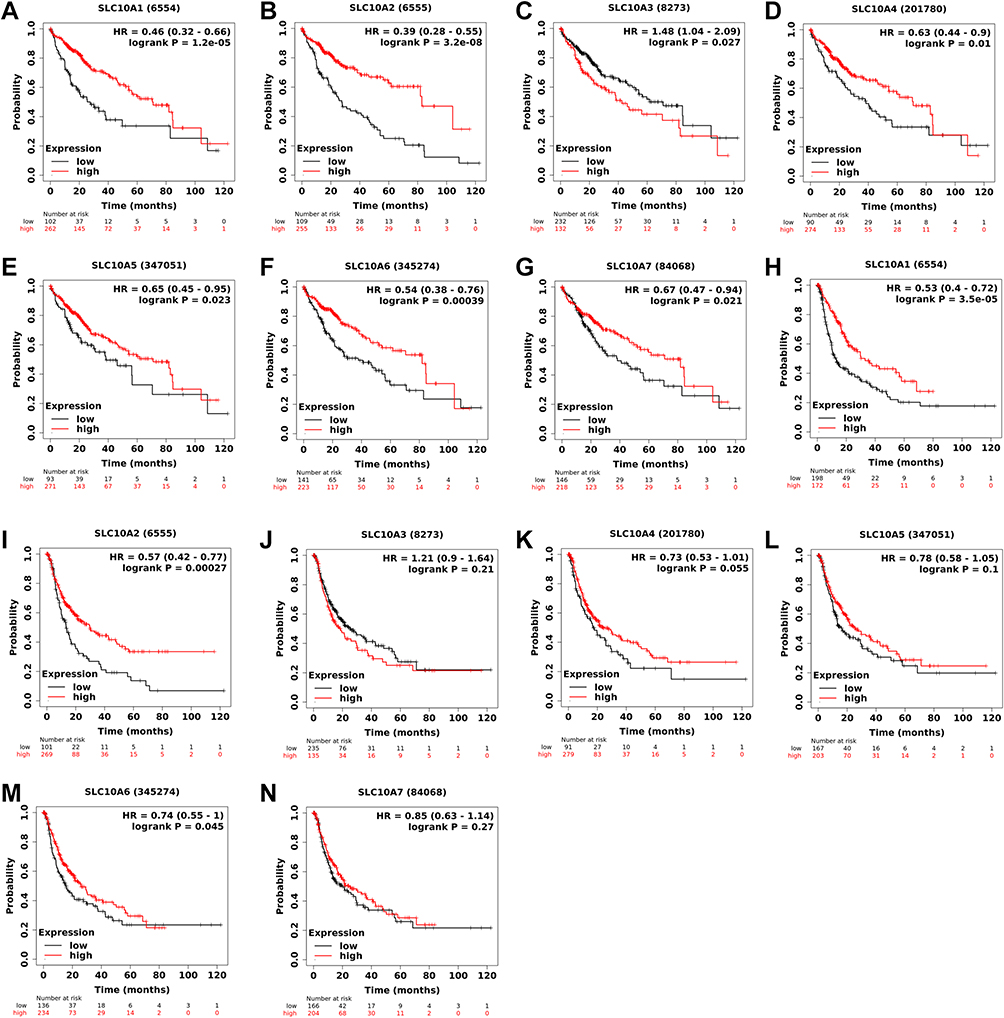 |
Figure 3 Survival curves of SLC10 family genes in liver cancer based on TCGA-LIHC dataset. Expressions of SLC10 family genes ((A) SLC10A1, (B) SLC10A2, (C) SLC10A3, (D) SLC10A4, (E) SLC10A5, (F) SLC10A6, (G) SLC10A7) were significantly associated with the overall survival among liver cancer people. Over-expressions of SLC10A1 (H), SLC10A2 (I) and SLC10A6 (J) were remarkably linked to the disease-free survival among liver cancer people, while expressions of SLC10A3 (K), SLC10A4 (L), SLC10A5 (M) and SLC10A7 (N) have no significant relationship with disease-free survival among liver cancer people. |
Methylation Status of SLC10 Family Genes in Liver Cancer
The UALCAN webpage was browsed to determine the methylation status of SCL10 family genes in liver cancer (Figure 4A–G). The methylation levels of SLC10A1, SLC10A4 and SLC10A7 were significantly higher in liver cancerous tissues than that in the corresponding normal tissues, while SLC10A2, SLC10A3, SLC10A5 and SLC10A6 showed the opposite results in liver cancer. Then, we downloaded the original sequencing data from UCSC Xena, and applied GraphPad Prism to draw the scatter figures. As displayed in the scatter plots (Figure 4H–N), the expression of SLC10A1 was strongly associated with its DNA methylation with an inverse coefficient (r = −0.7067, P < 0.0001), which could perfectly explain its low expression in liver cancer. We also observed that the expression of SLC10A5 was reversely correlated with its DNA methylation in liver cancer (r = −0.419, P < 0.0001).
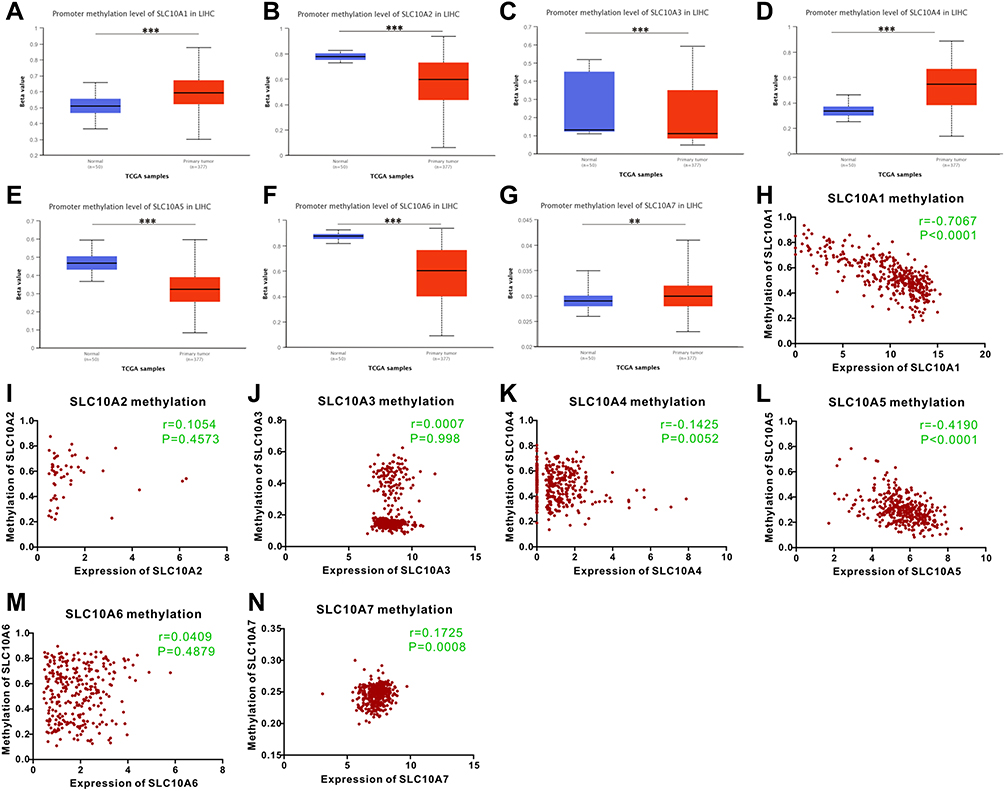 |
Figure 4 Methylation status of SLC10 family genes in liver cancer based on TCGA-LIHC dataset. Methylation levels of SLC10 family genes were significantly different between normal tissues and malignant liver tissues ((A) SLC10A1, (B) SLC10A2, (C) SLC10A3, (D) SLC10A4, (E) SLC10A5, (F) SLC10A6, (G) SLC10A7). The scatter plots of correlations between expression of SLC10 family genes and DNA methylation in liver cancer ((H) SLC10A1, (I) SLC10A2, (J) SLC10A3, (K) SLC10A4, (L) SLC10A5, (M) SLC10A6, (N) SLC10A7). **Stands for P<0.01, ***Stands for P<0.0001. |
Enrichment Analysis
In order to explore the biological signals of SLC10 family genes in liver cancer, we performed the enrichment analysis. As shown in Figure S4, we found that the SLC10 family genes are mainly involved in bile acid and bile salt transport, monocarboxylic acid transport, organic hydroxy compound transport, organic anion transport, lipid transport, lipid localization, sodium ion transport and heparin biosynthetic process. Other molecular function and cellular component of SLC10 family genes are also listed in Figure S4.
Immune Analysis of SLC10 Family Genes in Liver Cancer
First, we explored the role of SLC10 family genes in immune and molecular sub-types in liver cancer via the TISIDB website. Immune subtypes of liver cancer are generally divided into four typical types: C1 (wound healing), C2 (IFN-gamma dominant), C3 (inflammatory) and C4 (lymphocyte depleted). In liver cancer (Figure 5A–D), we noticed that the expression of SLC10A1, SLC10A3, SLC10A5 and SLC10A7 was remarkably different among four immune subtypes (C1, C2, C3, and C4). In particular, we only found that SLC10A3 mRNA was weakly expressed in C4 (lymphocyte depleted), which indicates that SLC10A3 was closely correlated to the abundance of lymphocytes in liver cancerous tissues. Then, we also determined the expressions of SLC10 family genes in the different molecular sub-types of liver cancer. Molecular subtypes of liver cancer are divided into three types: iCluster 1, iCluster 2 and iCluster 3. As listed in Figure 5E–H, the expression levels of SLC10A1, SLC10A3 and SLC10A5 were significantly different among the three molecular subtypes of liver cancer, whereas no statistical difference was regarding SLC10A7. Collectively, we concluded that the expressions of SLC10 family genes (SLC10A1, SLC10A3, and SLC10A5) were different molecular subtypes and immune subtypes of liver cancer.
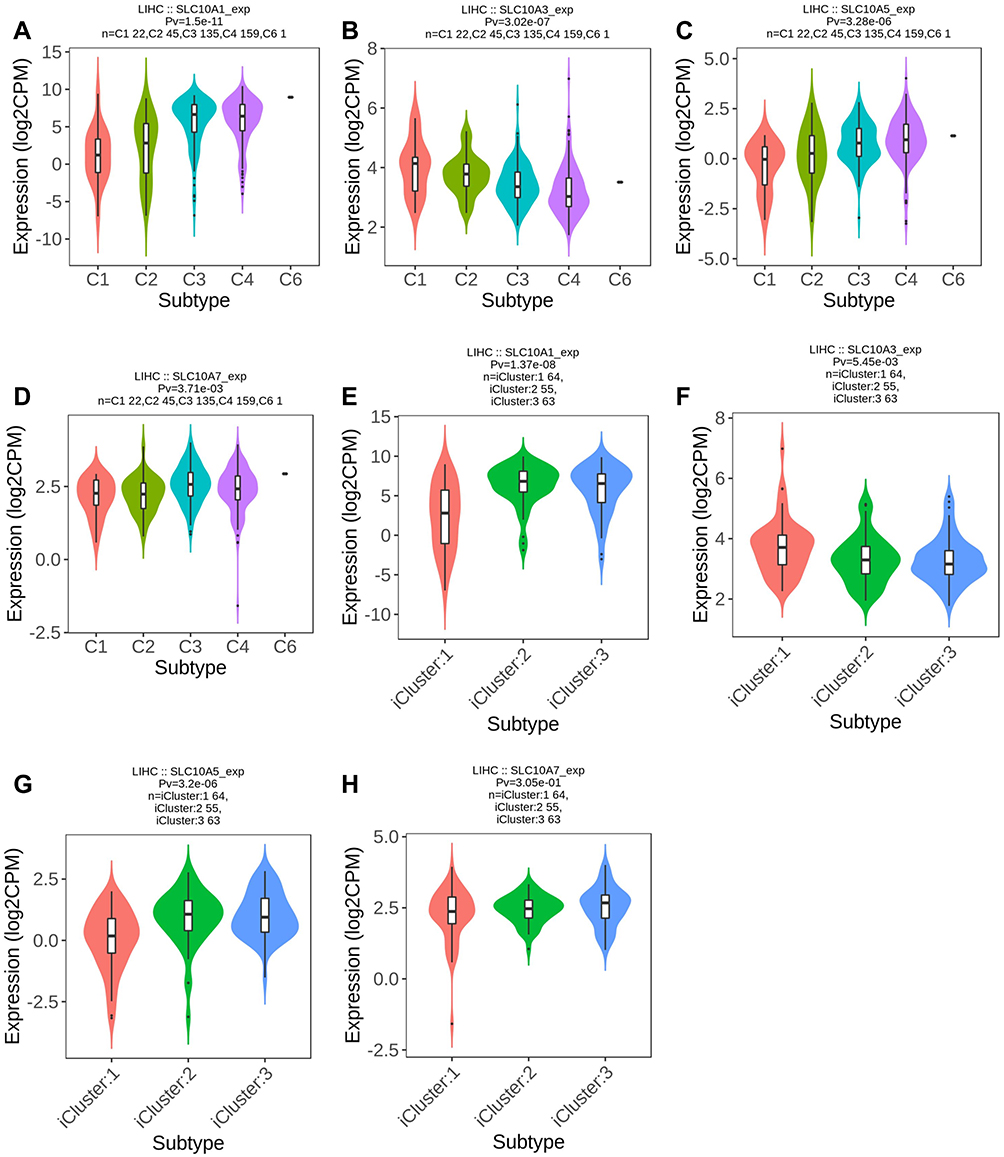 |
Figure 5 Expression of SLC10 family genes in liver cancer with different immune subtypes and molecular subtypes. Expression of SLC10A1 (A), SLC10A3 (B), SLC10A5 (C), SLC107 (D) is significantly different among five immune subtypes of liver cancer. Expression of SLC10A1 (E), SLC10A3 (F), SLC10A5 (G) is significantly different among three molecular subtypes of liver cancer, while expression of SLC10A7 (H) is not significantly different in three molecular subtypes of liver cancer. |
Next, we analyzed the correlations between the expression of SLC10 family genes and the abundance of common immune infiltrating cells in liver cancer, including CD4+ T cells, CD8+ T cells, B cells, dendritic cells, macrophages and neutrophils. From Figure S5A-G, expression of SLC10 family genes was significantly correlated with the abundance of six immune infiltrating cells except for SLC10A5. In particular, the correlation is the most significant for SLC10A3 (Figure S5C). Expression of SLC10A3 was strongly correlated with the abundance of CD4+ T cells (r = 0.452, P = 9.22e−19), dendritic cells (r = 0.46, P = 3.14e−19), macrophages (r = 0.54, P=3.01e−27) and neutrophils (r = 0.443, P = 4.85e−18), and moderately correlated with B cells (r = 0.384, P = 1.47e−13) and CD8+ T cells (r = 0.332, P = 2.87e−10). Owing to the close link between SLC10 family genes and immune infiltrating cells in liver cancer, we also applied ssGSEA to verify this relationship. As exhibited in Figure 6A–G, unlike the results from TIMER database, expression of SLC10A5 was negatively correlated with NK cells, macrophages and TFH but positively correlated with Th17 cells. As SLC10A3 is the most significant SLC10 family member associated with immune cells in liver cancer, we also compared the enrichment scores of the nine common immune cells based on the ssGSEA algorithm (Figure 7A–I) using the TCGA-LIHC dataset. Except for neutrophils, the enrichment scores of other immune cells were significantly different between the high and low SLC10A3 expression groups. We also validated the correlation using the GSE25097 dataset. As shown in the following heat map (Figure S6), we also found that the expression of SLC10A3 was positively correlated with most types of immune cells, while the correlation was not so significant for SLC10A5, which is almost consistent with the results from the TCGA-LIHC dataset. In conclusion, we can also conclude that expression of SLC10 family genes was remarkably linked with the abundance of most immune infiltrating cells in liver cancer.
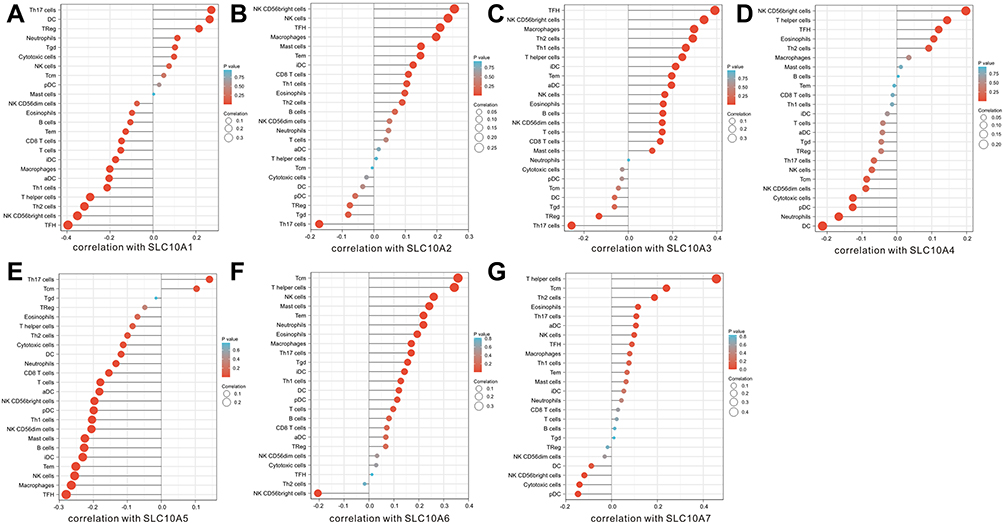 |
Figure 6 Correlation analyses of SLC10 family genes and 24 immune cells measured by ssGSEA in liver cancer. (A) SLC10A1, (B) SLC10A2, (C) SLC10A3, (D) SLC10A4, (E) SLC10A5, (F) SLC10A6, (G) SLC10A7. |
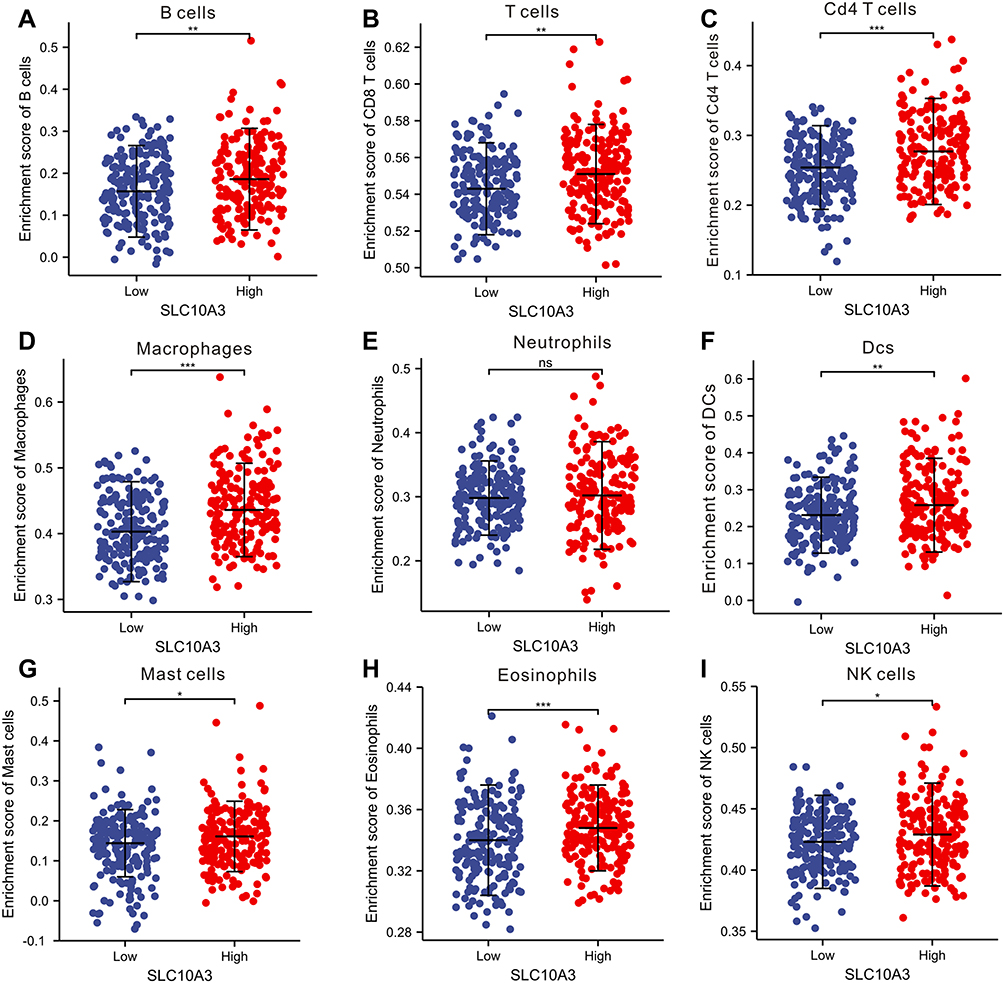 |
Figure 7 Comparison of enrichment score of nine immune cells between low and high SLC10A3 groups in HCC tissues based on the ssGSEA algorithm. (A) B cells. (B) CD8 T cells. (C) CD4+ T cells. (D) macrophages. (E) Neutrophils. (F) Dendritic cells. (G) Mast cells. (H) Eosinophils. (I) NK cells. *Stands for P<0.05, **Stands for P<0.01, ***Stands for P<0.0001. Abbreviation: ns, no significance. |
Immunotherapeutic approaches represented by immune checkpoint inhibitors (ICIs) have become more popular in the treatment of malignant tumors, including liver cancer.14 Correlation analyses were performed to calculate the correlations between SLC10 family genes and immune checkpoints (PD1 and PD-L1) in liver cancer. From the scatter plots (Figure 8A–N), we observed that the levels of PDCD1 (PD-1) were negatively correlated with SLC10A1 (r = −0.394, P = 3.11e−15) and SLC10A5 (r = −0.232, P = 6.41e−6), and positively associated with SLC10A3 (r = 0.416, P = 1e−16). In contrast, the expression of CD274 (PD-L1) was positively correlated with SLC10A3 (r = 0.315, P = 5.71e−10), SLC10A6 (r = 0.425, P = 1.08e−17) and SLC10A7 (r = 0.432, P = 2.84e−18). In brief, SLC10A3 was not only positively correlated with CD274 in liver cancer but also positively associated with PDCD1.
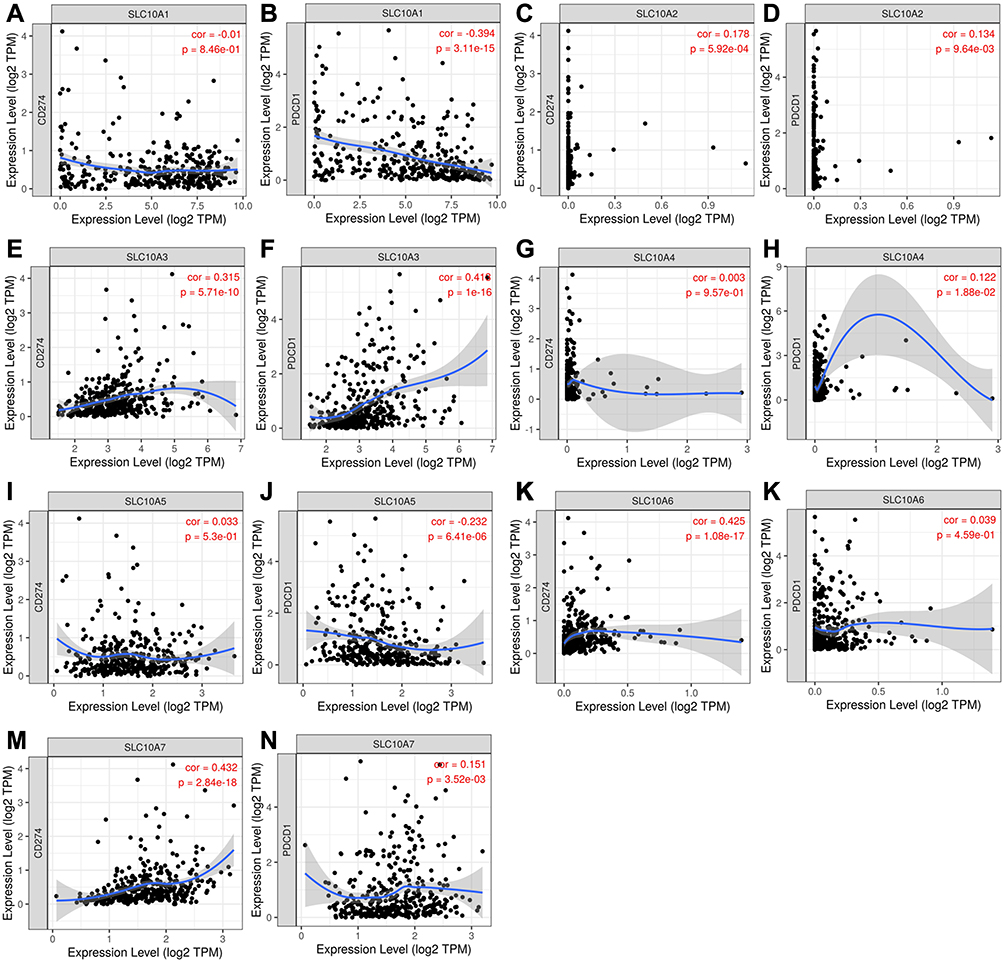 |
Figure 8 Correlation analyses of SLC10 family genes and immune checkpoints (PD1 and PD-L1) measured by TIMER algorithm in liver cancer. (A) Correlation between CD274 and SLC10A1. (B) Correlation between PDCD1 and SLC10A1. (C) Correlation between CD274 and SLC10A2. (D) Correlation between PDCD1 and SLC10A2. (E) Correlation between CD274 and SLC10A3. (F) Correlation between PDCD1 and SLC10A3. (G) Correlation between CD274 and SLC10A4. (H) Correlation between PDCD1 and SLC10A4. (I) Correlation between CD274 and SLC10A5. (J) Correlation between PDCD1 and SLC10A5. (K) Correlation between CD274 and SLC10A6. (L) Correlation between PDCD1 and SLC10A6. (M) Correlation between CD274 and SLC10A7. (N) Correlation between PDCD1 and SLC10A7. |
Results of Multispectral Imaging Analysis
We collected the tissues from 32 patients with liver cancer who underwent surgical removal of the tumor at the Renmin hospital of Wuhan University, and then we constructed the TMA containing 32 cases of malignant tissues and 32 paracancerous tissues. A total of seven markers (SLC10A3, CD4, CD20, CD68, DAPI, PD-1 and PD-L1) were selected for the multiple staining, and the four markers (CD4, CD20, CD68 and DAPI) corresponded to CD4 T cells, CD20 B cells, macrophage and nuclei. The single-marker images and merged pictures from the malignant tissues are displayed in Figure 9A–J, and those from the para-cancerous tissues are shown in Figure S7A-J. We quantified the levels of six markers ((SLC10A3, CD4, CD20, CD68, PD-1 and PD-L1)) in each tissues from the total area, tumor area and stromal area, including percentage of positive cells, cell density and average cell intensity. As shown in Figure 10, the percentage of positive cells, cell density and average cell intensity were higher in HCC tissues than in normal tissues not only in the total area but also in the tumor area and stromal area.
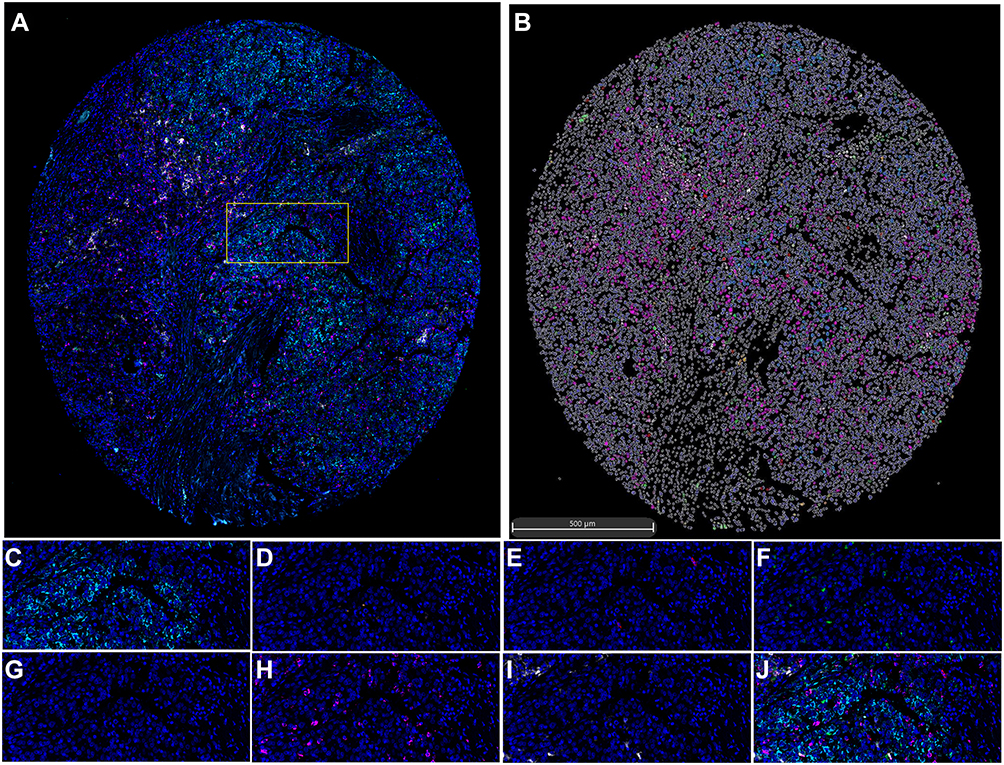 |
Figure 9 Seven-colour multiplex analysis of human malignant liver tissues. (A) Representative image showing the same TMA core after multispectral imaging. (B) Cell phenotype map defined by the seven markers in the multiplex staining. (C-I) Each of the individual markers in the composite image after spectral unmixing ((C) SLC10A3, (D) CD4, (E) CD20, (F) CD68, (G) DAPI, (H) PD-1, (I) PD-L1). (J) The merged picture of seven markers after multispectral imaging. (A) Is the entire view of one case of malignant liver tissue, and the yellow box is the random area for magnified view, which is corresponding to (C–J) with different markers. |
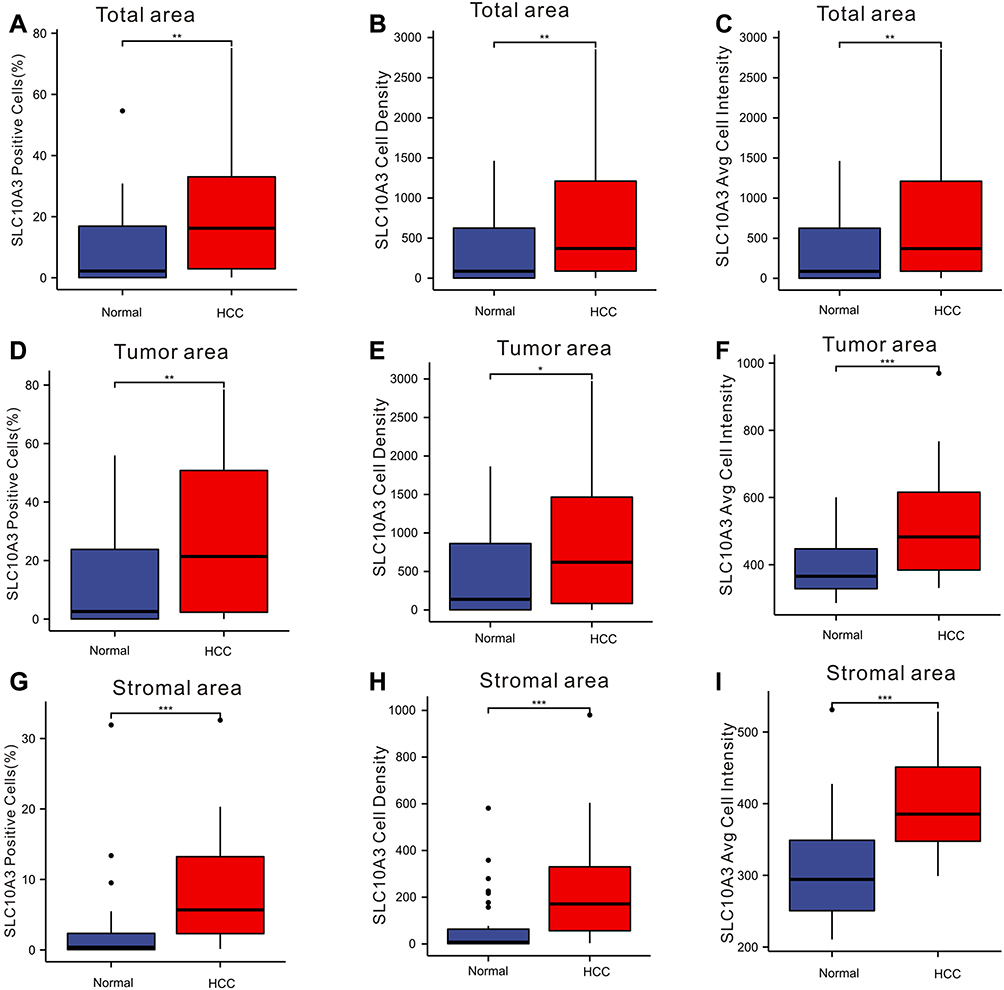 |
Figure 10 Comparison of expression of SLC10A3 at the protein level between normal liver tissues and HCC tissues. (A) total SLC10A3 positive cells (%), (B) total SLC10A3 cell density, (C) total SLC10A3 average cell intensity, (D) tumor SLC10A3 positive cells (%), (E) tumor SLC10A3 cell density, (F) tumor SLC10A3 average cell intensity, (G) stromal SLC10A3 positive cells (%), (H) stromal SLC10A3 cell density, (I) stromal SLC10A3 average cell intensity. *Stands for P<0.05, **Stands for P<0.01, ***Stands for P<0.0001. Note: The small plots stand for outliers. |
Finally, we employed the Spearman correlation analysis to quantify the correlation between SLC10A3 protein and immune cells (CD4 T cells, CD20 B cells, macrophages). As for total area and tumor area from malignant tissues, although we found some weak relationship between them, the relationships were of no statistical significance (Table 2). For stromal areas in malignant tissues, we observed significant correlations between SLC10A3 protein expression and infiltration levels of CD4 T cells, CD20 B cells, macrophages in terms of cell density, average cell intensity and percentage of positive cells (Table 2), which was consistent with the transcription results from the TCGA-LIHC dataset. Furthermore, we quantified the potential relationship between SLC10A3 protein expression and PD-1 and PD-L1 expression both in the malignant tissues and normal tissues. As PD-1 and PD-L1 are mostly expressed in the stromal tissues, we noticed that SLC10A3 protein expression was positively correlated with the density of PD-1 protein in malignant tissues (Table 2). In summary, the multiplexed immunohistochemical assay basically validated the immune correlation of SLC10A3 in liver cancer.
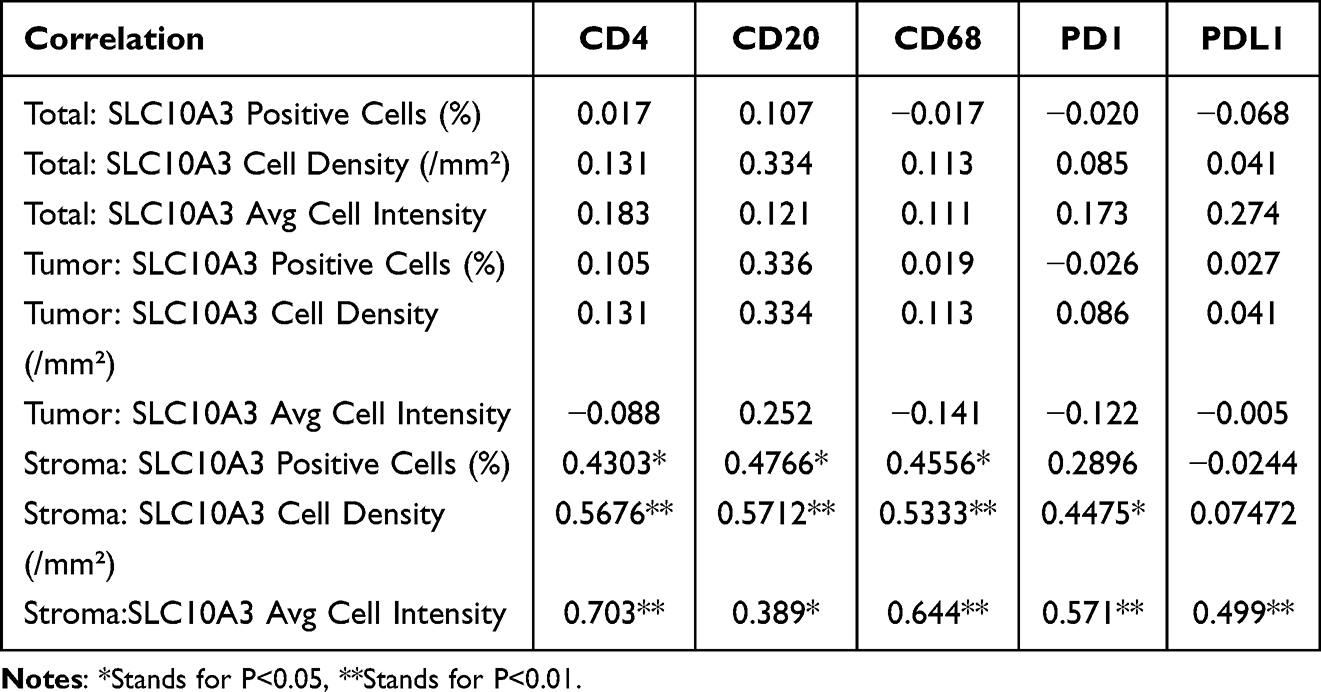 |
Table 2 Correlation Analysis of SLCA3 Expression with Common Immune Related Markers in Malignant Liver Tissues |
Discussion
Liver cancer is a malignant tumor with great heterogeneity resulting from the accumulation of genetic alterations and epigenetic reprogramming,15,16 and a better understanding of its occurrence and progression at a genetic level is important for the identification of ideal therapeutic targets. The expression of certain transporters in liver cancer and their functions in the uptake of small-molecule metabolites into cells make them promising targets for therapeutic agents in liver cancer.17 SLC10 family genes encode for transporters; however, their functions in liver cancer have not been reported. To our knowledge, this study is the first to uncover the clinical and immune relevance of the SLC10 family genes in liver cancer. Low expression of SLC10A1 is indicative of poor tumor grade and advanced tumor stage in liver cancer. SLC10A1 expression exhibited the most significant correlation with survival outcomes in patients with liver cancer. SLC10A1 and SLC10A5 expression were inversely correlated with the DNA methylation in liver cancer. In addition, we noticed that the SLC10 family genes were correlated with each other.
SLC10A1 is a transporter of Na+-bile acid, which plays a key role in the hepatic uptake of bile acids.18 Binh et al19 reported that the NTCP S267F variant of SLC10A1 displays protective effects against HBV infection, which is correlated with a reduced risk of liver cirrhosis or even liver cancer. However, fewer studies have demonstrated the clinical relevance and prognostic role of SLC10A1 in liver cancer. Our collective analysis showed that the expression of SLC10A1 transcription was inversely correlated with tumor grade and negatively associated with TNM stage in liver cancer. Further survival analyses uncover that increased expression of SLC10A1 transcription predicts relatively favorable survival outcomes in liver cancer patients not only in the TCGA-LIHC dataset but also in the GSE14520 and IGGC-LIHC datasets. Hence, family gene analysis identifies SLC10A1 as a potential suppressor gene in liver cancer.
Immune cells in cancer tissues are usually investigated by pathologists via immunohistochemical staining. The results of semi-quantitative assessment are the crude estimations of immune cell counts in tissues, and different immune cells must be stained in consecutive tissue sections, which is very inconvenient, and highly dependent on the pathologist’s experience. The multispectral imaging method, based on one TMA section, provides accurate localization and quantification of immune cells in cancerous tissues and their normal specimens.20 The application of the multispectral imaging technique in our analysis not only provided us with the distribution and quantification of immune cells in liver cancer but also successfully verified the correlations between SLC10A3 expression and immune cells, which offers clinical references in the era of immunotherapy. Carstens et al21 used this technology to enhance our knowledge of how specific stromal composition in pancreatic cancer affects T-cell activity. Mezheyeuski et al22 adopted this method to uncover the distinct immune profiles in lung cancer tissues. As far as concern, this is the first clinical report to validate the immune correlation of certain oncogene in liver cancerous tissues via multispectral imaging technique. The multispectral imaging technique could not only quantify multiple protein in tumor tissues but also in stromal tissues from via cell density and percentage of positive cell, which was perfectly suitable for the validation of tumor immune microenvironment. Our study provides the important reference for the clinical validation of immune correlation in cancerous tissues.
As for immune correlation, expression of SLC10A7 exhibited strong correlation with T helper cells, and SLC10A6 displayed strong association with TCM in liver cancer. Moreover, SLC10A3 showed close relationship with most immune cells in liver cancer, which is consistent with the immune association from TIMER database. The close association between SLC10A3 expression and immune sub-types, molecular subtypes of liver cancer, makes SLC10A3 a promising immune biomarker in liver cancer. As mentioned above, it is not easy to simultaneously validate the correlations of SLC10A3 with several types of immune cells in a TMA. We used the seven-color immunohistochemical multiplex to label different immune cells, and we also found that expression of SLC10A3 protein was also correlated with stromal CD4 T cells, CD20 B cells and macrophages on the protein levels in the TMA slide, and this correlation was more apparent in liver cancerous tissues than that in normal liver tissues. Collectively, our analysis reveals that SLC10A3 exhibits the most significant relationships with immune cells, which indicates that SLC10A3 might play a critical role in the regulation of immune response in liver cancer.
Knowledge obtained from substantial translational researches highlights the importance of targeting the tumor microenvironment in liver cancer to improve the efficacy of immunotherapy.23,24 At the genetic level, SLC10A3 expression was closely correlated with PDCD1 (PD-1) and CD274 (PD-L1) expression. As mentioned above, the multiplexed immunohistochemical technique is an appropriate method to investigate the tumor microenvironment, which can comprehensively assess the composition and distribution of target proteins and immune cells in the TME. We used this technique to validate whether a close association existed at the protein level. We found that SLC10A3 protein in stromal cells was significantly correlated with PD1 in malignant tissues, and co-expression indicated that liver cancer individuals with high expression of SLC10A3 protein in stromal tissues might be suitable for PD-1 immunotherapy. In summary, our findings indicated that SLC10A3 may play a role in the regulation of immunotherapy in liver cancer.
Our study was based on the comprehensive bioinformatic and multispectral imaging, but several unavoidable limitations exist in our analysis. Our analysis attempted to reveal the prognostic significance and immune relevance of SLC10 family genes in liver cancer, so we only used multispectral imaging to verify the immune correlation of SLC10A3. We did not confirm the immune association of other SLC10 family members in TMA via multispectral imaging due to their weak relationship with immune cells. Although we assess the correlations between SLC10 family members and immune cells both on the genetic and protein levels, we could not investigate the predictive abilities of them for immunotherapy. Finally, our experimental results are mainly based on a relatively small cohort of 32 patients with liver cancer, so our conclusions should be explained with caution, and should be further validated in multi-center studies with sufficient participants.
Conclusion
This is the first research to reveal the clinical relevance and immune association of SLC10 family genes in liver cancer. The members of SLC10 family genes are correlated with each other. SLC10A3 exhibited the most significant relationship with immune cells revealed by bioinformatic and multispectral imaging, indicating that SLC10A3 might play a critical role in the regulation of immune response in liver cancer.
Data Sharing Statement
The datasets and original data used and/or analyzed during the current study are available from the corresponding authors on reasonable request.
Ethics Statement
Our study plan was reviewed and approved by the Ethics Committee of Renmin Hospital of Wuhan University (No. WDRY-2019-K104).
Acknowledgment
We thank Yun Jia and her team from Alpha X Biotech (Beijing) Co., Ltd (Beijing, China) for the support of multiplexed immunohistochemical technique along with multispectral imaging assay.
Funding
This study was supported by the National Natural Science Foundation of China (Nos.82060541), Guizhou Health Committee (gzwjkj2020-1-037) and the Independent Research Project of Wuhan University (No.413000342).
Disclosure
All authors report no conflicts of interest in this research.
References
1. Llovet JM, Kelley RK, Villanueva A, et al. Hepatocellular carcinoma. Nat Rev Dis Primers. 2021;7(1):6. doi:10.1038/s41572-020-00240-3
2. Wang C, Cao Y, Yang C, Bernards R, Qin W. Exploring liver cancer biology through functional genetic screens. Nat Rev Gastroenterol Hepatol. 2021;18(10):690–704. doi:10.1038/s41575-021-00465-x
3. Konyn P, Ahmed A, Kim D. Current epidemiology in hepatocellular carcinoma. Expert Rev Gastroenterol Hepatol. 2021;15(11):1295–1307. doi:10.1080/17474124.2021.1991792
4. Galle PR, Forner A, Llovet JM, et al. EASL clinical practice guidelines: management of hepatocellular carcinoma. J Hepatol. 2018;69(1):182–236. doi:10.1016/j.jhep.2018.03.019
5. Pham L, Kyritsi K, Zhou T, et al. The functional roles of immune cells in primary liver cancer. Am J Pathol. 2022;192(6):826–836. doi:10.1016/j.ajpath.2022.02.004
6. Hediger MA, Romero MF, Peng JB, Rolfs A, Takanaga H, Bruford EA. The ABCs of solute carriers: physiological, pathological and therapeutic implications of human membrane transport proteinsIntroduction. Pflugers Arch. 2004;447(5):465–468. doi:10.1007/s00424-003-1192-y
7. Noppes S, Muller SF, Bennien J, et al. Homo- and heterodimerization is a common feature of the solute carrier family SLC10 members. Biol Chem. 2019;400(10):1371–1384. doi:10.1515/hsz-2019-0148
8. Zakrzewicz D, Geyer J. Multitasking Na+/Taurocholate cotransporting polypeptide (NTCP) as a drug target for HBV infection: from protein engineering to drug discovery. Biomedicines. 2022;10(1):196. doi:10.3390/biomedicines10010196
9. Chen X, Wang Y, Chen X, et al. Genetic variants in the regulatory region of SLC10A1 are not associated with the risk of hepatitis B virus infection and clearance. Infect Genet Evol. 2016;44:495–500. doi:10.1016/j.meegid.2016.07.043
10. Sun YL, Zhang Y, Guo YC, Yang ZH, Xu YC. A prognostic model based on the immune-related genes in colon adenocarcinoma. Int J Med Sci. 2020;17(13):1879–1896. doi:10.7150/ijms.45813
11. Fangning W, Chunguang M, Hailiang Z, et al. Identification and validation of soluble carrier family expression signature for predicting poor outcome of renal cell carcinoma. J Cancer. 2017;8(11):2010–2017. doi:10.7150/jca.18257
12. Schmidt M, Hellwig B, Hammad S, et al. A comprehensive analysis of human gene expression profiles identifies stromal immunoglobulin kappa C as a compatible prognostic marker in human solid tumors. Clin Cancer Res. 2012;18(9):2695–2703. doi:10.1158/1078-0432.CCR-11-2210
13. Wen S, He L, Zhong Z, Mi H, Liu F. Prognostic model of colorectal cancer constructed by eight immune-related genes. Front Mol Biosci. 2020;7:604252. doi:10.3389/fmolb.2020.604252
14. Heinrich S, Craig AJ, Ma L, Heinrich B, Greten TF, Wang XW. Understanding tumour cell heterogeneity and its implication for immunotherapy in liver cancer using single-cell analysis. J Hepatol. 2021;74(3):700–715. doi:10.1016/j.jhep.2020.11.036
15. Wheeler DA, Roberts LR. Comprehensive and integrative genomic characterization of hepatocellular carcinoma. Cell. 2017;169(7):1327–1341. doi:10.1016/j.cell.2017.05.046
16. Raggi C, Factor VM, Seo D, et al. Epigenetic reprogramming modulates malignant properties of human liver cancer. Hepatology. 2014;59(6):2251–2262. doi:10.1002/hep.27026
17. Zhang Y, Wang J. Targeting uptake transporters for cancer imaging and treatment. Acta Pharm Sin B. 2020;10(1):79–90. doi:10.1016/j.apsb.2019.12.005
18. Slijepcevic D, Roscam AR, Katafuchi T, et al. Hepatic uptake of conjugated bile acids is mediated by both sodium taurocholate cotransporting polypeptide and organic anion transporting polypeptides and modulated by intestinal sensing of plasma bile acid levels in mice. Hepatology. 2017;66(5):1631–1643. doi:10.1002/hep.29251
19. Binh MT, Hoan NX, Van Tong H, et al. NTCP S267F variant associates with decreased susceptibility to HBV and HDV infection and decelerated progression of related liver diseases. Int J Infect Dis. 2019;80:147–152. doi:10.1016/j.ijid.2019.01.038
20. Stack EC, Wang C, Roman KA, Hoyt CC. Multiplexed immunohistochemistry, imaging, and quantitation: a review, with an assessment of tyramide signal amplification, multispectral imaging and multiplexanalysis. Methods. 2014;70(1):46–58. doi:10.1016/j.ymeth.2014.08.016
21. Carstens JL, Correa DSP, Yang D, et al. Spatial computation of intratumoral T cells correlates with survival of patients with pancreatic cancer. Nat Commun. 2017;8:15095. doi:10.1038/ncomms15095
22. Mezheyeuski A, Bergsland CH, Backman M, et al. Multispectral imaging for quantitative and compartment-specific immune infiltrates reveals distinct immune profiles that classify lung cancer patients. J Pathol. 2018;244(4):421–431. doi:10.1002/path.5026
23. Feng GS, Hanley KL, Liang Y, Lin X. Improving the efficacy of liver cancer immunotherapy: the power of combined preclinical and clinical studies. Hepatology. 2021;73(Suppl 1):104–114. doi:10.1002/hep.31479
24. Yu J, Green MD, Li S, et al. Liver metastasis restrains immunotherapy efficacy via macrophage-mediated T cell elimination. Nat Med. 2021;27(1):152–164. doi:10.1038/s41591-020-1131-x
 © 2022 The Author(s). This work is published and licensed by Dove Medical Press Limited. The full terms of this license are available at https://www.dovepress.com/terms.php and incorporate the Creative Commons Attribution - Non Commercial (unported, v3.0) License.
By accessing the work you hereby accept the Terms. Non-commercial uses of the work are permitted without any further permission from Dove Medical Press Limited, provided the work is properly attributed. For permission for commercial use of this work, please see paragraphs 4.2 and 5 of our Terms.
© 2022 The Author(s). This work is published and licensed by Dove Medical Press Limited. The full terms of this license are available at https://www.dovepress.com/terms.php and incorporate the Creative Commons Attribution - Non Commercial (unported, v3.0) License.
By accessing the work you hereby accept the Terms. Non-commercial uses of the work are permitted without any further permission from Dove Medical Press Limited, provided the work is properly attributed. For permission for commercial use of this work, please see paragraphs 4.2 and 5 of our Terms.