Back to Journals » Neuropsychiatric Disease and Treatment » Volume 18
The Changes of Brain Function After Spinal Manipulation Therapy in Patients with Chronic Low Back Pain: A Rest BOLD fMRI Study
Authors Yang YC, Zeng K, Wang W, Gong ZG, Chen YL, Cheng JM, Zhang M, Huang YW, Men XB, Wang JW, Zhan S ![]() , Tan WL
, Tan WL ![]()
Received 16 September 2021
Accepted for publication 22 January 2022
Published 5 February 2022 Volume 2022:18 Pages 187—199
DOI https://doi.org/10.2147/NDT.S339762
Checked for plagiarism Yes
Review by Single anonymous peer review
Peer reviewer comments 2
Editor who approved publication: Dr Yu-Ping Ning
Yu-Chan Yang,1 Ke Zeng,2 Wei Wang,2 Zhi-Gang Gong,1 Yi-Lei Chen,1 Jian-Ming Cheng,1 Min Zhang,1 Yan-Wen Huang,1 Xin-Bo Men,2 Jian-Wei Wang,2 Songhua Zhan,1 Wen-Li Tan1
1Department of Radiology, Shuguang Hospital Affiliated to Shanghai University of Traditional Chinese Medicine, Shanghai, 201203, People’s Republic of China; 2Department of Massage, Shuguang Hospital Affiliated to Shanghai University of Traditional Chinese Medicine, Shanghai, 201203, People’s Republic of China
Correspondence: Songhua Zhan; Wen-Li Tan
Department of Radiology, Shuguang Hospital Affiliated to Shanghai University of Traditional Chinese Medicine, 528 Zhangheng Road, Pudong New Area, Shanghai, 201203, People’s Republic of China
, Email [email protected]; [email protected]
Objective: To investigate the changes of regional homogeneity (Reho) values before and after spinal manipulative therapy (SMT) in patients with chronic low back pain (CLBP) through rest blood-oxygen-level-dependent functional magnetic resonance imaging (BOLD fMRI).
Methods: Patients with CLBP (Group 1, n = 20) and healthy control subjects (Group 2, n = 20) were recruited. The fMRI was performed three times in Group 1 before SMT (time point 1, TP1), after the first SMT (time point 2, TP2), after the sixth SMT (time point 3, TP3), and for one time in Group 2, which received no intervention. The clinical scales were finished in Group 1 every time before fMRI was performed. The Reho values were compared among Group 1 at different time points, and between Group 1 and Group 2. The correlation between Reho values with the statistical differences and the clinical scale scores were calculated.
Results: The bilateral precuneus and right mid-frontal gyrus in Group 1 had different Reho values compared with Group 2 at TP1. The Reho values were increased in the left precuneus and decreased in the left superior frontal gyrus in Group 1 at TP2 compared with TP1. The Reho values were increased in the left postcentral gyrus and decreased in the left posterior cingulate cortex and the superior frontal gyrus in Group 1 at TP3 compared with TP1. The ReHo values of the left precuneus in Group 1 at TP1 were negatively correlated with the pain degree at TP1 and TP2 (r = − 0.549, − 0.453; p = 0.012, 0.045). The Reho values of the middle temporal gyrus in Group 1 at TP3 were negatively correlated with the changes of clinical scale scores between TP3 and TP1 (r = 0.454, 0.559; p = 0.044, 0.01).
Conclusion: Patients with CLBP showed abnormal brain function activity, which was altered after SMT. The Reho values of the left precuneus could predict the immediate analgesic effect of SMT.
Keywords: blood-oxygen-level-dependent functional magnetic resonance imaging, spinal manipulation therapy, chronic low back pain, regional homogeneity
Introduction
Pain is defined as a multidimensional distressing experience, which is composed of sensory, emotional, cognitive and social components associated with actual or potential tissue damage.1 Chronic pain constitutes an important part of pain, which refers to long-term pain lasting for more than 3 months, with at least one episode per week and unpleasant emotions.2 Chronic pain includes chronic low back pain (CLBP), bone and joint pain, chronic visceral pain et al. The prevalence, incidence, remission period, duration and mortality risk of low back pain were systematically evaluated in a global disease burden study.3 CLBP was the primary cause of disability and the sixth leading disease in terms of overall economical burden. It has been shown that physical therapy, such as spinal manipulation therapy (SMT), was suitable to CLBP.4 SMT has shown good analgesic effect,5 is easy to implement, and free from the risk of addiction unlike drugs; hence, SMT is widely used in the clinical environment. The mechanism research on the effects in SMT is mostly focused on the peripheral nerve, regional reaction or biomechanical effect,6 and the central neural antalgic effect has been paid attention, due to the abnormal coding of central neurons and the central attributes in patients with CLBP.7 SMT acts on the spinal areas, the peripheral nervous system accepts the input signals and the upstream and downstream facilitators and inhibition pathways initiate to alleviate the pain.8 Therefore, manipulation analgesia should not only eliminate the pain but more importantly interfere with the occurrence of the pain.9 Recently, multiple brain imaging studies investigated brain structural and functional changes in relation to CLBP. According to a systematic review, compared with healthy controls, CLBP patients showed characteristic features in the sensorimotor system, attention network, default mode network, and pain regulation network, such as changes in the structure and function of the pain regulation system.10 The formation of pain is related to the coding of central neurons. This conduction process begins in the spinal cord, continues to multiple structures of brain, including many upstream and downstream facilitators and inhibition pathways.8 Previous studies using functional magnetic resonance imaging showed that SMT may reduce the cognitive and emotional motivation of fear avoidance behavior in patients with chronic low back pain, as well as the corresponding brain processes.11 So it should be considered that the central nervous system is involved in the process of SMT alleviating CLBP.
Rest blood-oxygen-level-dependent functional magnetic resonance imaging (BOLD fMRI) indicated the brain spontaneous activity at rest, without task or stimulus.12 It was reported that the normal activity in brain default mode network (DMN), in patients with CLBP, was modified in the resting state.7 The destruction of DMN might be the basis of cognitive and behavioral disorders observed in CLBP.13 The regional homogeneity (Reho) of medial prefrontal cortex, insula, parahippocampal gyrus, and right cerebellum (posterior lobe) in patients with CLBP were increased, while the Reho values in the dorsolateral prefrontal cortex, left somatosensory cortex, anterior cingulate cortex, parahippocampal gyrus, and right inferior parietal lobe were decreased significantly.14,15 These results suggested that abnormal spontaneous resting activity in some brain regions is related to pain management.
There is little research focusing on the changes of the brain in patients with CLBP after SMT. Didehdar et al reported that spinal manipulation changed the neurometabolites of the brain in patients with CLBP.16 Our previous research showed that SMT changed the mode of patients with CLBP when responding to press stimulus in the spinal area.17 However, whether SMT can change brain activity at rest, and whether there may be correlations between these potential changes with clinical symptoms has not been studied. Hence, we enrolled patients with CLBP in this prospective study and analyzed the changes of brain activity at rest, immediately after the first SMT and after six courses of SMT, to explore the immediate and long-term central analgesia mechanism of SMT.
Materials and Methods
Research Subjects
This clinical trial was approved by the Ethics Committee of Shuguang Hospital affiliated to Shanghai University of Traditional Chinese Medicine and was registered (the registered institution: Chinese Clinical Trial Registry: A Primary Registry of International Clinical Trial Registry Platform, World Health Organization, under registration number: ChiCTR1800015620). (1) Twenty cases of outpatient with CLBP in our hospital from May 1st, 2018 to December 31st, 2018 were recruited (Group 1). The inclusion criteria for patients with CLBP were as following: ① right-handed patients18 aged between 20 and 60 years; ② patients with a history of CLBP for more than 3 months; ③ patients with a visual analogue scale (VAS) score ≥30/100, and a Chinese Short Form Oswestry Disability Index Questionnaire (C-SFODI) score ≥20%; ④ patients who had not undergone pharmacotherapy, related physical therapy or manipulation therapy within 1 month before the current treatment; ⑤ patients who signed the informed consent form. If any of the above criteria were not met, the patient was not enrolled in the study. (2) Twenty healthy subjects with right-handed who matched Group 1 subjects by gender and age were recruited (Group 2). The exclusion criteria were as follows: ① patients with a history of other chronic pain; ② patients with systemic disease; ③ patients with a history of head trauma or coma; ④ patients with a history of mental illness; ⑤ patients with a history of mild-to-moderate depression (Beck’s Depression Inventory (BDI) score >19); ⑥ patients with a history of spinal surgery, trauma or tumor.
Study Methods
Group 1 underwent SMT with soft-tissue and pulling manipulation, which is called “Tuina” in China. FMRI was performed for three times in Group 1, including before SMT (time point 1, TP1), after the first SMT (time point 2, TP2) and after the sixth SMT (time point 3, TP3). Before every fMRI study, patients with CLBP finished the clinical scales. No intervention was performed in Group 2, who underwent two fMRI scan at TP1 and TP3.
Treatment Approaches
All SMT sessions were performed by the same rehabilitation specialist (JW) with 28 years of spinal manipulation experience. The patients adopted the prone position. Rolling manipulation was the major treatment and was combined with kneading, poking, and pushing manipulations with a finger zen method. And the right pulling and left pulling manipulation were performed at last. Each treatment duration was approximately 25 minutes (Figure 1). Patients with CLBP received a total of six SMT courses and did not receive any other treatments during timeframe, including pharmacotherapy and physical therapy.
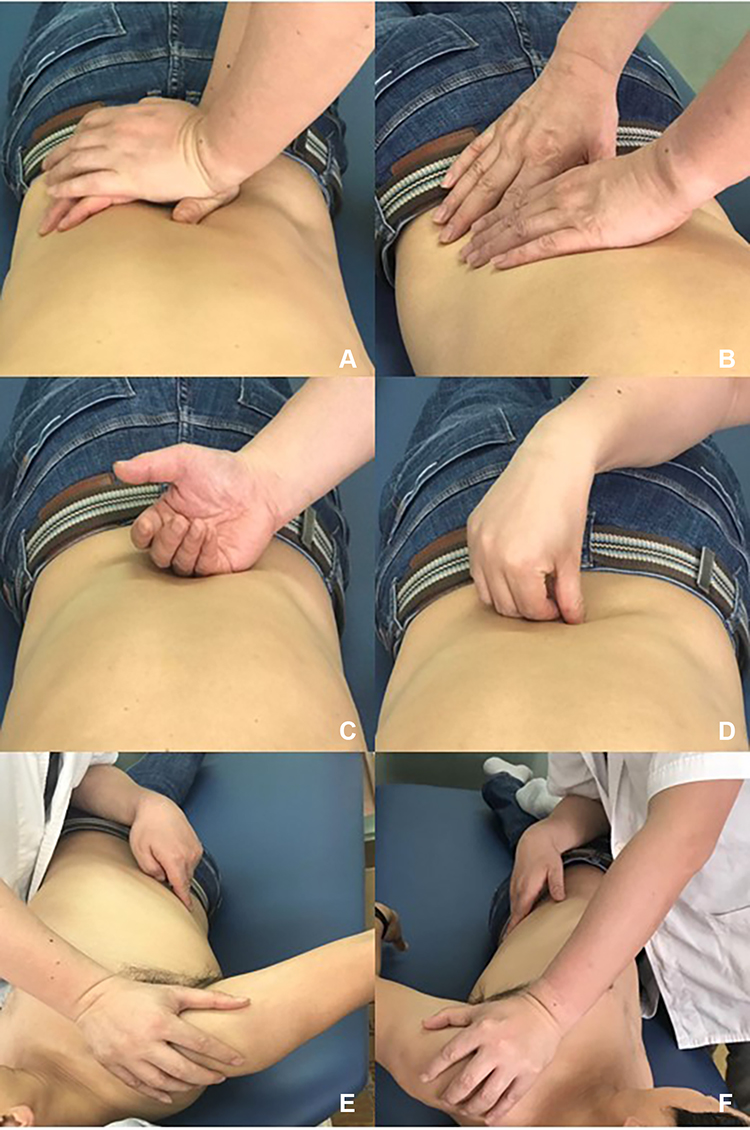 |
Figure 1 Spinal manipulation (A): kneading (B): poking (C): pushing (D): a finger zen manipulation (E): right pulling (F): left pulling. |
Clinical Pain Assessment Method
The clinical scales included the VAS (to assess the degree of CLBP) and C-SFODI (to assess the lumbar function). All patients with CLBP finished the clinical scales at three time points (TP1, TP2 and TP3), and the scales were finished within one hour before the fMRI scan. Because Group 2 was recruited with the standard of no pain, the VAS and C-SFODI were taken as zero.
fMRI Scan
The 3T Siemens MRI system (Verio, Siemens AG, Erlangen, Germany) was used for the fMRI scan in Group 1 and Group 2. The scan was performed using a 12-channel head coil in the supine position. In Group 1, the first MRI examination at TP1 was performed within one hour after the completion of the clinical scale assessment. After the first SMT and after the sixth SMT, the MR examination was performed within one hour of SMT. The subjects were guided before fMRI scans and were required to close their eyes, try not to think about anything and not to fall asleep. Every examination included sagittal T1-weighted 3D sequence with magnetization prepared rapid gradient echo (MPRAGE) for structural imaging and an axial T2*-weighted echo planar sequence for functional imaging. The MRI examination was performed once in Group 2 participants following the same protocol described above. The imaging parameters were shown as follows. T1-weighted MPRAGE in the sagittal plane: TR/TE = 2050 ms/3.08 ms, flip angle = 9 degrees, field of volume = 220 mm, thickness = 1 mm, resolution = 0.86 × 0.86 mm2, and slice = 160. T2*-weighted functional sequence in the axial plane: TR/TE = 2000 ms/30 ms, flip angle = 90 degrees, field of view = 256 mm × 256 mm, thickness = 4mm, slice gap = 0.5 mm, matrix = 64 × 64, slices = 31, parallel acquisition acceleration factor = 2. The scan times of MPRAGE and BOLD fMRI were 8 minutes and 14 seconds and 8 minutes and 16 seconds, respectively.
fMRI Data Processing and Statistical Analysis
Statistical Parametric Mapping 8 (SPM)19 running on MATLAB (The MathWorks, Inc) was used to pre-process the data of rest fMRI. To eliminate the effect of magnetic field inhomogeneity and maladaptation of the subjects at the beginning of the scan, the data of the first 10 time points in the rest fMRI was discarded. The pre-process included DICOM data conversion, time correction, head motion correction (exclusion criteria: horizontal displacement greater than 3 mm or rotational displacement greater than 3°), spatial normalization, smoothing (a Gaussian kernel of 8-mm full-width-at-half-maximum) and removing linear drift and filtering. The Reho module in the rest fMRI data analysis toolkit, REST, was used to calculate the time sequence consistency of each voxel in the whole brain and its surrounding voxels. The Kendall Harmony Coefficient (KCC) for each voxel in the patient’s brain was calculated to form a single patient-specific Reho image.20 Statistically, the Reho mapping for each time point in Group 1 and for the single-sample t-test in Group 2 can be obtained with the mean standardization method.
A paired t-test was performed using the data processing software REST1.8 to compare the Reho values between TP2 and TP1, TP3 and TP1, and TP2 and TP3 in Group 1. The results were corrected by Monte Carlo simulation21 using the program AlphaSim by B. D. Ward (http://afni.nimh.nih.gov/pub/dist/doc/manual/AlphaSim.pdf). P < 0.05 and a volume of the nucleus >389 were considered statistically significant.
The two-sample t-test was used to compare Reho values between Group 1 at TP1 and Group 2, between Group 1 at TP2 and Group 2, and between Group 1 at TP3 and Group 2 with AlphaSim correction. Similarly, p < 0.05 and a volume of the nucleus >389 were considered statistically significant.
The results were overlaid on the standard CH2 template for presentation.
Clinical Data Statistical Analysis
The statistical software package SPSS 20.0 (IBM SPSS Statistics, Armonk, NY, USA) was used for statistical analysis. The Chi-square test was used to compare the sex distributions of each group, and an independent sample t-test was used to compare the difference of age in two groups.
The Kruskal–Wallis H-test was used to assess differences in VAS scores and C-SFODI scores between Group 1 at TP1, Group 1 at TP2, Group 1 at TP3, and Group 2. The level of statistical significance was set at P < 0.05. The Mann–Whitney test was used to determine the significant difference between Group 1 at TP1 versus TP2, Group 1 at TP1 versus TP3, and Group 1 at TP2 versus TP3. To avoid type I error, P < 0.01 was considered statistically significant, based on a Bonferroni multiple comparison correction (0.05/3 = 0.01).
The VAS scores, C-SFODI scale scores, and the change rates of VAS and C-SFODI score were calculated. The change rates of VAS and C-SFODI scores were defined by the score difference between two time points divided by the scores from the initial time point. For example, the change rate for VAS (denoted as VAS change 1) was obtained via the following: (VAS1 – VAS2)/VAS1. The change rate for C-SFODI (denoted as C-SFODI change 2) was obtained via the following: (C-SFODI1 - C-SFODI3)/C-SFODI1. The change rate for C-SFODI (denoted as ODI change 3) was obtained via the following: (C-SFODI2 - C-SFODI3)/C-SFODI2. The Reho values which showed the statistical difference in the comparison of Group 1 at the different time points, and that of Group 2 were extracted. The correlation between Reho values of brain regions with statistical difference and VAS scores, C-SFODI scores, VAS score change rates, and C-SFODI score change rates in Group 1 were calculated by bivariate Pearson statistical method. P < 0.05 was considered statistically significant.
Results
Clinical Data
Twenty patients with CLBP were recruited as Group 1 (mean age ± SD, 38.95 ± 11.20 years). Group 2 consisted of 20 age and gender matched healthy controls (mean age ± SD, 38.45 ± 10.95 years). There was no significant difference in age (P = 0.5) or gender (P = 1.0) between the two groups. There was a significant difference in VAS scores between Group 1 (at baseline) and Group 2 (P < 0.001). After the first or sixth SMT treatment (TP2 and TP3), the VAS scores in Group 1 were significantly lower than that before SMT (TP1) (P < 0.001 in pairwise comparisons). There were also significant differences in C-SFODI scores between different time points. Specifically, the C-SFODI score after the first or sixth SMT (TP2 and TP3) was significantly lower than that before SMT (TP1) (P < 0.001 in pairwise comparisons) (Table 1). In the Group 2, 9 subjects participated in SMT at TP3 (4 males, 5 females, mean age ± SD, 32.55 ± 6.46 years). There was no significant difference in Reho value.
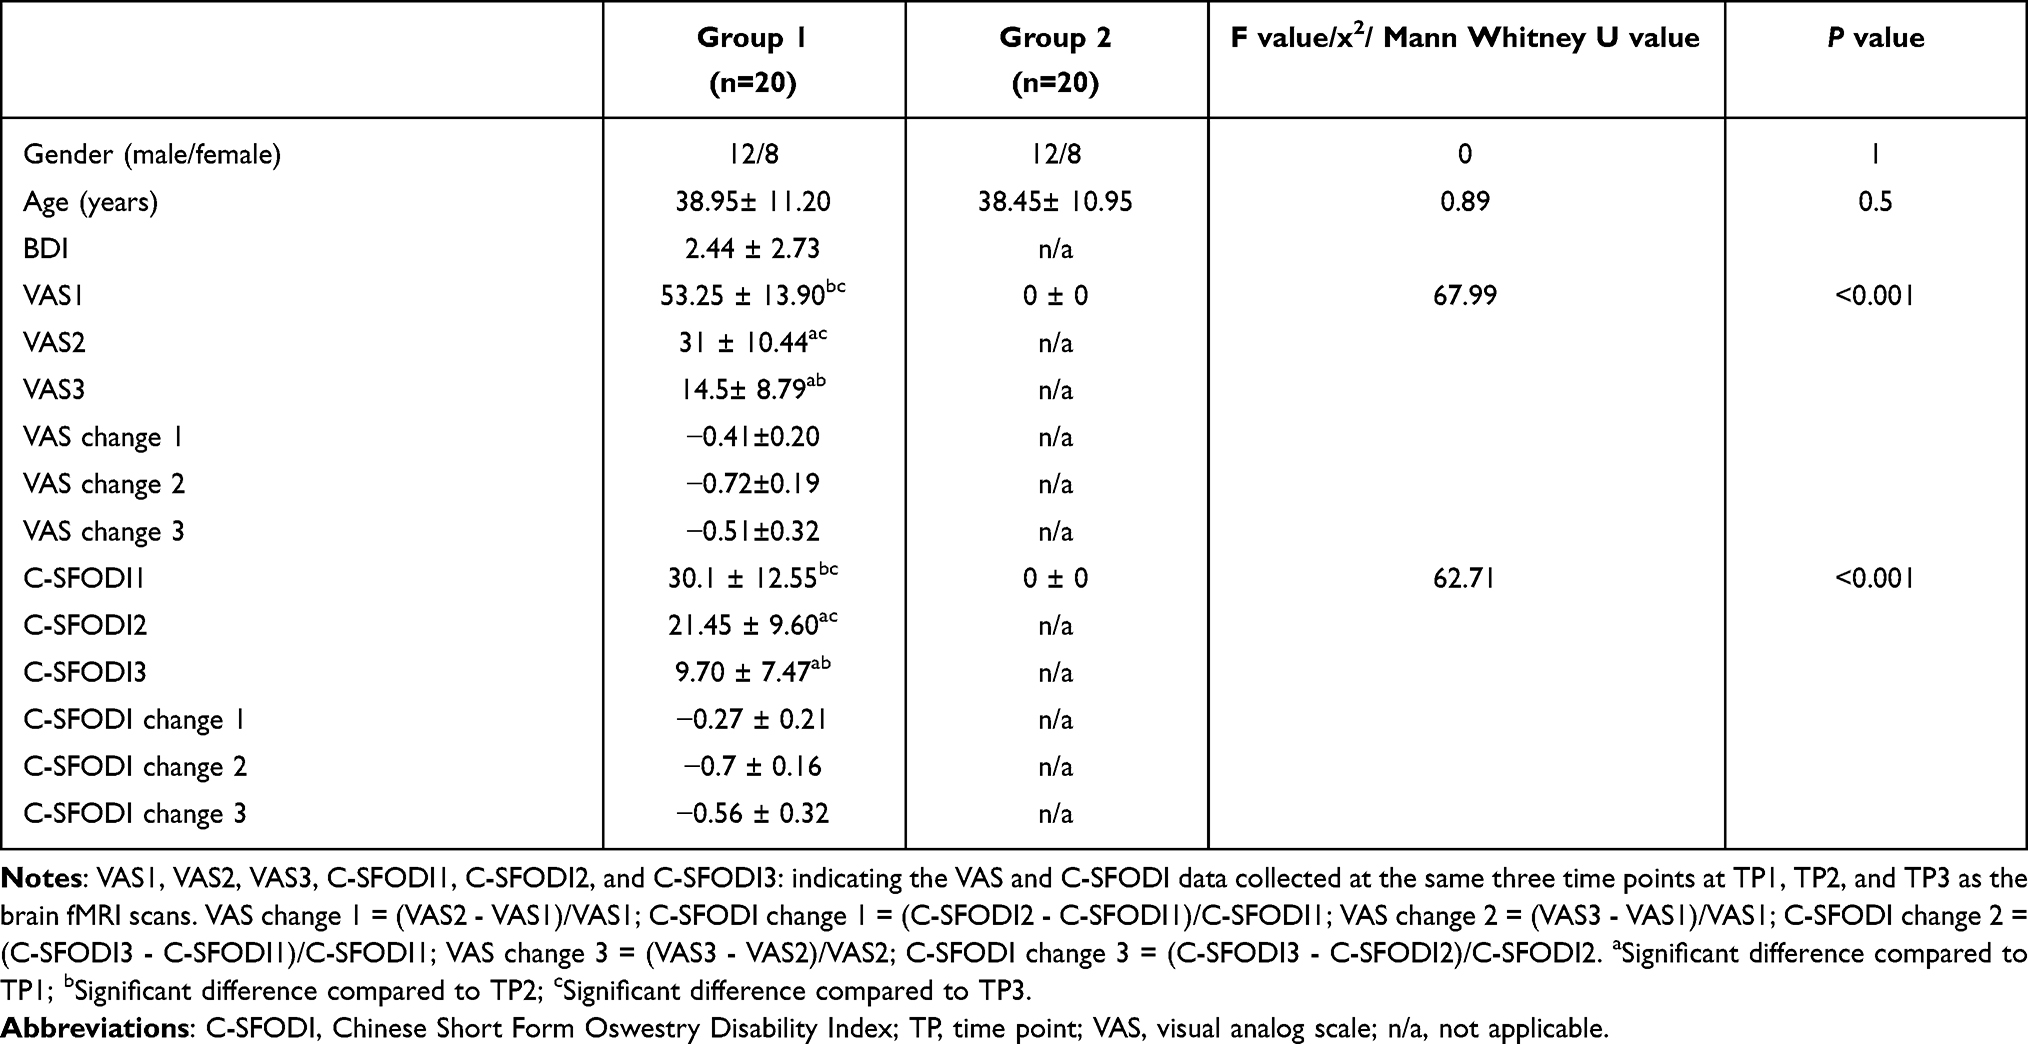 |
Table 1 Participants’ Information and Clinical Questionnaire Scores |
fMRI Data
(1) The Reho values at TP1 in Group 1 were significantly different from that in Group 2 (Table 2, Figure 2A). The brain regions with the elevated Reho values at TP1 were located in the right precuneus and right medial frontal gyrus; the brain region with a decreased Reho value at TP1 was in the left precuneus.
 |
Figure 2 Two-sample t-test results of Reho value between Group 1 and Group 2 (p < 0.05). (A): Group 1 at TP1 shows higher Reho value in the right precuneus (Peak MNI coordinate: 9, −66, 36), right mid-frontal gyrus (Peak MNI coordinate: 3, −6, 63) and lower Reho value in the left precuneus (Peak MNI coordinate: −15, −51, 63) compared with Group 2. (B): Group 1 at TP2 shows higher Reho value in the left middle temporal gyrus (Peak MNI coordinate: −57, −36, −3), right middle temporal gyrus (Peak MNI coordinate: 54, −39, 0), and lower Reho value in the right lingual gyrus (Peak MNI coordinate: 6, −90, −18 Lingual Gyrus) and bilateral superior frontal gyrus (Peak MNI coordinate: −12, 66, 6; 27, 66, 3). (C): Group 1 at TP3 shows higher Reho value in the bilateral middle temporal gyrus. (Peak MNI coordinate: −60, −36, −3; 54, −36, −3). |
(2) The Reho values at TP2 in Group 1 were significantly different from that in Group 2 (Table 3, Figure 2B). The brain region with the elevated Reho values at TP2 was located in the bilateral middle temporal gyrus; the brain regions with the decreased Reho values at TP2 were in the right lingual gyrus and bilateral superior frontal gyrus.
(3) The Reho values at TP3 in Group 1 were significantly different from that in Group 2 (Table 4, Figure 2C). The brain region with elevated Reho values at TP3 was located at the bilateral middle temporal gyrus; the decrease in the Reho values at TP3 was not statistically significant.
(4) The Reho values between TP2 and TP1 in Group 1 were significant different (Table 5, Figure 3A). The brain region with elevated Reho values was located at the left precuneus; the brain regions with decreased Reho values were located at the right medial frontal gyrus and left superior temporal gyrus.
 |
Figure 3 Paired t-test for the Reho values in the Group 1, p < 0.05. (A) The brain region with an elevated Reho value is located in the left precuneus; the brain regions with decreased Reho values are located in the left superior frontal gyrus and right superior temporal gyrus. (Clusters size > 389, Red indicates that the Reho at TP2 is higher than at TP1, and blue indicates that the Reho value at TP2 is lower than at TP1; “transver” indicates that the graph is a layered graph; “4, 6. 6” indicates 4 mm at each interval, 6 for each row, and 6 rows for total). (B) The brain region with an elevated Reho value is located in the left postcentral gyrus; the brain regions with decreased Reho values are located in the left superior frontal gyrus and left posterior cingulate cortex (Clusters size > 389, Red indicates that the Reho at TP3 group is higher than at TP1, and blue indicates that the Reho at TP3 is lower than at TP1; “transver” indicates that the graph is a layered graph; “4, 6. 6” indicates 4 mm at each interval, 6 for each row, and 6 rows for total). |
(5) The Reho values between TP3 and TP1 in Group 1 were significantly different (Table 6, Figure 3B). The brain region with elevated Reho value was located at the left postcentral gyrus; the brain regions with decreased Reho values were located in the left superior frontal gyrus and left posterior cingulate cortex.
(6) The Reho values between TP3 and TP2 in Group 1 were not significantly different (p > 0.05).
Correlation Analysis Between the Reho Values and VAS, C-SFODI Scores (Table 7)
The VAS scores at TP1 and TP2 were inversely correlated with the Reho values of the left precuneus at TP1, with a correlation coefficient of −0.549 (p = 0.012, p < 0.05) (Figure 4A) and −0.453 (p = 0.045, p < 0.05) (Figure 4B), respectively. The VAS scores after the first SMT (TP2) were negatively correlated with the Reho values of the left superior frontal gyrus at TP2, with a correlation coefficient of −0.455 (p = 0.044, p < 0.05) (Figure 4C). The VAS change 1 [(VAS2 - VAS1)/VAS1] was positively correlated with the Reho values in the left middle temporal gyrus at TP3, with a correlation coefficient of 0.454 (p = 0.044, p < 0.05) (Figure 4D). The VAS change 2 [(VAS 3 – VAS1)/VAS1] was positively correlated with the Reho values of the left middle temporal gyrus at TP3, with a correlation coefficient of 0.559 (p = 0.01, p < 0.05) (Figure 4E). The C-SFODI change 1 [(C-SFODI2 - C-SFODI1)/C-SFODI1] was inversely correlated with the Reho values of the right precuneus at TP1, with a correlation coefficient of −0.508 (p = 0.022, p < 0.05) (Figure 4F).
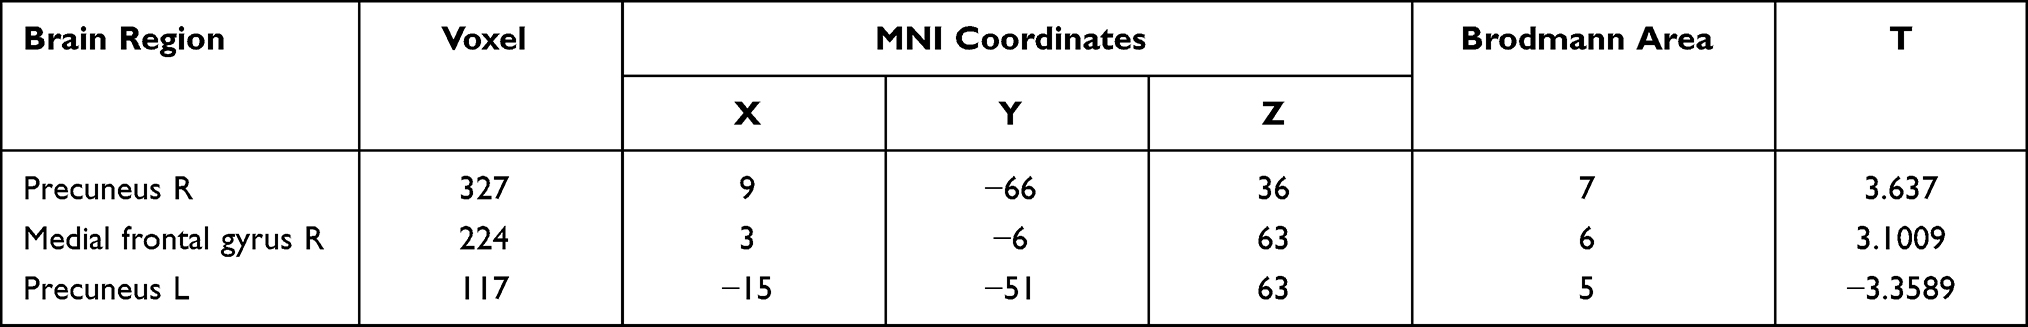 |
Table 2 Two-Sample t-test Results of the Reho Values Between Group 1 at TP1 and Group 2 |
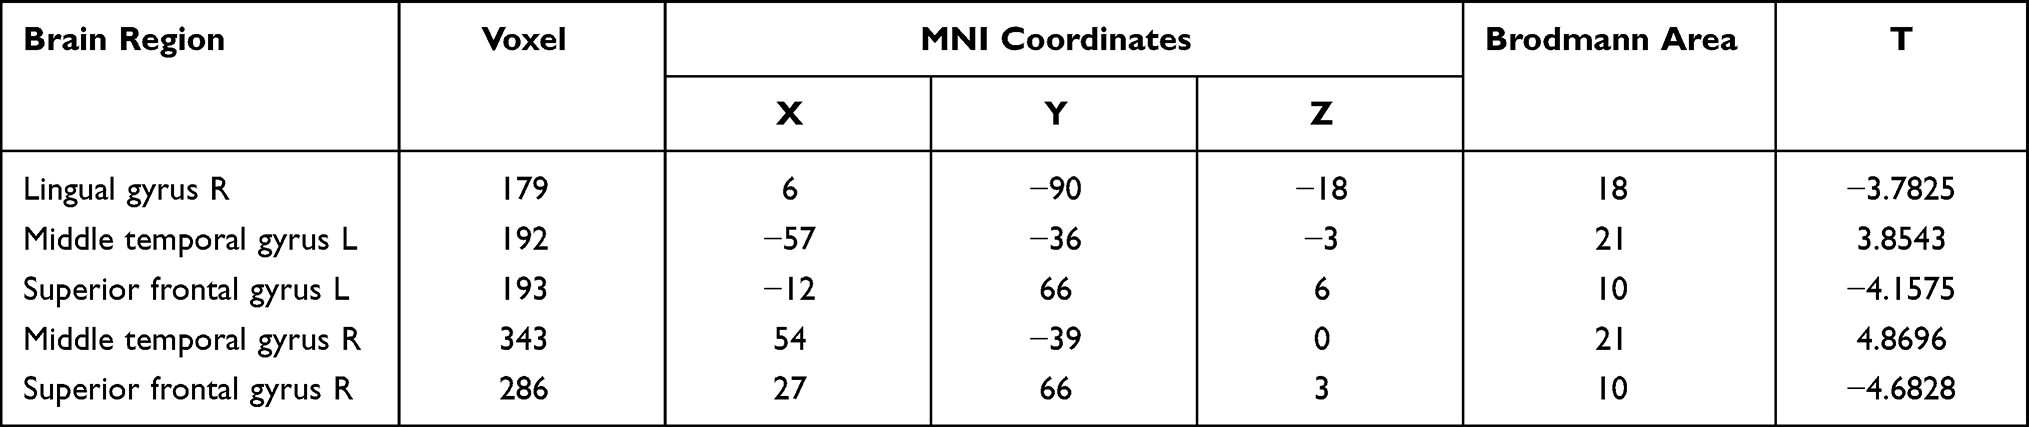 |
Table 3 Two-Sample t-test Results of the Reho Values Between Group 1 at TP2 and Group 2 |
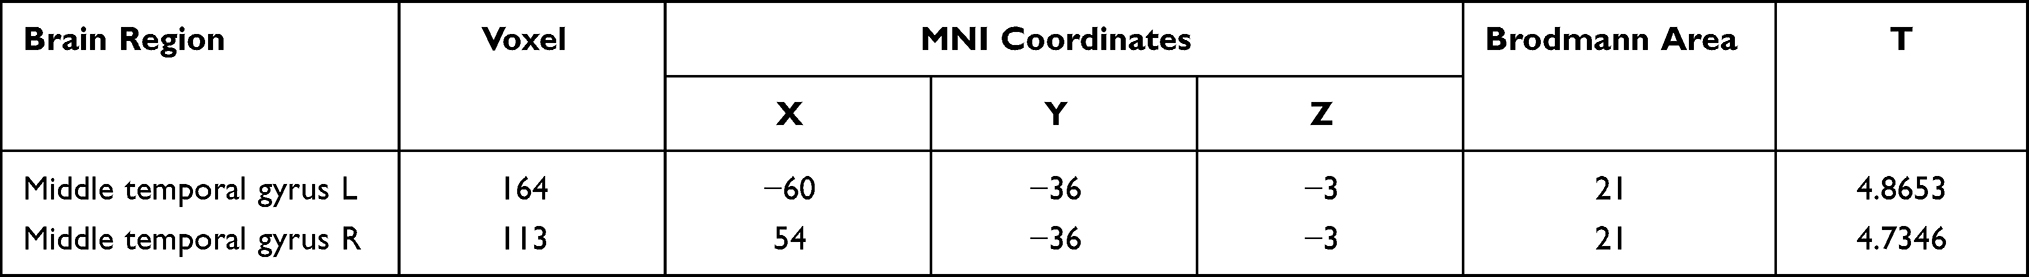 |
Table 4 Two-Sample t-test Results of the Reho Values Between Group 1 at TP3 and Group 2 |
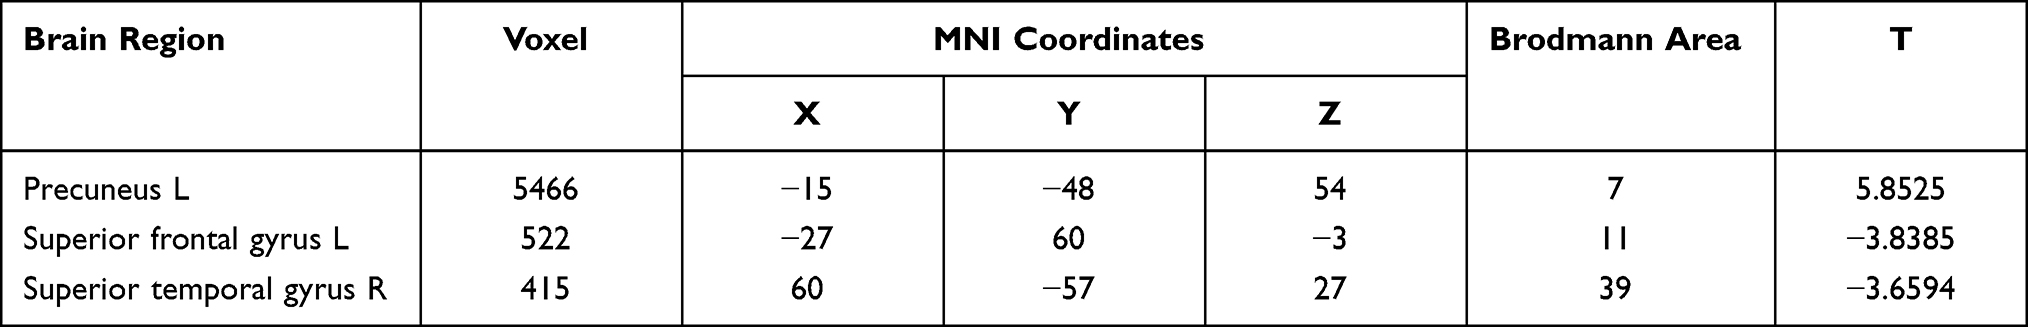 |
Table 5 Paired t-test Results of the Reho Values Between Group 1 at TP2 and Group 1 at TP1 |
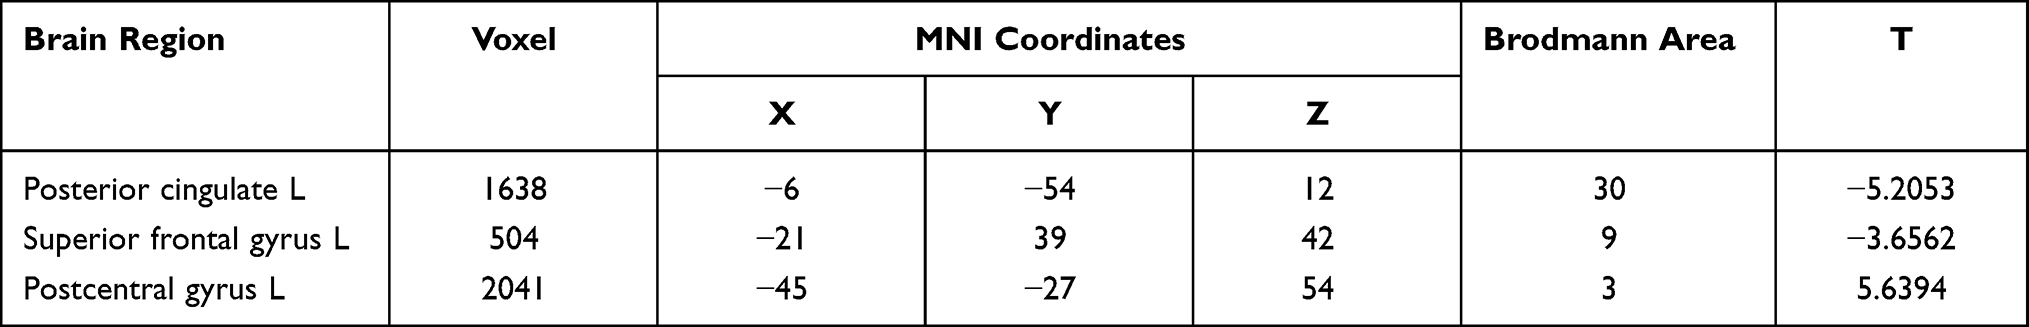 |
Table 6 Paired t-test Results of the Reho Values Between Group 1 at TP3 and Group 1 at TP1 |
 |
Table 7 Correlation Analysis Between the Reho Values and VAS, C-SFODI Scores |
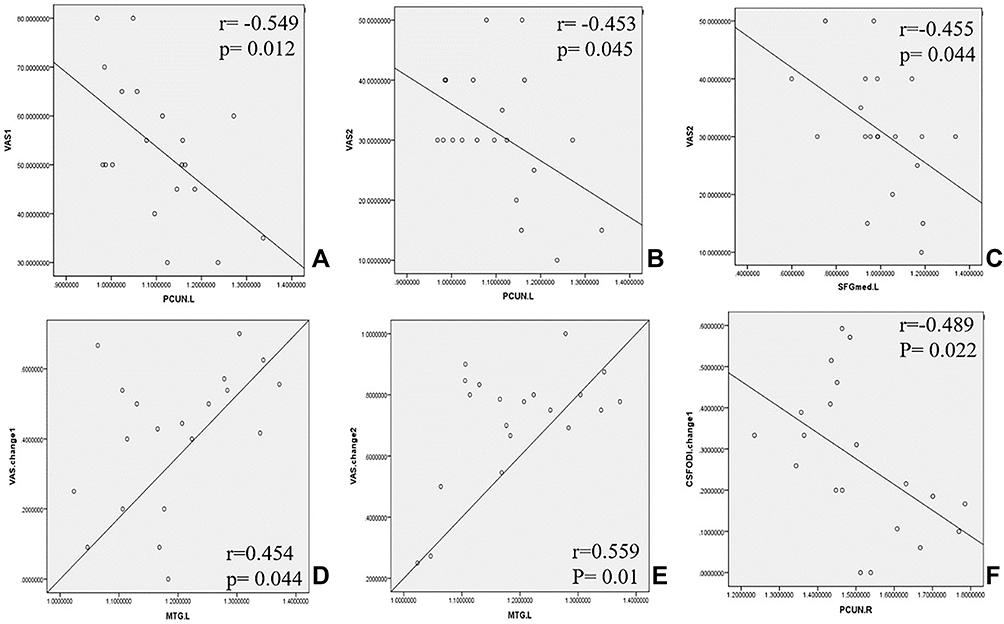 |
Figure 4 Scatter diagrams shows the correlations between brain activity and VAS, VAS change and C-SFODI change scores, respectively. (A) Negative correlation between brain activity in the PCUN.L at TP1 and the VAS scores (VAS1) at TP1. (B) Negative correlation between brain activity in the PCUN.L at TP1 and the VAS scores (VAS2) at TP2. (C) Negative correlation between brain activity in the SFG. L at TP2 and the VAS scores (VAS2) at TP2. (D) Positive correlation between brain activity in the MTG.L at TP3 and the VAS change 1 between TP1 and TP2 [(VAS1-VAS2)/VAS1]. (E) Positive correlation between brain activity in the MTG.L at TP3 and the VAS change 2 between TP1 and TP3 [(VAS1-VAS3)/VAS1]. (F) Negative correlation between brain activity in the PCUN.R at TP1 and the C-SFODI change 1 between TP1 and TP2 [(C-SFODI 1- C-SFODI 2)/ C-SFODI 1]. Abbreviations: PCUN.L, left precuneus; SFG. L, left superior frontal gyrus; MTG.L, left middle temporal gyrus; PCUN.R, right precuneus; VAS, Visual Analogue Scale; C-SFODI, Chinese Short Form Oswestry Disability Index; TP, time point. |
Discussion
This study demonstrated that the Reho values of patients with CLBP were increased in the right precuneus and middle frontal gyrus but were decreased in the left precuneus, when compared with healthy controls. After the first SMT, the degree of pain had been relieved, and the Reho values of some brain areas had been changed, including the right lingual gyrus, both middle temporal gyri, both superior frontal gyri, both precunei, the left superior frontal gyrus, and the right superior temporal gyrus. After the sixth SMT, the degree of pain had been furthermore diminished, and the Reho values of both middle temporal gyri in Group 1 were increased compared with Group 2, that of the left posterior cingulate and left superior frontal gyrus were decreased, and that of the left postcentral gyrus were increased. So the immediate effects of SMT are mainly embodied in the changes of activity in the cognitive and emotional central network and the long-term effects are mainly embodied in the sensory, emotional and cognitive central fields.
CLBP is often accompanied by the dysfunction in the afferent pathway of the central nervous system. The precuneus is an important anatomical region regulating the DMN. The DMN maintains the balance between positive and negative activation of the human brain at rest, which is related to the brain’s monitoring of internal and external environments, episodic memory, and sustained cognitive and emotional activities.22 The precuneus was found to be the activated brain region with the highest resting-state metabolic rate in the DMN, was closely related to the extensive brain cortex, and directly participated in cognition and memory activities.23 In our study, the Reho values were decreased in the left precuneus and increased in the right precuneus of patients with CLBP. These results were consistent with the study of Zhou et al.24 This imbalance of DMN status might be explained by the self-modification inside the DMN, and the increased Reho value of the right precuneus may be a manifestation of compensation in the DMN.25 Following the relief of pain after the first SMT, the Reho values of the left precuneus were increased and there was no longer any statistical difference with healthy controls, which implies a restoration of the dysfunction in the DMN. In the study of Tan et al,17 the left precuneus in patients with CLBP also showed increased activity in response to the mechanical stimulus of the low back area after the first SMT, compared to healthy control. So the left precuneus appears to play a key role in the maintenance of CLBP and mediates the restoration of brain function after the first SMT in patients with CLBP. In addition to the left precuneus, the Reho values of the posterior cingulate were also increased after six courses of SMT. So SMT could relieve CLBP by restoring the balance to the DMN.
Furthermore, the Reho values of the left precuneus at TP1 exhibited negative relationships with VAS scores before SMT (TP1) and after the first SMT (TP2). The increased coherence of spontaneous activities in the left precuneus was related to the decrease of negative emotions and avoidance reactions related to chronic pain.26 So the left precuneus could predict the immediate analgesic effect of SMT in patients with CLBP. Except for the left precuneus, the Reho values of the right precuneus at TP1 were negatively related to the change rate of C-SFODI between TP1 and TP2 in patients with CLBP. Hence, the higher Reho values in the right precuneus of patients with CLBP implied higher compensation of function in the DMN, and the worse prognosis of patients with CLBP.
The effectiveness and safety of manipulation analgesia have been clinically proven.27 In recent years, the research of analgesic mechanism in manipulation has gradually shifted from the pathological structural changes28,29 to the changes of pain neural pathway.30 As far as the current studies are concerned, SMT works mainly through intervention of pain signal uploading, central pain signal processing, and feedback and suppression of pain signal to affect the pain neural pathway. It had been noted that pain activated the emotion-related areas in the central nervous system, which made the descending pain expression contain emotional context.31 Gay et al reported that SMT might involve the regulation of emotion.32 In our study, the Reho values in the superior temporal gyrus and middle temporal gyrus in patients with CLBP were changed after the intervention of SMT. The superior temporal gyrus and middle temporal gyrus are not only auditory and speech centers but are also related to human emotions. These results were consistent with Sparks et al,33 who induced pain stimulation in healthy individuals and performed the intervention of SMT. The results showed that the subjects’ perception of pain was significantly reduced and a reduction of cerebral blood flow in the pain matrix was measured by BOLD fMRI after manipulation. The exact pathway through which SMT intervened the emotion-related brain areas is unclear. It was reported that the brain areas such as the prefrontal cortex, insular cortex, and anterior cingulate cortex were in a “low threshold” state during chronic low back pain.34 Some information (such as visual information and auditory information) that could cause pain was enough to make these areas abnormally activated. Gay et al reported that the spine manipulation might “inhibit” the abnormal activation of brain regions in the “low threshold” state to modulate pain.32 We speculated that the reason for the changes of Reho value in the superior temporal gyrus and middle temporal gyrus after SMT observed in this study was the same.
The main function of the frontal lobe is involvement in human cognitive and emotional activities. The superior frontal gyrus is located in the middle part of the prefrontal lobe and plays a role in complex cognitive control, such as visual working memory, decision-making, self-expression, behavioural supervision, and timely correction of errors.35 Our results showed that the superior frontal gyrus function was inhibited after spinal manipulation, accompanied by pain relief. Hence, we speculated that the decreased activity of the superior frontal gyrus led to the inhibition of pain. It was consistent with Letzen JE’s finding that emotional regulation was involved in manipulation therapy.36 This study also found that the Reho of the lingual gyrus decreased immediately after SMT and returned to normal after six courses of SMT. The lingual gyrus is involved in the processing of logical analysis and visual memory.37 SMT alleviated the symptoms of chronic low back pain, which may affect the cognitive center.
The sensorimotor loop projects from the primary sensorimotor cortex, including the bilateral premotor area, frontal lobe, central posterior gyrus, and supplementary motor area, to the putamen and then returns to these regions through the thalamus. In animal research, it was also proved the lateral posterior nucleus of thalamus (LP), a homologue of pulvinar, was involved in multiple sensory modulation.38,39 Brain imaging studies focusing on pain suggested that the brain regions such as the primary somatosensory area, secondary somatosensory area, insular lobe, and prefrontal cortex be referred to as the “pain matrix”.23,40 In recent studies, the LP of thalamus played an important role in the sensory processing and cross-modal modulation,39,41 and related research had also showed thalamocortical pathway involved in multisensory integration and affective processing.42,43 In this study, the Reho values of the central posterior gyrus after six courses of SMT were increased compared to that before SMT. This might reflect a functional compensation of the cerebral cortex for the abnormal function of sensorimotor circulation. The symptoms of CLBP were improved after manipulation and the dysfunction of pain network in CLBP was partially recovered. So the influence of spinal manipulation on areas with abnormal brain activation was a multi-dimensional interaction of emotion, cognition and sensation. Based on the important role of the thalamocortical pathway, the changes of it after SMT should be focused to understand the mechanism of SMT. In this study, there was no significant difference in Reho value between TP2 and TP3 in patients with CLBP. We speculated that the small difference observed was not statistically different and the reason for this result might be the small sample size in this study. However, this result also meant that the central effect of SMT was consistent at different time points, which was related to the brain regions of cognition and emotion function.
There were some limitations in this study. First, the sample size in this study was small. All patients with CLBP were outpatients of the Department of Manipulation in our hospital and had relatively mild symptoms. Inpatients with CLBP might have more serious low back pain. Therefore, the caution should be taken when extending our findings to patients with very severe CLBP. Second, in our study, only one brain fMRI scan was performed in Group 2. Since there was no manipulation of intervention in Group 2, we assumed that the fMRI data did not change within the three weeks of the study period, which may not be the case. Therefore, in future research, it is necessary to further increase the sample size based on the research results. Brain fMRI in healthy controls should also be performed at the time points matching the patient group. In addition, a group of healthy control receiving manipulation of intervention can be added to further the research results. Third, the CLBP group had no long-term follow-up after SMT, and there was no data on the duration of pain relief after SMT. To sum up, it is necessary to expand the sample size, control the inclusion and exclusion criteria, and optimize the experimental design scheme for further studies. And due to the strict inclusion criteria and the exact intervention, the results of this study should be prudently applied to patients with CLBP and accepted SMT.
Conclusion
Abnormal brain function activities occur in some brain regions of patients with low back pain at rest. Spinal manipulation therapy mainly affects the sensory, emotion and cognition-associated areas of patients with CLBP. The Reho value of the left precuneus might be one of the promising imaging biomarkers to predict the immediate analgesic effect of SMT.
Data Sharing Statement
The datasets during and/or analyzed during the current study available from the corresponding author (Wen-Li Tan, E-mail: [email protected]) on reasonable request.
Ethical Approval
The study compliances with the ethical standards of the responsible committee on human experimentation (Shuguang Hospital, Shanghai University of Traditional Chinese Medicine, Approval Number: 2017-520-03-01) and was performed in accordance with the Declaration of Helsinki (1964).
Acknowledgments
We are most grateful to Professor JieMing Fang who kindly edited the English language for the study.
Author Contributions
All authors made substantial contributions to conception and design, acquisition of data, or analysis and interpretation of data; took part in drafting the article or revising it critically for important intellectual content; agreed to submit to the current journal; gave final approval of the version to be published; and agreed to be accountable for all aspects of the work.
Funding
This research was supported by the National Natural Science Foundation of China (81503595) and the Shanghai Science and Technology Committee (17441902600, 18401970300).
Disclosure
The authors declare that the research was conducted in the absence of any commercial or financial relationships that could be construed as a potential conflict of interest.
References
1. Williams ACC, Craig KD. Updating the definition of pain. Pain. 2016;157(11):2420–2423. doi:10.1097/j.pain.0000000000000613
2. Mills SEE, Nicolson KP, Smith BH. Chronic pain: a review of its epidemiology and associated factors in population-based studies. Br J Anaesth. 2019;123(2):e273–e283. doi:10.1016/j.bja.2019.03.023
3. Hoy D, March L, Brooks P, et al. The global burden of low back pain: estimates from the Global Burden of Disease 2010 study. Ann Rheum Dis. 2014;73(6):968–974. doi:10.1136/annrheumdis-2013-204428
4. Childs JD, Fritz JM, Wu SS, et al. Implications of early and guideline adherent physical therapy for low back pain on utilization and costs. BMC Health Serv Res. 2015;15:150. doi:10.1186/s12913-015-0830-3
5. Ruddock JK, Sallis H, Ness A, et al. Spinal manipulation vs sham manipulation for nonspecific low back pain: a systematic review and meta-analysis. J Chiropr Med. 2016;15(3):165–183. doi:10.1016/j.jcm.2016.04.014
6. Robinault L, Holobar A, Cremoux S, et al. The effects of spinal manipulation on motor unit behavior. Brain Sci. 2021;11(1):105. doi:10.3390/brainsci11010105
7. Baliki MN, Geha PY, Apkarian AV, et al. Beyond feeling: chronic pain hurts the brain, disrupting the default-mode network dynamics. J Neurosci. 2008;28(6):1398–1403. doi:10.1523/JNEUROSCI.4123-07.2008
8. Sewards TV, Sewards M. Separate, parallel sensory and hedonic pathways in the mammalian somatosensory system. Brain Res Bull. 2002;58(3):243–260. doi:10.1016/s0361-9230(02)00783-9
9. Pasquier M, Daneau C, Marchand AA, et al. Spinal manipulation frequency and dosage effects on clinical and physiological outcomes: a scoping review. Chiropr Man Therap. 2019;27:23. doi:10.1186/s12998-019-0244-0
10. Wei L, Yinan G, Jingyi L, et al. Peripheral and central pathological mechanisms of chronic low back pain: a narrative review. J Pain Res. 2021;14:1483–1494. doi:10.2147/JPR.S306280
11. Ellingsen DM, Napadow V, Protsenko E, et al. Brain mechanisms of anticipated painful movements and their modulation by manual therapy in chronic low back pain. J Pain. 2018;19(11):1352–1365. doi:10.1016/j.jpain.2018.05.012
12. Lee MH, Smyser CD, Shimony JS. Resting-state fMRI: a review of methods and clinical applications. AJNR Am J Neuroradiol. 2013;34(10):1866–1872. doi:10.3174/ajnr.A3263
13. Tagliazucchi E, Balenzuela P, Fraiman D, et al. Brain resting state is disrupted in chronic back pain patients. Neurosci Lett. 2010;485(1):26–31. doi:10.1016/j.neulet.2010.08.053
14. Yoshino A, Okamoto Y, Doi M, et al. Regional brain functions in the resting state indicative of potential differences between depression and chronic pain. Sci Rep. 2017;7(1):3003. doi:10.1038/s41598-017-03522-1
15. Zhang SS, Wu W, Liu ZP, et al. Altered regional homogeneity in experimentally induced low back pain: a resting-state fMRI study. J Neuroeng Rehabil. 2014;11:115. doi:10.1186/1743-0003-11-115
16. Didehdar D, Kamali F, Yoosefinejad AK, et al. The effect of spinal manipulation on brain neurometabolites in chronic nonspecific low back pain patients: a randomized clinical trial. Ir J Med Sci. 2020;189(2):543–550. doi:10.1007/s11845-019-02140-2
17. Tan W, Wang W, Yang Y, et al. Spinal manipulative therapy alters brain activity in patients with chronic low back pain: a longitudinal brain fMRI study. Front Integr Neurosci. 2020;14:534595. doi:10.3389/fnint.2020.534595
18. Merni F, Di Michele R, Soffritti G. Assessment of handedness using latent class factor analysis. Laterality. 2014;19(4):405–423. doi:10.1080/1357650X.2013.845572
19. Friston KJ, Worsley KJ, Frackowiak RS, et al. Assessing the significance of focal activations using their spatial extent. Hum Brain Mapp. 1994;1(3):210–220. doi:10.1002/hbm.460010306
20. Zang Y, Jiang T, Lu Y, et al. Regional homogeneity approach to fMRI data analysis. Neuroimage. 2004;22(1):394–400. doi:10.1016/j.neuroimage.2003.12.030
21. Yue Y, Yuan Y, Hou Z, et al. Abnormal functional connectivity of amygdala in late-onset depression was associated with cognitive deficits. PLoS One. 2013;8(9):e75058. doi:10.1371/journal.pone.0075058
22. Xu C, Li C, Wu H, et al. Gender differences in cerebral regional homogeneity of adult healthy volunteers: a resting-state fMRI study. BioMed Res Int. 2015;2015:183074. doi:10.1155/2015/183074
23. Leech R, Braga R, Sharp DJ. Echoes of the brain within the posterior cingulate cortex. J Neurosci. 2012;32(1):215–222. doi:10.1523/JNEUROSCI.3689-11.2012
24. Zhou F, Wu L, Guo L, et al. Local connectivity of the resting brain connectome in patients with low back-related leg pain: a multiscale frequency-related Kendall’s coefficient of concordance and coherence-regional homogeneity study. NeuroImage Clin. 2019;21:101661. doi:10.1016/j.nicl.2019.101661
25. Alshelh Z, Marciszewski KK, Akhter R, et al. Disruption of default mode network dynamics in acute and chronic pain states. Neuroimage Clin. 2018;17:222–231. doi:10.1016/j.nicl.2017.10.019
26. Zhang B, Jung M, Tu Y, et al. Identifying brain regions associated with the neuropathology of chronic low back pain: a resting-state amplitude of low-frequency fluctuation study. Br J Anaesth. 2019;123(2):e303–e311. doi:10.1016/j.bja.2019.02.021
27. Zhang M, Du G, Liu C, et al. Efficacy and safety of Shi-style cervical manipulation therapy for treating acute and subacute neck pain: study protocol for a randomized controlled trial. Trials. 2021;22(1):123. doi:10.1186/s13063-021-05062-6
28. Costi JJ, Ledet EH, O’Connell GD. Spine biomechanical testing methodologies: the controversy of consensus vs scientific evidence. JOR Spine. 2021;4(1):e1138. doi:10.1002/jsp2.1138
29. Shokri E, Kamali F, Sinaei E, et al. Spinal manipulation in the treatment of patients with MRI-confirmed lumbar disc herniation and sacroiliac joint hypomobility: a quasi- experimental study. Chiropr Man Therap. 2018;26:16. doi:10.1186/s12998-018-0185-z
30. Ogura T, Tashiro M, Masud M, et al. Cerebral metabolic changes in men after chiropractic spinal manipulation for neck pain. Altern Ther Health Med. 2011;17(6):12–17.
31. Ploner M, Lee MC, Wiech K, et al. Flexible cerebral connectivity patterns subserve contextual modulations of pain. Cereb Cortex. 2011;21(3):719–726. doi:10.1093/cercor/bhq146
32. Gay CW, Robinson ME, George SZ, et al. Immediate changes after manual therapy in resting-state functional connectivity as measured by functional magnetic resonance imaging in participants with induced low back pain. J Manipulative Physiol Ther. 2014;37(9):614–627. doi:10.1016/j.jmpt.2014.09.001
33. Sparks C, Cleland JA, Elliott JM, et al. Using functional magnetic resonance imaging to determine if cerebral hemodynamic responses to pain change following thoracic spine thrust manipulation in healthy individuals. J Orthop Sports Phys Ther. 2013;43(5):340–348. doi:10.2519/jospt.2013.4631
34. Woolf CJ, Salter MW. Neuronal plasticity: increasing the gain in pain. Science. 2000;288(5472):1765–1769. doi:10.1126/science.288.5472.1765
35. Fox MD, Snyder AZ, Vincent JL, et al. The human brain is intrinsically organized into dynamic, anticorrelated functional networks. Proc Natl Acad Sci U S A. 2005;102(27):9673–9678. doi:10.1073/pnas.0504136102
36. Letzen JE, Robinson ME. Negative mood influences default mode network functional connectivity in patients with chronic low back pain: implications for functional neuroimaging biomarkers. Pain. 2017;158(1):48–57. doi:10.1097/j.pain.0000000000000708
37. Baker CM, Burks JD, Briggs RG, et al. A connectomic atlas of the human cerebrum - chapter 9: the occipital lobe. Oper Neurosurg. 2018;15(Suppl1):S372–S406. doi:10.1093/ons/opy263
38. Ibrahim LA, Mesik L, Ji XY, et al. Cross-modality sharpening of visual cortical processing through layer-1-mediated inhibition and disinhibition. Neuron. 2016;89(5):1031–1045. doi:10.1016/j.neuron.2016.01.027
39. Chou XL, Fang Q, Yan L, et al. Contextual and cross-modality modulation of auditory cortical processing through pulvinar mediated suppression. eLife. 2020;9:e54157. doi:10.7554/eLife.54157
40. Kregel J, Meeus M, Malfliet A, et al. Structural and functional brain abnormalities in chronic low back pain: a systematic review. Semin Arthritis Rheum. 2015;45(2):229–237. doi:10.1016/j.semarthrit.2015.05.002
41. Fang Q, Chou XL, Peng B, et al. A differential circuit via retino-colliculo-pulvinar pathway enhances feature selectivity in visual cortex through surround suppression. Neuron. 2020;105(2):355–369. doi:10.1016/j.neuron.2019.10.027
42. Karunakaran KD, Yuan R, He J, et al. Resting-state functional connectivity of the thalamus in complete spinal cord injury. Neurorehabil Neural Repair. 2020;34(2):122–133. doi:10.1177/1545968319893299
43. Lim M, Jassar H, Kim DJ, et al. Differential alteration of fMRI signal variability in the ascending trigeminal somatosensory and pain modulatory pathways in migraine. J Headache Pain. 2021;22(1):4. doi:10.1186/s10194-020-01210-6
 © 2022 The Author(s). This work is published and licensed by Dove Medical Press Limited. The
full terms of this license are available at https://www.dovepress.com/terms
and incorporate the Creative Commons Attribution
- Non Commercial (unported, 3.0) License.
By accessing the work you hereby accept the Terms. Non-commercial uses of the work are permitted
without any further permission from Dove Medical Press Limited, provided the work is properly
attributed. For permission for commercial use of this work, please see paragraphs 4.2 and 5 of our Terms.
© 2022 The Author(s). This work is published and licensed by Dove Medical Press Limited. The
full terms of this license are available at https://www.dovepress.com/terms
and incorporate the Creative Commons Attribution
- Non Commercial (unported, 3.0) License.
By accessing the work you hereby accept the Terms. Non-commercial uses of the work are permitted
without any further permission from Dove Medical Press Limited, provided the work is properly
attributed. For permission for commercial use of this work, please see paragraphs 4.2 and 5 of our Terms.