Back to Journals » International Journal of General Medicine » Volume 14
The Association of the Oxford Classification Score with Longitudinal Estimated Glomerular Filtration Rate Decline in Patients with Immunoglobulin A Nephropathy: A Mixed-Method Study
Authors Xu R, Li Z, Cao T, Xu Y, Liao Y, Song H, Chen X, Tang F, Xiang Q, Wan Q
Received 29 March 2021
Accepted for publication 28 May 2021
Published 18 June 2021 Volume 2021:14 Pages 2655—2663
DOI https://doi.org/10.2147/IJGM.S313333
Checked for plagiarism Yes
Review by Single anonymous peer review
Peer reviewer comments 2
Editor who approved publication: Dr Scott Fraser
Ricong Xu,1,2 Zhijian Li,3,4 Tao Cao,1,2 Yi Xu,1,2 Ying Liao,1,2 Haiying Song,1,2 Xiaojie Chen,1,2 Fei Tang,1,2 Qiong Xiang,1,2 Qijun Wan1,2
1Department of Nephrology, The First Affiliated Hospital of Shenzhen University, Shenzhen, People’s Republic of China; 2The Second People’s Hospital of Shenzhen, Shenzhen, People’s Republic of China; 3Department of Nephrology, The First Affiliated Hospital, Sun Yat-sen University, Guangzhou, Guangdong, People’s Republic of China; 4Key Laboratory of Nephrology, National Health Commission and Guangdong Province, Guangzhou, Guangdong, People’s Republic of China
Correspondence: Qijun Wan
Department of Nephrology, The First Affiliated Hospital of Shenzhen University, 3002 Sungang Road, Shenzhen, 518035, People’s Republic of China
Tel +860755 83366388
Email [email protected]
Introduction: The Oxford Classification score, which predicts renal outcomes for immunoglobulin A nephropathy (IgAN), is widely used in clinical practice. Nevertheless, the relationship between these markers and longitudinal changes in renal function are poorly understood.
Methods: This was a population-based retrospective cohort study of 280 adults with biopsy-proven primary IgAN from 2011 to 2018. We used generalized additive mixed models to control for traditional kidney disease risk factors to analyze the associations between Oxford Classification MEST-C scores (mesangial hypercellularity, M; endocapillary hypercellularity, E; segmental glomerulosclerosis, S; tubular atrophy/interstitial fibrosis, T; crescents, C) and longitudinal changes in the estimated glomerular filtration rate (eGFR) after renal biopsy.
Results: The median eGFR was 78.2 mL/min/1.73 m2 at baseline, and then it decreased on average by 1.3 mL/min/1.73 m2 per year in the entire cohort. In adjusted models, compared with patients without relative lesions, the presence of T > 50% (T2) (− 5.7; 95% confidence interval [CI], − 9.5 to − 2.0 mL/min/1.73m2 per year) was associated with the fastest eGFR decline. S present (S1) (− 2.9; 95% CI, − 4.6 to − 1.1 mL/min/1.73m2 per year) and C > 25% glomeruli (C2) (− 3.4; 95% CI, − 6.4 to − 0.5 mL/min/1.73m2 per year) also demonstrated steeper eGFR declines. However, we found no association between M > 0.5 (M1), E present (E1), T 26%– 50% (T1), and C present ≥ 1 glomerulus (C1), and progressive eGFR decline (p > 0.05).
Conclusion: The Oxford Classification scores, S1, T2, and C2, were independently associated with the longitudinal decreases in renal function in patients with IgAN. These findings suggested therapies targeted at improving early damage to these lesions might be essential to delay renal progression.
Keywords: IgA nephropathy, Oxford Classification, renal function decline, a mixed-method study
Introduction
IgA nephropathy (IgAN) is the most common form of primary glomerulonephritis and the leading cause of end-stage renal disease in China.1 It is characterized by predominant IgA deposition in the glomerular mesangial area,2 with widely variable clinical manifestations and pathologic features. Histopathologic classification is essential to assess the severity of the kidney lesions and to guide treatment.3–7
In 2009, the Oxford Classification of IgAN identified four prognostic markers of histopathology, namely mesangial hypercellularity (M), endocapillary hypercellularity (E), segmental glomerulosclerosis (S), and tubular atrophy and interstitial fibrosis (T).8 The revised Oxford Classification of IgAN in 2017 added the presence of crescents (C) to the existing markers, and the combination was called the MEST-C score system.9 These five key pathogenic features have demonstrated substantial importance in clinical practice.10–12 Nevertheless, of these markers, only T lesions have been consistently confirmed to predict renal progression, with more variable results for M, S, and C lesions. Most studies showed E lesions did not predict renal outcomes.8,10,13–26 The explanations for these differences may be the choice of different degrees of baseline renal function, differing study endpoints, varying durations of observational times, varying immunosuppressive strategies, and variability in biopsy assessment between pathologists. Nevertheless, data are limited from studies addressing the relationship between the Oxford Classification score and longitudinal changes in renal function. It is hoped that knowledge regarding this relationship may help predict the speed with which kidney function declines for different lesions.
Therefore, in the present study, we measured the associations of each Oxford Classification score (M, E, S, T, and C) with longitudinal changes in eGFR in patients with IgAN after renal biopsy, using a mixed-method model.
Materials and Methods
Study Design and Patients
This was a single-center retrospective cohort study, and its subjects were patients older than 18 years of age with biopsy-proven primary IgAN, who were recorded in the IgAN Database of Shenzhen Second People’s Hospital between January 1, 2011 and December 31, 2018. Participants with a secondary cause of IgAN, such as Henoch-Schönlein purpura, systemic lupus erythematosus, or chronic liver disease were excluded. We also excluded patients with an absence of baseline serum creatinine or renal pathology data for Oxford Classification from their first renal biopsy, a baseline eGFR < 30 mL/min/1.73 m2, missing follow-up measurements of serum creatinine, or a follow-up time < 0.5 years (Figure 1).
 |
Figure 1 Flowchart of immunoglobulin A nephropathy patients included in the study. |
The follow-up measurements were taken approximately every 3–6 months, and patients had at least three measurements of serum creatinine. This study was approved by the Medical Ethics Committee of Shenzhen Second People’s Hospital (No. 20200714004) and conducted ethically in accordance with the World Medical Association Declaration of Helsinki.
Outcome
The outcomes were estimated annual changes in eGFR after renal biopsy. We calculated eGFR using the 2009 Chronic Kidney Disease Epidemiology Collaboration creatinine equation.27
Covariates
Demographic and clinicopathologic data at biopsy were obtained from our IgAN database. The following baseline covariates were analyzed in the multivariable models as they were potential confounders for the progression of renal damage (the generalized additive mixed model [GAMM]28 automatically included the initial eGFR as a covariate): age, gender, mean artery pressure (MAP, calculated as 1/3 × systolic blood pressure [SBP] + 2/3 × diastolic blood pressure [DBP]), proteinuria (measured using 24 h urine protein excretion [g/d]), and the Oxford Classification MEST-C score.
Renal biopsy specimens were examined using light, immunofluorescence, and electron microscopy, and the histopathology was graded based on the Oxford Classification system, comprising M < 0.5 (M0) or M > 0.5 (M1), E absent (E0) or E present (E1), S absent (S0) or S present (S1), T ≤ 25% (T0) or T 26%–50% (T1), or T > 50% (T2), and C absent (C0) or C present ≥ 1 glomerulus (C1) or C > 25% glomeruli (C2).9 All the renal biopsy results were reviewed independently by two renal pathologists from Guangzhou KingMed Center for Clinical Laboratory.
Statistical Analyses
Quantitative variables with normal distribution were expressed as mean ± standard deviation, and variables with skewed distribution were expressed as median (quartile). Categorical variables were expressed as frequency (percentage).
Graphical examination of the eGFR trajectories showed curvilinear changes in eGFR. GAMMs were used to investigate the fixed effects of the Oxford Classification of M, E, S, T, and C associations with longitudinal changes in eGFR.28 In these models, the dependent variable (eGFR) was evaluated at the baseline visit and during all follow-up visits, whereas the independent variables were only assessed at the baseline visit (Oxford Classification scores M, E, S, T, and C). Age, gender, MAP, proteinuria, and the Oxford Classification MEST-C score were adjusted in the multivariable models to determine whether the effects of M, E, S, T, and C on the changes in eGFR were independent. The interaction term between a fixed effect variable (M, E, S, T, or C) and time in these mixed-effects regression models was used to evaluate whether the variable was associated with longitudinal changes in eGFR.
All analyses were performed using the statistical software packages R (http://www.R-project.org, The R Foundation), EmpowerStats (http://www.empowerstats.com, X&Y Solutions, Inc., Boston, MA, US) and GraphPad Prism 8 (GraphPad Software Inc, La Jolla, CA, US). A p-value < 0.05 was considered statistically significant.
Results
The median duration of follow-up starting from renal biopsy was 2.1 years (interquartile range [IQR], 1.1–3.8 years). A total of 1423 eGFR measurements taken from 280 patients were available for analysis (Figure 1). At the time of renal biopsy, the mean age was 35.5 ± 9.9 years, 51.8% were male, 33% exhibited hypertension, the median eGFR was 78.2 mL/min/1.73 m2 (IQR, 51.7–100.3 mL/min/1.73 m2), and the median proteinuria was 1.2 g/24 h (IQR, 0.6–2.1 g/24 h). For the Oxford Classification score, in each score group, M1, E1, and S1 accounted for 74.6%, 25%, and 28.9%, respectively, and T1, T2, C1, and C2 accounted for 23.9%, 5%, 48.6%, and 8.9%, respectively (Table 1). Patients with active lesions took more corticosteroids/immunosuppressants at baseline. For example, 32.6% and 61.8% of patients with E0 and E1 scores, respectively, and 25.2%, 46%, and 82.1% of patients with C0, C1, and C2 scores, respectively, used at least one kind of immunosuppressive treatment (corticosteroids or immunosuppressants; Figure 2). The eGFR decreased on average by 1.3 mL/min/1.73 m2 (95% CI, 0.5–2.1 mL/min/1.73 m2) per year during the follow-up time in the entire cohort (Figure 3).
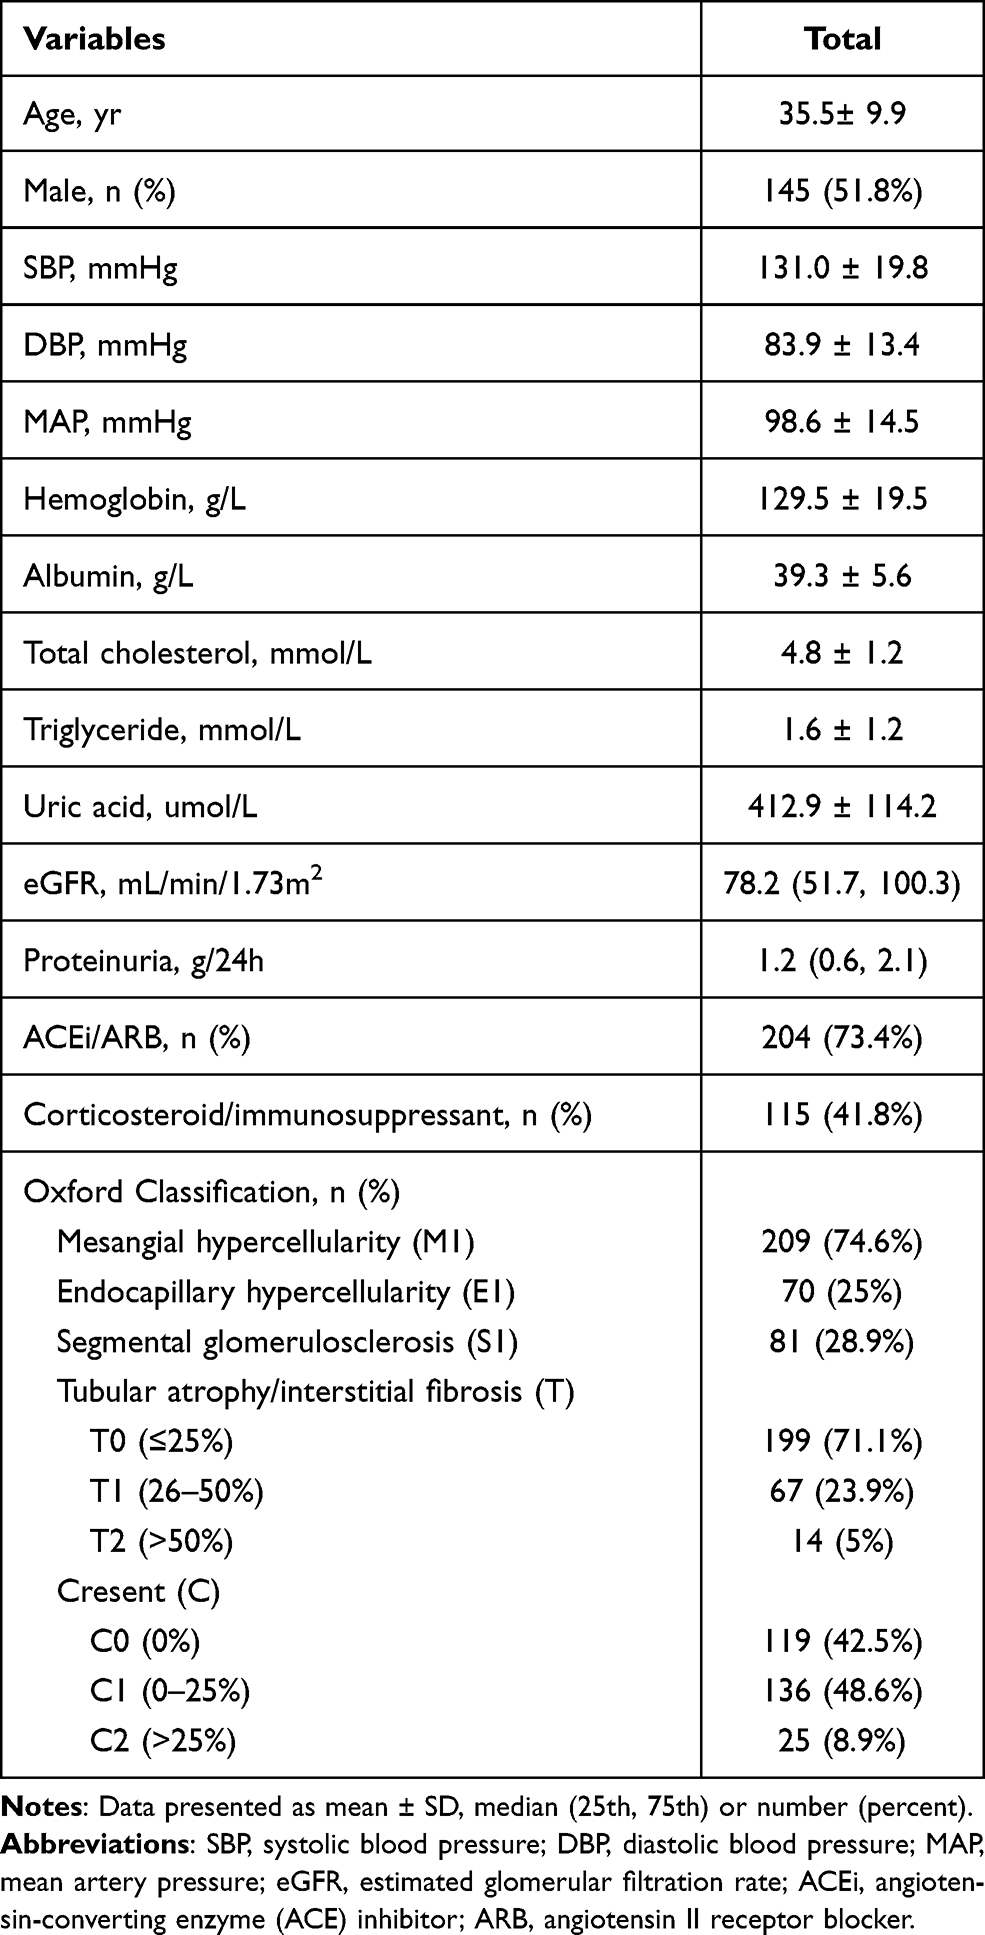 |
Table 1 Baseline Characteristics and Pathological Features of IgAN Patients |
 |
Figure 2 The proportions of corticosteroid/immunosuppressant used in immunoglobulin A nephropathy patients with different Oxford Classification scores. These data were collected at baseline after renal biopsy. |
 |
Figure 3 The trajectories of estimated glomerular filtration rate (eGFR) in patients with immunoglobulin A nephropathy. Estimates were from mixed-effect models adjusted for age, gender, mean artery pressure, proteinuria and the Oxford Classification MEST-C score. The red line indicated the estimated value for eGFR, and the blue lines represented the 95% confidence interval for the mean. |
We used GAMMs to evaluate the predictive effects of the M, E, S, T, and C scores on longitudinal changes in eGFR. A statistically significant interaction term between time and a predictive variable implied that the longitudinal changes of eGFR were influenced by the variable. In an unadjusted analysis, compared with patients without lesions, the presence of T2 lesions (−6.1; 95% CI, −10.1 to −2.1 mL/min/1.73 m2 per year; p = 0.003) was associated with the fastest eGFR decline; a steep annual decline in eGFR was also associated with S1 (−2.4; 95% CI, −4.3 to −0.6 mL/min/1.73 m2 per year; p = 0.011) and C2 (−3.8; 95% CI, −7.1 to −0.5 mL/min/1.73 m2 per year; p = 0.027). After adjusting for covariates including age, gender, MEST-C score, MAP, and proteinuria, the associations between T2 (−5.7; 95% CI, −9.5 to −2.0 mL/min/1.73 m2 per year; p = 0.003), S1 (−2.9; 95% CI, −4.6 to −1.1 mL/min/1.73 m2 per year; p = 0.002), and C2 (−3.4; 95% CI, −6.4 to −0.5 mL/min/1.73 m2 per year; p = 0.023), and the longitudinal decreases in eGFR remained significant. However, we found no associations between M1, E1, T1, and C1 and progressive eGFR decline in unadjusted or adjusted models (p > 0.05; Table 2, Figure 4).
 |
Table 2 Association of the Oxford Classification Score MEST-C with the Changes in eGFR |
 |
Figure 4 Association of the Oxford Classification MEST-C score with the annual changes in estimated glomerular filtration rate (eGFR) in immunoglobulin A nephropathy patients. Estimates (95% confidence interval) in mL/min/1.73 m2 per year for each Oxford Classification score. Compared with patients without the relative lesions, the presence of S1, T2, and C2 were significantly associated with a faster eGFR decline (p < 0.05). |
Discussion
There is worldwide consensus regarding use of the Oxford Classification to evaluate the severity of kidney lesions and to guide treatment for patients with IgAN. However, to our knowledge, this is the first study to evaluate the associations between the Oxford Classification score and longitudinal changes in renal function. In the present study, using measurements of eGFR, repeated at each follow-up visit, we found that patients with S1, T2, and C2 lesions had steeper eGFR declines than did patients without such lesions, and those with T2 lesions showed the fastest eGFR decline.
It has been seen that T lesions strongly predicted renal outcomes in patients with IgAN.9 The important role of S lesions has also been recognized although the predictive effect was weaker than that of T lesions.8,10,14–16,21 However, the exact contribution of each marker to longitudinal eGFR decline currently remains unclear. In the present study, we found that patients with T2 lesions had substantially faster eGFR declines than patients without these lesions. However, this was not the case for patients with TI lesions. Similarly, patients with S1 lesions had more rapid eGFR declines (−2.9 mL/min/1.73 m2 per year) than did those without. This happened even though 33% and 41% of patients with T2 and S1 lesions, respectively, were treated with corticosteroids/immunosuppressants after renal biopsy. The effects on renal progression appeared to be strong and persistent. These results were consistent with Coppo et al,29 who used the original Validation Study of the Oxford Classification for IgAN (VALIGA) with their cohort, with an extended follow-up period of 35 years for analysis. They found S1 and T1/T2 were still independently related to renal outcomes, suggesting the prognostic value for kidney failure can remain unchanged decades after the renal biopsy. In addition, a meta-analysis of five studies with 637 patients showed that S and T lesions significantly predicted steroid resistance.30 Some studies of Oxford Classification scores on repeated biopsies showed that T and S lesions did not improve after immunosuppressive treatments; on the contrary, deterioration appeared to be very common.25,31,32 These phenomena suggest that T2 and S1 lesions might reflect poor responsiveness or even unresponsiveness to currently available treatments. Further studies with repeated biopsies are needed to determine whether these lesions are potentially treatable or only cause progressive chronic damage.
The prognostic role of crescents (cellular/fibrocellular crescents) on renal progression are controversial and were not included in the original Oxford Classification score system. A working subgroup of the IgAN Classification Working Group addressed crescents as a potential predictor for renal outcomes in 3096 patients with IgAN, who were assembled from four retrospective studies (Haas et al,26 Oxford,8,33 and VALIGA34) and two large Asian databases.13,19 They found that C1 lesions predicted renal outcomes only in those untreated with immunosuppressive agents, while C2 lesions independently forecast poor renal outcomes in both patients receiving and not receiving immunosuppression. In our study, we did not separate patients according to their immunosuppressive status and, in line with Haas et al, the proportion of crescents increased accordingly with the percentage of patients treated with immunosuppression (Figure 2); 46% and 82.1% of patients with C1 and C2 lesions, respectively, took corticosteroids/immunosuppressants at baseline. Interestingly, we noticed patients with C2 rather than C1 lesions had more rapid declines in eGFR (−3.4 mL/min/1.73 m2 per year) after renal biopsy. This agrees with the results of Haas et al, suggesting that the effect of C2 lesions on kidney progression might be irreversible using current immunosuppressive therapies. Two studies of repeated biopsies showed that patients with cellular/fibrocellular crescents displayed significant improvement after immunosuppressant use.25,35 Of these two studies, Shen et al reported that, in patients with C lesions on the first biopsy, after immunosuppressive treatment, 10% had disappeared, 5% deteriorated, 65% reversed, and 20% persisted in the second biopsy.25 Another study found no statistically significant changes between the first and second biopsy with respect to C lesions (16% vs 11%).32 Nevertheless, these studies did not analyze the severity of the crescents (ie, C1 or C2), and there were more patients with C1 lesions than C2 lesions. In our study, C1 and C2 accounted for 48.6% and 8.9%, respectively, which suggests that the persistence or deterioration of C lesions in previous studies can probably be attributed to C2 lesions. We therefore speculate that patients with C2 lesions might have poor responses to current treatment therapies, similar to patients with T2 and S1 lesions. This hypothesis requires further studies of repeated biopsy data for confirmation.
The ability of M and E lesions to predict renal outcomes has been inconsistent and less reproducible. Several lines of evidence have suggested that E lesions are not associated with renal progression.8,13–26,36,37 Even so, some studies found that E1 lesions correlated with a higher degree of proteinuria and impaired renal function at the time of biopsy, as well as a more rapid loss of kidney function, particularly in patients not taking immunosuppressive treatments.8,14,38 These results suggest that the ability of E1 lesions to predict renal outcomes might be masked by the immunosuppressants; this finding is supported by the studies of repeated biopsy data that demonstrated substantial improvement of E lesions after immunosuppressant treatment. By contrast, M1 lesions showed no significant changes in serial biopsies.25,30–32,35 We did not observe any association of E1 lesions with longitudinal changes of renal function although we included use of immunosuppressants at baseline as a covariate in the mixed models. No significant association was found for M1 lesions either.
The greatest strength of our study was our adoption of repeated measurements of eGFR, allowing us to track longitudinal changes of renal function. In this way, we were able to measure associations between each Oxford Classification score and progressive renal function decline. However, this study also had some limitations. As a retrospective study, we could not stratify patients according to treated versus untreated status to adjust for the influence of medication. Nevertheless, when we introduced the immunosuppressive medication status at baseline as a covariate to the mixed models, the associations were not modulated significantly. In addition, the follow-up time was relatively short, we only analyzed data from one center, and the number of patients was small, especially those with T2 lesions. On the other hand, the repeated measurements did strengthen the statistical power. So, these results must be verified in other centers and ethnic groups with longer follow-up times and larger sample sizes.
In summary, we performed repeated measurements of eGFR during follow-up visits for analysis and found that Oxford Classification score T2 was associated with the fastest eGFR decline in patients with IgAN, followed by S1 and C2 scores. These findings suggest that these lesions might not be significantly ameliorated by currently available treatments, and new therapies targeted at improving the early damage of these lesions might be essential to improve renal outcomes.
Statement of Ethics
This study was approved by the Medical Ethics Committee of Shenzhen Second People’s Hospital (No. 20200714004). No informed consent from patients was required in this study, because the data were anonymized and we protected confidentiality of patient data. This work was conducted ethically in accordance with the World Medical Association Declaration of Helsinki.
Acknowledgments
We would like to acknowledge the hard and dedicated work of all the staff that implemented the intervention and evaluation components of the study.
Funding
This work was supported by a grant from the National Natural Science Foundation of China (R.C.X., 81900639), the Basic Research Program of the Shenzhen Science and Technology R & D Fund (R.C.X., JCYJ20190806162807125), Shenzhen Key Medical Discipline Construction Fund, Shenzhen Second People’s Hospital Clinical Research Program (Y. X., 20193357002), Shenzhen Key Medical Discipline Construction Fund (SZXK009).
Disclosure
The authors have no conflicts of interest to declare.
References
1. Hou JH, Zhu HX, Zhou ML, et al. Changes in the Spectrum of Kidney Diseases: an Analysis of 40,759 Biopsy-Proven Cases from 2003 to 2014 in China. Kidney Dis. 2018;4(1):10–19. doi:10.1159/000484717
2. Wyatt RJ, Julian BA. IgA nephropathy. N Engl J Med. 2013;368(25):2402–2414. doi:10.1056/NEJMra1206793
3. D’Amico G. Natural history of idiopathic IgA nephropathy: role of clinical and histological prognostic factors. Am J Kidney Dis. 2000;36(2):227–237. doi:10.1053/ajkd.2000.8966
4. Roufosse CA, Cook HT. Pathological predictors of prognosis in immunoglobulin A nephropathy: a review. Curr Opin Nephrol Hypertens. 2009;18(3):212–219. doi:10.1097/MNH.0b013e328329605c
5. Coppo R, D’Amico G. Factors predicting progression of IgA nephropathies. J Nephrol. 2005;18(5):503–512.
6. Manno C, Strippoli GF, D’Altri C, Torres D, Rossini M, Schena FP. A novel simpler histological classification for renal survival in IgA nephropathy: a retrospective study. Am J Kidney Dis. 2007;49(6):763–775. doi:10.1053/j.ajkd.2007.03.013
7. Lee HS, Lee MS, Lee SM, et al. Histological grading of IgA nephropathy predicting renal outcome: revisiting H. S. Lee’s glomerular grading system. Nephrol Dial Transplant. 2005;20(2):342–348. doi:10.1093/ndt/gfh633
8. Cattran DC, Coppo R, Cook HT. The Oxford classification of IgA nephropathy: rationale, clinicopathological correlations, and classification. Kidney Int. 2009;76(5):534–545. doi:10.1038/ki.2009.243
9. Trimarchi H, Barratt J, Cattran DC, et al. Oxford Classification of IgA nephropathy 2016: an update from the IgA Nephropathy Classification Working Group. Kidney Int. 2017;91(5):1014–1021. doi:10.1016/j.kint.2017.02.003
10. Coppo R, Troyanov S, Bellur S, et al. VALIGA study of the ERA-EDTA Immunonephrology Working Group: validation of the Oxford classification of IgA nephropathy in cohorts with different presentations and treatments. Kidney Int. 2014;86(4):828–836. doi:10.1038/ki.2014.63
11. Markowitz G. Glomerular disease: updated Oxford Classification of IgA nephropathy: a new MEST-C score. Nat Rev Nephrol. 2017;13(7):385–386. doi:10.1038/nrneph.2017.67
12. Yoon CY, Chang TI, Kang EW, et al. Clinical usefulness of the Oxford classification in determining immunosuppressive treatment in IgA nephropathy. Ann Med. 2017;49(3):217–229. doi:10.1080/07853890.2016.1252058
13. Katafuchi R, Ninomiya T, Nagata M, Mitsuiki K, Hirakata H. Validation study of oxford classification of IgA nephropathy: the significance of extracapillary proliferation. Clin J Am Soc Nephrol. 2011;6(12):2806–2813. doi:10.2215/CJN.02890311
14. Herzenberg AM, Fogo AB, Reich HN, et al. Validation of the Oxford classification of IgA nephropathy. Kidney Int. 2011;80(3):310–317. doi:10.1038/ki.2011.126
15. El Karoui K, Hill GS, Karras A, et al. A clinicopathologic study of thrombotic microangiopathy in IgA nephropathy. J Am Soc Nephrol. 2012;23(1):137–148. doi:10.1681/ASN.2010111130
16. Shi SF, Wang SX, Jiang L, et al. Pathologic predictors of renal outcome and therapeutic efficacy in IgA nephropathy: validation of the oxford classification. Clin J Am Soc Nephrol. 2011;6(9):2175–2184. doi:10.2215/CJN.11521210
17. Shima Y, Nakanishi K, Hama T, et al. Validity of the Oxford classification of IgA nephropathy in children. Pediatr Nephrol. 2012;27(5):783–792. doi:10.1007/s00467-011-2061-0
18. Le W, Zeng CH, Liu Z, et al. Validation of the Oxford classification of IgA nephropathy for pediatric patients from China. BMC Nephrol. 2012;13:158. doi:10.1186/1471-2369-13-158
19. Zeng CH, Le W, Ni Z, et al. A multicenter application and evaluation of the oxford classification of IgA nephropathy in adult Chinese patients. Am J Kidney Dis. 2012;60(5):812–820. doi:10.1053/j.ajkd.2012.06.011
20. Kang SH, Choi SR, Park HS, et al. The Oxford classification as a predictor of prognosis in patients with IgA nephropathy. Nephrol Dial Transplant. 2012;27(1):252–258. doi:10.1093/ndt/gfr295
21. Espinosa M, Ortega R, Sánchez M, et al. Spanish Group for Study of Glomerular Diseases (GLOSEN): association of C4d deposition with clinical outcomes in IgA nephropathy. Clin J Am Soc Nephrol. 2014;9(5):897–904. doi:10.2215/CJN.09710913
22. Park KS, Han SH, Kie JH, et al. Comparison of the Haas and the Oxford classifications for prediction of renal outcome in patients with IgA nephropathy. Hum Pathol. 2014;45(2):236–243. doi:10.1016/j.humpath.2013.08.019
23. Coppo R, Troyanov S, Camilla R; Working Group of the International IgA Nephropathy Network and the Renal Pathology Society. The Oxford IgA nephropathy clinicopathological classification is valid for children as well as adults. Kidney Int. 2010;77(10):921–927. doi:10.1038/ki.2010.43
24. Lee H, Yi SH, Seo MS, et al. Validation of the Oxford classification of IgA nephropathy: a single-center study in Korean adults. Korean J Intern Med. 2012;27(3):293–300. doi:10.3904/kjim.2012.27.3.293
25. Shen XH, Liang SS, Chen HM, et al. Reversal of active glomerular lesions after immunosuppressive therapy in patients with IgA nephropathy: a repeat-biopsy based observation. J Nephrol. 2015;28(4):441–449. doi:10.1007/s40620-014-0165-x
26. Haas M, Verhave JC, Liu ZH, et al. A Multicenter Study of the Predictive Value of Crescents in IgA Nephropathy. J Am Soc Nephrol. 2017;28(2):691–701. doi:10.1681/ASN.2016040433
27. Levey AS, Stevens LA, Schmid CH, et al. CKD-EPI (Chronic Kidney Disease Epidemiology Collaboration): a new equation to estimate glomerular filtration rate. Ann Intern Med. 2009;150(9):604–612. doi:10.7326/0003-4819-150-9-200905050-00006
28. Passafaro TL, Van de Stroet D, Bello NM, Williams NH, Rosa GJM. Generalized additive mixed model on the analysis of total transport losses of market-weight pigs1. J Anim Sci. 2019;97(5):2025–2034. doi:10.1093/jas/skz087
29. Coppo R, D’Arrigo G, Tripepi G, et al. Is there long-term value of pathology scoring in immunoglobulin A nephropathy? A validation study of the Oxford Classification for IgA Nephropathy (VALIGA) update. Nephrol Dial Transplant. 2020;35(6):1002–1009. doi:10.1093/ndt/gfy302
30. Yang P, Chen X, Zeng L, Hao H, Xu G. The response of the Oxford classification to steroid in IgA nephropathy: a systematic review and meta-analysis. Oncotarget. 2017;8(35):59748–59756. doi:10.18632/oncotarget.19574
31. Beckwith H, Medjeral-Thomas N, Galliford J, et al. Mycophenolate mofetil therapy in immunoglobulin A nephropathy: histological changes after treatment. Nephrol Dial Transplant. 2017;32(suppl_1):i123–i128. doi:10.1093/ndt/gfw326
32. Jullien P, Laurent B, Berthoux F, et al. Repeat renal biopsy improves the Oxford classification-based prediction of immunoglobulin A nephropathy outcome. Nephrol Dial Transplant. 2020;35(7):1179–1186. doi:10.1093/ndt/gfy341
33. Roberts IS, Cook HT, Troyanov S; Working Group of the International IgA Nephropathy Network and the Renal Pathology Society. The Oxford classification of IgA nephropathy: pathology definitions, correlations, and reproducibility. Kidney Int. 2009;76(5):546–556. doi:10.1038/ki.2009.168
34. Coppo R, Troyanov S, Bellur S, et al. VALIGA study of the ERA-EDTA Immunonephrology Working Group: validation of the Oxford classifification of IgA nephropathy in cohorts with different presentations and treatments. Kidney Int. 2014;86(4):828–836.
35. Hou JH, Le WB, Chen N, et al. Mycophenolate Mofetil Combined With Prednisone Versus Full-Dose Prednisone in IgA Nephropathy With Active Proliferative Lesions: a Randomized Controlled Trial. Am J Kidney Dis. 2017;69(6):788–795. doi:10.1053/j.ajkd.2016.11.027
36. Gutiérrez E, Zamora I, Ballarín JA, et al. Long-term outcomes of IgA nephropathy presenting with minimal or no proteinuria. J Am Soc Nephrol. 2012;23(10):1753–1760. doi:10.1681/ASN.2012010063
37. Edström Halling S, Söderberg MP, Berg UB. Predictors of outcome in paediatric IgA nephropathy with regard to clinical and histopathological variables (Oxford classification). Nephrol Dial Transplant. 2012;27(2):715–722. doi:10.1093/ndt/gfr339
38. Chakera A, MacEwen C, Bellur SS, Chompuk LO, Lunn D, Roberts ISD. Prognostic value of endocapillary hypercellularity in IgA nephropathy patients with no immunosuppression. J Nephrol. 2016;29(3):
 © 2021 The Author(s). This work is published and licensed by Dove Medical Press Limited. The
full terms of this license are available at https://www.dovepress.com/terms
and incorporate the Creative Commons Attribution
- Non Commercial (unported, 3.0) License.
By accessing the work you hereby accept the Terms. Non-commercial uses of the work are permitted
without any further permission from Dove Medical Press Limited, provided the work is properly
attributed. For permission for commercial use of this work, please see paragraphs 4.2 and 5 of our Terms.
© 2021 The Author(s). This work is published and licensed by Dove Medical Press Limited. The
full terms of this license are available at https://www.dovepress.com/terms
and incorporate the Creative Commons Attribution
- Non Commercial (unported, 3.0) License.
By accessing the work you hereby accept the Terms. Non-commercial uses of the work are permitted
without any further permission from Dove Medical Press Limited, provided the work is properly
attributed. For permission for commercial use of this work, please see paragraphs 4.2 and 5 of our Terms.