")
Back to Journals » Diabetes, Metabolic Syndrome and Obesity » Volume 17
The Association of HDL2b with Metabolic Syndrome Among Normal HDL-C Populations in Southern China
Authors Chen T, Wu S, Feng L, Long S, Liu Y, Lu W, Chen W, Hong G , Zhou L, Wang F, Luo Y, Zou H
Received 27 October 2023
Accepted for publication 16 January 2024
Published 23 January 2024 Volume 2024:17 Pages 363—377
DOI https://doi.org/10.2147/DMSO.S446859
Checked for plagiarism Yes
Review by Single anonymous peer review
Peer reviewer comments 2
Editor who approved publication: Prof. Dr. Juei-Tang Cheng
Tong Chen,1– 3 Shiquan Wu,1 Ling Feng,4 SiYu Long,1 Yu Liu,1,2 WenQian Lu,5 Wenya Chen,1 Guoai Hong,1 Li Zhou,1 Fang Wang,1 Yuechan Luo,1 Hequn Zou1,3,5
1Department of Nephrology, South China Hospital of Shenzhen University, Shenzhen, People’s Republic of China; 2Guangdong Key Laboratory for Biomedical Measurements and Ultrasound Imaging, National Regional Key Technology Engineering Laboratory for Medical Ultrasound School of Biomedical Engineering, Shenzhen University Medical School, Shenzhen, People’s Republic of China; 3Department of Nephrology, The Third Affiliated Hospital, Southern Medical University, Guangzhou, People’s Republic of China; 4Department of Nephrology, Shenzhen Hospital, Southern Medical University, Shenzhen, People’s Republic of China; 5Department of Medicine, The Chinese University of Hong Kong, Shenzhen, People’s Republic of China
Correspondence: Hequn Zou, School of Medicine, The Chinese University of Hong Kong, Shenzhen, People’s Republic of China, Email [email protected]
Background: The annual prevalence of metabolic syndrome (MetS) is increasing. Therefore, early screening and recognition of MetS are critical. This study aimed to evaluate the association between high-density lipoprotein (HDL) subclasses and MetS and to examine whether they could serve as early indicators in a Chinese community-based population with normal high-density lipoprotein cholesterol (HDL-C) levels.
Methods: We used microfluidic chip technology to measure HDL subclasses in 463 people with normal HDL levels in 2018. We assessed how HDL subclasses correlated with and predicted insulin resistance (IR) and metabolic syndrome (MetS), evaluated by homeostatic model insulin resistance index (HOMA-IR) and the 2009 International Diabetes Federation (IDF), the American Heart Association (AHA), and the National Heart, Lung, and Blood Institute (NHLBI) criteria, respectively. We used correlation tests and ROC curves for the analysis.
Results: The results indicate that there was a negative association between HDL2b% and the risk of IR and MetS in both sexes. Subjects in the highest quartile of HDL2b% had a significantly lower prevalence of IR and MetS than those in the lowest quartile (P< 0.01). Correlation analysis between HDL2b% and metabolic risk factors showed that HDL2b% had a stronger association with these factors than HDL-C did in both sexes. ROC curve analysis also showed that HDL2b% had significant diagnostic value for IR and MetS compared to other lipid indicators.
Conclusion: This study showed that MetS alters the distribution of HDL subclasses even when HDL-C levels are within the normal range. HDL-2b% has better diagnostic value for IR and MetS than HDL-C alone and may be a useful marker for early screening.
Keywords: HDL subclass, insulin resistance, metabolic syndrome, normal HDL-C population
Introduction
Metabolic syndrome (MetS) refers to a group of conditions that increases the risk of cardiovascular disease (CVD), stroke, and type 2 diabetes mellitus (T2DM). These conditions include insulin resistance (IR), elevated blood pressure, impaired glucose metabolism, abdominal obesity, elevated triglyceride levels, and low high-density lipoprotein cholesterol (HDL-C) concentrations. According to research, the global prevalence of MetS has increased over the last 20 years and global prevalence of MetS has been reported to be about 25%, causing huge health, social and economic burdens.1,2 Therefore, early screening and recognition of MetS are of critical importance worldwide, especially in China, a society with high rates of overweight, dyslipidemia and CVD.3
Although numerous clinical studies have described an inverse and independent relationship between HDL-C concentration and cardiovascular disease,4–6 several large-scale studies have indicated that HDL-C levels may not always be associated with a lower risk of cardiovascular disease.7–9 This has led to the suggestion that high-density lipoprotein (HDL) quality and functionality seem to be more important than HDL quantity (estimated by HDL-C) in reducing metabolic risk factors.10 The HDL quality concerns the morphology and composition of the HDL, such as particle size, shape, number and the content of proteins, lipids, and RNAs. Moreover, The HDL quality is also associated with the extent of HDL modification, such as glycation and oxidation, which may impair the beneficial effects of HDL.11 For example, previous studies have demonstrated that patients’ blood may contain oxidatively modified lipoproteins, which may have a greater impact on metabolic disorder than native molecules. These novel findings partially account for the association between metabolic disorders and increased oxidative stress in the context of metabolic syndrome.12,13 Generally, high HDL-C at the normal level is associated with good HDL quality and functionality. Nevertheless, high HDL quantity is not always accompanied by good HDL quality or functionality. So, the HDL quantity routinely determined in clinical practice, provide only some information about the HDL functionality. Therefore, other measures of HDL quality, such as HDL subclasses, extent of the oxidation and glycation or cholesterol removal capacity, which are not routinely determined in clinical practice, may be better methods for assessing HDL functionality.14
HDLs are a class of structurally and functionally heterogeneous particles that contain various proteins, lipids, and microRNAs. According to the above physicochemical properties and protein components, HDL can be separated into different subclasses. Based on density, HDL can be classified into large buoyant HDL2 and small dense HDL3, which can be further subdivided into five distinct subclasses (HDL2b, HDL2a, HDL3a, HDL3b, and HDL3c). Different HDL subclasses carry distinct and specific proteins or lipids, implying their unique and characteristic functions.15
Previous studies have demonstrated an significantly inverse relationship between HDL2 distribution with CVD, such like coronary artery disease,16,17 hypertension,18 dyslipidemia,19 acute ischemic stroke,20 myocardial infarction21 and metabolic syndrome.22,23 A literature review of 80 published investigations showed that the measurements of HDL2b provided more consistent evidence of CVD risk than other HDL subclasses. This review found that 70% of correlation studies and 91% of case-control comparison studies demonstrated that lower HDL-2b levels were significantly correlated with CVD progression.24 This evidence suggests that measurements of HDL2b could be highly valuable in identifying individuals at risk for metabolic disorder. According to the above observations, HDL2, in particular the HDL2b subclass, appears to be a more valuable indicator of CVD and MetS than HDL-C. However, epidemiological studies on the potential role of HDL subclasses, particularly HDL2b, in early prevention and screening of MetS in community-based populations are limited. In such cases, the main analyses in this study were made around HDL2b.
This is the first study to determine the association between the distribution of HDL subclasses, especially HDL2b, measured using microfluidic chip technology, and metabolic syndrome in a community-based population with normal HDL-C levels in southern China.
Materials and Methods
Study Population
This study was conducted in the Wanchai community of Zhujiang in southern China, which is a region with a high prevalence of MetS and CVD. From December 2017 to March 2018, the research team screened over 2000 community residents using a multistage stratified cluster sampling method, which ensured the representativeness of the sample and reduced sampling error. The cohort design and methodology have been previously described in detail.25 A total of 556 subjects were identified using microfluidic chip technology to detect the HDL subclasses. Among the 556 subjects, 463 subjects had normal HDL-C levels, which means that their HDL-C levels were above 1.04 mmol/L for men and 1.30 mmol/L for women. The normal HDL group was comprised of 160 male and 303 female subjects. The epidemiological investigation was approved by the Ethics Committee of the Third Affiliated Hospital of Southern Medical University and complied with the Declaration of Helsinki. Informed consent was obtained from all participants, and any doubts or questions were addressed by medical staff. Once the subjects agreed and signed the informed consent form, documents were collected and stored securely.
Data Collection
Participants underwent data screening, physical examination, and laboratory examinations at a designated research center. The collected information included the following:1. Socio-demographic characteristics such as age, sex, and medical history, including history of hypertension, diabetes, and coronary heart disease (CHD). This information was collected using a questionnaire. 2. Physical examination details were as follows: height, weight, waist circumference (WC), systolic blood pressure (SBP), and diastolic blood pressure (DPB) measured using standard mercury column blood pressure agents. These measurements were used to calculate the body mass index (BMI)[ ], waist-to-height ratio (WHtR)[
 ], The measurements were taken twice with a 1–2 minutes interval and the average value was recorded to ensure accuracy and reliability. 3. Laboratory test results: All participants fasted for at least 10 hours at night. The staff collected 5 mL of venous blood in coagulation separation gel tubes (Shanghai Kehua, China), gently inverted them three times for mixing, and left them for 20–30 minutes. The tubes were centrifuged at (3200–4000 rpm) for 10 min. All samples were sent to the Central Laboratory of the Third Affiliated Hospital of the Southern Medical University for examination. Total cholesterol (TC), low-density lipoprotein (LDL-C), high-density lipoprotein (HDL-C), and very low-density lipoprotein (VLDL-C) levels were measured using a colorimetric method (Roche cobas 6000, Penzberg, Germany), and high-sensitivity C-reactive protein (hs-CRP) and apolipoprotein A-1 (ApoA-1) levels were measured using immunotransmission turbidimetry. Fasting blood glucose (FBG) and triglycerides (TG) were measured using standard enzymatic methods. Retinol binding protein 4 (RBP4) levels were measured using an immunoturbidimetric method (Shanghai Beijia Biochemical Reagent Company, China). Fasting insulin levels were measured using electrochemical luminescence. The homeostatic model assessment of insulin resistance (HOMA-IR) was calculated using the following formula:
  .
.
Definitions of MetS, Insulin Resistance and Normal HDL-C Population
Metabolic syndrome (MetS) is a condition that involves a cluster of metabolic abnormalities that increases the risk of CVD and T2DM. The diagnostic criteria for MetS are based on the global consensus jointly developed by the International Diabetes Federation (IDF), the American Heart Association (AHA), and the National Heart, Lung, and Blood Institute (NHLBI) in 2009.26 The following five criteria were considered to diagnose MetS: 1. Abdominal obesity (Ob component), defined as waist circumference ≥ 85 cm for men and ≥ 80 cm for women; 2. Abnormally elevated triglyceride levels (TG component): blood triglyceride ≥ 1.70 mmol /L; 3. Elevated blood pressure: systolic blood pressure (SBP) ≥ 130 mmHg, diastolic blood pressure (DBP) ≥ 85 mmHg, or a history of hypertension (BP component); 4. Elevated fasting blood glucose: fasting blood glucose ≥ 5.6 mmol/L, or a history of diabetes (Glu component); 5. Decreased HDL-C level: male HDL < 1.04 mmol/L, female HDL < 1.30 mmol/L (HDL component). The subjects were diagnosed with MS when they met at least three of the five criteria.
IR is a condition in which the body does not respond well to insulin, a hormone that regulates the blood sugar levels. IR can lead to various metabolic problems such as type 2 diabetes and cardiovascular diseases. One way to measure IR is by using the homeostatic model insulin resistance index, also known as HOMA-IR. HOMA-IR was calculated using the formula: HOMA-IR = fasting blood glucose (mmol/L) × fasting insulin (mU/L) / 22.5. HOMA-IR reflects the balance between insulin secretion and sensitivity. A higher HOMA-IR indicates a higher degree of IR. Based on a review of previous epidemiological literature, this study established a cutoff point for defining IR as HOMA-IR > 2.69 mmol/L.mU/L.27
The normal HDL-C population was defined according to the global consensus on MetS jointly formulated by the IDF, AHA, and NHLBI in 2009. This consensus states that individuals with male HDL-C levels ≤ 1.04 mmol/L and female HDL-C levels ≤ 1.30 mmol/L are considered to have low HDL-C levels, which are a risk factor for metabolic disease. For the purpose of this study, men with HDL-C ≥ 1.04 mmol/L and women with HDL -C≥ 1.30 mmol/L were included in the normal HDL-C population. This population was selected to examine the changes in HDL subclass and their association with metabolic disorders in individuals who have normal HDL-C levels.
HDL Subclass Measurement
The specific operation method has been described previously.24 Briefly, HDL particles were subtyped by capillary electrophoresis on a microfluidics instrument (MICEP-30; Ardent BioMed, Guangzhou, China) based on their molecular size and charge. This kit is highly efficient, sensitive, and repeatable. The assay kit included a microfluidic chip, polymer-gel separation matrix [a linear polymer solution of poly (N, N-dimethyl acrylamide))], specific HDL fluorescent dyes (Dyomics, Jena, Germany), and a microchannel surfactant activator. The HDL particles were selectively stained using a lipid-specific proprietary dye and detected using a fluorescence detector within the instrument. First, the serum samples, calibration materials, and quality control materials were diluted 1:50 in sample buffer (250 mM TAPS, pH 7.5) along with a lipophilic fluorescent dye and incubated for 5–15 min. The mixture was loaded into the microfluidic chip wells. The separation process was initiated by running a software script that applied predetermined current and voltage. Laser-induced fluorescence at 680 nm was used to detect the fluorescence-stained lipoproteins. Once the chip run was completed, electrophoretic patterns were analyzed using a proprietary software program. The percentage of HDL2b was calculated by determining the ratio of the peak area of HDL2b to the total peak area of HDL using the statistical software within this program. Similarly, the percentage of HDL3 cells was calculated. Finally, the chip was discarded and the electrodes were cleaned using a designated cleaning chip. The entire procedure was performed within one hour.
Statistical Analysis
Statistical Method: This study employed SPSS (version 20.0) was used for statistical analysis. Data were categorized into two types: enumeration and categorical. Enumeration data that conformed to a normal distribution were expressed as the mean ± standard deviation, and the t-test was applied to compare the means between groups. Skewed data were expressed as medians (25% quantile, 75% quantile), and the non-parametric rank sum test was used to compare the means among groups. Categorical data were presented as absolute values (percentages), and the chi-square test was performed to compare the proportions between the groups. Fisher’s exact test was used when categorical data did not satisfy the chi-square test assumptions. Based on the quartile method, the participants were stratified into four subgroups according to the HDL2b results, and an analysis of variance (for normal data) or rank sum test (for skewed data) was conducted to compare the means between different subgroups. For categorical data, the chi-square test or Fisher’s exact test was used as appropriate. The correlation between continuous variables with a normal distribution was measured using Pearson’s correlation test. The correlation between continuous variables that did not show a normal distribution was measured using Spearman correlation test. The strength of the association was categorized as very weak (r<0.1), weak (0.1–0.39), moderate (0.40–0.69), strong (0.70–0.89), and very strong (r>0.90). Receiver operating characteristic (ROC) curve analysis, which was quantified by the area under the ROC curve (AUC), was used to evaluate the value of the HDL subclass for predicting IR and MS by comparing the ROC curve (AUC). Youden’s index was calculated using the following formula: Yonden index= sensitivity+specificity-1.
Results
Baseline Characteristics of the Study Population
The study population comprised 463 participants, of which 160 (34%) were males and 303 (66%) were females (Table 1). The mean ages of the two genders. Females had a lower prevalence of hypertension, CHD, and T2DM than males. Females also exhibited lower values of physical examination parameters such as SBP, DBP, height, weight, WC, and BMI, except for WHtR, which was similar between the sexes. Males had higher FBG, TG, VLDL, and RBP4 levels than females. Conversely, females had higher HDL-C, Apoa-1, and TC levels than males. Furthermore, HDL2b% distribution was higher in females than in males, whereas HDL3% distribution was higher in males than in females. There was no significant difference in HOMA-IR between sexes. Due to sex differences in HDL-C levels and HDL subclass ratios, subsequent analyses were performed separately for each sex.
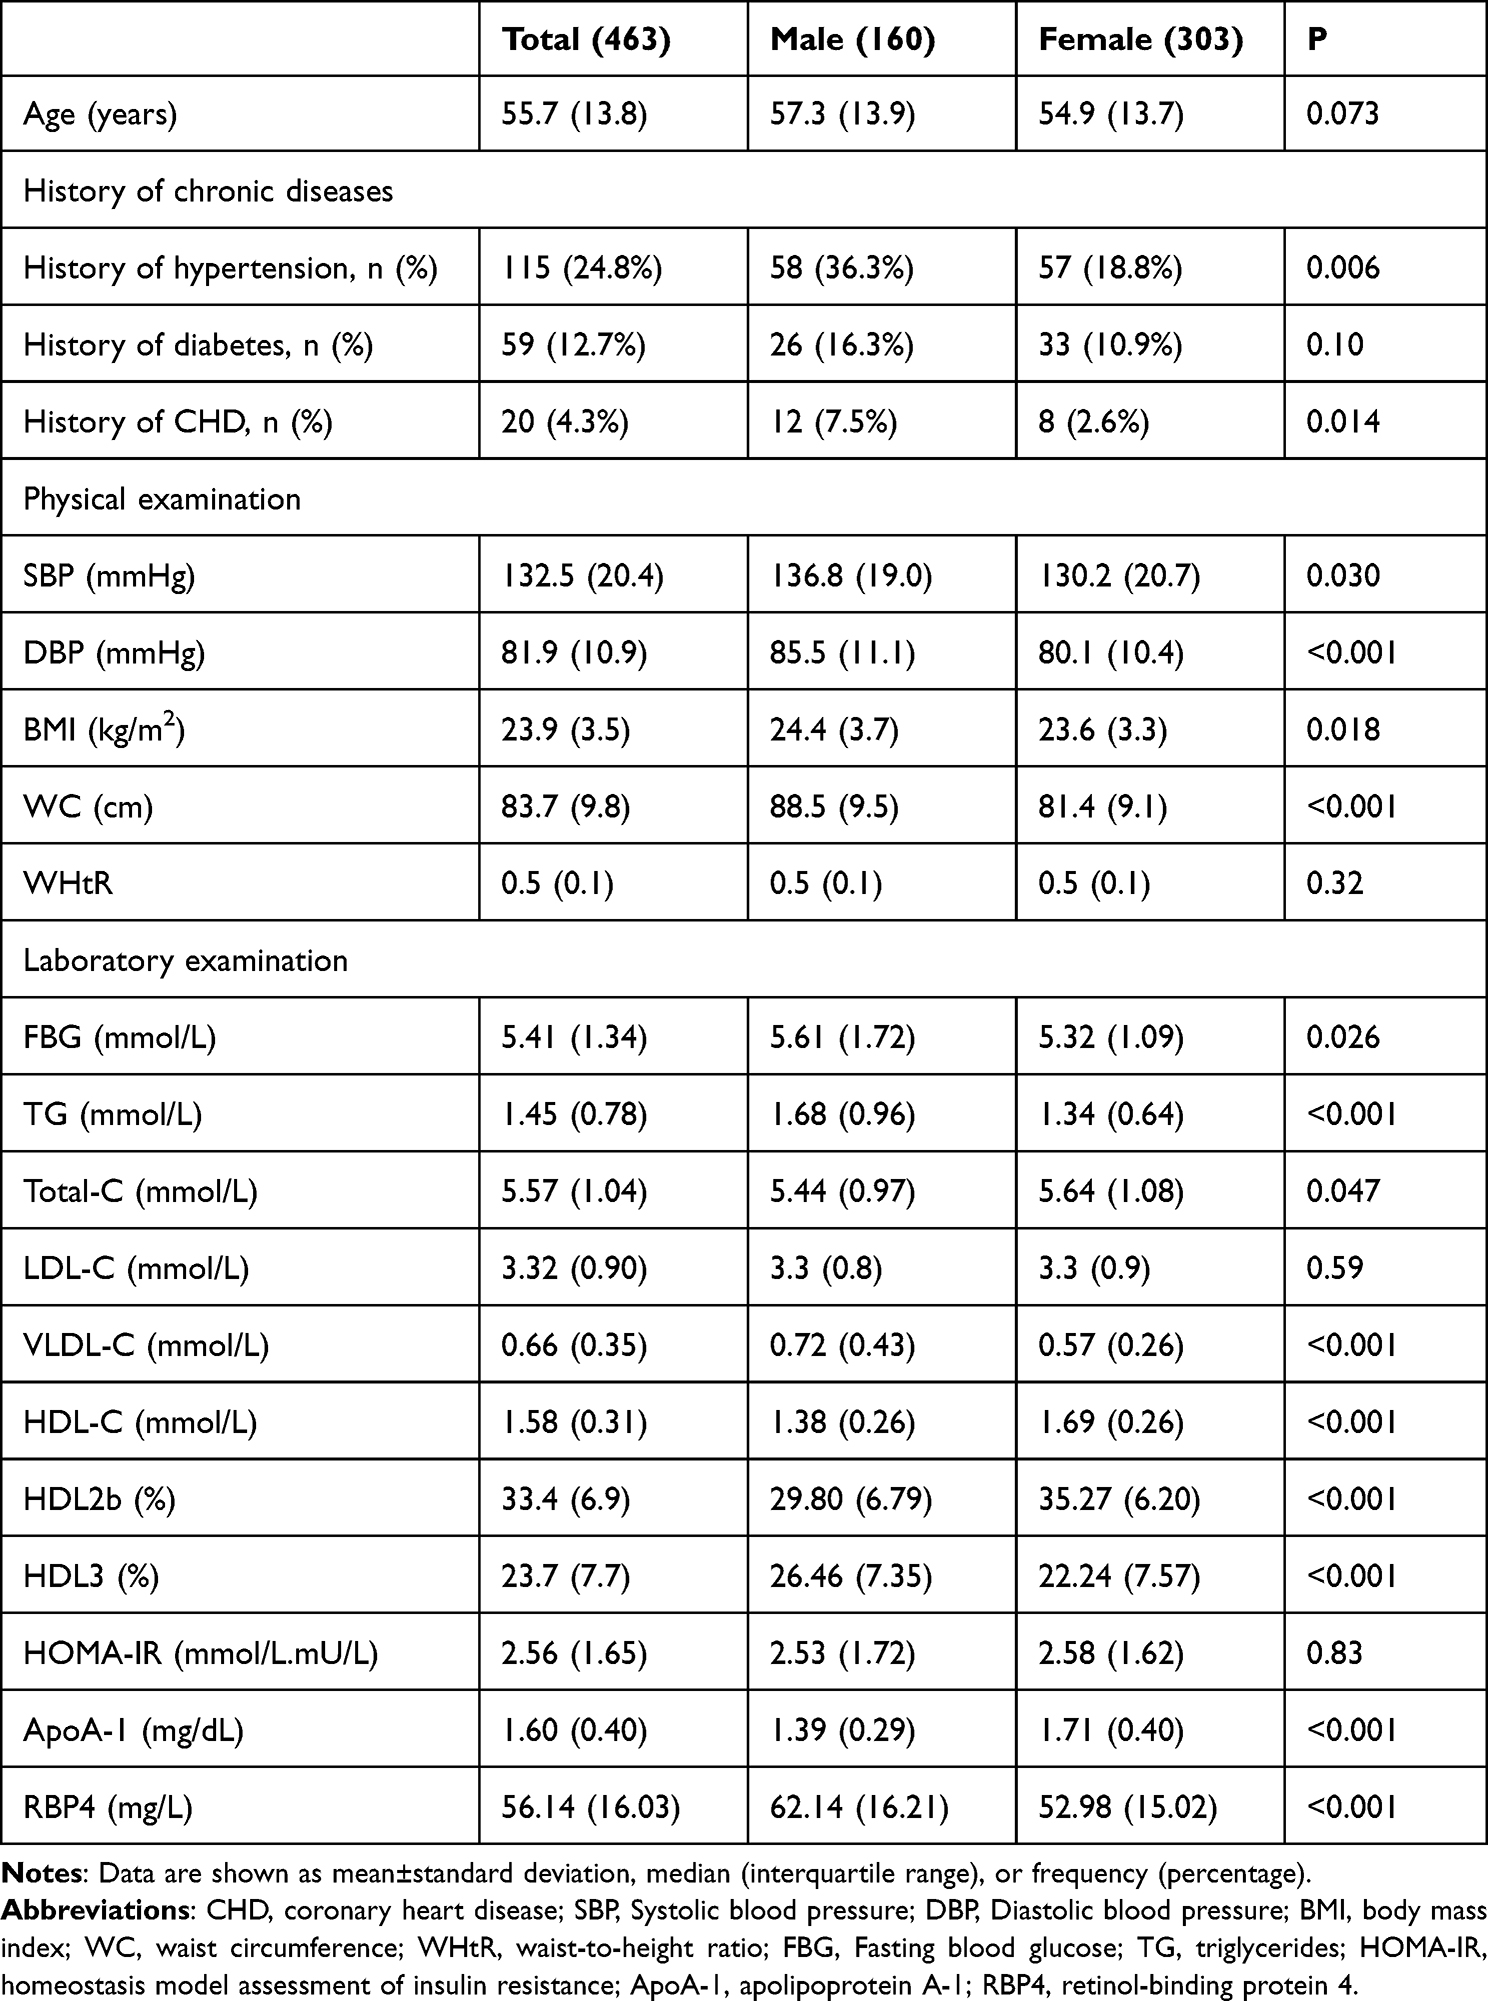 |
Table 1 Baseline Characteristics of the Study Population |
The participants were divided into quartiles based on HDL2b%, HDL3% and HDL-C. As shown in Table 2, HDL2b% and HDL-C were negatively associated with the risk of IR and MetS, whereas HDL3% was positively associated with the risk of IR and MetS in both genders. Compared to the lowest quartile, the highest quartile of HDL2b% (male: 17% verse 73%, 14% verse 65%; female: 12% verse 67%, 7% verse 44%) and HDL-C (male: 17% verse 70%, 20% verse 65%; female: 17% verse 58%, 9% verse 33%) had a significantly lower prevalence of IR and MetS, while the highest quartile of HDL3% (male: 62% verse 17%, 62% verse 23%; female: 64% verse 15%, 42% verse 6%) had a significantly higher prevalence of IR and MetS.
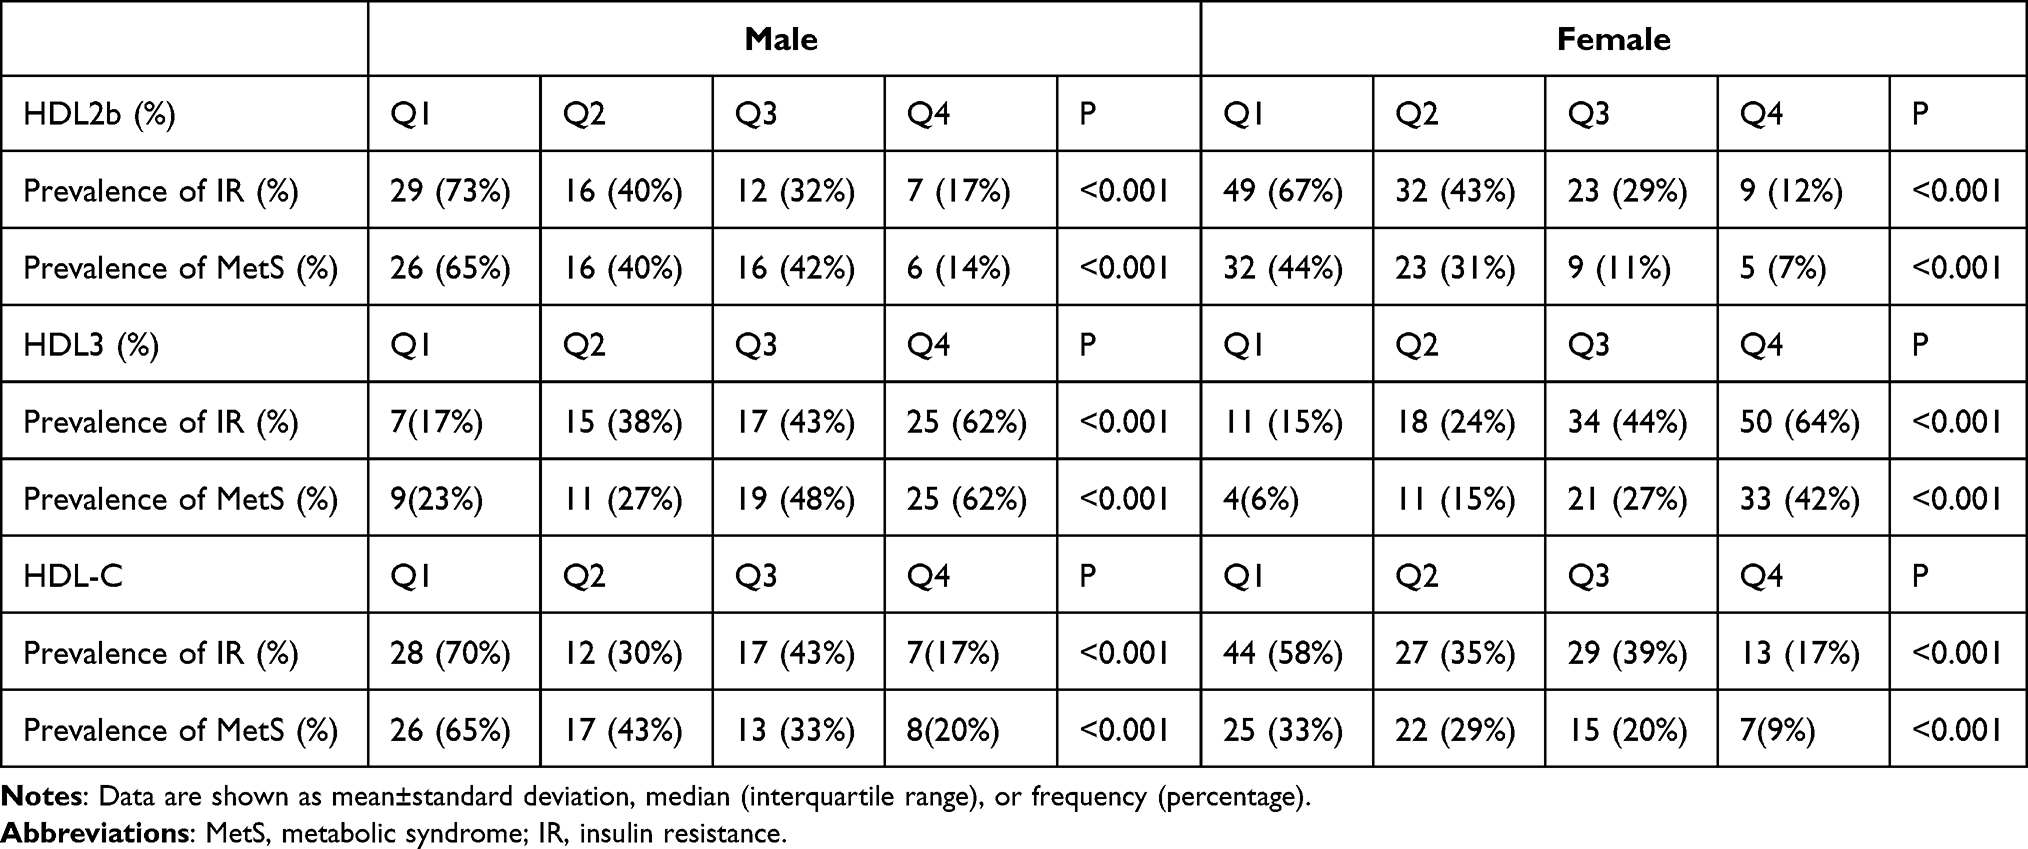 |
Table 2 The Prevalence of IR and MetS in the Population Stratified by Quartile of HDL2b (%), HDL3 (%), HDL-C |
Clinical Characteristics Grouped by HDL2b Interquartile Range in Different Gender Populations
According to the previous studies discussed in introduction part, the main analyses in this section were made around HDL2b. Based on the quartile method, subjects of each sex were divided into four groups according to their HDL2b%. The mean ages of the four groups were comparable (Table 3). The prevalence rates of IR, MetS, and MetS components were significantly different between groups. These results indicate a negative association between HDL2b% and the risk of IR and MetS in both sexes. Male participants in the highest quartile of HDL2b% had a significantly lower prevalence of IR and MetS than those in the lowest quartile (P<0.01). Similarly, female subjects in the highest quartile of HDL2b% had a significantly lower prevalence of IR and MetS than those in the lowest quartile (P<0.01). Figure 1 illustrates the prevalence of the four components of MetS among the groups. Except for blood pressure, the other three components (obesity, blood glucose, and triglycerides) showed significant differences between groups in both sexes. As the HDL2b% increased, the prevalence of these components decreased. In terms of anthropometric indicators, BMI, WC, and WHtR differed significantly between the groups in both sexes (P<0.05), while blood pressure did not show significant differences. In terms of laboratory indicators, FBG, TG, HDL-C, HDL2b%, HDL3%, and HOMA-IR differed significantly between the groups in both sexes. As the HDL2b% increased, these indicators gradually decreased. Moreover, the levels of RBP4, an important component of HDL, and hs-CRP, a sensitive indicator of inflammation, were significantly lower in the highest quartile of HDL2b% than in the lowest quartile in both sexes (P<0.001). ApoA-1, a crucial protective protein of HDL, was significantly higher in the highest quartile (HDL2b% (P<0.001).
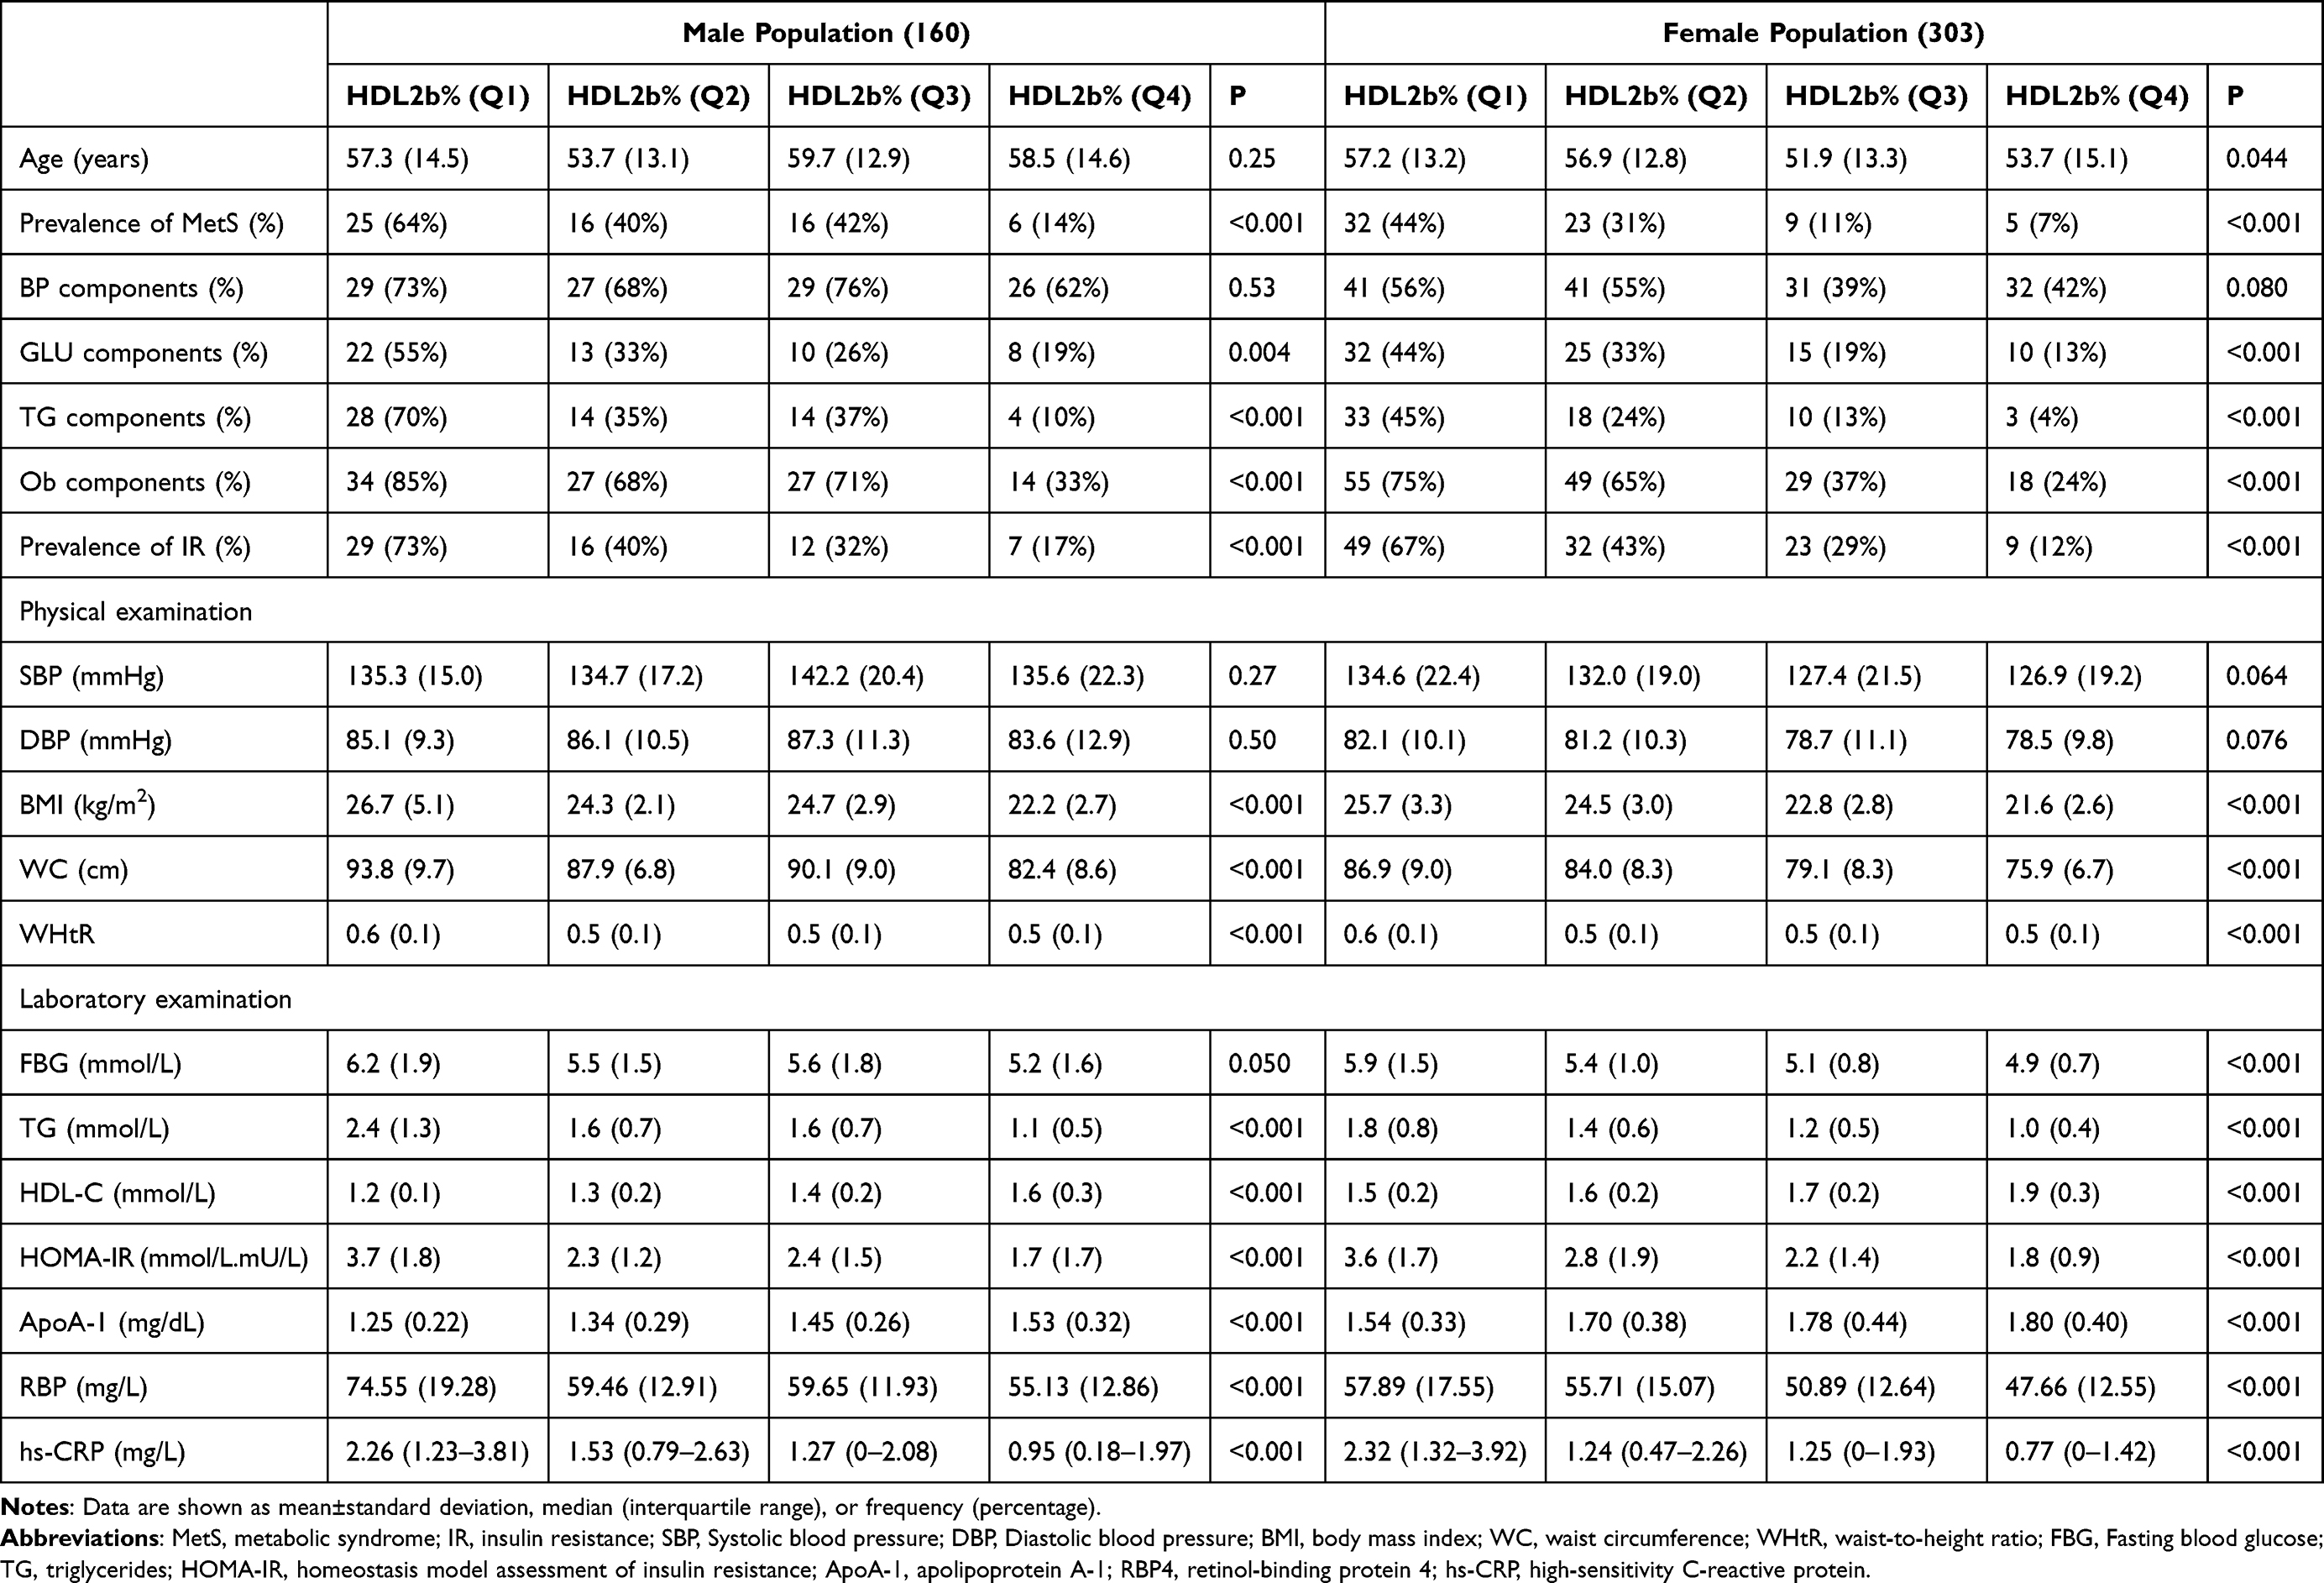 |
Table 3 Clinical Characteristics of Population Grouped by HDL2b Interquartile Range |
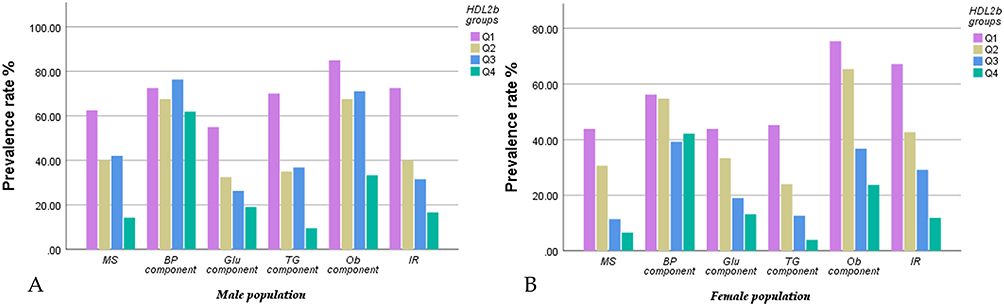 |
Figure 1 The incidence rate of components of metabolic syndrome and insulin resistance stratified by quartiles of HDL2b at baseline in different genders.((A) Males; (B) Females) Except for BP components, as the HDL2b% increased, the prevalence of other components decreased. The subjects with the highest quartile of HDL2b% had a significantly lowest prevalence of IR and MetS than other groups in both genders. |
HDL Subclass Ratio in Groups with Different Numbers of MetS Components
This study stratified the research population into five groups (0,1,2,3,4) according to the number of MetS components. The groups were compared in terms of the distribution ratio of HDL2b. The male group consisted of 19, 45, 32, 39, and 25 subjects, whereas the female group consisted of 84, 92, 58, 42, and 27 subjects, respectively. Table 4 displays the HDL2b% and HDL3% for different sexes and MetS components. Table 4 shows that the mean value of HDL2b% decreased and that of HDL3% increased as the number of MetS components increased. The differences between the groups were statistically significant. Interestingly, HDL-C levels remained within the normal range in both sexes regardless of the number of MetS components. This suggests that the HDL subclass undergoes compositional changes before HDL-C levels decline, in the presence of metabolic disorders. One-way analysis of variance revealed significant differences in HDL subclasses among the different groups of MetS components for both sexes (P<0.001).
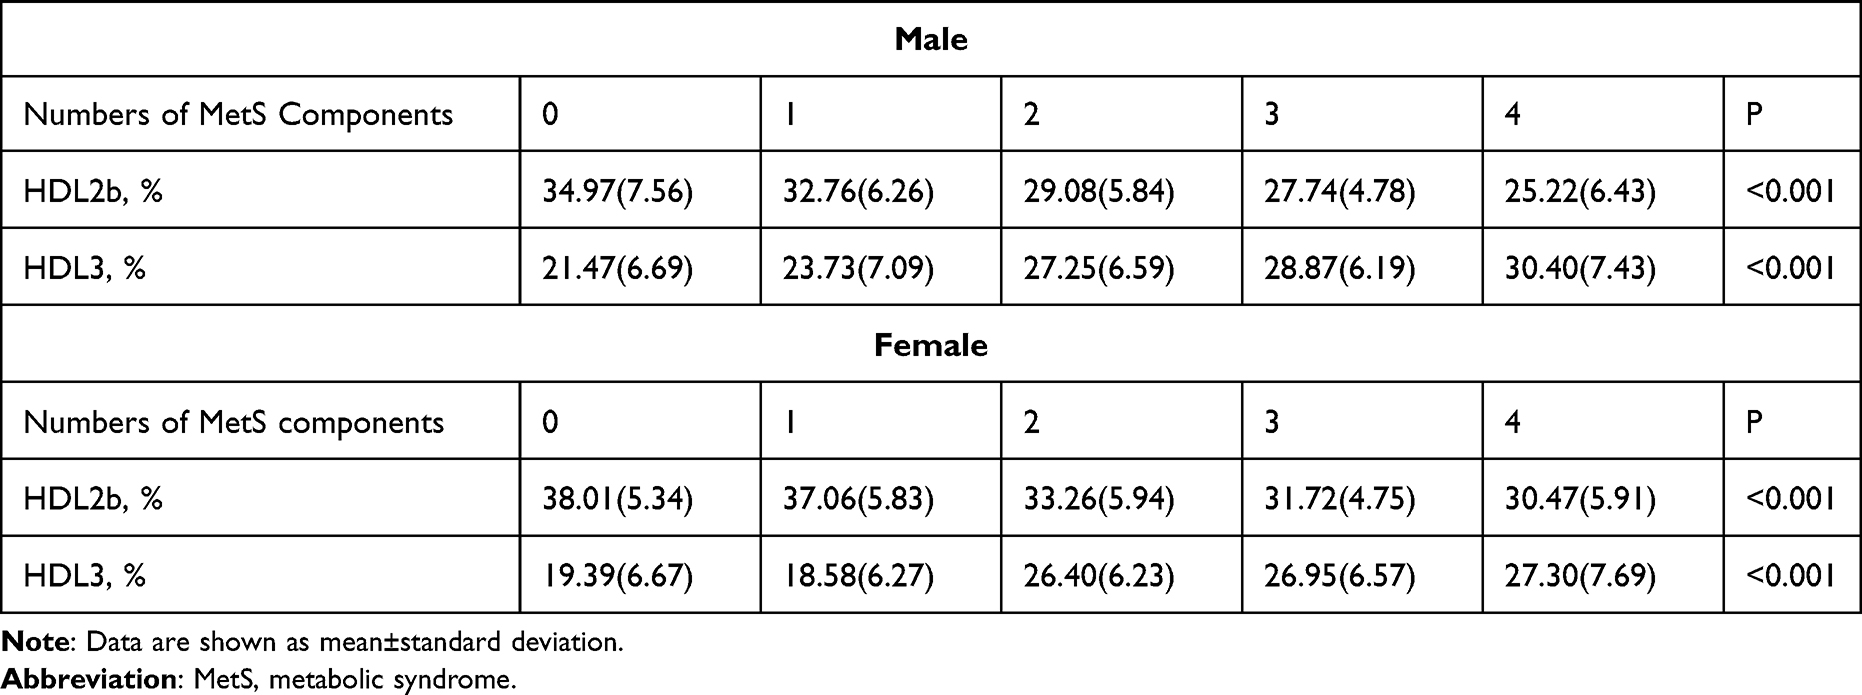 |
Table 4 High-Density Lipoprotein Subclass Distribution in Groups with Different Numbers of Metabolic Syndrome Components |
Correlation Between HDL Subclass and Metabolic Risk Factors
Table 5 presents the correlations between HDL2b% and HDL-C with metabolic risk factors using Pearson’s correlation analysis as the analytical method. The results showed that HDL2b% was more strongly associated with metabolic risk factors than HDL-C in both sexes. In the male population, HDL2b% exhibited a moderate correlation (r>0.4) with BMI, WC, WHtR, TG, IRI, and RBP4 and showed a weak correlation with FPG (r=0.263) and hs-CRP (r=0.257). There was no significant correlation between HDL2b% and SBP or DBP. HDL3% showed a moderate correlation with TG (r=0.421) and a weak correlation (r<0.3) with FBG, RBP4, and IRI. DBP was slightly correlated with HDL3%, but there was no significant correlation between HDL3% and the other indicators. Compared with HDL2b%, the correlations between HDL-C and BMI, WC, WHtR, TG, IRI, RBP4, FBG, and hs-CRP were weaker (r<0.4).
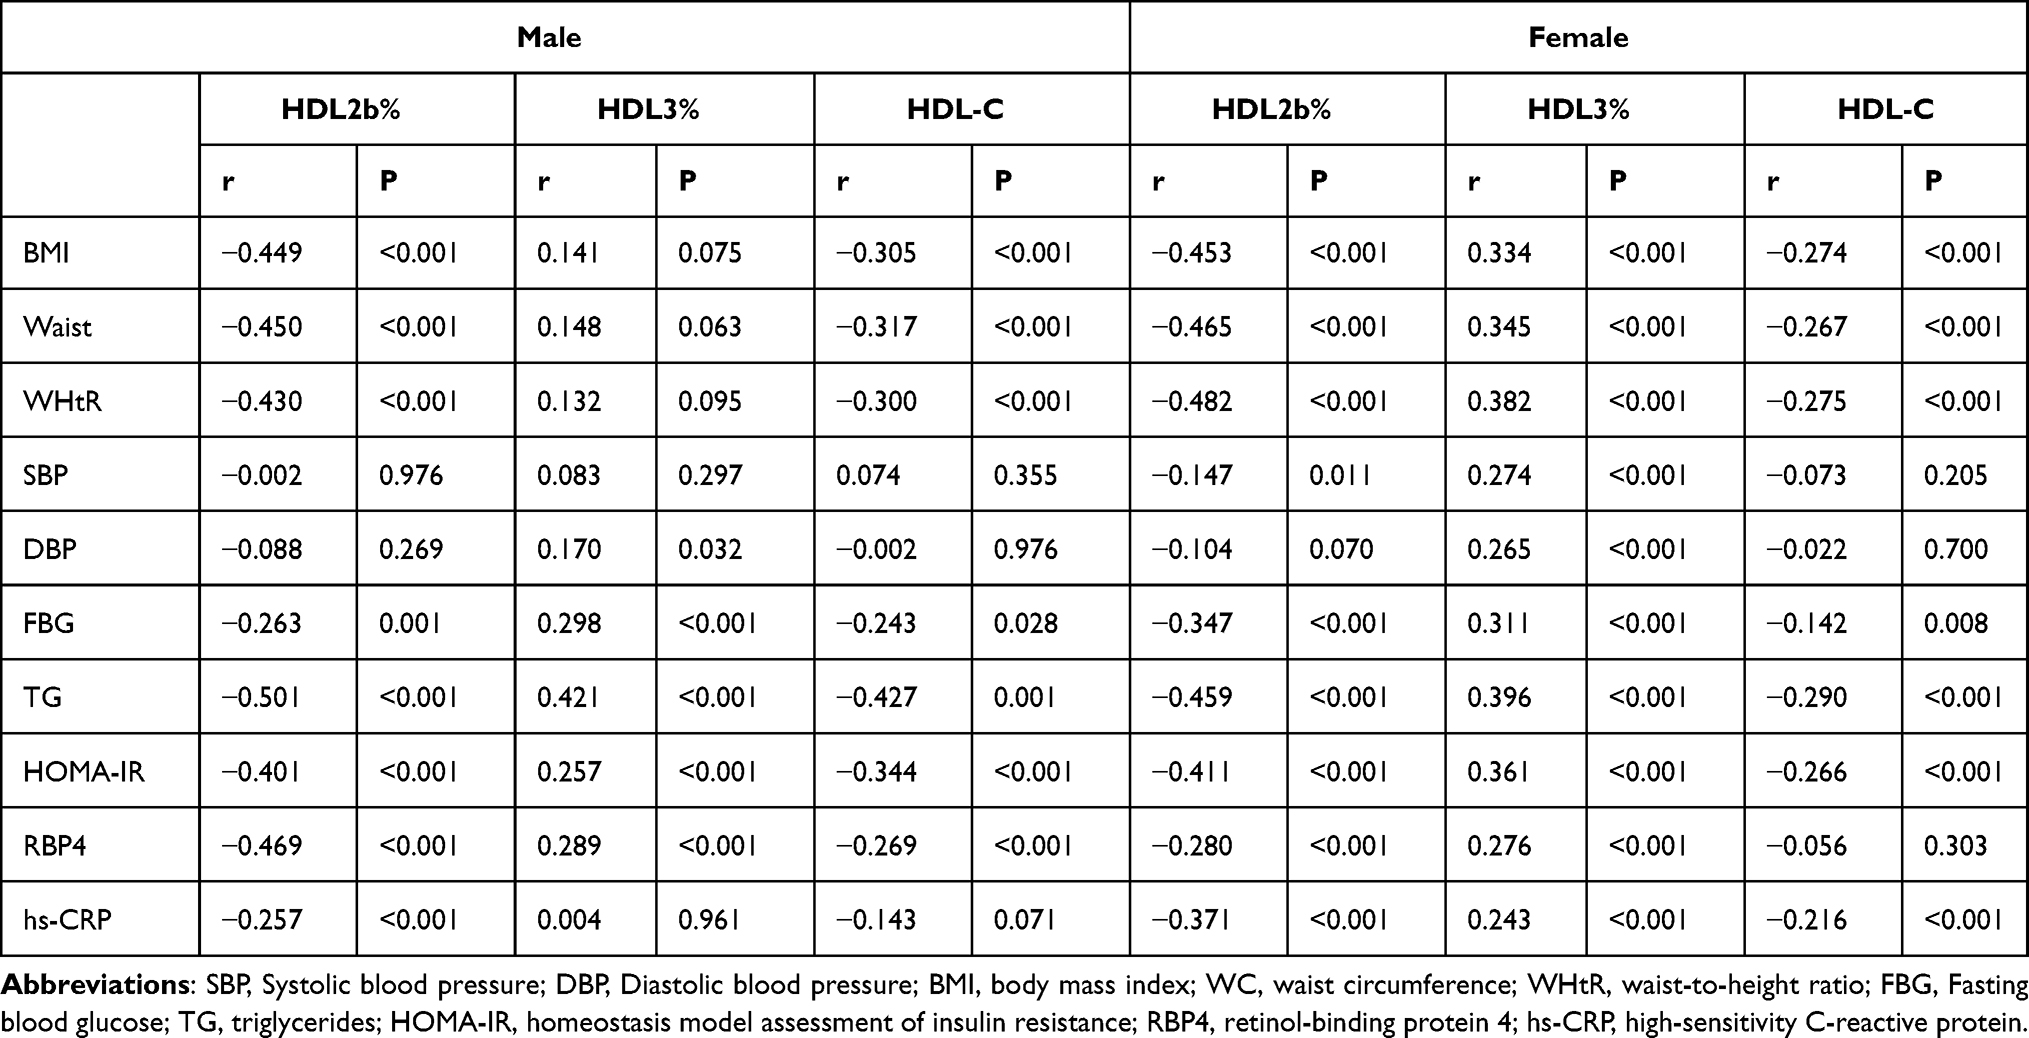 |
Table 5 Correlation Between High-Density Lipoprotein Subclass and Metabolic Risk Factors |
In the female population, HDL2b% showed a moderate correlation with BMI, WC, WHtR, TG, and IRI and a weak correlation with RBP4, FBG, and hs-CRP. However, there was still no significant relationship between HDL2b% and SBP or DBP. Interestingly, HDL3% exhibited a weak correlation with all aforementioned indicators. Compared to HDL2b%, HDL-C showed a weaker correlation with BMI, WC, WHtR, TG, IRI, FBG, and hs-CRP and no significant relationship with RBP4, SBP, and DBP.
Reasons for the sex differences may be the differences in the sample size; there were 160 individuals in the male population and 303 individuals in the female population. However, sex disparities in lipid metabolism cannot be ignored. These results indicate that HDL2b% has a stronger correlation with anthropometric indicators, blood lipids, blood glucose, IR, RBP4, and hs-CRP than HDL-C. Moreover, HDL3% showed a better relationship with blood pressure than HDL2b% and HDL-C level.
Comparison of the Predictive Ability of HDL Subclass for IR
ROC curve analysis and comparisons were performed to evaluate the diagnostic value of HDL2b%, HDL3%, HDL-C, TC, and LDL-C and other risk factors associated with IR (WC, FBG, BP, TG/HDL) for IR. Table 6 and Figure 2 provide the detailed information for this analysis. Since HDL2b% and HDL-C were negatively correlated with IR, we took the reciprocal form (1/HDL2b% and 1/HDL-C) to make it positively correlated with outcome variables, like other indicators. We added the TG/HDL index, since it is expected that the TG/HDL ratio might be sufficient to identify those with IR. However, TG/HDL combines the advantages of both TG and HDL indices, and with no doubt, has a stronger predictive ability. Therefore, similarly, we combined TG with HDL2b% in the same way, and created a new index, TG/HDL2b%, to facilitate the comparison of the two indices. All risk indices were ranked according to the AUC.
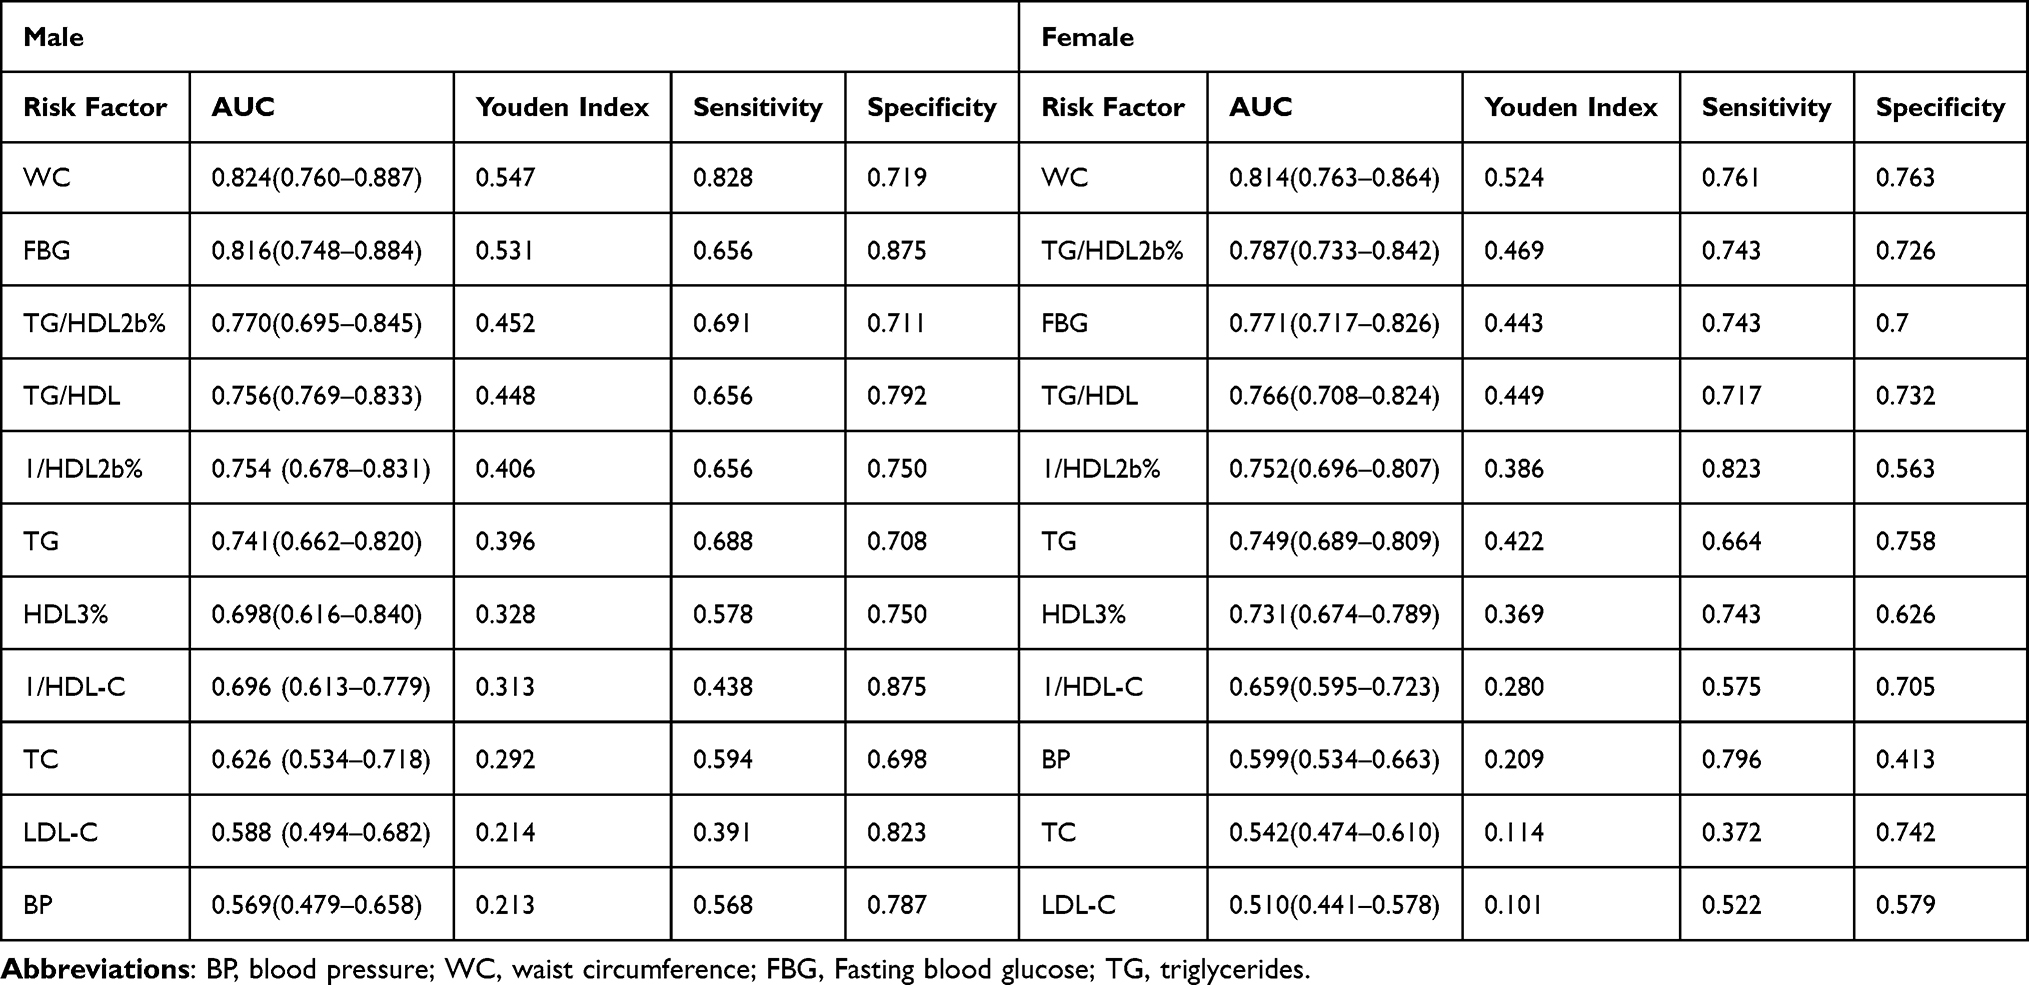 |
Table 6 The Areas Under ROC Curve (AUC), Sensitivity and Specificity for HDL Subclass in Diagnostic Capability for Insulin Resistance |
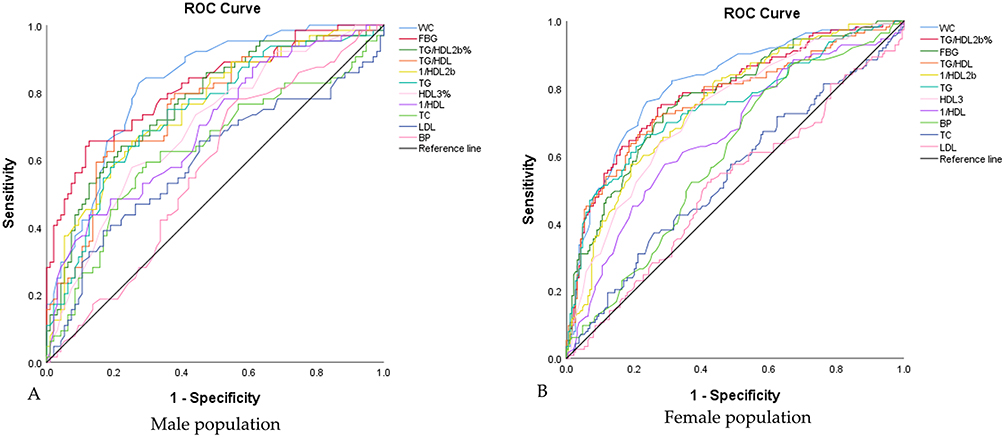 |
Figure 2 Receiver operator characteristic curves of HDL subclass, lipid profiles and other metabolic risk factors for diagnostic capability for insulin resistance in different genders.((A) Males; (B) Females). |
In the male population, the highest AUC was WC (AUC: 0.824), followed by FBG (AUC: 0.816) and TG/HDL2b% (AUC: 0.770). HDL2b% as a single index, AUC (0.754) was superior to TG, HDL3%, HDL-C, TC, LDL-C, BP. And TG/HDL2b% (AUC: 0.770) as a novel combination index was better than TG/HDL (AUC: 0.756). In the female population, the highest AUC was WC (AUC=0.814), followed by TG/HDL2b% (AUC: 0.787) and FBG (AUC: 0.771). Similar to the male population, HDL2b% as a single index, predictive ability (AUC: 0.752) was superior to TG, HDL3%, HDL-C, TC, LDL-C, BP, similarly, TG/HDL2b% also performed better than TG/HDL.
These findings revealed that HDL2b% had a stronger association with IR than HDL-C itself, even though it was less correlated with IR than WC and FBG. Moreover, we introduced a novel index, TG/HDL2b%, which incorporated both TG and HDL2b%, and demonstrated that it had a superior correlation with IR than the conventional index TG/HDL. These findings suggested that HDL subclasses could provide additional insights into the metabolic status of individuals with normal HDL-C levels, and that future studies could explore the potential of new indices that combine HDL subclass and traditional risk factors for IR.
Comparison of the Predictive Ability of HDL Subclass for MetS
This study assessed the diagnostic value of HDL2b%, HDL3%, HDL-C, LDL-C, and TC for MetS using ROC curve analysis and comparison. Table 7 and Figure 3 present the results of the analysis. We also used a reciprocal approach to obtain HDL2b% and HDL-C levels with the same tendency as the other markers in the ROC curve analysis. The results indicated that 1/HDL2b% had the highest diagnostic value for MetS among the lipid indices in both sexes with normal HDL-C levels. In the male population, HDL2b% had an AUC of 0.733 (0.655–0.811) and a Youden index of 0.401. It has a sensitivity of 0.891 and specificity of 0.509, which are higher than those of HDL3% (AUC,0.697; Youden index,0.349) and conventional HDL-C (AUC:0.709, Youden index:0.323), as well as the other lipid indices LDL-C (AUC:0.546, Youden index:0.203) and TC (AUC:0.627, Youden index:0.224). These lipid indices do not have significant advantages in the diagnostic value of MetS over HDL2b%. In the female population, HDL2b% demonstrated the best diagnostic value for MetS, with an AUC of 0.746 (0.683–0.809), Youden index of 0.410, sensitivity of 0.739, and specificity of 0.671. Compared with HDL3% and other traditional lipid indicators, both the AUC and other indicators of HDL2b were higher, indicating that HDL2b% had a better diagnostic value than HDL3% and other lipid indicators in the female population.
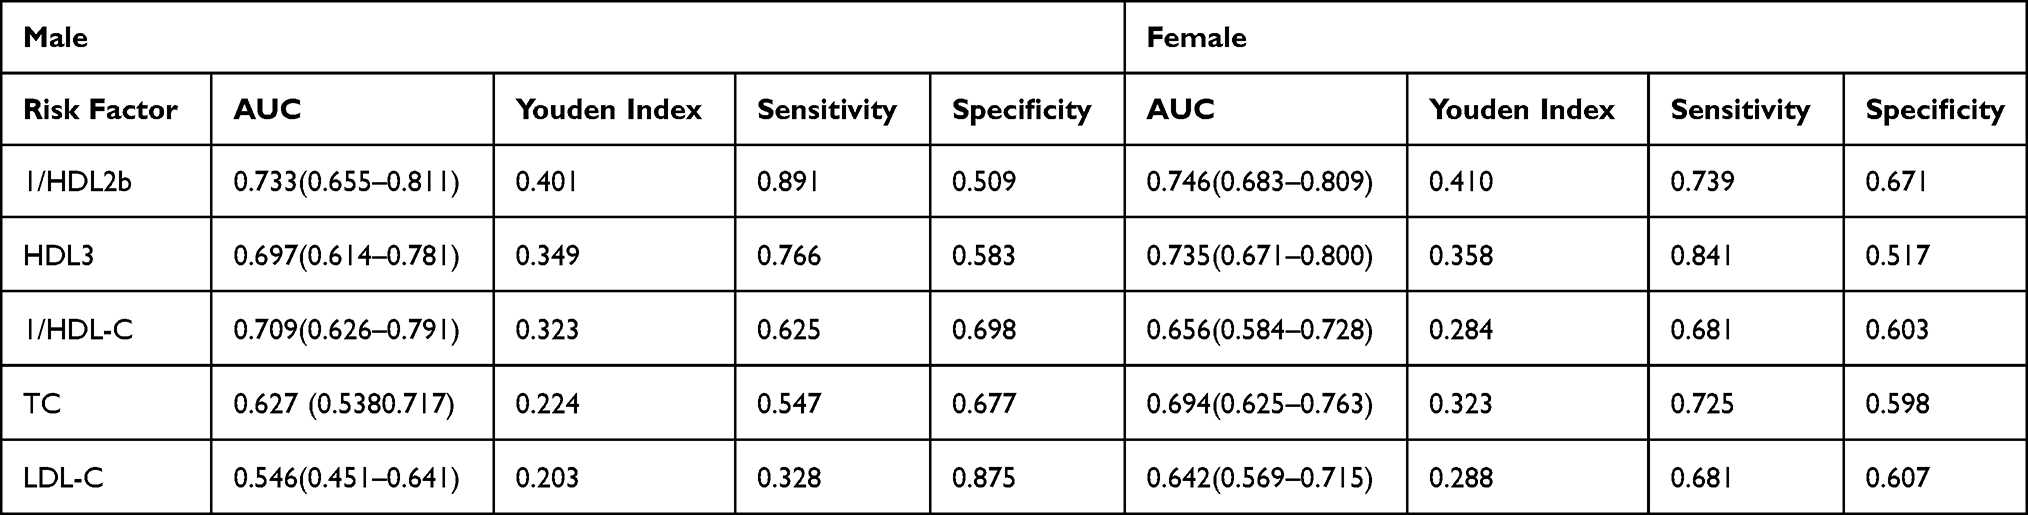 |
Table 7 The Areas Under ROC Curve (AUC), Sensitivity and Specificity for HDL Subclass in Diagnostic Capability for Metabolic Syndrome |
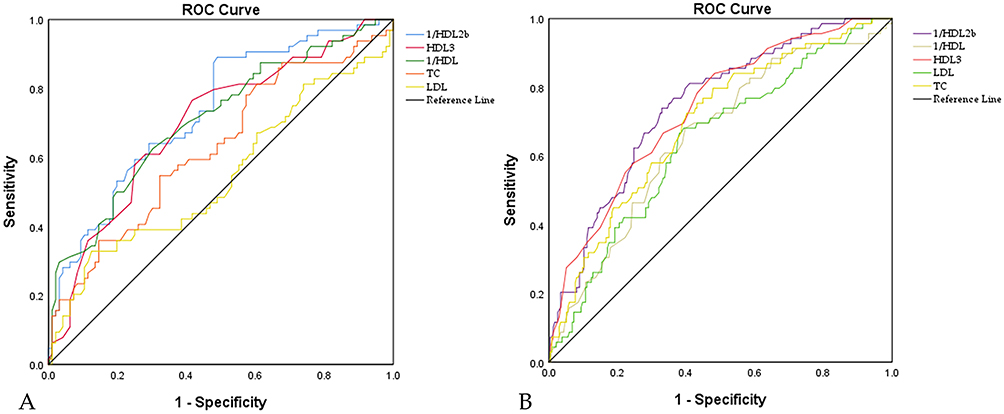 |
Figure 3 Receiver operator characteristic curves of HDL subclass and lipid profiles for diagnostic capability for metabolic syndrome in different genders.((A) Males; (B) Females). |
Discussion
Currently, the clinical evaluation of HDL primarily focuses on the measurement of total HDL cholesterol, which represents the combined cholesterol content of all HDL particles. However, several large-scale studies have indicated that HDL cholesterol levels may not always be linked to a lower risk of cardiovascular diseases.28,29 These results suggest that the assessment of HDL function may be more relevant than that of HDL-C plasma level. Therefore, it is important to note that HDL particles are not uniform but consist of various subclasses that differ in terms of density, migration characteristics, apoprotein content, and association with disease.30 In 1954, DeLalla and Gofman first described the HDL subclass distributions using analytic ultracentrifugation. They divided HDL subclasses into two types: the more dense, relatively cholesterol-poor form was classified as HDL3, and the less dense, relatively cholesterol-rich form as HDL2.31 After DeLalla’s initial research, Blanche et al found that HDL included additional subclasses of particles with different electrophoretic mobilities on non-denaturing polyacrylamide gradient gels, and identified three subclasses of HDL3 (HDL3c, HDL3b, and HDL3a) and two subclasses of HDL2 (HDL2a and HDL2b) based on their characterization of HDL particle size.32
Although several studies have been performed to investigate the relationship between HDL subclasses and cardiovascular diseases, the clinical utility of HDL subclasses may vary depending on the measurement method used. A literature review of 80 published investigations showed that HDL2 and HDL3 provide little clinical benefit over HDL cholesterol in identifying persons at risk for atherosclerosis or cardiovascular events through analyses of association studies, case-control comparisons, and prospective studies.24 One reason for this could be the inadequacy of HDL2 and HDL3 cholesterol to adequately characterize HDL heterogeneity. Another reason could be the limitations in the separation of HDL2 cholesterol and HDL3 cholesterol by precipitation, and some studies have found that environmental factors and disease conditions may affect the accuracy of precipitation results.33 In contrast, measurements of HDL2b provided more consistent evidence of CVD risk than HDL2 measurements. Seventy percent of correlation studies and 91% of case-control comparison studies demonstrated that lower HDL-2b levels were significantly correlated with CVD progression.24 This evidence suggests that measurements of HDL2b could be highly valuable in identifying individuals at risk for cardiovascular disease, managing patients with existing diseases, and evaluating the effectiveness of therapeutic treatments that improve the HDL subclass distribution. However, most studies employed the gradient gel electrophoresis (GGE) method to isolate HDL2b, and because this separation requires a long detection time, skilled technical operation, and extensive manpower, far fewer studies have reported HDL2b than HDL2 and HDL3.33,34 Therefore, many new, quick, easy, economical, efficient, interference-free, and safe approaches for HDL subclass isolation and measurement have emerged.
Microfluidic chip technology,21,35–39 similar to other new techniques in clinical lipid measurements such as vertical auto profile (VAP),40 nuclear magnetic resonance spectroscopy (NMRS),41,42 electrospray differential mobility analysis (ES-DMA),43 and liquid chromatography-mass spectrometry (LC-MS),44 is becoming increasingly mature. Previous studies have shown that microfluidic chip technology has since been used in T2DM,21,37 obesity,27 atherosclerosis38 and polycystic ovarian syndrome.36 The clinical application of these new techniques has significantly promoted the use of lipoprotein subtypes in the risk stratification of cardiovascular diseases. Briefly, microfluidic chip technology is an analytical method that uses electric fields to drive ions or molecules in complex samples through microchannels on glass, quartz, plastic, and other substrates and separates multiple components rapidly and efficiently based on their differences in electrophoretic or partitioning behaviors in nanoliter-scale molecular sieve media.44,45 The advantage of this technology is that it integrates the entire analysis process on a micrometer-scale chip, which can realize online automated interpretation of samples and detect nearly hundred samples at a time, with the characteristics of accuracy, reliability, speed, and convenience. The entire process was conducted within one hour. However, the current chip production has not been standardized and regulated, and there is still room for improvement in achieving automation and high-throughput detection. Moreover, clinically relevant evidence is still lacking and further clinical validation is required. Therefore, this study used this technology to measure the HDL subclass of the community population to provide a basis for the future use of this technology for the early screening and prevention of metabolic syndrome.
The association between cardiovascular disease and HDL subclass has been widely investigated in many studies; however, a sufficient number of studies that have investigated HDL subclass, particularly HDL2b, in relation to metabolic syndrome are lacking. Several studies have discussed the correlation between the HDL subclasses and MetS. Previous studies have demonstrated that as the number of MetS components increases, the HDL phenotype comprises a greater percentage of small HDL-3 and fewer large HDL-2 subclasses, resulting in a decreased HDL-2/HDL-3 ratio in different populations and ethnic groups. Additionally, an inverse association between the HDL subclass (HDL2 and HDL3) and insulin resistance and systemic inflammation has also been reported.22,23,46–48 The results of the present study were consistent with those of previous studies. Our research found that HDL2b distribution was significantly correlated with anthropometric indicators (BMI, waist circumference, and waist height ratio), TG, FBG, insulin resistance index, and hs-CRP. Furthermore, HDL2b levels were strongly correlated with insulin resistance and metabolic syndrome. ROC analysis also found that predictive ability of HDL2b% was better than HDL-C, and additionally, TG/HDL2b%, a new index that combined TG and HDL2b%, was better than the conventional index TG/HDL which is expected to identify those with IR sufficiently. These results suggested that HDL subclasses, especially HDL2b, could provide additional insights into the metabolic status of individuals with normal HDL-C levels.
However, several differences between our study and previous studies should be noted. First, HDL2, HDL3, and the HDL2/HDL3 ratio were chosen as measures of HDL subclass in the vast majority of studies, but it has been previously noted that HDL2 and HDL3 might not adequately represent HDL heterogeneity.29 HDL2b, which provides more consistent evidence, was selected for this study. Second, similar results were observed in the KMSRI-Seoul Study.47 This study also found that HDL2b separated using gradient gel electrophoresis significantly reduced the risk of MetS in both males and females. However, this study did not apply restrictions on the plasma HDL-C levels in the study population. Previous evidence has revealed that HDL subclass distributions are significantly correlated with the standard laboratory measurements of HDL cholesterol. Within certain ranges, these standard measurements can predict subclass distributions with sufficient accuracy to allow limited clinical utility.24 For example, individuals with high or low HDL-C levels frequently have high/low HDL2b%. Therefore, HDL subclass testing may be most clinically informative in patients with mid-range HDL cholesterol, especially in patients with low HDL2b but relatively “normal” HDL cholesterol. Subsequently, an inexpensive exercise intervention could help these patients increasing HDL2b easily.49 In this situation, the early detection of patients with “normal” HDL-C levels could save considerable medical and economic resources. This study enrolled only individuals with normal HDL-C level, meanwhile, the mean HDL-C levels in both males (1.38 mmol/L) and females (1.69 mmol/L) were close to the clinical diagnosis of decreased HDL-C level (males < 1.04 mmol/L or females < 1.30 mmol/L) for MetS. Thus, measurement of HDL subclass for the population with relatively “normal” HDL-C levels could provide greater value in clinical utility compared to those with low or high HDL-C levels. Third, previous studies have highlighted the differences in HDL functionality among different populations. There are several reasons for this discrepancy, including genetic variations,50 racial and sex differences,51,52 different patterns of lifestyle and diet,53 and regional factors.54 In this case, the influences of race and region cannot be disregarded. The correlation between HDL subclass and MetS has been reported in white, black, Japanese, and Korean populations but has not been fully reported in the Chinese population, especially in community-based populations, which could completely exert the value of early detection of MetS.
Our study had several limitations. (1) This was a small single-center study. All the results in this study can only be applied to the Chinese population and cannot be extrapolated to other countries. Larger, multicenter studies are required to confirm these findings. (2) It is previously mentioned that several methods are available for HDL separation based on different physicochemical characteristics of the HDL molecules like size, charge, density. HDL subclasses isolated using different separation methods may contain HDL particles that differ significantly in their properties; therefore, it is difficult to compare studies using different separation methods. (3) Owing to the cross-sectional nature of the present study, a causal relationship could not be established. Future research should focus on improving cohort studies to explore this relationship.
In conclusion, this study found that the composition ratio of the HDL subclass changed because of metabolic disturbances even when the overall HDL-C level was within the normal range. Specifically, as the number of MetS components increased, the HDL subclass comprised a greater percentage of the small HDL-3 subclasses and a lower percentage of the large HDL-2b subclasses. The decline in HDL2b% was inversely associated with factors that define MetS and insulin resistance. Moreover, the HDL2b subclass can refine IR and MetS risk profiles better than HDL-C levels alone, and is expected to be an important diagnostic basis for early screening. Further HDL subclass studies with large populations and in various regions are warranted to validate its clinical value.
Ethical Approval
The epidemiological investigation was approved by the Ethics Committee of the Third Affiliated Hospital of Southern Medical University and complied with the Declaration of Helsinki.
Author Contributions
All authors made a significant contribution to the work reported, whether that is in the conception, study design, execution, acquisition of data, analysis and interpretation, or in all these areas; took part in drafting, revising or critically reviewing the article; gave final approval of the version to be published; have agreed on the journal to which the article has been submitted; and agree to be accountable for all aspects of the work.
Funding
We would like to express our gratitude to all the subjects who participated in the study, which was supported by Municipal Science and Technology Innovation Commission University Stability Support Project (Project No.2020082 2123122001) and also supported by Key technical projects of the Municipal Science and Technology Innovation Commission (Project No. JSGG2020022515 2709802) and National Natural Science Fund (Project No. 81873620), and also supported by Provincial Natural Science Fund (Project No.2021A151501 0972).
Disclosure
The authors declare that they have no competing interest.
References
1. Yu H, Wen Q, Lv J, et al. Association between dietary patterns reflecting C-reactive protein and metabolicSyndrome in the Chinese population. Nutrients. 2022;14(13):1.
2. Wang H, Wang Y, Shi Z, et al. Association between dietary patterns and metabolic syndrome and modification effect of altitude: a cohort study of Tibetan Adults in China. Nutrients. 2023;15(9):1.
3. Liu X, Shi S, Sun J, et al. The influence of male and female overweight/obesity on IVF outcomes: a cohort study based on registration in Western China. Reprod Health. 2023;20(1):3. doi:10.1186/s12978-022-01558-9
4. Barter P, Gotto AM, LaRosa JC, et al. HDL cholesterol, very low levels of LDL cholesterol, and cardiovascular events. N Engl J Med. 2007;357(13):1301–1310. doi:10.1056/NEJMoa064278
5. Holmes MV, Millwood IY, Kartsonaki C. Lipids, lipoproteins, and metabolites and risk of myocardial infarction and stroke. J Am Coll Cardiol. 2018;71(6):620–632. doi:10.1016/j.jacc.2017.12.006
6. Kaze AD, Santhanam P, Musani SK, et al. Metabolic dyslipidemia and cardiovascular outcomes in type 2 diabetes mellitus: findings from the look AHEAD study. J Am Heart Assoc. 2021;10(7):e16947. doi:10.1161/JAHA.120.016947
7. Moradi H, Streja E, Kashyap ML, et al. Elevated high-density lipoprotein cholesterol and cardiovascular mortality in maintenance hemodialysis patients. Nephrol Dial Transplant. 2014;29(8):1554–1562. doi:10.1093/ndt/gfu022
8. E BW, L PJ, Anderson T, et al. Niacin in patients with low HDL cholesterol levels receiving intensive statin therapy. N Engl J Med. 2011;365(24):2255–2267.
9. Keene D, Price C, J S-SM, et al. Effect on cardiovascular risk of high density lipoprotein targeted drug treatments niacin, fibrates, and CETP inhibitors: meta-analysis of randomised controlled trials including 117,411 patients. BMJ. 2014;349:g4379. doi:10.1136/bmj.g4379
10. Tziomalos K. High-density lipoprotein: quantity or quality? J Thorac Dis. 2016;8(11):2975–2977. doi:10.21037/jtd.2016.11.67
11. Cho KH. The current status of research on High-Density Lipoproteins (HDL): a paradigm shift from HDL quantity to HDL quality and HDL functionality. Int J Mol Sci. 2022;23(7):1.
12. K JG, Osadnik K, Lejawa M, et al. ”Obesity and insulin resistance” is the component of the metabolic syndrome MostStrongly associated with oxidative stress. Antioxidants. 2021;11(1). doi:10.3390/antiox11010079
13. Jakubiak GK, Cieslar G, Stanek A. Nitrotyrosine, nitrated lipoproteins, and cardiovascular dysfunction in patients with type 2 diabetes: what do we know and what remains to be explained? Antioxidants. 2022;11(5). doi:10.3390/antiox11050856
14. Khera AV, Cuchel M, de la Llera-Moya M, et al. Cholesterol efflux capacity, high-density lipoprotein function, and atherosclerosis. N Engl J Med. 2011;364(2):127–135. doi:10.1056/NEJMoa1001689
15. Camont L, Chapman MJ, Kontush A. Biological activities of HDL subpopulations and their relevance to cardiovascular disease. Trends Mol Med. 2011;17(10):594–603. doi:10.1016/j.molmed.2011.05.013
16. Drexel H, W AF, Rentsch K, et al. Relation of the level of high-density lipoprotein subfractions to the presence and extent of coronary artery disease. Am J Cardiol. 1992;70(4):436–440. doi:10.1016/0002-9149(92)91186-8
17. Krauss RM. Lipoprotein subfractions and cardiovascular disease risk. Curr Opin Lipidol. 2010;21(4):305–311. doi:10.1097/MOL.0b013e32833b7756
18. Hwang Y-C, Fujimoto WY, Kahn SE, et al. Higher High Density Lipoprotein 2 (HDL2) to total HDL cholesterol ratio is associated with a lower risk for incident hypertension. Diabetes Metab J. 2019;43(1):114–122. doi:10.4093/dmj.2018.0053
19. Yang Y, Yan B, Fu M, et al. Relationship between plasma lipid concentrations and HDL subclasses. Clin Chim Acta. 2005;354(1–2):49–58. doi:10.1016/j.cccn.2004.11.015
20. Zeljkovic A, Vekic J, Spasojevic-Kalimanovska V, et al. LDL and HDL subclasses in acute ischemic stroke: prediction of risk and short-term mortality. Atherosclerosis. 2010;210(2):548–554. doi:10.1016/j.atherosclerosis.2009.11.040
21. Mueller O, Chang E, Deng D, et al. PROCAM study: risk prediction for myocardial infarction using microfluidic high-density lipoprotein (HDL) subfractionation is independent of HDLcholesterol. Clin Chem Lab Med. 2008;46(4):490–498. doi:10.1515/CCLM.2008.117
22. G LK, D FT, Tsimihodimos V, et al. Alterations in the high density lipoprotein phenotype and HDL-associated enzymes in subjects with metabolic syndrome. Lipids. 2009;44(1):9–16. doi:10.1007/s11745-008-3251-9
23. Yang HS, Hur M, Kim H, et al. HDL subclass analysis in predicting metabolic syndrome in Koreans with high HDL cholesterol levels. Ann Lab Med. 2020;40(4):297–305. doi:10.3343/alm.2020.40.4.297
24. Superko H, Pendyala L, Williams PT, et al. High-density lipoprotein subclasses and their relationship to cardiovascular disease. J Clin Lipidol. 2012;6(6):496–523. doi:10.1016/j.jacl.2012.03.001
25. Chen T, Wang X, Wang X, et al. Comparison of novel metabolic indices in estimation of chronic kidney diseases in a Southern Chinese population. Diabetes Metab Syndr Obes. 2020;13:4919–4927. doi:10.2147/DMSO.S286565
26. G AK, H ER, M GS, et al. Harmonizing the metabolic syndrome: a joint interim statement of the International Diabetes Federation Task Force on Epidemiology and Prevention; National Heart, Lung, and Blood Institute; American Heart Association; World Heart Federation; International Atherosclerosis Society; and International Association for the Study of Obesity. Circulation. 2009;120(16):1640–1645.
27. Hanley AJG, Williams K, Gonzalez C, et al. Prediction of type 2 diabetes using simple measures of insulin resistance: combined results from the San Antonio Heart Study, the Mexico City Diabetes Study, and the Insulin Resistance Atherosclerosis Study. Diabetes. 2003;52(2):463–469. doi:10.2337/diabetes.52.2.463
28. Brassard D, J AB, Boyer M, et al. Saturated fats from butter but not from cheese increase HDL-Mediated CholesterolEfflux capacity from J774 macrophages in men and women with abdominal obesity. J Nutr. 2018;148(4):573–580. doi:10.1093/jn/nxy014
29. Smith JD. Dysfunctional HDL as a diagnostic and therapeutic target. Arterioscler Thromb Vasc Biol. 2010;30(2):151–155. doi:10.1161/ATVBAHA.108.179226
30. Rosenson RS, Brewer HJ, Chapman MJ, et al. HDL measures, particle heterogeneity, proposed nomenclature, and relation to atherosclerotic cardiovascular events. Clin Chem. 2011;57(3):392–410. doi:10.1373/clinchem.2010.155333
31. Wilcox HG, Davis DC, Heimberg M. The isolation of lipoproteins from human plasma by ultracentrifugation in zonalrotors. J Lipid Res. 1971;12(2):160–172. doi:10.1016/S0022-2275(20)39526-2
32. Blanche PJ, Gong EL, Forte TM, et al. Characterization of human high-density lipoproteins by gradient gel electrophoresis. Biochim Biophys Acta. 1981;665(3):408–419. doi:10.1016/0005-2760(81)90253-8
33. Movva R, Rader DJ. Laboratory assessment of HDL heterogeneity and function. Clin Chem. 2008;54(5):788–800. doi:10.1373/clinchem.2007.101923
34. Tian L, Fu M. The relationship between high density lipoprotein subclass profile and plasma lipids concentrations. Lipids Health Dis. 2010;9:118. doi:10.1186/1476-511X-9-118
35. Tang H, Xiang Z, Li L, et al. Potential role of anti-inflammatory HDL subclasses in metabolic unhealth/obesity. Artif Cells Nanomed Biotechnol. 2021;49(1):565–575. doi:10.1080/21691401.2021.1961798
36. Hu W, Chen L, Mao S, et al. A case-control study on reduced HDL2b in patients with polycystic ovarian syndrome. Gynecol Endocrinol. 2016;32(10):848–851. doi:10.1080/09513590.2016.1182151
37. Xian X, Ma Y, D YD, et al. Reduced high-density lipoprotein 2b in non-obese type 2 diabetic patients analysed by a microfluidic chip method in a case-control study. Biomarkers. 2009;14(8):619–623. doi:10.3109/13547500903204636
38. Wang H, Zhang W, Wan J, et al. Microchip-based human serum atherogenic lipoprotein profile analysis. Anal Biochem. 2014;467:75–83. doi:10.1016/j.ab.2014.08.031
39. Meng Y, Zhang Y, Buhler M, et al. Direct isolation of small extracellular vesicles from human blood using viscoelastic microfluidics. Sci Adv. 2023;9(40):eadi5296. doi:10.1126/sciadv.adi5296
40. Farukhi ZM, Demler OV, Caulfield MP, et al. Comparison of nonfasting and fasting lipoprotein subfractions and size in 15,397 apparently healthy individuals: an analysis from the VITamin D and OmegA-3 TriaL. J Clin Lipidol. 2020;14(2):241–251. doi:10.1016/j.jacl.2020.02.005
41. Lehtovirta M, Wu F, P RS, et al. Association of physical activity with metabolic profile from adolescence to adulthood. Scand J Med Sci Sports. 2023;33(3):307–318. doi:10.1111/sms.14261
42. Siurana JM, Sabate-Rotes A, Amigo N, et al. Different profiles of lipoprotein particles associate various degrees of cardiac involvement in adolescents with morbid obesity. Front Pediatr. 2022;10:887771. doi:10.3389/fped.2022.887771
43. Ma L, Chan DC, Ooi EM, et al. Apolipoprotein(a) kinetics in statin-treated patients with elevated plasma lipoprotein(a) concentration. J Clin Endocrinol Metab. 2019;104(12):6247–6255. doi:10.1210/jc.2019-01382
44. Li X, Liu S, Tan J, et al. Light-addressable potentiometric sensors in microfluidics. Front Bioeng Biotechnol. 2022;10:833481. doi:10.3389/fbioe.2022.833481
45. Fan XY, Deng ZF, Yan YY, et al. Application of microfluidic chips in anticancer drug screening. Bosn J Basic Med Sci. 2022;22(3):302–314. doi:10.17305/bjbms.2021.6484
46. Moriyama K, Negami M, Takahashi E. HDL2-cholesterol/HDL3-cholesterol ratio was associated with insulin resistance, high-molecular-weight adiponectin, and components for metabolic syndrome inJapanese. Diabet Res Clin Pract. 2014;106(2):360–365. doi:10.1016/j.diabres.2014.08.007
47. Lee M, Jang Y, Kim K, et al. Relationship between HDL3 subclasses and waist circumferences on the prevalence of metabolic syndrome: KMSRI-Seoul Study. Atherosclerosis. 2010;213(1):288–293. doi:10.1016/j.atherosclerosis.2010.07.056
48. Generoso G, M BI, D SR, et al. Association between high-density lipoprotein subfractions and low-grade inflammation, insulin resistance, and metabolic syndrome components: theELSA-Brasil study. J Clin Lipidol. 2018;12(5):1290–1297. doi:10.1016/j.jacl.2018.05.003
49. Williams PT, Krauss RM, Vranizan KM, et al. Changes in lipoprotein subfractions during diet-induced and exercise-induced weight loss in moderately overweight men. Circulation. 1990;81(4):1293–1304. doi:10.1161/01.CIR.81.4.1293
50. Ellman N, Keswell D, Collins M, et al. Ethnic differences in the association between lipid metabolism genes and lipid levels in black and white South African women. Atherosclerosis. 2015;240(2):311–317. doi:10.1016/j.atherosclerosis.2015.03.027
51. Flaherty SM, Wood EK, Ryff CD, et al. Race and sex differences in HDL peroxide content among American adults with and without type 2 diabetes. Lipids Health Dis. 2022;21(1):18. doi:10.1186/s12944-021-01608-4
52. Goedecke JH, Utzschneider K, Faulenbach MV, et al. Ethnic differences in serum lipoproteins and their determinants in South African women. Metabolism. 2010;59(9):1341–1350. doi:10.1016/j.metabol.2009.12.018
53. Vajdi M, Nikniaz L, Pour Asl AM, et al. Lifestyle patterns and their nutritional, socio-demographic and psychological determinants in a community-based study: a mixed approach of latent class and factor analyses. PLoS One. 2020;15(7):e236242. doi:10.1371/journal.pone.0236242
54. Liu C, Dhindsa D, Almuwaqqat Z, et al. Association between high-density lipoprotein cholesterol levels and adverse cardiovascular outcomes in high-risk populations. JAMA Cardiol. 2022;7(7):672–680. doi:10.1001/jamacardio.2022.0912
 © 2024 The Author(s). This work is published and licensed by Dove Medical Press Limited. The full terms of this license are available at https://www.dovepress.com/terms.php and incorporate the Creative Commons Attribution - Non Commercial (unported, v3.0) License.
By accessing the work you hereby accept the Terms. Non-commercial uses of the work are permitted without any further permission from Dove Medical Press Limited, provided the work is properly attributed. For permission for commercial use of this work, please see paragraphs 4.2 and 5 of our Terms.
© 2024 The Author(s). This work is published and licensed by Dove Medical Press Limited. The full terms of this license are available at https://www.dovepress.com/terms.php and incorporate the Creative Commons Attribution - Non Commercial (unported, v3.0) License.
By accessing the work you hereby accept the Terms. Non-commercial uses of the work are permitted without any further permission from Dove Medical Press Limited, provided the work is properly attributed. For permission for commercial use of this work, please see paragraphs 4.2 and 5 of our Terms.