Back to Journals » Journal of Multidisciplinary Healthcare » Volume 16
The Association Between Facility Affiliations and Revenue Generation in Skilled Nursing Facilities – An Exploratory Study
Authors Beauvais B ![]() , Mileski M
, Mileski M ![]() , Ramamonjiarivelo Z, Lee KA
, Ramamonjiarivelo Z, Lee KA ![]() , Kruse CS
, Kruse CS ![]() , Betancourt J
, Betancourt J ![]() , Pradhan R
, Pradhan R ![]() , Shanmugam R
, Shanmugam R
Received 3 August 2023
Accepted for publication 11 October 2023
Published 24 October 2023 Volume 2023:16 Pages 3099—3114
DOI https://doi.org/10.2147/JMDH.S433771
Checked for plagiarism Yes
Review by Single anonymous peer review
Peer reviewer comments 3
Editor who approved publication: Dr Scott Fraser
Bradley Beauvais, Michael Mileski, Zo Ramamonjiarivelo, Kimberly Ann Lee, Clemens Scott Kruse, Jose Betancourt, Rohit Pradhan, Ramalingam Shanmugam
School of Health Administration, Texas State University, San Marcos, TX, USA
Correspondence: Bradley Beauvais, School of Health Administration, Texas State University, San Marcos, TX, USA, Tel +1 (210)627-1078, Email [email protected]
Background: Although hospitals have been the traditional setting for interventional and rehabilitative care, skilled nursing facilities (SNFs) can offer a high-quality and less costly alternative than hospitals. Unfortunately, the financial health of SNFs is often a matter of concern. To partially address these issues, SNF leaders have increased engagement in a number of affiliations to assist in improving quality and reducing operational costs, including Accountable Care Organizations (ACOs), Health Information Exchanges (HIEs), and participation in Bundled Payment for Care Improvement (BPCI) programs. What is not well understood is what impact these affiliations have on the financial viability of the host organizations. Given these factors, this study aims to identify what association, if any, exists between SNF affiliations and revenue generation.
Methods: Data from calendar year 2022 for n=13,447 SNFs in the US were assessed using multivariate regression analysis. We evaluated two separate dependent measures of revenue generation capacity: net patient revenue per bed and net patient revenue per discharge and considered three unique facility affiliations including (1) ACOs, (2) HIEs, and (3) BPCI participants.
Results: Six multivariable linear regressions revealed that ACO affiliation is negatively associated with revenue generation on both dependent measures, while HIE affiliation and BPCI participation reflected mixed results.
Conclusion: A better understanding of the financial impact of SNFs’ affiliations may prove insightful. By carefully considering the value of each affiliation, and how each is applicable to any given market, policymakers, funding agencies, and facility leaders may be able to better position SNFs for more sustainable financial performance in a challenging economic environment.
Keywords: skilled nursing facilities, accountable care organizations, health information exchanges, bundled payment for care improvement, revenue, discharges
Introduction
The healthcare industry in the United States is a $4 trillion (about $12,000 per person) enterprise (2020) which accounts for nearly 18% of US Gross Domestic Product (GDP).1 The trajectory of healthcare cost inflation shows little sign of slowing down as the healthcare share of GDP is expected to rise to nearly 20% by 2028.2 A significant portion of the expense incurred within the US healthcare system can be attributed to the aging of the US population. The 2020 US Census indicates the US population age 65 and over grew nearly five times faster than the total population over the past 100 years from 1920 to 2020.3 The Urban Institute reported that the number of Americans aged 65 and over will more than double, and the number of adults aged 85 and over will nearly quadruple by 2040.4
As our nation ages, surgical, palliative, and other supportive healthcare services will be increasingly in demand as rising chronic disease conditions must be addressed on a wider scale.5 This trend will not only drive-up demand for skilled clinical labor, it will also place upward pressure on overall healthcare costs to both patients and payors.6 Although hospitals have been the traditional setting for interventional and rehabilitative care, post-acute care in SNFs can offer a high-quality alternative – often at a much lower cost than the hospital setting.7
Unfortunately, the financial health of SNFs is a matter of concern. A recent study commissioned by the American Healthcare Association (AHCA) highlights significant business challenges for SNFs across the country. Specifically, the report indicates pervasive instances of negative operating margins, significant obstacles in accessing capital, and an elevated risk of bankruptcy and closure.8 Further, some industry analysts indicate profit margins will continue to erode over the next several years as reimbursement rates decline and costs escalate due to an increasingly strained nursing labor market.9 For instance, in recent years, contract nursing rates have increased by between 200% and 300%. For facilities already encumbered with poor operating margins and little prospect of augmentative financial support, such system shocks are financially untenable.
Partially in response to the phenomena we have discussed, in addition to pervasive issues with cost, quality, and access in the healthcare system, Congress and the Centers for Medicare and Medicaid Services (CMS) have passed several legislative measures and introduced numerous programs over the past two decades. Two of these acts are the HITECH Act of 2009 and Patient Protection and Affordable Care Act of 2010, each of which has been impactful on the SNF facilities through the regulations and programs introduced.10,11 Notable among these are accountable care organizations (ACOs), health information exchanges (HIEs), and the Bundled Payment of Care Improvement Programs (BPCIs). However, what is not well understood is what impact, if any, these programs have on the profitability of post-acute facilities. Thus, the purpose of this study is to examine these affiliations as they pertain to revenue generation of SNFs in the healthcare delivery continuum given the noted challenges these organizations face in maintaining profitability. This is the first known study to examine the association between these three targeted programs and SNF financial performance. In our view, it is vitally important to understand how revenue generation of these facilities might be sustained and improved.
Literature Review
Post-acute care encompasses a range of services patients of any age commonly receive while recovering from surgery, illness, or injury. Depending on the severity of patients’ conditions, care might occur over a brief or extended period, but long-term care is most often associated with older adults. Post-acute care is comprised of a variety of organizations with varied capabilities, including (1) skilled nursing facilities (SNFs), inpatient rehabilitation facilities (IRFs), home health agencies (HH), and long-term care hospitals (LTCHs).12,13
For the purposes of this paper, our focus is skilled nursing facilities. A typical SNF maintains two roles with over 90% of facilities providing both short-term and long-term care.14 Most SNFs deliver inpatient rehabilitation and medical treatment center utilized for care after a hospital stay following an illness, surgery, or accident to assist patients in regaining their ability to do activities of daily living (ADLs). Second, the majority of SNFs are also nursing homes, with a primary purpose of providing continuous care for adults who can no longer live independently. For longer term residents, nursing homes are residential centers for those who are medically stable but cannot be cared for at home due to lack of mobility, chronic conditions, or a lack of mobility. These facilities are places where residents can receive the level of supportive or custodial care they need in order to maintain their health.15–19
Long-Term Care Facility Payment Process and Profitability
Profitability of SNF care facilities has proven to be problematic in recent years. However, to understand why this is the case, we consider it important to set the context of long-term care facility revenue generation in preparation for further research and data analysis, one benefits from viewing the primary mechanisms of payment and thus revenue generation for nursing homes and more specifically for skilled nursing facilities versus custodial, non-skilled care. Practically speaking, individual and corporate nursing facilities have managed case mix, a metric indicating the level of resources required in caring for individual residents. In addition, grouping beds by pay source assists in managing necessary resources to meet quality standards for specific patient needs. From an operation’s perspective, case mix has also represented the number and location of the beds by pay source and use of resources within a facility, used to attain a sustainable margin. Facilities and corporations set a ratio of Medicare, managed care, private pay, and Medicaid beds to total beds to capture the most optimal revenue stream.
Medicaid has represented 30% of the payment for nursing home care.20 Medicaid payment typically has occurred for non-skilled, custodial care homes or units. Medicaid is a joint federal and state program and because states set up their own processes, variation in payment structure and revenue stream varies significantly across the country, with average base payment rates ranging from 62 to 182% of the national average. Medicaid has often followed suit with general Medicare methodology for assessment, payment, and adjustments.21 For example, as the Centers for Medicare and Medicaid Services (CMS) transitioned to case management and prospective payment methodology for Medicare Part A, federal and state Medicaid case management and payment structures followed suit.
The primary source of revenue for skilled nursing facilities has been Medicare, providing a better financial standing for nursing facilities with skilled units. The way in which Medicare has paid for care has evolved over the last 40 years as viewable in Table 1. Medicare has represented approximately 23% of payment for nursing home care, primarily making up payment for skilled nursing and rehabilitation, after a qualifying hospital stay for eligible beneficiaries.20 Payment from Medicare Part A represents a key payment source for residents requiring skilled nursing and skilled rehabilitation. Private pay or out-of-pocket payment has represented 26%, followed by private insurance representing 10% of payment for nursing home care.20 Some facilities and companies have focused on the private pay and private insurance market as their case-mix strategy, even constructing facilities that have catered to this niche market, providing skilled rehabilitation for such medical conditions as joint replacements.
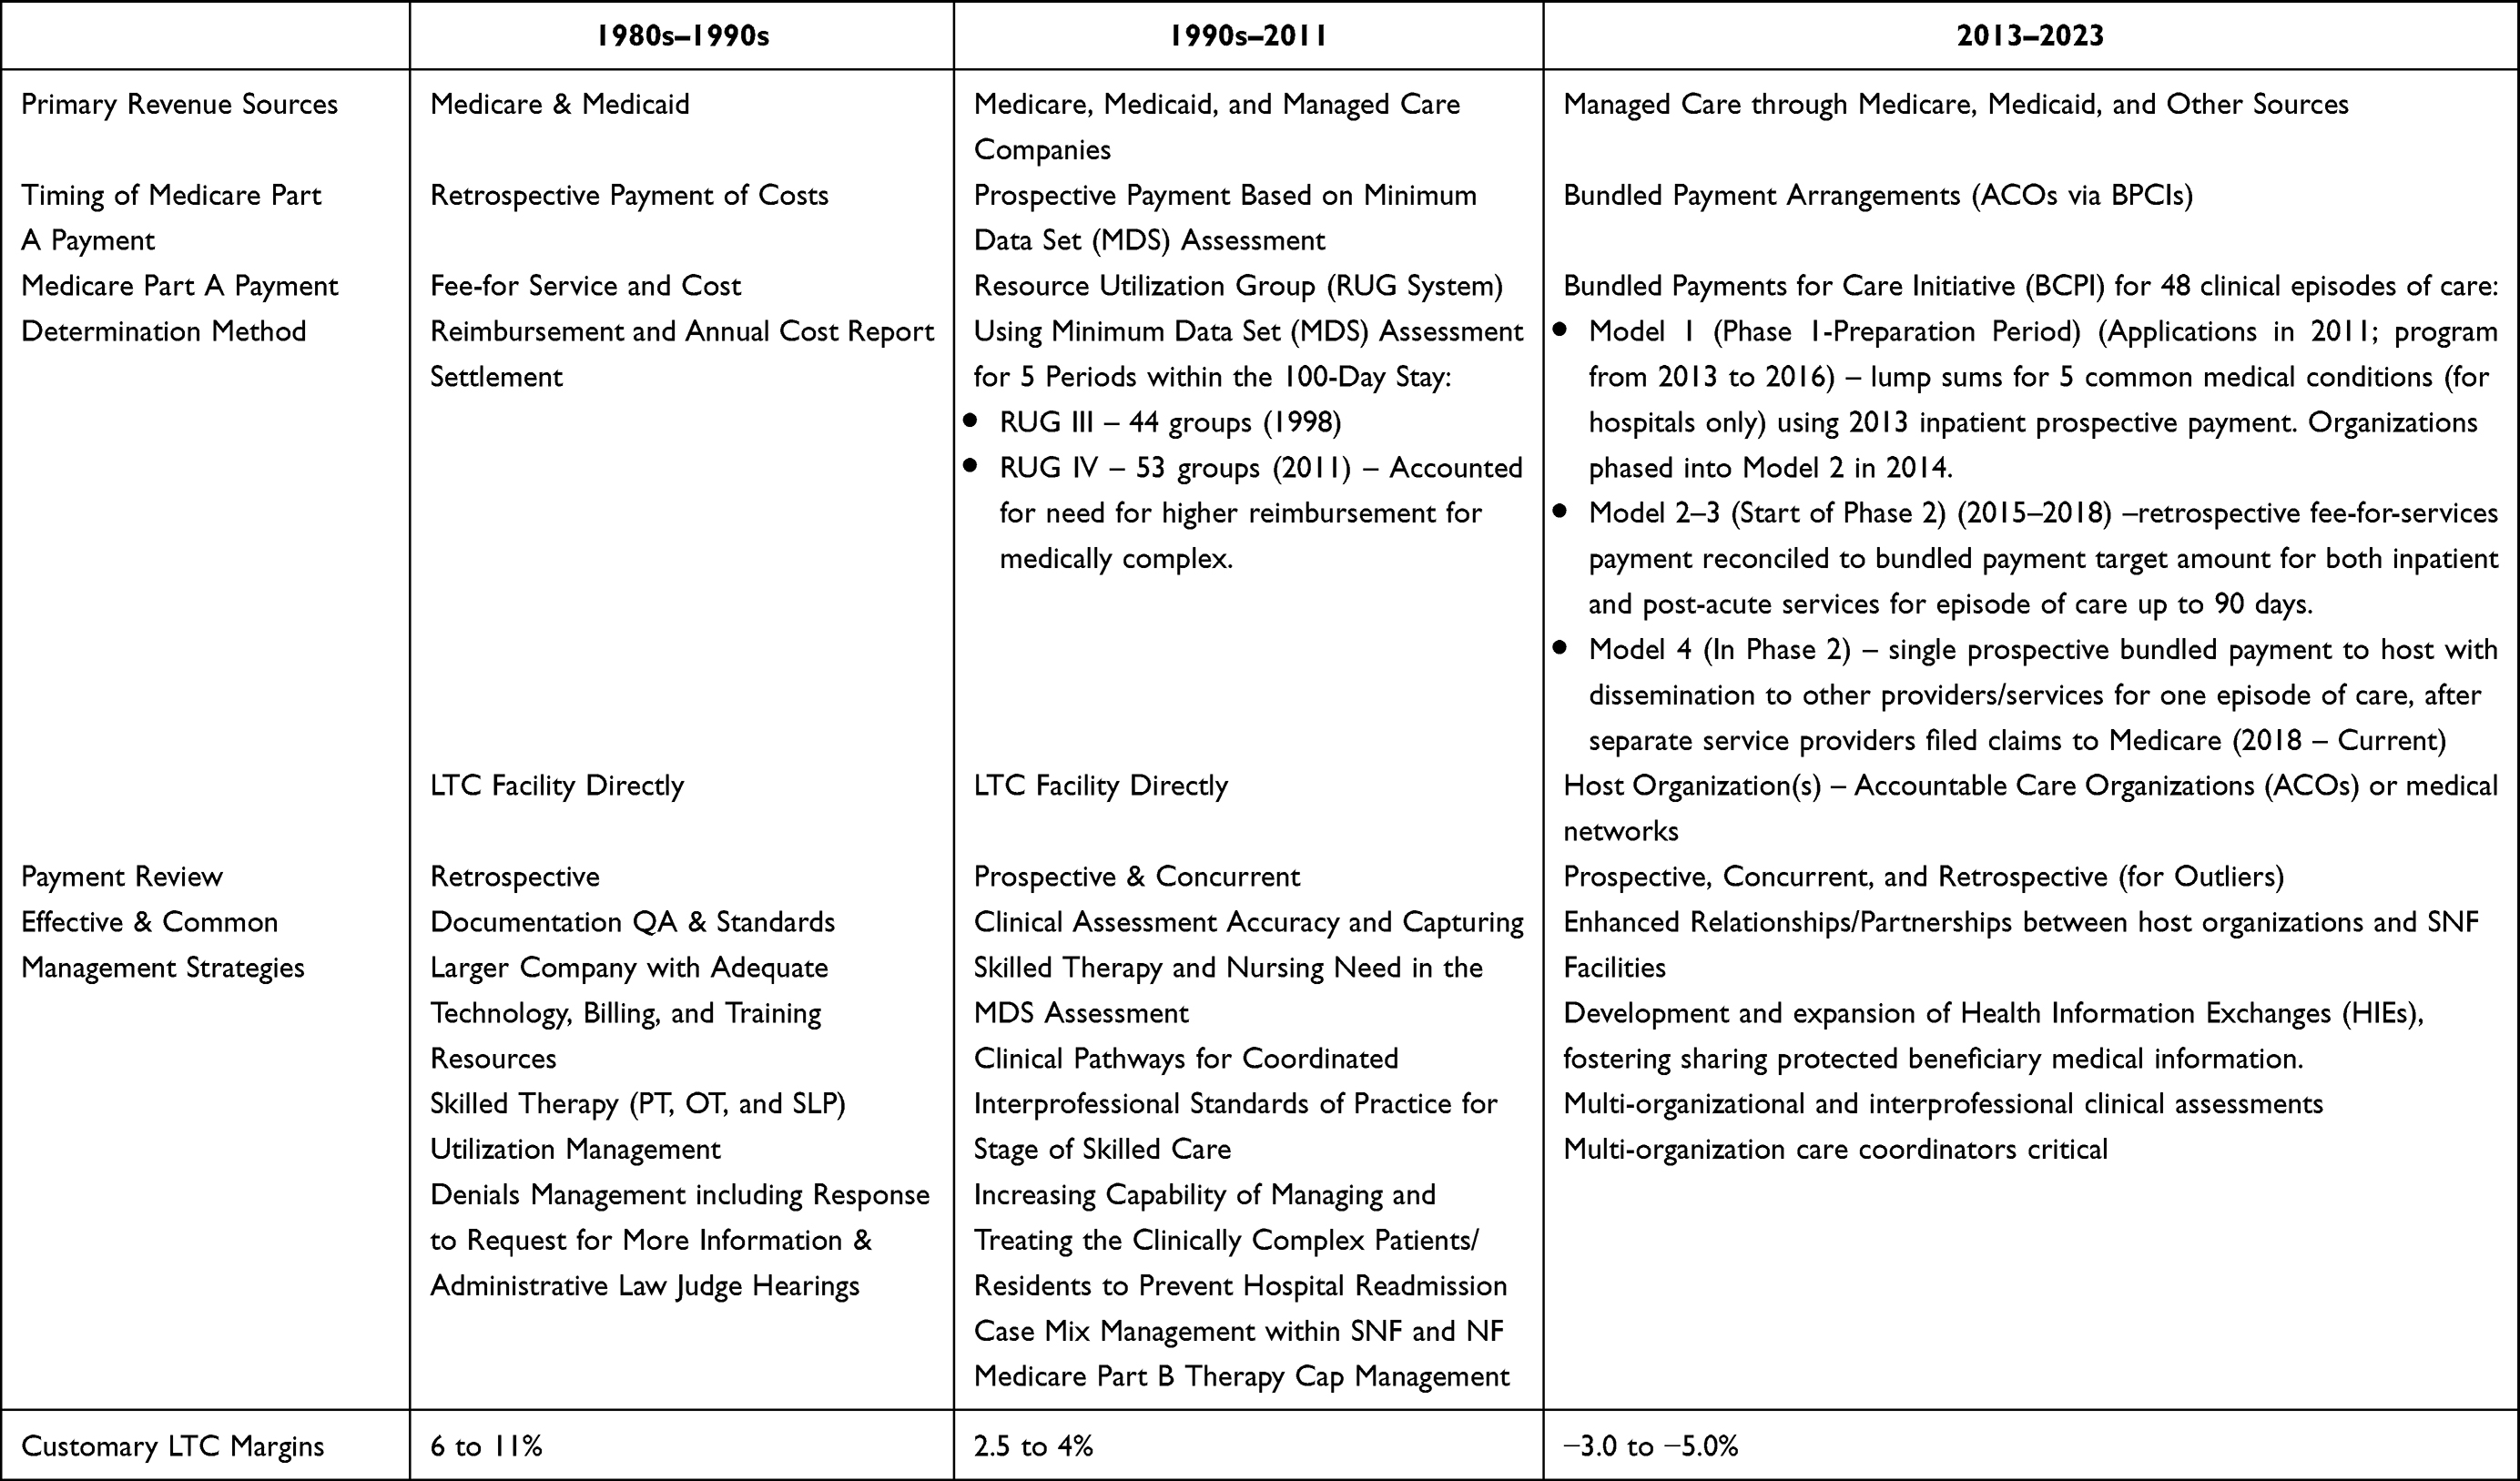 |
Table 1 Skilled Nursing Facility Revenue Comparison per Time Period |
Facilities employed a variety of strategies to proactively manage care and resources under their oversight to optimize Medicare and Medicaid payments. As Table 1 depicts, facilities and companies developed and executed detailed documentation audits and training, engaged electronic clinical system technology vendors with automatic checks and balances, and assertively managed the intermediary denial process.
Effective and common management strategies have progressed from proactive medical record documentation reviews and assertive denial management with retrospective, cost-based payment to more complex and systematic management strategies with bundling of payment and dissemination of payment across secondary or partnering entities. Though this progression of prospective payment methodology, SNFs have found themselves in a situation in which their payment and revenue stream is complex, delayed, secondary in priority, and much reduced as apparent from the customary margins as displayed in Table 1.22,23
The impact of solvency issues in the post-acute care industry has proven to be persistent and pervasive. Lord, Landry, Savage, and Weech-Maldonado (2020) provide some recent perspective in their examination of nursing homes. They note there were 1223 nursing home closures between 2000 and 2004.24,25 The spate of closings during this period does not appear to be a short-term aberration. Later, in the decade between 2008 and 2018, 472 nursing homes in 400 nonmetropolitan counties and 783 nursing homes in 368 metropolitan counties closed in the U.S.26,27 Just in 2022 alone, there were 128 nursing home closures.28 The reasons cited for closure are varied, but several common themes emerge: (1) diminished bed capacity and occupancy, (2) decreasing Medicare and Medicaid reimbursement rates, and (3) the availability and cost of skilled nursing labor – particularly since the start of the COVID-19 pandemic. From February 2020 to November 2021, the number of workers in nursing homes and other care facilities dropped by 410,000 nationally and has only partially recovered since.29 In one recent small-scale exploratory study by Harrington, Hailer, Mollot & Mukamel (2023), several of these pressing long-term care issues were considered in the context of changes in California’s efforts to economically sustain nursing home facilities throughout the COVID-19 pandemic.30 They found that the number of beds, occupancy rates, high-quality rating scores, and higher proportions of Medicare resident days were all positively associated with improved net income margins, while negative relationships were attributed to chain affiliation, Medicaid days, and managed care resident days.30
Long-Term Care Facility Affiliations
Accountable Care Organizations
The Patient Protection and Affordable Care Act of 2010 established the legal and policy basis for numerous evolutionary changes in the healthcare industry. One of these was the Accountable Care Organization (ACO), which was established as a Medicare payment model in 2012. ACOs are voluntarily aligned groups of healthcare providers such as hospitals, physicians, and healthcare facilities. The primary goal of ACOs is to promote coordinated and patient-centered care. Care coordination avoids duplication of services and ideally prevents medical errors. When collaborating entities in an ACO succeed in delivering high-quality care at a lower cost, the group shares in the savings it realizes.31
ACOs have not historically included SNF facilities in the scope of clinical practice. In recent years, researchers and policymakers have advocated for this to change, principally with respect to SNF involvement and with respect to transitioning covered beneficiaries to rehabilitative care settings.31 As an example, in traditional Medicare Fee-For-Service (FFS), beneficiaries are eligible for Medicare-covered SNF skilled care services only after they have had an inpatient hospital stay of 3+ consecutive days. However, throughout the COVID-19 pandemic and now within the scope of ACO practice, the SNF “Three Day Admission Rule Waiver” from the CMS allows qualifying ACOs to admit patients into affiliated SNFs without a prior 3-day inpatient hospital stay.32 This waiver process is aimed at offering ACOs additional flexibility to increase quality and decrease costs. However, what is not well known is how ACO affiliation is associated with facility profitability.
Health Information Exchanges
The 2009 Health Information Technology for Economic and Clinical Health (HITECH) Act provided significant investments to develop and implement a nationwide health information exchange (HIE).33 In 2014, the Office of the National Coordinator for Health Information Technology published a 10-year roadmap for the United States to achieve interoperability of electronic health records (EHRs) by 2024 with a primary element of this plan being the advancement of HIEs nationwide.33 Ideally, HIEs allow healthcare professionals and patients to appropriately access and securely share a patient’s medical information electronically. While more readily adopted in other segments of the healthcare industry, adoption of HIEs advanced slowly for the SNF care setting, largely due to limited incentives for this area of the healthcare sector.34–36 The HITECH Act omitted the post-acute setting from receiving incentives; however, because HIE is required for stages 2 and 3 of Meaningful Use criteria, there is some limited spillover into the SNF setting. HIE is seen most often in care transitions from the emergency department in acute care to the SNF or rehabilitation hospital, but it is not ubiquitous.37 Less than 25% of acute-care hospitals engage in bi-directional data exchange with post-acute providers, and another 34% engage in send-only traffic. Even when HIE is available, it is used for less than 50% of patients.38 Despite the slow adoption in the SNF setting, a recent policy change may result in greater HIE adoption. The “data blocking rule”, as part of the 2016 Cures Act, requires health systems to promptly respond to requests for HIE activity and to avoid any activity that interferes with exchanging information.39 How this might influence SNF facilities’ financial prospects is yet to be determined.
BPCI Participation
The Bundled Payments for Care Improvement (BPCI) program emerged as an additional quality improvement and cost containment strategy from the Patient Protection and Affordable Care Act of 2010. With a focus on incentivizing healthcare providers to accept a single payment for reimbursement for an entire episode of care, the original BPCI initiative was launched in 2013, with the Center for Medicare and Medicaid Innovation (CMMI) advancing providers 4 different models for participation, type of reimbursement, and risk exposure.40 Model 1 included Medicare Part A services for hospitalization alone. Model 2 is the most comprehensive model, encompassing Medicare Part A and Part B services for hospitalization, readmissions, and all other post-acute care. Model 3 included only post-acute care, and Model 4 included both hospitalization and any readmissions.40
Within the first three years of performance in Model 3, only two of the 14 clinical episodes analyzed, SNF major joint replacement of the lower extremity (MJRLE) and congestive heart failure (CHF), achieved statistically significant reductions in episode payments relative to non-participating facilities.41 On the positive side, participating SNFs appear to have reduced the number of days in a SNF in 9 of 11 (81%) of the clinical episodes relative to the comparison group (although only two were statistically significant). From a BPCI program standpoint, this is a positive result as overall costs could be reduced. However, reducing SNF days may be financially risky for BPCI-participating SNFs given Medicare pays via a daily rate. Thus, with fewer days of care provided, the result is likely a reduction in SNF Medicare revenue.41
Recently, CMS has developed and implemented the BPCI Advanced model that has reduced the role of post-acute care providers.42 This move comes at the concern of some SNF leaders given the amount of time, equipment, and resources participating SNFs have dedicated to the alteration of their clinical practice to meet BPCI standards.43 However, if these gains ultimately undermine the ability to generate sufficient revenue to sustain operations, the logic of continued participation may be called into question. Although suspected by some to be detrimental to financial viability, to date, only one study has investigated the association between SNF adoption of BPCI standards and profitability. In their study published in 2022, Yinget et al reported that BPCI program affiliation was negatively associated with reductions in operating expenses and operating revenues.44
Methods
Data & Sample
The original data set of all 18,684 active skilled nursing facilities in the United States was originally considered and gathered from the Medicare Cost Report for Skilled Nursing Facilities (SNF) and the Post-Acute Care and Hospice Provider Utilization and Payment Public Use Files (PAC PUF) compiled by Definitive Healthcare (defhc.com) as of April 9th, 2023. However, a final sample of 13,447 facilities was used in our analysis. Most SNF facilities maintain a Medicare Provider Number (MPN) because they receive Medicare Certification to serve and treat Medicare patients. However, we removed 2,343 facilities because they did not have an MPN and thus did not report the full set of financial or organizational variables studied in our analysis. We removed an additional 2,893 facilities because they were closed (inactive) or had significant data missingness reasons in other areas of the analysis. In addition, entities reporting as Assisted Living Facilities, Independent Living Facilities, and Rehabilitation Programs were not included in our analysis. The final data set comprises 72% of the total active long-term care facility population in the United States.
Measures – Dependent Variables
The two dependent variables used by prior authors in healthcare management studies were considered for our research focused on SNF revenue generation capacity: net patient revenue per bed (NPRPB) and net patient revenue per discharge (NPRPD).45,46 “Net patient revenue” reflects revenue for patient care only and does not include revenue from other operations such as the cafeteria, parking, rent, research, and educational activities. A “staffed bed” is licensed and physically available bed with staff on hand to attend to patients and it includes both occupied and available beds. A “discharge” is defined as the formal release of a treated individual due to conclusion of the clinical stay, either by death, return home, or transfer to another institution.
With the above definitions in mind, we view NPRPB as a more direct measure of a facility’s revenue generation capacity based on the primary structural aspect of care delivery – staffed patient beds. On the other hand, NPRPD measures revenue generation with some influence from patient type and payor mix with the understanding that discharges include all inpatient discharges (ie, formal patient release) including deaths.
Prior authors have favored “bottom line” measures such as net income or operating margin to assess long-term care organizational financial health. However, because of the significant number of individual leader or management team decisions that can positively or negatively influence individual firm-level financial outcomes, we chose to focus on what factors can most significantly impact revenue generation capability. In our view, if revenue generation is greatly impacted – particularly in a negative direction – it is very difficult to maintain profitability even if the most adept cost containment strategies are utilized. Thus, we favored the “top line” approach to evaluating revenue generation versus “bottom line” variables, simply because it is difficult to account for internal management team competency and experience, which can weigh heavily on profitability.
Measures – Independent Variables of Interest
Our primary independent variables of interest focused on SNF facility affiliations, including accountable care organization (ACO) affiliation (or not), health information exchange (HIE) affiliation (or not), and Bundled Payments for Care Improvement (BPCI) participant (or not). Affiliation information was also obtained from Definitive Healthcare based on their proprietary research. Per the Definitive website, this research includes several methods, including review of organizational web content, news articles, and cold calling.47
Measures – Control Variables
Numerous covariates were included in the study to account for each facility’s attributes, facility performance, and average patient characteristics. “Facility attributes” include co-location at a hospital (or not), ownership type (for profit vs not-for-profit), urban or rural location, network membership (or not), and regional geographic location. “Facility performance” measures included the CMS overall five-star rating, total nurse staffing hours per resident per day, percent days funded by Medicare, percent days funded by Medicaid, bed utilization percentage, average length of stay, average daily census, and the number of full-time equivalent (FTE) employees. “Patient characteristics” included the average patient age, the average hierarchical condition category (HCC), and patients’ average number of chronic conditions.
Analysis
Due to the skewness of the dependent variables, the distributions of both were shifted and natural log transformed. Multicollinearity was evaluated, and any variables with a variance inflation factor over 10 were removed. Our independent variables of interest were coded as dichotomous variables as follows: ACO affiliated = 1, not ACO affiliated = 0; HIE affiliated = 1, not HIE affiliated = 0; and BPCI participating = 1, not BPCI participating = 0. Additional organizational characteristics were also included as dichotomous variables, including co-location at a hospital: if yes = 1, if no = 0; ownership type: government/not-for-profit = 1, for-profit = 0; rural = 1, urban = 0; and network member = 1; not network member = 0. Three multivariable linear regressions with listwise deletion were conducted for each response (dependent) variable using IBM SPSS Statistics package 28.48 In each of the analyses performed, the association between the studied independent variables and the dependent variable was accepted at an α = 0.05. Model fit was assessed using adjusted R2.
Results
Table 2 displays the overall descriptive statistics pertaining to the entire set of variables included in the study. Facility affiliations included only 3.3% of the sample being affiliated with an ACO (~443 facilities), 16% were affiliated with a HIE (~2114 facilities), and 3.4% were identified as being a BPCI participant (~451 facilities).
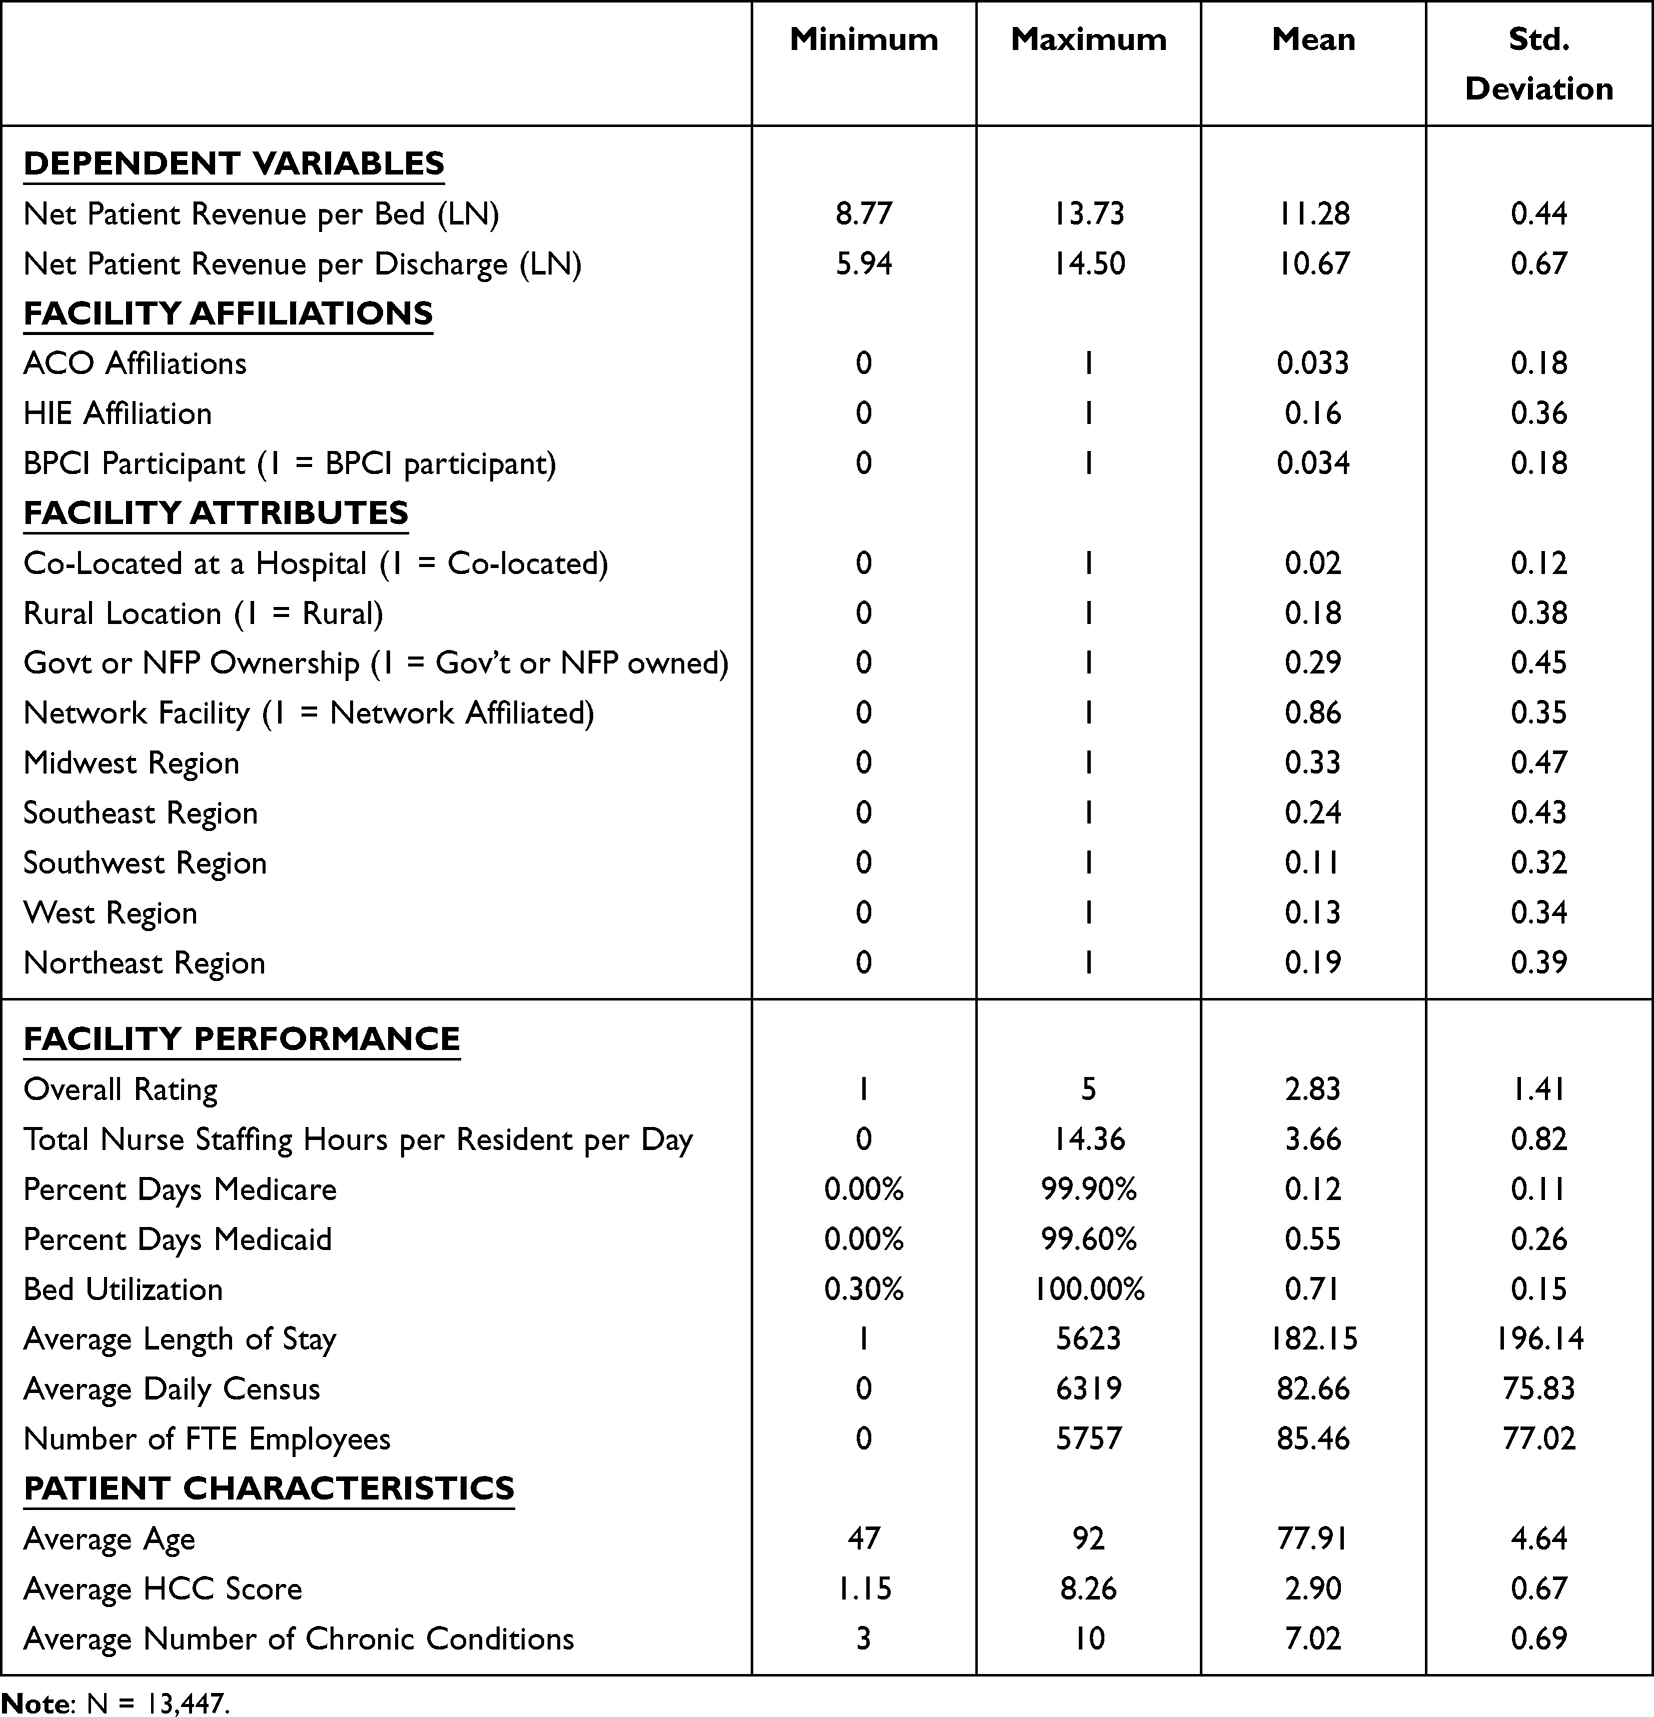 |
Table 2 Descriptive Statistics |
From a facility attribute perspective, only 2% of facilities in the study were co-located with a hospital, 18% of facilities were located in rural areas, 29% were owned and operated by a government or not-for-profit entity, 86% were affiliated with a network, 33% of facilities were located in the Midwest, 24% in the Southeast, 11% in the Southwest, 13% in the West, and 19% in the Northeast.
Facility performance indicators show the sample facilities averaged 2.83 out of 5 in CMS Overall Rating and maintained 3.66 total nurse staffing hours per resident, per day. On average, 12% of patient days were funded by Medicare and 55% were funded by Medicaid. The mean bed utilization is 71%, and the average length of stay was 182.15 days. The average daily census in the sample was 82.66 patients and, on average, the facilities in the sample employed just over 85 full-time equivalent staff.
Patient characteristics reflected an average patient age across the sample of 77.91 years. Patients, on average, scored 2.90 on the CMS-HCC risk scale, and suffered from an average of 7 chronic conditions.
Table 3 and 4 show the results of all six of the regression analyses performed. F-tests of overall significance for each model were significant (p=<0.001). All analyses indicated models with strong adjusted R2 values. The highest R2 value was found in the analysis of NPRPB with all three independent variables of interest (67.1%), while the lowest R2 value was observed in the analysis of NPRPD with HIE affiliation as the independent variable of interest (61.9%).
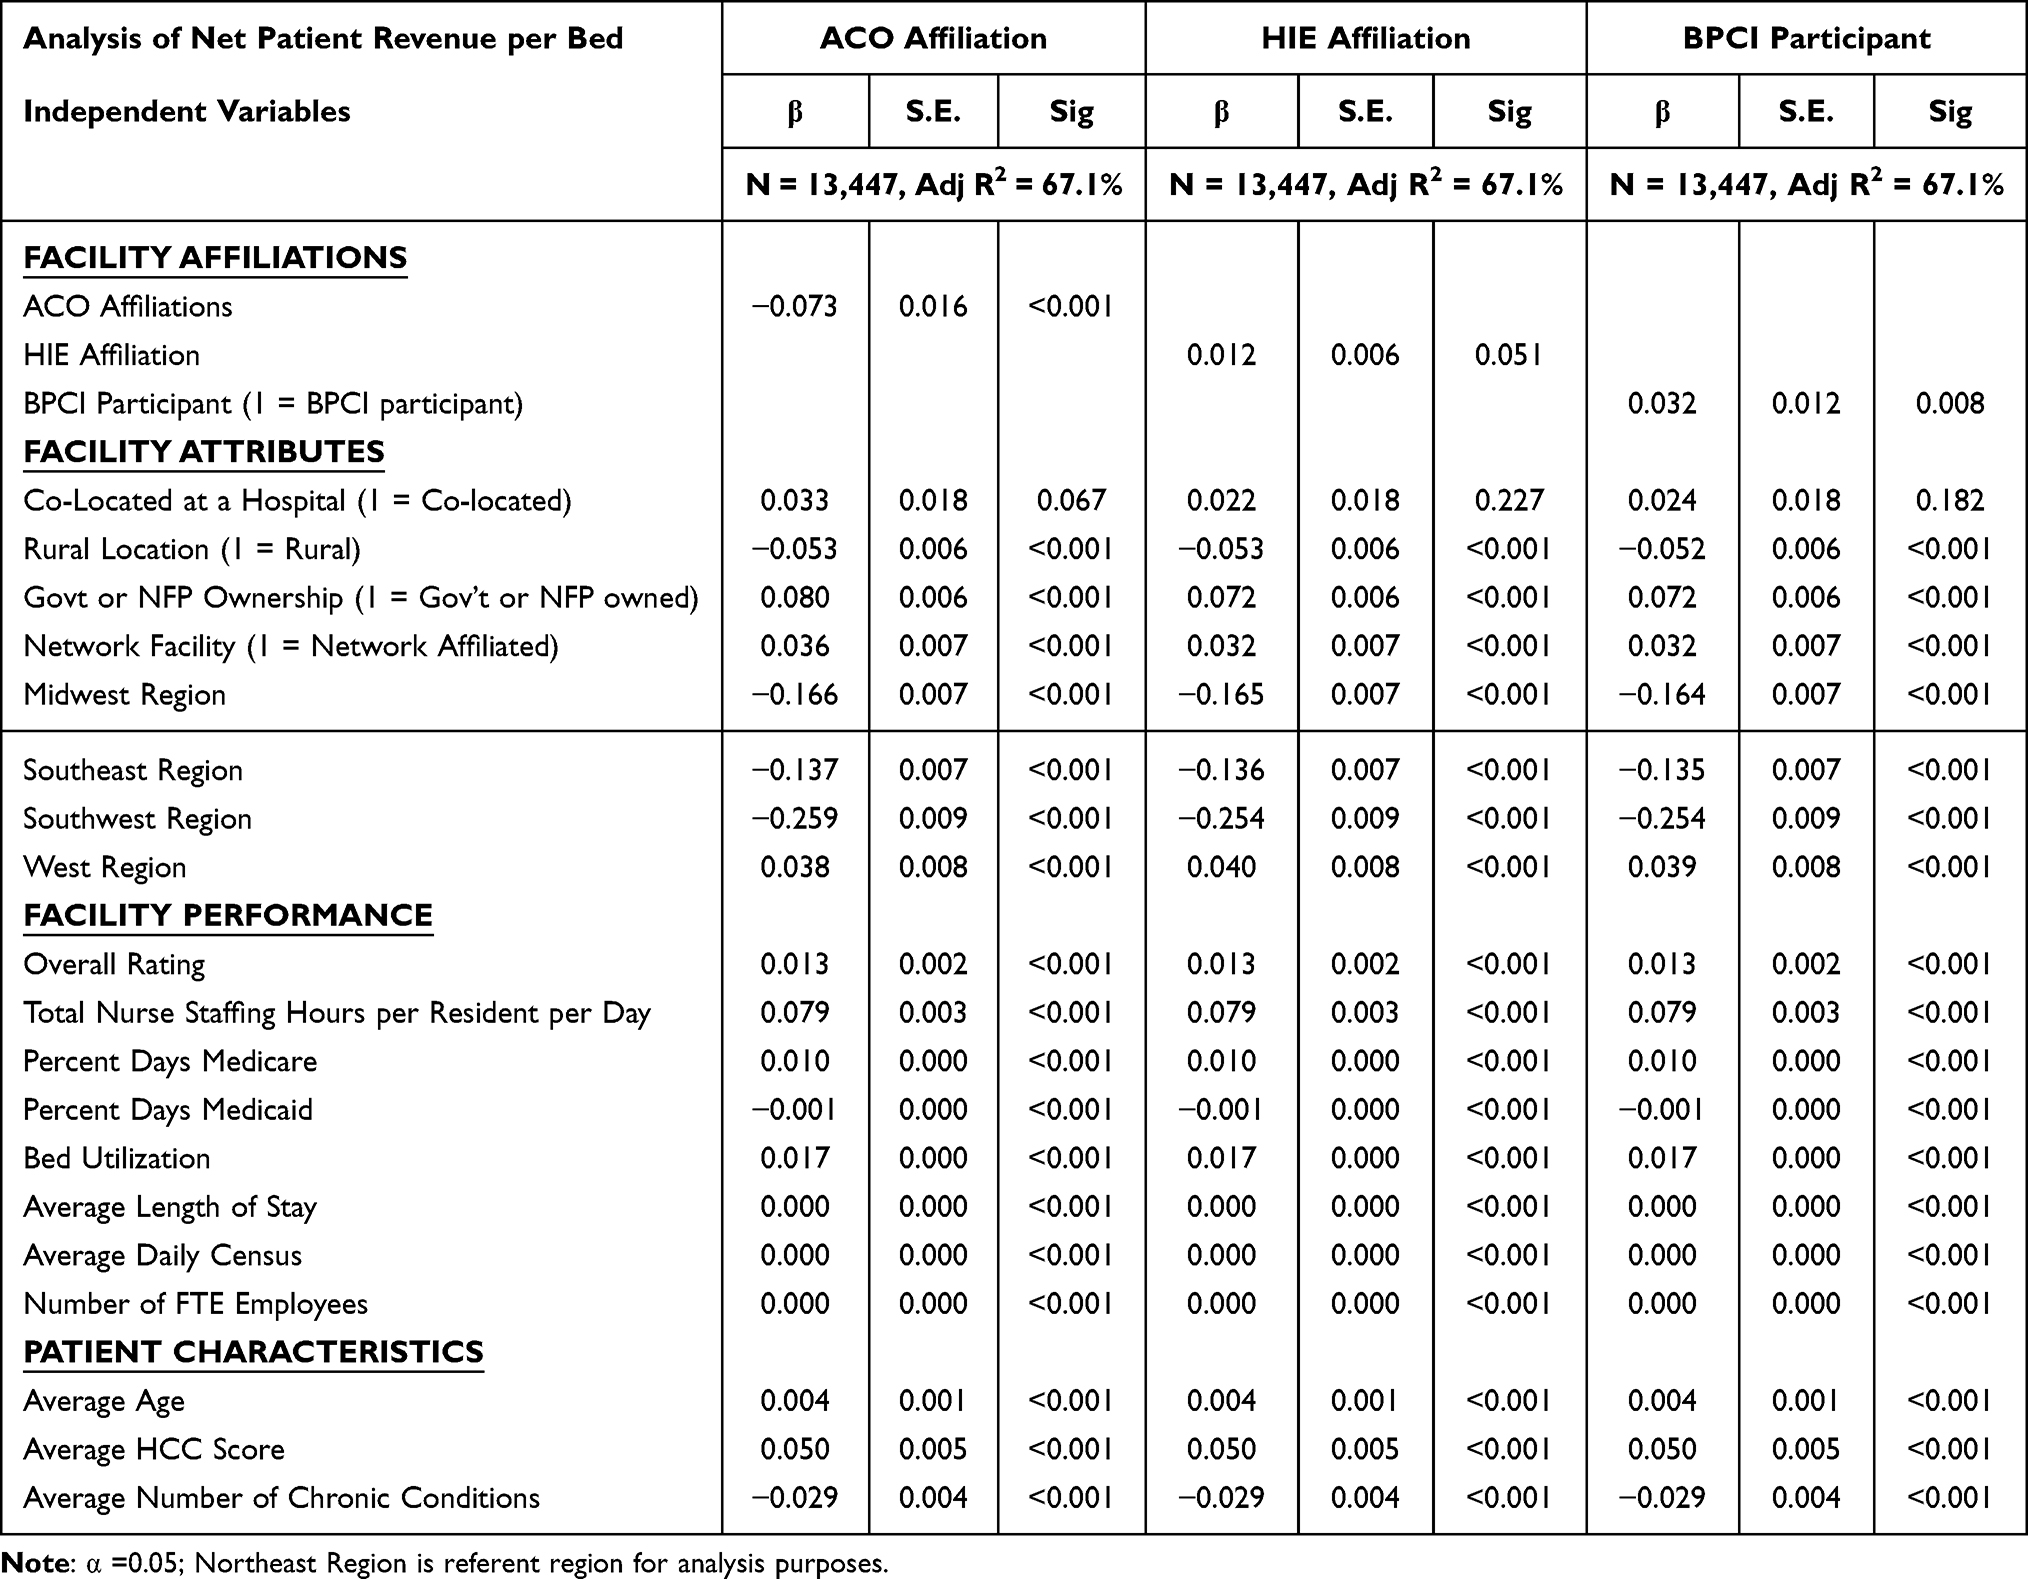 |
Table 3 Multiple Regression Analysis – Analysis of Net Patient Revenue per Bed |
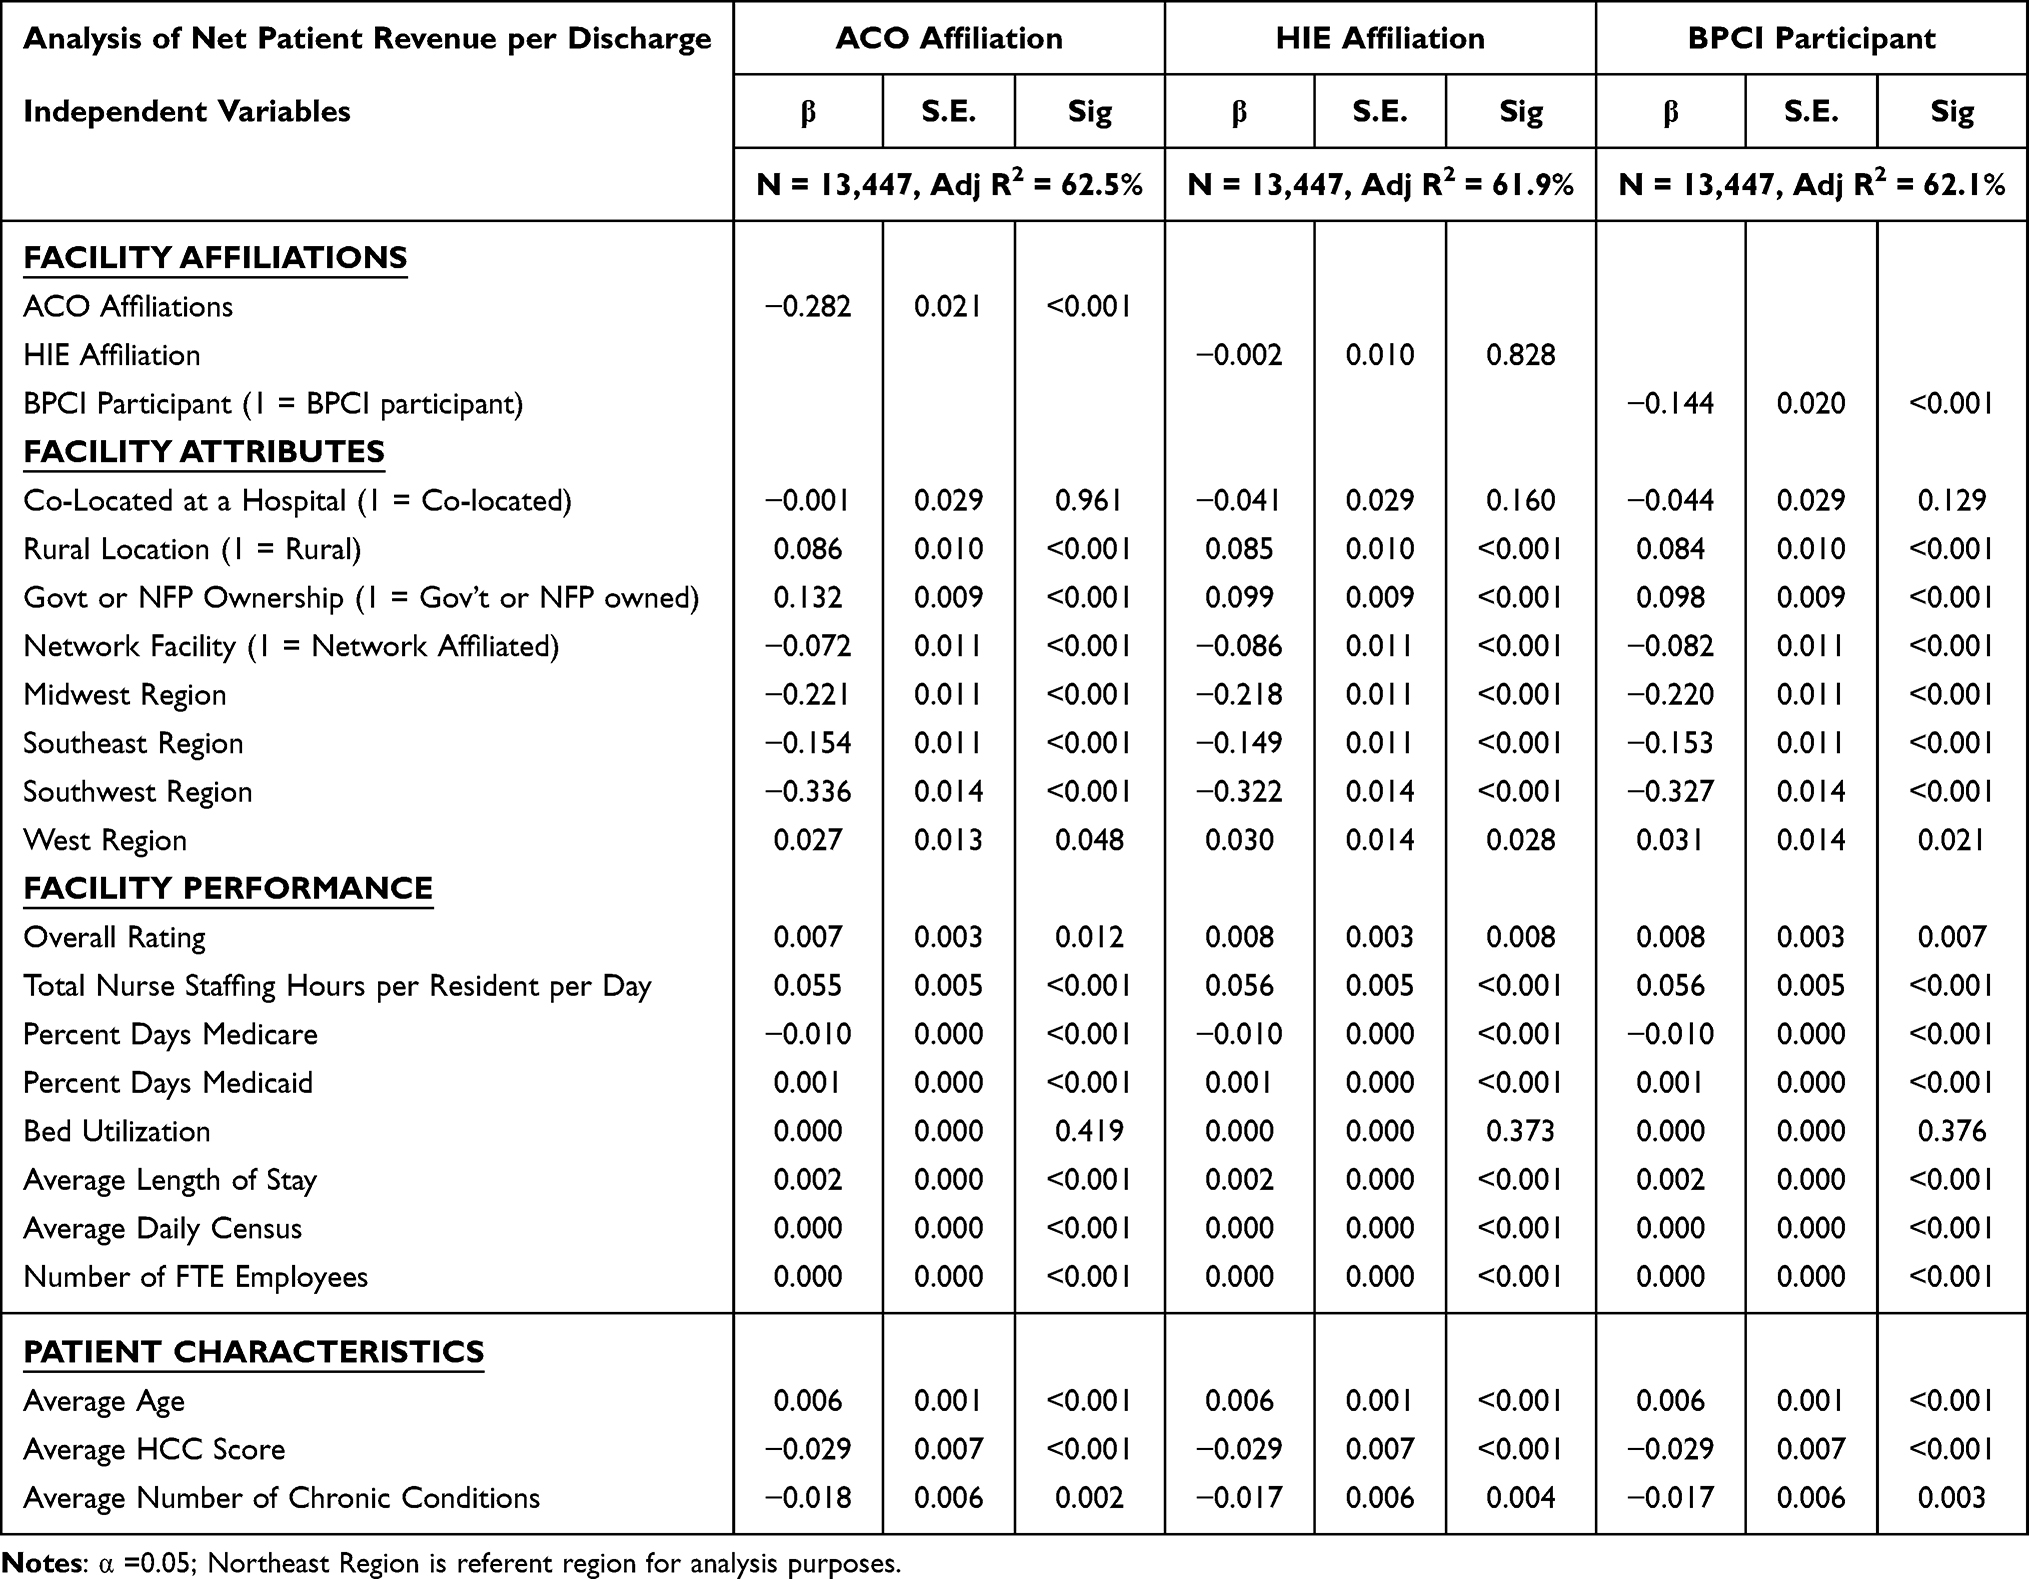 |
Table 4 Multiple Regression Analysis – Analysis of Net Patient Revenue per Discharge |
Due to the natural log transformation of the dependent variables, interpretation of our results requires adjustment of the parameter estimates for final analysis. Based on this, we can say that an increase of one unit in x is associated with a 100 × (eβ −1) change in y. In more simple terms, this implies that there is a percent change in y associated with a one-unit increase in x.
Net Patient Revenue per Bed
Analysis of factors that are associated with the Net Patient Revenue per Beddependent variable, we observe numerous significant associations. Among our independent variables of interest, we observed negative associations with ACO affiliation (−7.3%, p=<0.001). Positive associations were indicated with HIE affiliation (+1.4%, p=<0.051) and BPCI participation (+3.2%, p=<0.008). One example of a possible interpretation of these results is organizations that maintain an ACO affiliation or that see ACO patients experience, on average, 7.3% lower net patient revenues per bed than facilities that are not ACO affiliated. In contrast, facilities that participate in the BPCI program experience net patient revenues per bed 3.2% higher than those facilities that are not affiliated with the program.
Additional statistically significant observations of variables that weighed positively on NPRPB across all models include government or not-for-profit ownership (ranged between +7.2% and +8.0% across all models; p=<0.001), network affiliation (ranged between +3.2% and +3.6% across all models; p=<0.001), location in the Western region in comparison to the Northeast region (ranged between +3.8% and +4.0% across all models; p=<0.001), each point increase in CMS Overall Rating (+1.3% in all models; p=<0.001), each additional total nurse staffing hours per resident day (+7.9% in all models; p=<0.001) each percent Medicare days (+1.0% in all models; p=<0.001), each percent increase in bed utilization (+1.7% in all models; p=<0.001), each year increase in the average age of patients (+0.4% in all models; p=<0.001), and each point increase in patients’ HCC score (+5.0% in all models; p=<0.001).
Additional statistically significant observations of variables that were negatively associated with NPRPB across all models include rural location (ranged between −5.2% and −5.3% across all models; p=<0.001), Midwest location (ranged between −16.4% and −16.6% across all models; p=<0.001), Southeast location (ranged between −13.5% and −13.7% across all models; p=<0.001), Southwest location (ranged between −25.4% and −25.9% across all models; p=<0.001), each percent increase in days covered by Medicaid (−0.1% in all models; p=<0.001), and each additional chronic condition (−2.9% in all models; p=<0.001).
Three variables in the analysis were significant (p=<0.001) but with effect sizes too small to report: Average Length of Stay, Average Daily Census, and Number of FTE Employees.
Net Patient Revenue per Discharge
In the analysis of factors that are associated with the Net Patient Revenue per Dischargedependent variable, we also observe numerous significant associations. Among our independent variables of interest, we observed negative associations with ACO affiliation (−28.2%, p=<0.001) and BPCI participation (−14.4%, p=<0.001). HIE affiliation was not significant in this analysis. One example of a possible interpretation of these results is organizations that maintain an ACO affiliation experience, on average, 28.2% lower net patient revenues per discharge than facilities that are not ACO affiliated, and those in the BPCI program also see 14.4% lower revenue per discharge than those facilities that are not affiliated with the program.
Additional significant factors that weigh positively on NPRPD across all models include rural location (ranged between +8.4% and +8.6% across all models; p=<0.001), government or not-for-profit ownership (ranged between +9.8% and +13.2% across all models; p=<0.001), location in the Western region in comparison to the Northeast region (ranged between +2.7% and +3.1% across all models; p=<0.001), each point increase in CMS Overall Rating (ranged between +5.5% and +5.6% across all models; p=<0.001), each percent increase in Medicaid days (+0.1% in all models; p=<0.001), each additional nurse staffing hour per resident per day (ranged between +5.5% and +5.6% across all models; p=<0.001), and each day increase in average length of stay (+0.2% in all models; p=<0.001). And, from a patient perspective, each year increase in age increases revenue (+0.6% in all models; p=<0.001).
Negative associations with NPRPD include network affiliation (ranged between −7.2% and −8.6% across all models; p=<0.001), geographic location in the Midwest (ranged between −21.8% and −22.1% across all models; p=<0.001), location in the Southeast (ranged between −14.9% and −15.4% across all models; p=<0.001), and location in the Southwest (ranged between −32.2% and −33.6% across all models; p=<0.001). In addition, negative associations were noted related to percent days paid by Medicare (−1.0% in all models; p=<0.001), each point increase in HCC score (−2.9% in all models; p=<0.001), and average number of patient chronic conditions (ranged between −1.7% and −1.8% in all models; p=<0.001).
Similar to our earlier analysis of NPRPB, two variables in the analysis were significant (p=<0.001), but with effect sizes too small to report: Average Daily Census, and Number of FTE Employees.
Discussion
As the population of the United States ages, there is concern that the staff and healthcare delivery infrastructure may not be sufficient to support the demand for services. As a result, numerous healthcare industry initiatives have been undertaken to grow and develop system capabilities. However, above all, the facilities serving patients in need must be able to maintain adequate revenue generating potential with the intent of remaining economically solvent. Unfortunately, the pathway to achieve this outcome is not always clear. Thus, the intent of our work was to examine the implications of three recently established programs and initiatives that might be associated with SNF facilities’ financial performance. To our knowledge, this is the first work of this kind to examine these programs.
Our results pertaining to the impact of ACO and BPCI affiliation on NPRPD are arguably the most concerning findings in our work. Although these programs are focused on improving quality and reducing cost, there may be serious financial implications for long-term care facilities pursuing such affiliations. If the few ACO affiliated facilities are experiencing 28.2% lower NPRPD and BPCI participants are similarly challenged with 14.4% lower revenue, maintaining sufficient cash flow in these facilities must be a concern. As striking as our results are, the findings appear to be consistent with earlier research on similar CMS initiatives. For example, the newer Medicare Skilled Nursing Facility Value-Based Purchasing program (SNF-VBP) can both award financial incentives or penalties based on 30-day hospital readmission rates.49 A study by Burke, Xu, and Rose (2022) concluded that of the facilities which were studied, 63.1% received a financial penalty under the SNF-VBP program.50 Their findings showed that many of these lower-performing facilities were in areas with larger minority populations, showing a concerning disparity. Their findings were confirmed by Sharma, Hefele, Xu, Conkling, and Wang (2021) in their study, which found that those SNFs with the lowest profit margins were being penalized by at least a margin of 17% greater than other similar facilities.51 As these facilities may already have been operating in a financially precarious situation, further penalizing low-performing facilities can lead to quality issues and further struggles for these facilities. Additional work by Qi, Luke, Crecelius, and Joynt Maddox (2021) provided analysis of facilities being penalized by SNF-VBP.52 They found that small SNFs were more likely to be penalized financially. Further, they found that facilities that had a lower nurse staffing ratio also had higher odds of being penalized financially. Additionally, they found that SNFs that served low-income areas or those serving high populations of frail residents also had greater odds of being penalized.
These prior authors’ findings,considered with our own results, casts doubt on the long-term viability and effectiveness of the recently developed CMS programs. Although the intended focus is to improve quality and efficiency, one must wonder if the sizable decrease in revenue generating capability for ACO and BPCI participants on a per-discharge basis is sustainable over time. This thought, coupled with a movement away from including SNF and other rehabilitative facilities in the BPCI Advanced program, calls into question if other facilities will commit the time and resources necessary to advance care in a similar fashion for our expanding population of aging Americans.
Of equal note are our findings with respect to health information exchanges. Although not as impactful from a measurable magnitude standpoint, there is some promise in the finding that HIEs are associated with a 1.2% increase in net patient revenue per bed over those facilities that are not affiliated with an HIE. However, the fact that there does not appear to be any association at all when it comes to the net patient revenue per discharge is arguably the more significant finding. Given the intent of HIEs in the broader healthcare delivery context, it would stand to reason that improved electronic communication and care coordination among healthcare providers would lead to increased revenue generating potential per discharge. However, given the slow adoption of HIEs and the historical lack of financial incentive to migrate towards their use, it is possible that those organizations which are associated with HIEs have not yet fully matured in their understanding of how best to leverage HIE capabilities to maximize revenue generation potential.
Limitations & Future Research
This study has some limitations. First, there may be other influences on net patient revenue that we did not factor into our study. Although our R2 values are relatively high, there remains some unexplained variation that we cannot identify at the present time. One issue that could have influenced our work is the impact of the COVID-19 surges in late 2021 – early 2022. This may have had financial implications on our targeted study population. Future work might replicate our work and ascertain if our findings remain consistent without the potential undue influence from a widespread pandemic.
Second, beneficial future research could identify the latent or unobserved variables that we did not capture, inclusive of additional market level variables. Clearly, this would require a more detailed and comprehensive dataset of organizational and/or patient level data than we currently have access to, but we believe it would add substantive depth and quality to the study. For example, we acknowledge that our current study does not include specifics pertaining to the demographics or socioeconomic conditions of the local-supported patient population. Although we have included proxies for these factors in our study (ie, region, urban/rural, percent days Medicaid, etc.), none of these are precise measures of these important factors. We logic that local household resources have a role in revenue capture that we could not isolate and include in our study. We further conjecture that long-term care facilities located in more impoverished areas do worse in revenue capture than hospitals located in more affluent areas.
Third, this study uses a single cross-section of data, thus we are not able to assess strengthening or weakening of our studied associations, and we were not able to determine causality in the relationships between the independent and dependent variables. Future research might evaluate our observed relationships in a longitudinal study to determine if such organization affiliations affect SNF revenue generation capability and if the relationship changes over time.
Fourth, our study is also limited with respect to the BCPI program. Our data did not provide sufficient granularity to allow us to assess the differences in performance among participants in each of the four BPCI models. Future research could replicate our study and examine each model as its own independent variable. This would allow us to examine if there is any distinction in revenue generation in participating SNFs based on BPCI model participation.
Practice Implications
Numerous possible practice implications were observed throughout our findings. Although we cannot reasonably review every single one for the sake of brevity, arguably the most impactful observations centered on our results pertaining to ACO affiliation. Although this paper does not consider costs associated with ACO affiliation, our findings show an approximate decrease of 7.3% in revenue for those associated with ACOs. Providers must consider this finding, as the core focus of the ACO, improved quality and more efficient care, should be providing for an overall increase in reimbursement. As this is not the result we discovered, providers must consider where and why such losses in revenue might be incurred. An additional question to consider is whether it is the simple association with an ACO that is a strain on revenue or might the concern be the types of payers ACOs attract and types of patients they treat. In our view, this information should be considered duringor prior to ACO affiliation and throughout contract negotiations with ACO providers.
Further consideration of NPRPB showed an average 3.2% increase in revenue for facilities associated with a BPCI. Obviously, individual facilities need to assess their own specific operations, but this finding appears to be supportive of continued expansion of revenue enhancing BPCI affiliation from a facility perspective. However, we also observed that NPRPD had negative associations overall when ACO (−28.2%) and BPCI (−14.4%) affiliations were considered. We conjecture that the divergence in the BPCI affiliation results may be a product of the complexity of patients and associated discharges encountered during the study period. This would align with earlier findings by Joynt Maddox et al (2021) that indicated BPCI participating SNFs encountered a decrease in Medicare payments in patients with frailty.53 Conversely, we found positive associations between BPCI affiliation and both government/NFP operated (+9.8%) and rural (+8.4%) facilities. This indicates that these associations might be considered for financially distressed rural facilities as potential pathways to enhance revenue over time. Thus, we suggest that our findings must be translated to individual facilities and their specific considerations.
Additionally, a clear association was found between the number of nurse staffing hours and increased revenue per bed (+7.9% increase). We must ask if the increased revenue is a result of nurses performing more work with the residents or if the increased revenue comes from another source. Certainly, it follows that when a facility invests more in staffing, it would be done with some prospective thought given to potential financial benefit. However, the data analyzed here does not allow for such direct conclusions to be drawn. This is best left for a study focusing specifically on this topic. Yet, we also found a positive association between facility overall quality ratings and both revenue per bed and discharge. Considering similar findings for those with increased nurse staffing, it is logical to presume there is a connection between these two factors and a simple lesson for facility leaders: staff well, focus on quality, and revenue generation capability is likely to improve.
Finally, an increase of +1.7% in revenue per bed was found in those facilities with increased bed utilization. This is a commonsense result as one could reasonably expect to see an increase in revenue if there are more residents in the facility. The concern with this finding is the “why” behind it, as this paper did not fully consider the diagnoses of the residents associated with increased revenue. Yet, when considered in the context of our findings that associated residents’ age (+0.4%), and average HCC score (+5% per point increase), our findings show that as residents become more complex with age reimbursement increases to offset the increased amount of work being dedicated to each resident. However, our findings also show an associated decline in revenue per bed as the average number of chronic conditions increases (−2.9%). This might be because as the number of conditions grows, there is an upper limit to additional revenue received for each additional chronic condition and some diagnoses (such as Alzheimer’s disease or associated dementias) have lesser reimbursements and require more staffing hours to provide adequate care. This finding also gives specific reasoning for facilities to consider their own case mixes versus revenue, costs to provide care, and whether certain associations with ACOs or BPCIs are advantageous or not.
Conclusions
Ultimately, as the population of the United States rapidly ages, the need for supportive skilled nursing care has never been more important. However, in a healthcare system that leads the world in costs while also experiencing perpetual challenges in quality, the financial health of SNFs and nursing homes may often be relegated to a secondary concern among policy analysts and legislators. As programs emerge to cut costs and improve quality, in many cases the financial impact on SNF facilities is not well understood. Thus, in our study evaluating ACOs, HIEs, and participation in the BPCI program, we endeavored to bring clarity to this relationship and what associations with each of these programs might portend for skilled nursing facilities now and in the future. Ultimately, we found that ACO affiliation is negatively associated with net patient revenue per bed and discharge, HIE participation is positively associated with net patient revenue per bed, and BCPI involvement is positively associated with net patient revenue per bed, but negatively associated with net patient revenue per discharge.
Ethics Statement
Prior studies of this type have been reviewed by the Texas State University Research Integrity and Compliance (RIC) office. According to the provisions in 45 CFR § 46.102 pertaining to “human subject” research, the RIC has determined that studies of this type exclusively involve the examination of data originally collected from the public domain and curated by Definitive Healthcare is anonymous and publicly available. Therefore, the RIC has concluded research of this type does not use human subjects and is not regulated by the provisions in 45 CFR § 46.102 and therefore an IRB review of the study is not required.
Author Contributions
All authors who contributed to data analysis, drafting, or revising the article, have agreed on the journal to which the article will be submitted, gave final approval of the version to be published, and agreed to be accountable for all aspects of the work.
Funding
The researchers report no funding sources were used to complete this work.
Disclosure
The authors report no conflicts of interest in this work.
References
1. Keehan SP, Cuckler GA, Poisal JA, et al. National Health Expenditure Projections, 2019–28: expected Rebound In Prices Drives Rising Spending Growth: national health expenditure projections for the period 2019–2028. Health Aff. 2020;39(4):704–714. doi:10.1377/hlthaff.2020.00094
2. Hartman M, Martin AB, Benson J, Catlin A; National Health Expenditure Accounts Team. National Healthcare Spending In 2018: growth Driven By Accelerations In Medicare And Private Insurance Spending: US healthcare spending increased 4.6 percent to reach $3.6 trillion in 2018, a faster growth rate than that of 4.2 percent in 2017 but the same rate as in 2016. Health Aff. 2020;39(1):8–17. doi:10.1377/hlthaff.2019.01451
3. U.S. Census Bureau. U.S. Older Population Grew From 2010 to 2020 at Fastest Rate Since 1880 to 1890. U.S. Department of Commerce. Available from: https://www.census.gov/library/stories/2023/05/2020-census-united-states-older-population-grew.html#:~:text=The%20U.S.%20population%20age%2065,the%20United%20States%20in%202020.
4. Urban Institute The US Population is Aging. Available from: https://www.urban.org/policy-centers/cross-center-initiatives/program-retirement-policy/projects/data-warehouse/what-future-holds/us-population-aging.
5. Fulmer T, Reuben DB, Auerbach J, Fick DM, Galambos C, Johnson KS. Actualizing Better Health And Healthcare For Older Adults: commentary describes six vital directions to improve the care and quality of life for all older Americans. Health Aff. 2021;40(2):219–225. doi:10.1377/hlthaff.2020.01470
6. Foley KT, Luz CC. Retooling the healthcare workforce for an aging America: a current perspective. Gerontologist. 2021;61(4):487–496. doi:10.1093/geront/gnaa163
7. Rahman M, Norton EC, Grabowski DC. Do hospital-owned skilled nursing facilities provide better post-acute care quality? J Health Econ. 2016;50:36–46. doi:10.1016/j.jhealeco.2016.08.004
8. American Healthcare Association. State of Skilled Nursing Facility (SNF) Industry; 2022. Available from: https://www.ahcancal.org/News-and-Communications/Fact-Sheets/FactSheets/2022%20State%20of%20the%20SNF%20Industry%20Report.pdf.
9. Patel N, Singhal S. What to Expect in US Healthcare in 2023 and Beyond, McKinsey & Company; 2023. Available from: https://www.mckinsey.com/industries/healthcare/our-insights/what-to-expect-in-us-healthcare-in-2023-and-beyond.
10. Health Information Technology for Economic and Clinical Health (HITECH) Act, Title XIII of Division A and Title IV of Division B of the American Recovery and Reinvestment Act of 2009 (ARRA), Pub. L. No. 111-5, 123 Stat. 226 (Feb. 17, 2009) (full-text), codified at 42 U.S.C. §§300jj et seq.; §§17901 et seq.
11. Patient Protection and Affordable Care Act of 2010, Pub. L. No. 111–148, 124 Stat. 119 (2010), Codified as Amended 42 U.S.C. § 18001.
12. Wang YC, Chou MY, Liang CK, Peng LN, Chen LK, Loh CH. Post-acute care as a key component in a healthcare system for older adults. Ann Geriatric Med Res. 2019;23(2):54. doi:10.4235/agmr.19.0009
13. American Hospital Association. Fact Sheet: post-acute Care; 2019. Available from: https://www.aha.org/system/files/media/file/2019/07/fact-sheet-post-acute-care-0719.pdf.
14. MedPAC. Report to the Congress: medicare Payment Policy; 2021. Available from: https://www.medpac.gov/document/march-2021-report-to-the-congress-medicare-payment-policy/.
15. CMS. Custodial Care vs. Skilled Care. Available from: https://www.cms.gov/Medicare-Medicaid-Coordination/Fraud-Prevention/Medicaid-Integrity-Education/Downloads/infograph-CustodialCarevsSkilledCare-%5BMarch-2016%5D.pdf.
16. Murphy B. The Difference Between Nursing Homes and Skilled Nursing Facilities, Hebrew Senior Life; 2021. Available from: https://www.hebrewseniorlife.org/blog/difference-between-nursing-homes-and-skilled-nursing-facilities.
17. Centers for Medicare & Medicaid Services. Medicare Coverage of Skilled Nursing Facility Care; 2022. Available from: https://www.medicare.gov/Pubs/pdf/10153-Medicare-Skilled-Nursing-Facility-Care.pdf.
18. American Geriatrics Society. American Geriatrics Society Position Statement: Achieving High-Quality Multicultural Geriatric Care. American Geriatrics Society; 2016.
19. Yurfosky M, Ouslander JG. Medical care in skilled nursing facilities (SNFs) in the United States. UpToDate; 2021. Available from: https://www.uptodate.com/contents/medical-care-in-skilled-nursing-facilities-snfs-in-the-united-states.
20. Shi L, Singh DA. Delivering Health Care in America: A Systems Approach.
21. Medicaid and CHIP Payment and Access Commission (MACPAC). Estimates of Medicaid nursing facility payments relative to costs. MACPAC Issue Brief; 2023. Available from: https://www.macpac.gov/wp-content/uploads/2023/01/Estimates-of-Medicaid-Nursing-Facility-Payments-Relative-to-Costs-1-6-23.pdf.
22. Advisory Board. Bundled payment did not significantly lower Medicare spending, research shows; 2023. Available from: https://www.advisory.com/daily-briefing/2018/07/25/bpci.
23. Marselas K. Skilled nursing profits will shrink through 2026, even as other post-acute lines gain: analysis. McNights Long-Term Care News; 2023. Available from: https://www.mcknights.com/news/skilled-nursing-profits-will-shrink-through-2026-even-as-other-post-acute-lines-gain-analysis/.
24. Lord J, Landry A, Savage GT, Weech-Maldonado R. Predicting nursing home financial distress using the Altman Z-Score. J Healthcare Org Provision Financing. 2020;57.
25. Harris-Kojetin L, Sengupta M, Park-Lee E, et al. Long-term care providers and services users in the United States: data from the National Study of Long-Term Care Providers, 2013-2014. Vital Health Statistics. 2016;38:x–xii.
26. Sharma BAB, Ullrich R, Mackinney F, C. A, Mueller KJ. Trends in Nursing Home Closures in Nonmetropolitan and Metropolitan Counties in the United States, 2008-2018. Iowa City, Iowa, USA; 2021.
27. Flinn B. Nursing Home Closures and Trends, June 2015 – 2019. LeadingAge; 2020. Available from: https://leadingage.org/wp-content/uploads/drupal/Nursing%20Home%20Closures%20and%20Trends%202020.pdf.
28. Taylor M. 128 Nursing Homes Closed in 2022: numbers by State. Beckers Hospital Review; 2023. Available from: https://www.beckershospitalreview.com/post-acute/128-nursing-homes-closed-in-2022-numbers-by-states.html#R10.
29. U.S. Bureau of Labor Statistics. Employment, Hours, and Earnings from the Current Employment Statistics Survey (National), Nursing and Residential Care Facilities; 2023. Available from: https://data.bls.gov/timeseries/CES6562300001?amp%253bdata_tool=XGtable&output_view=data&include_graphs=true.
30. Harrington CA, Hailer L, Mollot RJ, Mukamel DB. Examining California nursing home profitability and related factors before and during the COVID −19 pandemic. J Am Geriatr Soc. 2023;71(8):2530–2538. doi:10.1111/jgs.18356
31. Chang CH, Mainor A, Raymond S, Peck K, Colla C, Bynum J. Inclusion of nursing homes and long-term residents in Medicare ACOs. Med Care. 2019;57(12):990–995. doi:10.1097/MLR.0000000000001223
32. Centers for Medicare and Medicaid Services. Skilled Nursing Facility 3-Day Rule Waiver; 2023. https://www.cms.gov/medicare/medicare-fee-for-service-payment/sharedsavingsprogram/downloads/snf-waiver-guidance.pdf.
33. Devine EB, Totten AM, Gorman P, et al. Health information exchange use (1990-2015): a systematic review. eGEMs. 2017;5(1):27. doi:10.5334/egems.249
34. Kruse CS, Marquez G, Nelson D, Palomares O. The use of health information exchange to augment patient handoff in long-term care: a systematic review. Appl Clin Inform. 2018;9(04):752–771. doi:10.1055/s-0038-1670651
35. Bennett RE, Tuttle M, May K, Harvell J, Coleman EA (2007). Health information exchange in post-acute and long-term care case study findings: final report. Aging Long-Term Care Policy.
36. Naylor MD, Kurtzman ET, Grabowski DC, Harrington C, McClellan M, Reinhard SC. Unintended consequences of steps to cut readmissions and reform payment may threaten care of vulnerable older adults. Health Aff. 2012;31(7):1623–1632. doi:10.1377/hlthaff.2012.0110
37. Cross DA, Adler-Milstein J. Investing in post-acute care transitions: electronic information exchange between hospitals and long-term care facilities. J Am Med Dir Assoc. 2017;18(1):30–34. doi:10.1016/j.jamda.2016.07.024
38. Cross DA, McCullough JS, Adler-Milstein J. Drivers of health information exchange use during postacute care transitions. Am J Manag Care. 2019;25(1):e7–e13.
39. HIMSS (2021) Understanding the Information Blocking Rule and Its Application in Skilled Nursing Facilities. https://www.himss.org/resources/information-blocking-rule-and-its-application-skilled-nursing-facilities-white-paper.
40. Centers for Medicare & Medicaid Services. Bundled Payments for Care Improvement Initiative Fact Sheet; 2014. Available from: https://www.cms.gov/newsroom/fact-sheets/bundled-payments-care-improvement-initiative-fact-sheet-0.
41. Lewin Group. CMS Bundled Payments for Care Improvement Initiative Models 2-4: year 3 Evaluation & Monitoring Annual Report; 2018. Available from: https://downloads.cms.gov/files/cmmi/bpci-models2-4yr3evalrpt.pdf.
42. Centers for Medicare & Medicaid Services. BPCI Advanced; 2022. Available from: https://innovation.cms.gov/innovation-models/bpci-advanced.
43. LaPointe J. Orgs Troubled by Post-Acute Care’s Role in New Bundled Payments; 2022. Available from: https://revcycleintelligence.com/news/orgs-troubled-by-post-acute-cares-role-in-new-bundled-payments.
44. Ying M, Temkin-Greener H, Thirukumaran CP, Maddox KEJ, Holloway RG, Li Y. Skilled nursing facility participation in a voluntary Medicare bundled payment program: association with facility financial performance. Med Care. 2022;60(1):83–92. doi:10.1097/MLR.0000000000001659
45. Ly DP, Cutler DM. Factors of US hospitals associated with improved profit margins: an observational study. J Gen Intern Med. 2018;33(7):1020–1027. doi:10.1007/s11606-018-4347-4
46. Kaufman NS. Net revenue per adjusted discharge continues to drive success. J Healthcare Manage. 2013;58(1):8–11. doi:10.1097/00115514-201301000-00003
47. Definitive Healthcare. Healthcare Analytics & Provider Data|Definitive Healthcare. Available from: https://www.defhc.com.
48. IBM Corp. IBM SPSS Statistics for Windows (Version 28.0) [Computer Software]. IBM Corp; 2023.
49. Centers for Medicare and Medicaid Services. The Skilled Nursing Facility Value-Based Purchasing (SNF VBP) program; 2023. Available from: https://www.cms.gov/medicare/quality-initiatives-patient-assessment-instruments/value-based-programs/snf-vbp/snf-vbp-page.
50. Burke RE, Xu Y, Rose L. Skilled Nursing Facility Performance and Readmission Rates Under Value-Based Purchasing. JAMA Network Open. 2022;5(3):e220721. doi:10.1001/jamanetworkopen.2022.0721
51. Sharma H, Hefele JG, Xu L, Conkling B, Wang X. “Joyce.” First Year of Skilled Nursing Facility Value-based Purchasing Program Penalizes Facilities With Poorer Financial Performance. Med Care. 2021;59(12):1099. doi:10.1097/MLR.0000000000001648
52. Qi AC, Luke AA, Crecelius C, Joynt Maddox KE. Performance and Penalties in Year 1 of the Skilled Nursing Facility Value‐Based Purchasing Program. J Am Geriatr Soc. 2020;68(4):826–834. doi:10.1111/jgs.16299
53. Joynt Maddox KE, Barnett ML, Orav EJ, Zheng J, Grabowski DC, Epstein AM. Savings and outcomes under Medicare’s bundled payments initiative for skilled nursing facilities. J Am Geriatr Soc. 2021;69(12):3422–3434. doi:10.1111/jgs.17409
 © 2023 The Author(s). This work is published and licensed by Dove Medical Press Limited. The
full terms of this license are available at https://www.dovepress.com/terms
and incorporate the Creative Commons Attribution
- Non Commercial (unported, 3.0) License.
By accessing the work you hereby accept the Terms. Non-commercial uses of the work are permitted
without any further permission from Dove Medical Press Limited, provided the work is properly
attributed. For permission for commercial use of this work, please see paragraphs 4.2 and 5 of our Terms.
© 2023 The Author(s). This work is published and licensed by Dove Medical Press Limited. The
full terms of this license are available at https://www.dovepress.com/terms
and incorporate the Creative Commons Attribution
- Non Commercial (unported, 3.0) License.
By accessing the work you hereby accept the Terms. Non-commercial uses of the work are permitted
without any further permission from Dove Medical Press Limited, provided the work is properly
attributed. For permission for commercial use of this work, please see paragraphs 4.2 and 5 of our Terms.