Back to Journals » Risk Management and Healthcare Policy » Volume 15
The Association Between Air Pollutants and Daily Outpatient Visits for Allergic Rhinitis: A Time-Series Analysis Based on Distribution Lag Nonlinear Model in Chongqing, China
Received 16 May 2022
Accepted for publication 25 July 2022
Published 8 August 2022 Volume 2022:15 Pages 1501—1515
DOI https://doi.org/10.2147/RMHP.S373085
Checked for plagiarism Yes
Review by Single anonymous peer review
Peer reviewer comments 2
Editor who approved publication: Professor Mecit Can Emre Simsekler
Dan Yang,1 Yongjie Yan,1 Kexue Pu1,2
1School of Medical Information, Chongqing Medical University, Chongqing, People’s Republic of China; 2Medical Data Research Institute of Chongqing Medical University, Chongqing, People’s Republic of China
Correspondence: Kexue Pu, Chongqing Medical University, Yuanjiagang Campus of Chongqing Medical University, No. 1 Medical College Road, Yuzhong District, Chongqing, People’s Republic of China, Tel +86 15683896497, Email [email protected]
Background: Allergic rhinitis (AR) is a severe and the most common chronic allergic disease, affecting 10– 40% of the world population. The effect of air pollutants on AR has been confirmed in clinical experiments.
Purpose: This study aimed to quantify the association between air pollutants and daily outpatient visits for AR in Chongqing, China.
Methods: Based on the data of AR outpatients in the primary urban area of Chongqing from 2016 to 2017, along with the atmospheric pollutants and meteorological data in the same period, the distributed lag nonlinear model (DLNM) and generalized additive model (GAM) were used to analyze the time-series. We examined the effects of the single and double pollutant models with a maximum lag day of 30 days. Effect estimates were described as relative risk (RR) and 95% confidence intervals (CIs) in daily outpatient visits for AR per 10 μg/m3 increases in PM2.5, PM10, SO2, NO2, O3, and per 1 mg/m3 increase in CO.
Results: A single pollutant’s O3 level had an immediate positive effect on AR within two days, the relative risks (RR, 95% CI) were 1.066 (1.008– 1.127), 1.057 (1.005– 1.112) and 1.048 (1.002– 1.097). PM2.5 had a lag effect within 11– 18 days, the max relative risks (RR, 95% CI) were 1.083 (1.010– 1.160). Moreover, O3, PM2.5, PM10, SO2 and NO2 had significant effects on AR in the two-pollutant model. The RR cumulative effect of PM2.5 became more pronounced as the concentration increased. The cumulative effect of NO2 was lesser than PM2.5.
Conclusion: Air pollutants were associated with the daily outpatient visits for AR, which may have considerable implications for developing tailored health policies and services to prevent AR in Chongqing and even all over the world.
Keywords: allergic rhinitis, air pollution, time-series analysis, generalized additive model, distributed lag nonlinear model
Introduction
Air pollution has become an extremely important health risk factor and an important cause of respiratory death and morbidity1 (Ingrid, 2021). Air pollution monitoring and control have become a focal point of global environmental protection. China, the world’s largest developing country, is dealing with considerable air pollution issues. The root cause of air pollution lies in the rapid development of industrialization, regional characteristics, and the interactions of meteorological and environmental factors.
Clinically, allergic rhinitis (AR) is defined as a nasal symptomatic disease caused by IgE (immunoglobulin)-mediated inflammation after allergen exposure. It is the most common chronic allergic disease, affecting 10–40% of the global population2 (Bousquet, 2008). Sneezing, itching, runny nose, and nasal congestion are the most common nasal symptoms of AR. It can cause upper-jaw itching, coughing, and swollen eyes. AR can cause fatigue and irritability by impairing cognitive function and sleep quality. Other negative health conditions, including rhinosinusitis and asthma, are associated with AR, which are also associated between them3,4 (Gao, 2021)(Marseglia, 2010). When AR occurs, it not only has a significant impact on the quality of life of patients but also imposes a significant psychological, social, economic, and health burden on the society and country5 (D’amato, 2015).
In recent years, the influence of atmospheric environmental factors on AR has attracted considerable attention and international interest. Chu et al described the impact of atmospheric particulate matter and AR in Nanjing, and their results suggested that exposure to PM10 and PM2.5 was associated with the risk of AR6 (Chu, 2019). To et al investigated the relationship between early-life exposure to air pollution and childhood asthma, AR, and eczema. Exposures to oxidant air pollutants (O3 and NO2) but not PM2.5 was associated with an increased risk of incident asthma7 (To et al, 2020). Smith et al examined the effects of air pollution from livestock farms on asthma and AR in nearby residents; modelled PM10 emission was inversely associated with asthma and AR8 (Smith et al, 2014). This meta-analysis showed a positive association between air pollution and the prevalence of AR, and identified geographic regions and economic level as the potential modifiers for the association9 (Li, 2022). These papers demonstrated an association between exposure to air pollution and the risk of AR,
Chongqing is the most populous city of industry, transportation, and economy in Southwest China. It is known as the “capital of mountain fog.” The unique regional environment, which includes mountains and the confluence of two rivers, along with the humid air near the ground is responsible for the weather to become cloudy and rainy. It is affected by high relative humidity, low wind speed, and weak solar radiation, thus resulting in severe local air pollution. Zhao’s study demonstrated that the prevalence of AR in Chongqing was 20.42% in 201010 (Zhao, 2010), whereas Hu’s research discovered that the prevalence of AR in Chongqing in 2017 was 28.5%11 (Hu, 2017).
Consequently, we conducted correlation analysis based on the daily outpatient clinical data of AR and combined it with the same period air quality and meteorological monitoring data in Chongqing. In this study, the generalized additive model (GAM) and the distributed lag nonlinear model (DLNM) were used for time-series analysis to examine the association between air pollutants and AR in Chongqing.
Materials and Methods
Data Sources for Outpatients with AR
The daily outpatient visits (additional unexpected visits) for AR from January 1, 2016 to December 31, 2017 were obtained from the electronic medical record data on the platform of the Medical Data Research Institute of Chongqing Medical University. The retrospective clinical data had been anonymous and desensitized. The data platform contains data from six hospitals, which are: the Second Affiliated Hospital of Chongqing Medical University (Class III Class A Teaching Hospital), the Third Affiliated Hospital of Chongqing Medical University (Class III Hospital), Yongchuan Hospital Affiliated to Chongqing Medical University (Class III Class A Hospital), University City Affiliated to Chongqing Medical University (Class III Hospital), Chongqing Southeast Hospital (Class II Class A hospital), and Tongliang District People’s Hospital of Chongqing (Class II Class A Hospital). The principal diagnostic classification of AR was included based on the historical electronic medical records as per the 10th edition of the International Classification of Diseases (ICD-10, J30.401). Moreover, outpatients with other respiratory diseases and allergic diseases were excluded. Based on this standard, the clinical data meeting the research standards were extracted, the current situation was analyzed, and the disease information database of AR was established. The Ethics Committee of Chongqing Medical University has reviewed the proposed use of human subjects in the above mentioned projects. Due to the retrospective nature of the study, the patient-level data obtained do not require the patient’s informed consent. The Ethics Committee of Chongqing Medical University waived the need for informed consent. We confirmed that the data was anonymized or maintained with confidentiality.
Air Pollutants and Meteorological Data
The data of air pollutants were obtained from Chongqing Municipal Ecological Environmental Bureau, primarily the daily average concentrations of PM2.5, PM10, SO2, NO2, CO, and O3-8h (max) from January 1, 2016 to December 31, 2017. There were 17 fixed monitoring stations that measure concentrations of air pollution in Chongqing. The data of air pollutants was the average of concentrations from all monitoring sites. Meteorological data were collected by the China Meteorological Data network, including daily average temperature, average humidity, and average air pressure. The meteorological data collected had three discrete days of missing values. The method used to fill in the missing values was to average the first two days and the next two days.
Statistical Analysis
In this study, all data were separately entered by the two personnel checked before being entered in the database. To analyze the characteristics of AR incidence and develop a time-series database, Excel 2016 was used. The correlation between air pollutants and incidence rate of AR were demonstrated using Spearman correlation analysis. All tests were two-sided, and we considered P < 0.05 to be statistically significant. The related factors were included in the DLNM to analyze the association between air pollutants and AR. In the model, the incidence of AR was treated as the dependent variable and air pollutants as the independent variable. Moreover, confounding factors, such as meteorological factors, long-term trends, seasonal trends, day of the week effect, and holiday effects, were controlled.
GAM are free and flexible statistical models, which can be used to detect the influence of nonlinear regression. The GAM combines the generalized linear model and additive model distinguished using various nonparametric smoothing functions to control the effect of confounding factors and simulate the correlation between pollutants and health endpoints12 (Hastie, 1986). GAM takes the following shape:

where g(E(Y)) is the expected connection function of the dependent variable, and  and
and  are various basis functions for fitting nonlinear relationships13 (Huang, 2014).
DLNM add lag dimension to the exposure–response relationship using a cross basis function to describe the distribution of dependent variables in both the independent variable dimension and lag dimension, allowing it to evaluate both the lag effect and nonlinear effect of exposure factors. The form of DLNM is as follows:

where g() is the family of linked functions, Y is the outcome variable, Xi is an independent variable, and fj is various basis functions of independent variable Xi, μtk is other confounding factor, βj and γk are the corresponding parameters in the equation14 (Gu, 2016).
For the entire population of Chongqing, the incidence and treatment events of outpatients with daily AR were relatively less, belonging to small probability events, which approximately obeyed the Poisson distribution. Quasi-Poisson regression would be better than Poisson to deal with over-dispersion in the analysis. Consequently, the quasi-Poisson distribution was selected as the connection function in the GAM to fit the exposure–response relationship between the number of outpatients with AR and multiple influencing factors.

In our model, where Yt is the daily outpatient visits for AR on day t, α is the model intercept, β is a vector of coefficients for air pollutant response variable, and ns() is the cross basis matrix generated by DLNM, ns is a natural cubic spline function, temp is daily average temperature, rhum is daily average relative humidity, the press is daily average air pressure, timenum is time ordinal variable (timenum = 1, 2, 3, …, 731), and it was used to control the long-term trend and seasonal trend of the number of patients with AR, df was degrees of freedom of natural cubic spline function, the holiday was controlled as a binary variable with holidays and rest days. We considered 6–10 df for calendar time and 3–7 df for environmental factors. As per the GCV method, we finally decided to use a natural cubic spline of 7 df per year in the model to control for the long-term and seasonal trends. For environmental factors, a 3 df natural cubic spline was used to control for their effects.
Based on the acquired basic data, the model of association between air pollutants and AR was built. A GAM was developed to deal with the complex nonlinear observation relationship between multi component explanatory variables in air pollutants and dependent variables of AR results; adjust potential confounding factors such as long-term trend, seasonal trend, and meteorological factors; and quantitatively evaluate time-series analysis of the health effects of air pollution. The DLNM was then developed. The cross basis function was established to describe and evaluate the distribution of AR in the independent variable dimension and lag dimension of air pollutants, and the 3D spatial distribution map of exposure lag response relationship was obtained to visualize the lag effect and nonlinear effect of exposure factors.
In the models, we examined the effects of the single pollutant and double pollutant models with a maximum lag period of 30 days15 (Zhang, 2020). Moreover, a double-pollutant model was fitted with the same parameter settings as the single model to confirm the pollutant effect estimates after controlling for simultaneous exposure to other pollutants.
Sensitivity Analysis
Sensitivity analysis was performed to identify the robustness of the results by fitting two-pollutant models that correlation coefficient r > 0.80 between air pollutants was not included in multipollutant model to avoid collinearity among the independent variables, and changing the df values in the natural cubic spline function of calendar time (6–10 df) and meteorological variables (3–7 df).
Mathematical and statistical analyses were performed using R 4.1.1 software and SPSS 23.0. GAM and DLNM were performed using the “mgcv” and “dlnm” packages. In daily outpatient visits, effect estimates were described by relative risk (RR) and 95% confidence intervals (CIs) for AR per 10 μg/m3 increase in PM2.5, PM10, SO2, NO2, and O3, and per 1 mg/m3 increase in CO.
Results
Data Description
The time series study was performed between January 1, 2016 and December 31, 2017. During the period of the study, a total of 12,868 cases for AR outpatients were included for these analyses. Table 1 summarizes the characteristics of daily AR outpatients, meteorological variables, and air pollution variables in Chongqing from 2016 to 2017. The average values of PM2.5, PM10, SO2, NO2, CO, O3, press, temp, rhum and daily AR outpatients were 49.4 µg/m3, 74.7 µg/m3, 12.4 µg/m3, 46.4 µg/m3, 0.96 µg/m3, 70.7 µg/m3, 983.4 hPa, 19.5°C, 75.2% and 18. Figure 1 displays the time series of daily AR outpatients. The daily number of AR outpatients ranged from 0 to 53. And it showed that the number of cases per day about 6–30 was mostly frequent, which illustrated the relatively high prevalence of AR and the number of visits in Chongqing to a certain extent, and there was an obvious long-term and seasonal trend.
 |
Table 1 Characteristics of Daily Number for AR Outpatients, Air Pollutants, and Meteorological Factors |
 |
Figure 1 Daily numbers of outpatients of time series. |
Relationships Between Air Pollutions, Environmental Factors and AR Outpatients
The Spearman correlation coefficient between air pollution and meteorological data is shown in Table 2. Table 2 demonstrates that PM2.5 was a strong positive correlation with SO2, NO2, and CO, and a negative correlation between O3. It was worth noting that PM2.5 and PM10 were highly correlated (correlation coefficient r = 0.956). PM10, SO2, and O3 had no statistical significance and no correlation, and other pollutants were positively correlated. NO2 and CO had a negative relationship with O3; however, others had a positive relationship. There was a strong inverse relationship between air pressure and O3 and a positive relationship between other air pollutants. The temperature had a strong positive correlation with O3 and a negative correlation with other pollutants. Relative humidity had a strong inverse relationship with O3, a positive correlation with CO, no correlation with PM2.5, and a negative relationship with other pollutants. There was a positive relationship between O3 and temperature in AR outpatients, and other pollutants and meteorological factors had an impact. We considered that once the correlation between two independent variables of air pollutants was greater than 0.8, only one of the air pollutants would be included in our model at one time to eliminate multicollinearity.
 |
Table 2 Spearman’ s Correlation Coefficients Between Air Pollutants and Meteorological Variables |
Association Analysis of Model
We developed the single pollutant and two-pollutant models and used the natural cubic spline function to control the long-term trend of time with 7 df per year and the effect of meteorological factors (air temperature, air pressure, and relative humidity) with 3 df. As binary response variables, holidays and weekends were controlled.
Single Pollutant Model
As per the abovementioned Spearman correlation analysis results, O3 and air temperature had a positive correlation and immediate effect on AR, NO2 was irrelevant, and others were negatively correlated. Subsequently, we examined the lag and cumulative utility of air pollutants and including statistically significant air pollutants.
As shown in Table 3, the lag effect of O3 was significantly strong, and with the delay of lag days, the utility gradually weakened, disappeared after a lag of 2 days, each 10 μg/m3 increase in the concentration of atmospheric O3 led to an increase in the number of AR outpatients with relative risks (RR, 95% CI) of 1.066 (1.008–1.127), 1.057 (1.005–1.112) and 1.048 (1.002–1.097). The hysteresis effect of PM2.5 at high concentration was more obvious, and the stronger the effect with increasing of high concentration, the best hysteresis range was in 11–18 days, as shown in Figures 2 and 3, each 10 μg/m3 increase in the concentration of PM2.5 led to an increase in the number of AR outpatients with relative risks (RR, 95% CI) of 1.071 (1.002–1.141), 1.077 (1.006–1.150), 1.081 (1.009–1.156), 1.083 (1.010–1.160), 1.083 (1.011–1.160), 1.081 (1.010–1.158), 1.077 (1.008–1.153) and 1.071 (1.005–1.146) (in Table 3).
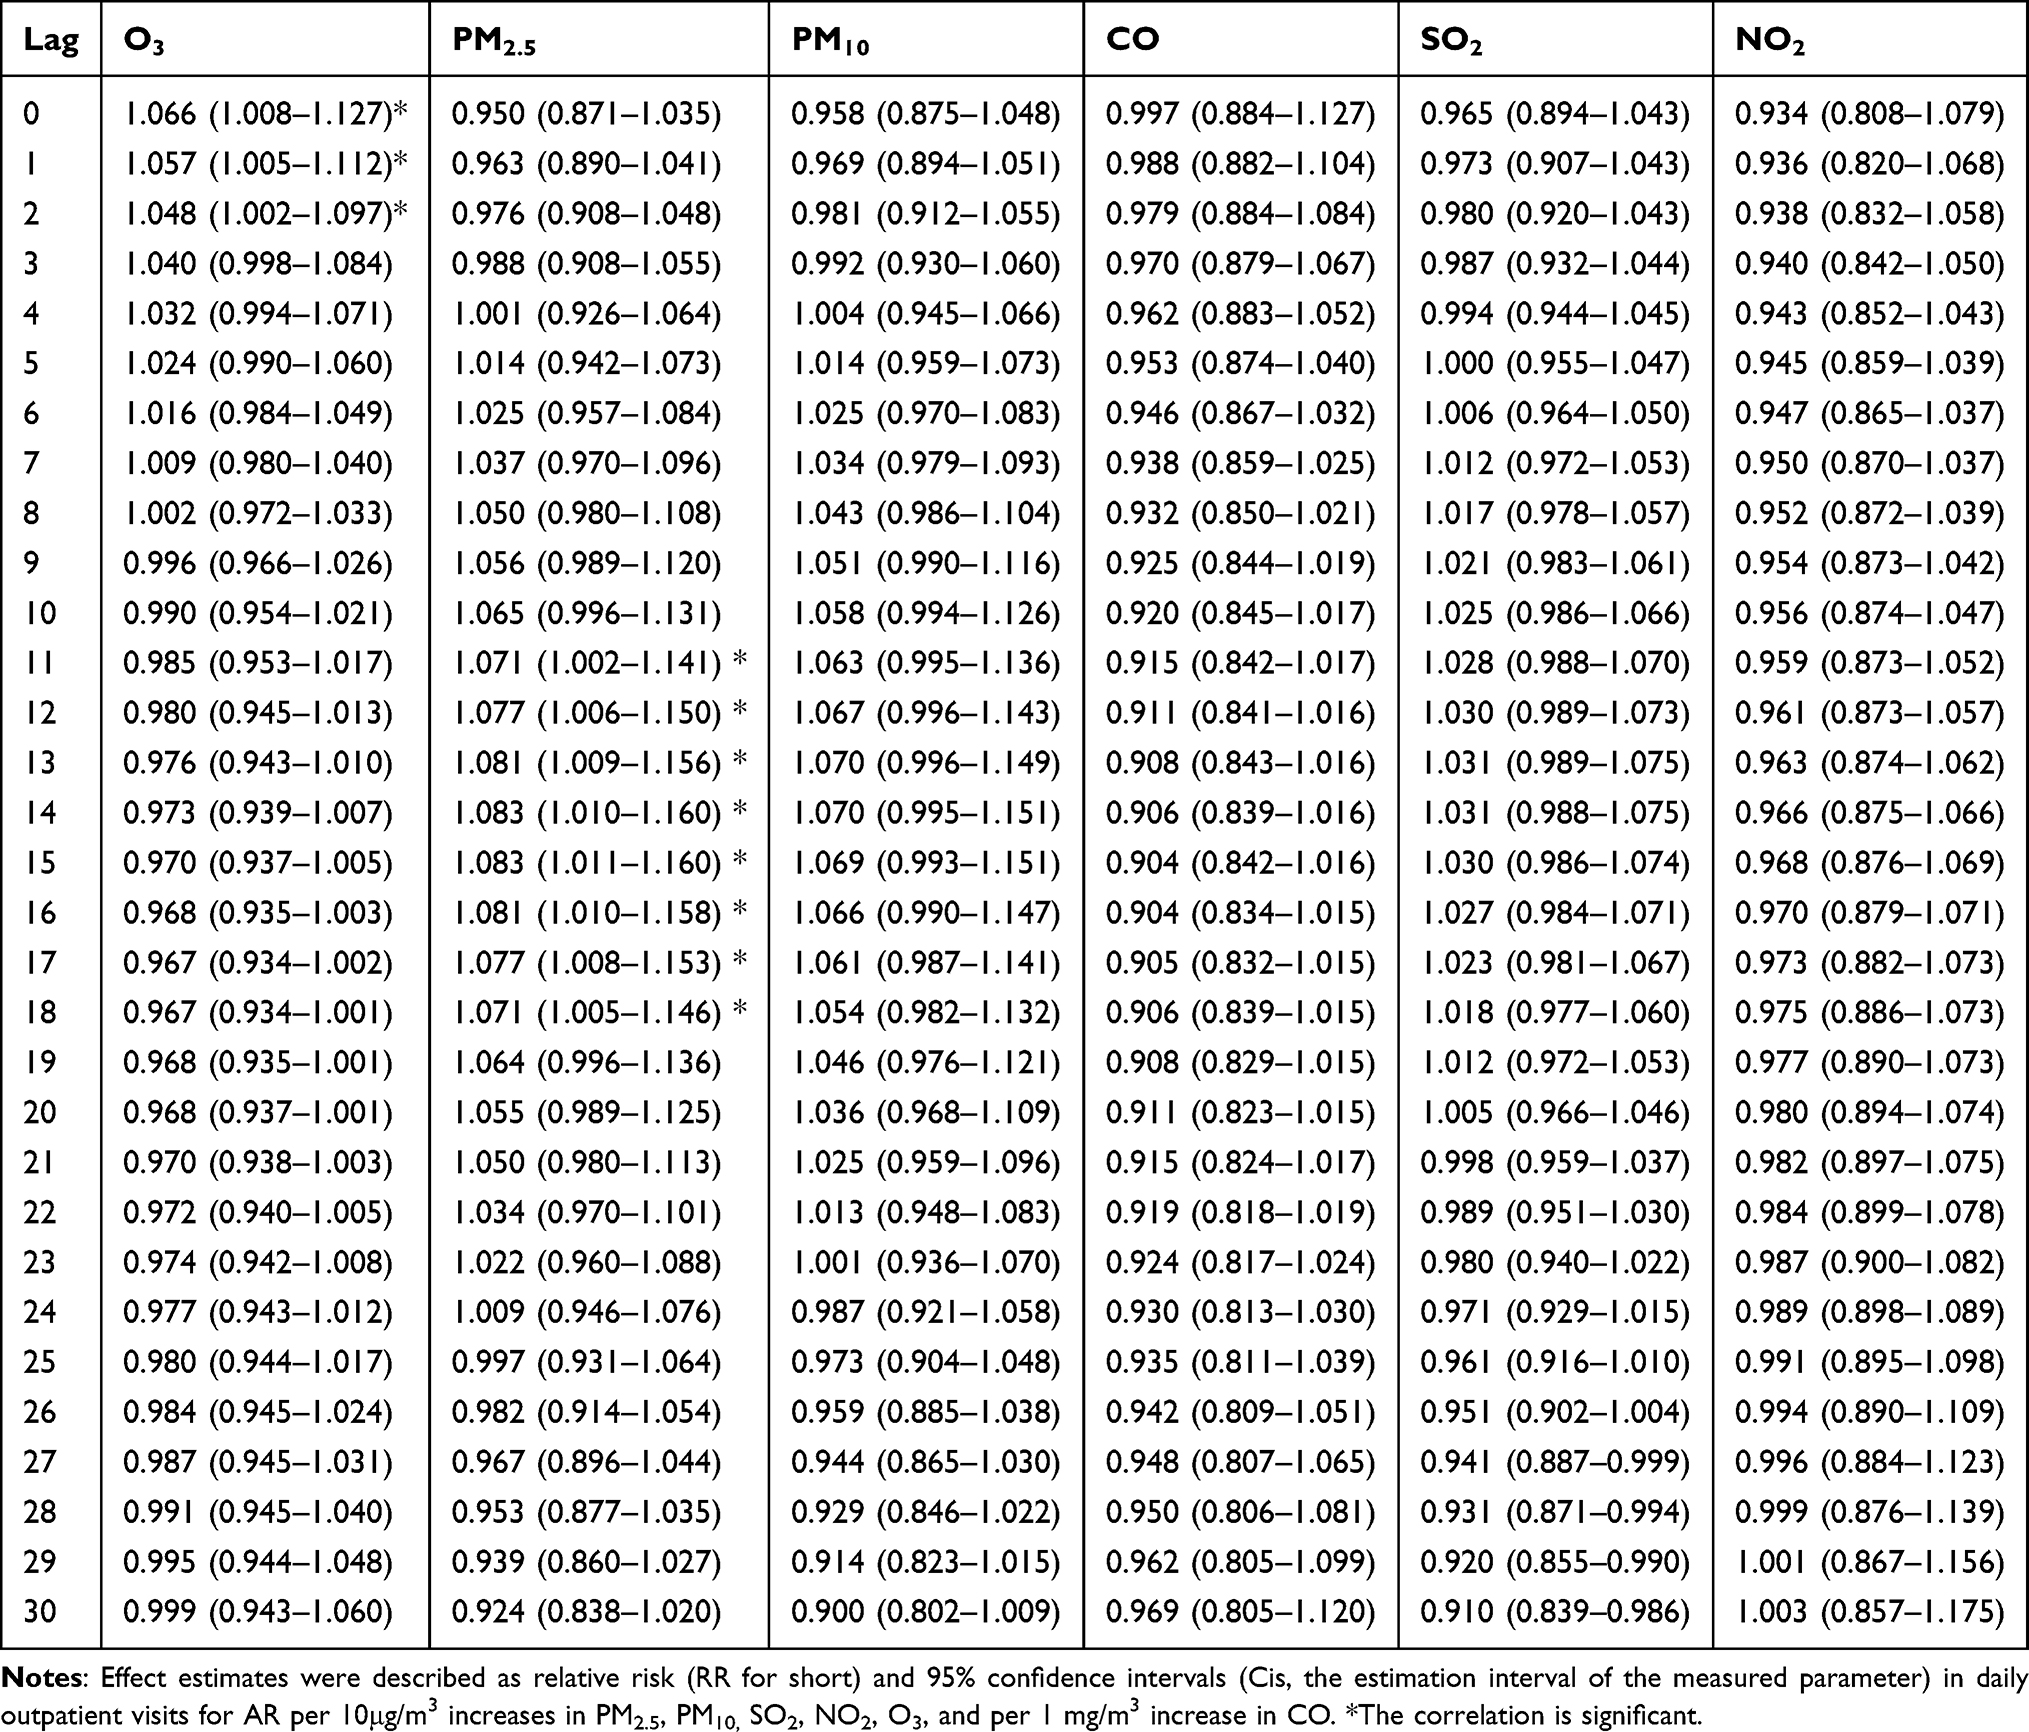 |
Table 3 The RR of Effects of Air Pollutants on Outpatients with AR in Single Pollutant Model |
 |
Figure 2 Lag effect diagram of O3 (A) and PM2.5 (B) in single pollutant model. |
 |
Figure 3 Hysteresis three-dimensional effect diagram O3 (A) and PM2.5 (B) in single pollutant model. |
The other four single pollutant models (PM10, SO2, NO2, and CO) were not statistically significant, each 10 μg/m3 increase in the concentration of PM10, SO2 and NO2 with relative risks (RR, 95% CI) of 0.958 (0.875–1.048), 0.965 (0.894–1.043) and 0.934 (0.808–1.079), each 1 mg/m3 increase in the concentration of CO with relative risks (RR, 95% CI) of 0.997 (0.884–1.127) (in Table 3).
Two- Pollutant Model
In the two-pollutant model, because of the high correlation between PM10 and PM2.5 in collinearity analysis (r = 0.956), only one of PM2.5 and PM10 would be included in our model at one time to control collinearity. Table 4 demonstrates that on the basis of adjusting the cross basis of CO and NO2, O3 still acted an effect on AR outpatients, each 10 μg/m3 increase in the concentration of O3 with relative risks (RR, 95% CI) of 1.049 (1.003–1.098) and 1.044 (1.002–1.087). After adjusting the cross criteria for O3, CO, SO2, and NO2, PM2.5 affected AR outpatients with relative risks (RR, 95% CI) of 1.033 (1.012–1.178), 1.083 (1.004–1.212), 1.001 (1.002–1.142) and 1.092 (1.001–1.184) for each 10 μg/m3 increase in PM2.5 concentration. When adjusting the cross criteria of O3, CO, and SO2, PM10 affected AR outpatients with relative risks (RR, 95% CI) of 1.089 (1.001–1.183), 1.137 (1.003–1.249), and 1.035 (1.006–1.064) for each 10 μg/m3 increase. After adjusting the cross criteria of NO2, the effect of PM10 was not statistically significant, with a relative risk (RR, 95% CI) of 1.074 (0.765–1.174). The impact of CO was not statistically significant after adjusting the cross criteria of other five pollutants. The effect of SO2 was statistically significant after adjusting the cross criteria of O3, PM2.5, PM10, and CO, with relative risks (RR, 95% CI) of 1.070 (1.003–1.125), 1.012 (1.001–1.022), 1.009 (1.001–1.018) and 1.061 (1.001–1.124). The effect of NO2 was statistically significant after adjusting the cross criteria of PM2.5 and CO, with a relative risk (RR, 95% CI) of 1.021 (1.001–1.048) and 1.022 (1.001–1.041) (in Table 4, Figures 4 and 5).
 |
Table 4 The RR of the Effects of Air Pollutants on Outpatients with AR in Two-Pollutant Model |
 |
Figure 4 Lag-effect diagram of O3 (A and B), PM2.5 (C–F), PM10 (G–I), SO2 (J–M) and NO2 (N and O) in two-pollutant model. |
 |
Figure 5 Three-dimensional effect diagram of O3 (A and B), PM2.5 (C–F), PM10 (G–I), SO2 (J–M) and NO2 (N and O) in two-pollutant model. |
Figure 6 shows the cumulative effect of PM2.5 and NO2 in the double-pollutant model. The RR cumulative effect of PM2.5 became more pronounced as the concentration increased. The cumulative impact of NO2 was smaller than PM2.5. Other pollutants had no obvious cumulative effect. Sensitivity analysis results indicated that alternative df values did not substantially influence the effect estimates for the association between air pollution and AR outpatients for time (6–10 per year) and environmental factors (3–7).
 |
Figure 6 Cumulative effect diagram of PM2.5 (A) and NO2 (B) in two-pollutant model. |
Discussion
There is growing interest in the associations between air pollution and risk of AR, but data on the associations in low- or middle-income cities are still limited, especially in southwest China. Chongqing is rapidly growing as China’s major industrial, transportation, and economic city. Private cars are becoming increasingly common as people’s standard of living improves. The massive emission of industrial exhaust and automobile exhaust makes the atmospheric environment of Chongqing particularly tense. Therefore, we conducted the time series study combining with DLNM to evaluate the short-term effects of ambient air pollutants on daily outpatient visits for AR in Chongqing. The data obtained in our analysis indicated that short-term exposure to O3, PM2.5, PM10, NO2 and SO2 was significantly associated with the increase of AR outpatient visits, and the effect of CO was not statistically significant. The sensitivity analysis showed a robustness of the pollutant model results.
Air pollutants in Chongqing have harmed various chronic diseases. Ding and Wang believed that exposure to air pollution would trigger asthma attacks in Chongqing hospitals16,17 (Ding, 2017)(Wang, 1993). Wang examined that the increased concentration of air pollution led to the increased mortality of respiratory diseases in Chongqing18 (Wang, 2020). She examined that the increase of atmospheric PM2.5 concentration was related to the increase of emergency patients with cardiovascular and cerebrovascular diseases in Chongqing19 (Zhang, 2020). Tang examined the relationship between short-term exposure to air pollution and sudden stroke in Chongqing20 (Tang, 2021). This research had conclusively demonstrated that air pollutants in Chongqing had a relatively negative impact on chronic diseases. Therefore, emphasis should be placed on the prevention and control of air pollutants and their impact on related chronic diseases in Chongqing. AR is a kind of chronic allergic disease with relatively high incidence in Chongqing11(Hu, 2017), has progressed in a severe allergic respiratory disease that harms human health and quality of life. Therefore, attention should be paid to the prevention and control of air pollutants in Chongqing and their impact on AR.
The pathogenesis of AR is related to various factors both innate genetic background and acquired environmental effects. It is an inflammatory disease of the nasal mucosa caused by IgE (immunoglobulin) after allergic people come in contact with allergens, and it involves many immune-active cells and cytokines21 (Deng, 2016). Villeneuve demonstrates that air pollutants can directly affect the immune system and cause inflammation or oxidative stress. Active trace gases ozone and nitrogen dioxide can induce post-transcriptional modification and change the immunogenicity of proteins22 (Villeneuve, 2006).
The health effects of air pollutants and AR outpatients in Chongqing were investigated using epidemiological and environmental data in the study. The air pollutant database, meteorological database, and AR data database were all formed on this foundation. The DLNM and the GAM were used to examine the immediate, lag, and cumulative effects of air pollutants on AR outpatients. Compared with previous studies, the O3 level of a single pollutant in this study had an immediate positive effect on health outcome, lag effect within two days. PM2.5 level of a single pollutant had a lag effect within 11–18 days. Moreover, O3, PM2.5, PM10, SO2 and NO2 had effects in two-pollutant model with adjusting the other pollutant. The RR cumulative effect of PM2.5 became more pronounced as the concentration increased. The cumulative impacts of NO2 were smaller than PM2.5.
We found that O3, PM2.5, PM10, NO2 and SO2 were significantly associated with the increase of AR outpatient visits, respectively, which were similar to several previous studies. As shown in Table 5, for example, Teng’s results revealed that PM2.5, PM10, SO2, and NO2 levels were significantly related to prevalence23 (Teng, 2017). PM2.5 was reported to be associated with outpatient care in this study24 (Wang, 2020). According to Chu’s research, PM10 and PM2.5 were significantly associated with increased risk in patients who live in warm climates.6 There was a strong correlation between PM10, SO2, NO2, and AR in Zhang’s study25 (Zhang, 2011). A study in Korea demonstrated that AR and SO2 were associated with high risk, and PM10 was associated with low risk27 (Kim, 2021). There was a study that researched the strong association between PM2.5 and allergic rhinitis28 (Fuerte, 2013). According to one research, the greater the level of exposure to NO2, PM10, the more severe the rhinitis31 (Burte, 2020). According to the results of one study, the time change trend of the number of patients in AR day had a certain time correspondence with the concentration change of PM10, SO2, and NO2 in the air, indicating that in the short term, the increase of the concentration of PM10, SO2, and NO2 in the air directly affected the occurrence and aggravation of AR and led to the increase in the number of patients33 (Zhang, 2011). However, another study showed that there was no correlation between the incidence rate and concentrations of SO2, NO2, and PM10 in the air, and positively correlated with the PM2.5 concentration in the air32 (Chai, 2020). Liu’s study provided the correlation between NO2, SO2, PM10, PM2.5 and AR, the prevalence of AR was related to SO2, CO and NOx levels, but not O3 and PM10 levels30 (Liu, 2020). In addition, our study found that CO was not statistically significant. In fact, several studies observed that the effects of CO were inconsistent with our results. A study discovered a significant correlation between PM10, SO2, NO2, CO, and AR outpatient visits26 (Wang, 2020) Teng’s results revealed that CO was significantly related to prevalence23 (Teng, 2017). Carbon monoxide (CO) and nitrogen oxides (NOx) were significantly correlated with AR. Because of both pollutants being considered traffic emissions, this study concludes that Taiwan should control traffic emissions to reduce the prevalence of AR in children29 (Chuang, 2016). Variations in study design, geographic distribution, study populations, and ethnicity may partially explain the inconsistencies between these results.
 |
Table 5 The Main Findings of Several Previous Studies Reported That the Composition of Air Pollutants Influenced the Occurrence of AR |
This study had four major strengths. First, atmospheric and meteorological research data were obtained via official channels, which was one of the study’s advantages. Second, the data collection on air pollutants was relatively comprehensive, as were all of indicators of the ecological environment bureau at the time. Third, the data of daily outpatient visits for AR in this study were real-world electronic medical record data from six hospitals in Chongqing on the platform of the Medical Data Research Institute of Chongqing Medical University. The research conclusion was representative. Fourth, this study was carried out in Chongqing climate, which was a rare association study of air pollution and AR in Chongqing. Nevertheless, there are some potential limitations as follows. Firstly, the lack of personal exposure data to air pollutants, and overall data on air pollutants were used, which could not accurately reflect each patient’s exposure. Secondly, indoor and outdoor environmental factors, such as outdoor pollen allergy, air conditioning, pet hair, indoor dust mites, would all contribute to AR. Thirdly, the principal diagnosis of AR was only included based on the historical electronic medical record as per the 10th edition of the International Classification of Diseases (ICD-10, J30.401). Due to the retrospective nature of the study, the data source of AR historical electronic medical record obtained from the platform has no record of allergy test. Finally, Chongqing residents appreciate the spicy food culture. Certain AR patients would eat hot pot to detoxify spicy food to dredge the nasal airway. Patients who were aware of their illness would take precautionary measures to prevent and control the disease on their own. Another instance was when certain adults would be ill for a while and then go to the drugstore to get medicine for treatment rather than going to the hospital. Consequently, these patients were excluded from our research.
In summary, our findings emphasized that government departments need to develop more comprehensive air control policies to protect sensitive population, as well as considering industrial emissions and traffic emissions control measures. Continuing to explore the association between air pollution and AR is of great significance for improving its prevention and control level. Additionally, the mixed meteorological factors controlled in this study had a considerable statistical correlation with AR outpatients. Subsequent research will study the specific impact of meteorological factors on AR.
We put forward some generalizable opinions that may be of potential interest internationally. The opinions are as follows: the impact of air pollutants on AR varies in different geography and cities, and the effects of each component are also different. In addition, the economic level of different cities also affects the utility of air pollutants on AR. Therefore, government departments should formulate targeted policies and services to prevent and control air pollutants and reduce the health risk of AR, improve the health quality of residents, and better reduce the burden and financial pressure of the medical and health departments and the environmental bureau. We suggest that relevant departments should pay attention to popularizing the knowledge of air pollutants and AR and their association to enhance public awareness and carry out independent prevention, which is much better than treating health risks after illness.
Conclusions
The impact of atmospheric environmental factors on AR has attracted considerable attention and international interest, but data on the associations in specific regional cities are still limited. The results of this study demonstrated that O3, PM2.5, PM10, SO2 and NO2 had significant effects on the number of outpatients with AR, components of air pollutants were associated with the daily outpatient visits for AR in Chongqing. Consequently, it is necessary to control pollutants in Chongqing, strengthen energy conservation, emission reduction measures, and recommend that relevant departments continue to strengthen air pollution control, formulate health intervention strategies, and reduce the impact of air pollutants on the health of AR patients and improve the quality of life of patients. These results may have significant implications for developing tailored health policies and services to prevent AR in Chongqing and even all over the world, and contributing the knowledge for the field of environmental pollution and AR.
Data Sharing Statement
Data available from authors on request.
Ethics Approval and Written Informed Consent
This study was conducted in accordance with the Declaration of Helsinki, and the Ethics Committee of Chongqing Medical University has reviewed the proposed use of human subjects in the above mentioned projects. It is recognized that the rights and the welfare of the subjects are adequately protected. Due to the retrospective nature of the study, the patient-level data obtained do not require the patient’s informed consent, the Ethics Committee of Chongqing Medical University waived the need for informed consent. We confirmed that the data was anonymized or maintained with confidentiality. The Ethics Committee of Chongqing Medical University has approved papers resulting from the project.
Acknowledgments
Thanks to Chongqing Ecological Environment Bureau, China Meteorological data network and the Data Research Institute of Chongqing Medical University.
Author Contributions
All authors made a significant contribution to the work reported, whether that is in the conception, study design, execution, acquisition of data, analysis and interpretation, or in all these areas; took part in drafting, revising or critically reviewing the article; gave final approval of the version to be published; have agreed on the journal to which the article has been submitted; and agree to be accountable for all aspects of the work.
Funding
This study was supported by grants from Program for Youth Innovation in Future Medicine of Chongqing Medical University (W0081), The Philosophy and Social Sciences Innovation Team of Chongqing Medical University (ZX190101), and The Special research and development plan of smart medicine for Postgraduates of Chongqing Medical University (YJSZHYX202112).
Disclosure
The authors report no conflicts of interest in relation to this work and declare that the research was conducted in the absence of any commercial or financial relationships that could be construed as a potential conflict of interest.
References
1. Ingrid NK, Cecilie S, Iana M, et al. Lifelong exposure to air pollution and greenness in relation to asthma, rhinitis and lung function in adulthood. Environ Int. 2021;146:106219.
2. Bousquet J, Khaltaev N, Cruz A, et al. Allergic Rhinitis and its Impact on Asthma (ARIA) 2008 update (in collaboration with the World Health Organization, GA(2)LEN and AllerGen). Allergy. 2008;63 Suppl 86:8–160. doi:10.1111/j.1398-9995.2007.01620.x
3. Gao J, Lu M, Sun Y, et al. Changes in ambient temperature increase hospital outpatient visits for allergic rhinitis in Xinxiang, China. BMC Public Health. 2021;21(1):600. doi:10.1186/s12889-021-10671-6
4. Marseglia G, Caimmi S, Marseglia A, et al. Rhinosinusitis and asthma. Int J Immunopathol Pharmacol. 2010;23:29–31.
5. D’Amato G, Holgate ST, Pawankar R, et al. Meteorological conditions, climate change, new emerging factors, and asthma and related allergic disorders. A statement of the World Allergy Organization. World Allergy Organ J. 2015;8(1). doi:10.1186/s40413-015-0073-0
6. Chu H, Xin J, Yuan Q, et al. The effects of particulate matters on allergic rhinitis in Nanjing, China. Environ Sci Pollut Res Int. 2019;26(11):11452–11457. doi:10.1007/s11356-019-04593-5
7. To T, Zhu J, Stieb D, et al. Early life exposure to air pollution and incidence of childhood asthma, allergic rhinitis and eczema. Eur Respir J. 2020;55(2):1900913. doi:10.1183/13993003.00913-2019
8. Smit L, Hooiveld M, van der Sman-de Beer F, et al. Air pollution from livestock farms, and asthma, allergic rhinitis and COPD among neighbouring residents. Occup Environ Med. 2014;71(2):134–140. doi:10.1136/oemed-2013-101485
9. Li S, Wu W, Wang G, et al. Association between exposure to air pollution and risk of allergic rhinitis: a systematic review and meta-analysis. Environ Res. 2022;205:112472. doi:10.1016/j.envres.2021.112472
10. Zhao J, Bai J, Shen K, et al. Epidemiological survey of allergic diseases in children aged 0–14 years in Beijing, Chongqing and Guangzhou;
11. Hu S, Yao H, Peng Y, et al. Epidemiological investigation and analysis of allergic rhinitis in children in Chongqing. Chongqing Med J. 2017;46(33):
12. Hastie T, Tibshirani R. Generalized additive models. Stat Sci. 1986;1(3):249–307.
13. Huang JZ. An introduction to statistical learning: with applications in R By Gareth James, Trevor Hastie, Robert Tibshirani, Daniela Witten. J Agric Biol Environ Stat. 2014;19(4):556–557. doi:10.1007/s13253-014-0179-9
14. Gu S, He T, Lu B, et al. Attribution risk assessment method based on distributed lag nonlinear model and its application. China Health Stat. 2016;33(06):959–962.
15. Zhang W, Yu X, Ye Q, et al. Atmospheric PM2.5 in Hangzhou from 2015 to 2017 effect on childhood asthma. Chinese J Prevent Med. 2020;21(01):65–69.
16. Ding L, Zhu D, Peng D, Zhao Y. Air pollution and asthma attacks in children: a case-crossover analysis in the city of Chongqing, China. Environ Pollut. 2017;220:348–353. doi:10.1016/j.envpol.2016.09.070
17. Wang R, Zhou Y, Zeng J, et al. Discussion on the relationship between children’s bronchial asthma attack and atmospheric environmental quality and meteorological factors in Chongqing. J Environ Health. 1993;05:205–207.
18. Wang Z, Shen Z, Wu Y, et al. PM2.5 of air pollutants in the main urban area of Chongqing in 2014–2018 time series study on the impact of respiratory disease death on residents. Chongqing Med. 2020;49(22):3688–3692.
19. Zhang B. Chongqing PM2.5 study on the correlation with the number of emergency patients with cardiovascular and cerebrovascular diseases. Occup Health Injury. 2020;35(03):176–811.
20. Tang C, Chen Y, Song Q, et al. Short-term exposure to air pollution and occurrence of emergency stroke in Chongqing, China. Int Arch Occup Environ Health. 2021;94(1):69–76. doi:10.1007/s00420-020-01557-y
21. Deng Q, Lu C, Yu Y, Li Y, Sundell J, Norbäck D. Early life exposure to traffic-related air pollution and allergic rhinitis in preschool children. Respir Med. 2016;121:67–73. doi:10.1016/j.rmed.2016.10.016
22. Villeneuve P, Doiron M, Stieb D, Dales R, Burnett R, Dugandzic R. Is outdoor air pollution associated with physician visits for allergic rhinitis among the elderly in Toronto, Canada? Allergy. 2006;61(6):750–758. doi:10.1111/j.1398-9995.2006.01070.x
23. Teng B, Zhang X, Yi C, et al. The association between ambient air pollution and allergic rhinitis: further epidemiological evidence from Changchun, Northeastern China. Int J Environ Res Public Health. 2017;14(3):226. doi:10.3390/ijerph14030226
24. Wang M, Wang S, Wang X, et al. The association between PM2.5 exposure and daily outpatient visits for allergic rhinitis: evidence from a seriously air-polluted environment. Int J Biometeorol. 2020;64(1):139–144. doi:10.1007/s00484-019-01804-z
25. Zhang F, Wang W, Lv J, Krafft T, Xu J. Time-series studies on air pollution and daily outpatient visits for allergic rhinitis in Beijing, China. Sci Total Environ. 2011;409(13):2486–2492. doi:10.1016/j.scitotenv.2011.04.007
26. Wang J, Lu M, An Z, et al. Associations between air pollution and outpatient visits for allergic rhinitis in Xinxiang, China. Environ Sci Pollut Res Int. 2020;27(19):23565–23574. doi:10.1007/s11356-020-08709-0
27. Kim S, Lee J, Oh I, et al. Allergic rhinitis is associated with atmospheric SO2: follow-up study of children from elementary schools in Ulsan, Korea. PLoS One. 2021;16(3):e0248624. doi:10.1371/journal.pone.0248624
28. Fuertes E, Brauer M, MacIntyre E, et al. Childhood allergic rhinitis, traffic-related air pollution, and variability in the GSTP1, TNF, TLR2, and TLR4 genes: results from the TAG Study. J Allergy Clin Immunol. 2013;132(2):342–52.e2. doi:10.1016/j.jaci.2013.03.007
29. Chung H, Hsieh C, Tseng C, Yiin L. Association between the first occurrence of allergic rhinitis in preschool children and air pollution in Taiwan. Int J Environ Res Public Health. 2016;13(3):268. doi:10.3390/ijerph13030268
30. Liu J, Wang Y, Liu S, et al. Protocol for a prospective multicenter cross-sectional observational study to investigate the role of air pollution on allergic rhinitis prevalence. Medicine. 2020;99(11):e19497. doi:10.1097/md.0000000000019497
31. Burte E, Leynaert B, Marcon A, et al. Long-term air pollution exposure is associated with increased severity of rhinitis in 2 European cohorts. J Allergy Clin Immunol. 2020;145(3):834–42.e6. doi:10.1016/j.jaci.2019.11.040
32. Chai X, Huang R, Deng M. Clinical study on incidence rate of allergic rhinitis in northern Guangdong and PM2.5 correlation. China Modern Drug Appl. 2020;14(04):19–21.
33. Zhang F, Wang W, Jin X, et al. Study on the effect of air pollutants on allergic rhinitis in Beijing. J Yunnan Agricult Univ. 2011;26(03):364–368.
 © 2022 The Author(s). This work is published and licensed by Dove Medical Press Limited. The
full terms of this license are available at https://www.dovepress.com/terms
and incorporate the Creative Commons Attribution
- Non Commercial (unported, 3.0) License.
By accessing the work you hereby accept the Terms. Non-commercial uses of the work are permitted
without any further permission from Dove Medical Press Limited, provided the work is properly
attributed. For permission for commercial use of this work, please see paragraphs 4.2 and 5 of our Terms.
© 2022 The Author(s). This work is published and licensed by Dove Medical Press Limited. The
full terms of this license are available at https://www.dovepress.com/terms
and incorporate the Creative Commons Attribution
- Non Commercial (unported, 3.0) License.
By accessing the work you hereby accept the Terms. Non-commercial uses of the work are permitted
without any further permission from Dove Medical Press Limited, provided the work is properly
attributed. For permission for commercial use of this work, please see paragraphs 4.2 and 5 of our Terms.
Recommended articles
Association Between Exposure to Ozone (O3) and the Short-Term Effect on Tuberculosis Outpatient Visits: A Time-Series Study in 16 Cities of Anhui Province, China
Chen S, Wang X, Li D, Zhao J, Zhang J, Zhang Y, Zhang X, Kan X
Journal of Multidisciplinary Healthcare 2023, 16:2045-2055
Published Date: 20 July 2023