Back to Journals » Journal of Multidisciplinary Healthcare » Volume 16
Association Between Exposure to Ozone (O3) and the Short-Term Effect on Tuberculosis Outpatient Visits: A Time-Series Study in 16 Cities of Anhui Province, China
Authors Chen S, Wang X, Li D, Zhao J, Zhang J, Zhang Y, Zhang X, Kan X
Received 30 March 2023
Accepted for publication 19 June 2023
Published 20 July 2023 Volume 2023:16 Pages 2045—2055
DOI https://doi.org/10.2147/JMDH.S412394
Checked for plagiarism Yes
Review by Single anonymous peer review
Peer reviewer comments 2
Editor who approved publication: Dr Scott Fraser
Shuangshuang Chen,1– 3,* Xinqiang Wang,4,* Danhui Li,5,* Jiawen Zhao,4 Jingjing Zhang,3 Yongzhong Zhang,6 Xiujun Zhang,4 Xiaohong Kan2– 4
1Department of Tuberculosis Prevent and Control, Center for Disease Control and Prevention of Hefei, Hefei, Anhui, 230051, People’s Republic of China; 2Department of Scientific Research and Education, Anhui Chest Hospital, Hefei, Anhui, 230022, People’s Republic of China; 3Department of Scientific Research and Education, Anhui Provincial Tuberculosis Institute, Hefei, Anhui, 230022, People’s Republic of China; 4Department of Epidemiology and Biostatistics, School of Public Health, Anhui Medical University, Hefei, Anhui, 230032, People’s Republic of China; 5Department of Hospital Infection and Management, Anhui Chest Hospital, Hefei, Anhui, 230022, People’s Republic of China; 6Department of Tuberculosis Prevent and Control, Anhui Provincial Tuberculosis Institute, Hefei, Anhui, 230022, People’s Republic of China
*These authors contributed equally to this work
Correspondence: Xiaohong Kan, Department of Scientific Research and Education, Anhui Chest Hospital (Anhui Provincial Tuberculosis Institute), Hefei, Anhui, 230022, People’s Republic of China, Email [email protected] Xiujun Zhang, Department of Epidemiology and Biostatistics, School of Public Health, Anhui Medical University, Hefei, Anhui, 230032, People’s Republic of China, Email [email protected]
Introduction: Evidence has shown that air pollutant exposure plays a vital role in the progression of tuberculosis (TB). The aim of this research was to assess the short-term effects of ozone (O3) exposure and TB outpatient visits in 16 prefecture-level cities of Anhui, China, 2015– 2020.
Methods: Distributed lag nonlinear model (DLNM), Poisson generalized linear regression model and random effects model were applied in this study. The effects of different age and gender on TB were investigated by stratified analysis, and then we performed sensitivity analyses to verify the stability of the results.
Results: A total of 186,623 active TB cases were registered from January 1, 2015 to December 31,2020 in Anhui. The average concentration of ozone is 92.77 ± 42.95 μg/m3. The maximum lag-specific and cumulative relative risk (RR) of TB outpatient visits was 1.0240 (95% CI: 1.0170– 1.0310, lag 28 days) for each 10 μg/m³ increase in O3 in the single-pollutant model. Estimation for 16 prefecture-level cities indicated that the strong association between O3 and the risk of TB outpatient visits was in tongling (RR = 1.0555, 95% CI: 1.0089– 1.1042), Suzhou (RR = 1.0475, 95% CI: 1.0268– 1.0687), wuhu (RR = 1.0358, 95% CI: 1.0023– 1.0704). Stratified analysis showed that the health effects of ozone exposure remained significant in male and older adults, and there was no significant association between exposure to ozone in children and adolescents and the risk of tuberculosis.
Discussion: We found that ozone exposure increases the risk of TB infection in outpatient patients, with males and the elderly being more susceptible, and it is necessary for government departments to develop targeted publicity and prevention measures in response to the local air quality conditions.
Keywords: air pollution, ozone, tuberculosis, distributed lag nonlinear model, Poisson generalized linear regression model
Introduction
Tuberculosis (TB) is a chronic infectious disease which is mainly caused by Mycobacterium tuberculosis. According to the 2021 Global Tuberculosis Reports, tuberculosis is still one of the most dangerous and the deadliest single infectious disease in the world. In 2020, there were 9.87 million (127/100,000) new TB patients worldwide. The estimated number of new TB cases in China in 2020 was 842,000 (833,000 in 2019). With an estimated TB incidence of 59 per 100,000 (58/100,000 in 2019), China is one of the 30 countries with a high pressure of TB, ranking second in the world, lower than India (2.59 million).1
Domestic and foreign relevant research results show that smoking, malnutrition, diabetes, Acquired Immune Deficiency Syndrome and poor working and living environment are related to the progression and recurrence of tuberculosis.2–7 The effect of these risk factors on the occurrence of TB has been interpreted as either increasing human exposure to microorganisms or decreasing host defenses against tuberculosis. As one of the main causes of the global disease burden, air pollutants have attracted more and more attention.8 Experimental exposure studies and epidemiological researches indicated that exposure to ozone (O3), particulate matter, nitrogen dioxide (NO2) and environmental tobacco smoke can have detrimental effects on the progression of respiratory disease and is significantly associated with the occurrence of cough.9 Chronic cough is also more common among people with higher levels of exposure to indoor, outdoor and occupational air pollution, and countries with more severe TB cases are more likely to have a cough.10 Therefore, exposure to higher concentrations of air pollutants may induce cough exacerbations in patients with active TB, resulting in the release of more M. tuberculosis droplet nuclei into the surrounding air, which may lead to an increased risk of infection in their close contacts.11
Biological evidence shows that air pollutants enter the human body through different ways not only directly stimulate the human eye and respiratory mucosa to cause local edema but also lead to the addition of free radicals, thus causing oxidative stress and inflammation.12 However, in some developing countries with high TB incidence and high rates of air pollution, evidence on association between outdoor air pollution and TB risk is limited. Hwang et al13 finding indicates that exposure to ambient air pollution O3, carbon monoxide (CO), particulate matter aerodynamic diameter less than 2.5μm (PM2.5) and less than 10.0μm (PM10) are related to the increased risk of drug-resistant TB. In a survey conducted in Northern California, exposure to high concentrations of NO2 and CO increased the odds ratio of tuberculosis in humans, but no positive associations between PM2.5 or O3 and TB were observed.14
In recent years, more and more scholars have discovered the influence of air pollution on health outcomes are delayed and cumulative, that is, the occurrence of diseases or outcomes may be associated with the exposure to air pollutants in a previous period of time.15 Antonio Gasparrini16 systematically summarized the distributed lag nonlinear model (DLNM) in 2010 and realized the analysis process by relying on the “dlnm”, “splines” and “mgcv” packages in R. According to the generalized linear model (GLM) or generalized additive model, this method comprehensively expounds the relationship among exposure, hysteresis and outcome by establishing the cross-basis function and Poisson regression model.
In conclusion, although many domestic and foreign researches have explored the association between ozone exposure and TB, these results are inconsistent. This study intends to collect data on hospital admissions from 2015 to 2020 operated by the center for disease control and prevention (CDC) of Anhui, as well as corresponding air pollutants and meteorological data. Random effects models and DLNM were used to analyse the relationship between exposure to ozone and tuberculosis risk, and at the same time, subgroup analysis was used to study the differences of different genders and different age groups. Finally, sensitivity analysis was conducted to test the stability of the model and the robustness of the findings.
Materials and Methods
Study Area
Anhui, referred to as “Wan”, was named after the initials of Anqing and Huizhou. It is a provincial administrative region of China. Located in the Yangtze River Delta of East China, between 114°54′-119°37 east longitude and 29°41′-34°38′ north latitude. By the end of 2021, Anhui has 61.13 million permanent residents and has 16 provincial cities under its jurisdiction, including 9 county-level cities, 50 counties and 45 municipal districts.
Data of Tuberculosis
All newly diagnosed cases are registered in the Infectious Disease Information Network direct reporting system, which is operated by the CDC of China. In our research, we collected the incidence time series of TB from January 2015 to December 2020, which included age, sex, occupation, hospital information, home location, detailed treatment plan, the data of laboratory department, drug susceptibility test information and follow-up information.
Air Pollution and Meteorological Data
The information on ambient air pollutants involved in this study was obtained from environmental monitoring centers in various cities. In this study, we calculated 8-h daily maximum O3, the average concentrations of 24-h PM10 and NO2. We obtained the data network from the China Meteorological Administration for this study, including relative humidity (RH, %), mean temperature (MT, °C) and wind speed (WS, m/s). We examine the data, including removing some extreme data and filling in the missing data. When there are missing values, we fill them with the average of the previous and the next day.
Statistical Analysis
Descriptive Methods
A database of daily air pollution, meteorological data and daily tuberculosis outpatient visits in Anhui Province was constructed using Microsoft Excel software. We input the database into SPSS 22.0 software for descriptive analysis. The distribution of O3, NO2 and PM10 pollutants, tuberculosis data (distribution of 16 provincial cities) and meteorological data, including mean, standard deviation and quartile, were analyzed by traditional simple descriptive statistics methods. Spearman rank correlation coefficient and scatter plot were performed to access the correlation between meteorological factors, air pollutants (O3, NO2, PM10) and the number of tuberculosis outpatients.
Lots of researches have shown that the function of air pollution on health outcomes have a delayed effect and exhibit a nonlinear exposure–response relationship,17–20 so in the first step, DLNM was used to assess the relationship between O3 and outpatient tuberculosis risk. In addition, since daily reported TB hospitalizations are generally considered rare events, which approximately follow the Poisson distribution. Therefore, we applied a GLM based on the quasi-Poisson distribution to fit the dimensions of exposure, response and lag.18,21,22 Firstly, Because the intent of the research was to survey the effect of ozone exposure on outpatient TB risk, we used natural cubic functions (ns) to control for long-term trends, meteorological factors and seasonal variations, 7 degrees of freedom (df) ns function was applied to control the long-term trend and seasonal variations, and we controlled for relative humidity, wind speed, and average temperature through the “ns” function of different dfs. All air pollutant variables in this study were also regulated by the ns function with 3 degrees of freedom.23 We also considered the day of the week (Dow) effect and the holiday effect, classified the virtual variable holidays, assign values to holidays and non-holidays, 0 represents non-holidays and 1 represents holidays. Then, a cross-basis function was established to discuss the two-dimensional association between the three air pollutants and outpatient tuberculosis, the exposure, lag and response of tuberculosis outpatient visits. According to the aim of our research and the length of TB incubation period, we set the initial maximum lag day to 28 days.24 To explain the collinear relationship between air pollutants and meteorological factors, variables with correlation values less than 0.7 were added to the model.25 The basic model is as follows:
First, “time” variables were used to control the long-term trends and seasonal variations with “7* year” degree of freedom (df).26 The ‘ns’ functions were applied to control other meteorological confounding factors for different dfs, including wind speed, average temperature and relative humidity. The basic model was as follows:

Ht indicates the actual number of outpatient visits for TB in t days, ht indicates the expected TB outpatient visits in t days.  indicates a cross- basis function; df1 expresses the degree of freedom of wind speed. df2 expresses the degree of freedom of relative humidity and df3 expresses the degree of freedom of mean temperature. β and γ are the regression coefficients of the Holiday index and the Dow index. Then, random effect model was used to predict the comprehensive result affection of 16 cities in Anhui Province. I2 value was used to quantify the heterogeneity between different areas.27 The final model of the second stage is as follows:

where PEi represents the estimated effect of particulate pollutants and di represents the variance of the estimates effect. The variance of the random-effects summary pollution effect is  .28 On the other hand, we used the class II levels of National Environmental Quality Standard (GB3095-2012) as a reference to estimate the impact of ozone exposure on TB outpatient. Therefore, in this paper, the reference value of O3 is defined as 160μg/m3.29 We performed subgroup analyses in 16 cities to confirm vulnerable people by patient gender (male, female) and age (0–18 years, 19–64 years, ≥65 years) and calculate the estimates and 95% confidence interval (CI) using the following formulas:
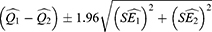
Where  and
and  are the point estimates for the two subgroups, and
  and
and  are the corresponding standard errors. In this research, we tried to use relative risk (RR) estimates and 95% CI to represent the lag-specific and cumulative risk of tuberculosis with each 10-unit increasing in O3 concentration. Finally, we also performed a sensitivity analysis that included both PM10 and NO2 in the lag model to explore the robustness of the results. StataSE 15 (version 64-bit) and R (version 4.0) were used in this research. Some analyses are performed through the “dlnm”, “splines” and “mgcv” packages in R. A P value less than 0.05 indicates a statistically significant difference.
Results
Descriptive Statistics of Data
The distribution of TB cases, meteorological factors, and ambient air pollutant concentrations are shown in Table 1. The daily mean concentration of O3 is 92.77μg/m³ (from 0 to 220μg/m³), 75.91μg/m³ for PM10 (from 4 to 318μg/m³), 32.93μg/m³for NO2 (from 11 to 102 μg/m³). From January 1, 2015 to December 31, 2020, a number of 186,623 TB cases were registered in Anhui. Among the 16 cities in Anhui, the first is Hefei (24,394, 13.1%) and the second is Fuyang (21,591, 11.5%). The lowest is Huangshan (4,140, 2.2%) (Figure 1). The daily mean temperature is 16.59°C (from−6.8°C to 33.3°C), the mean relative humidity is 76.7% (from 40% to 98%), and the average wind speed is 2.16 m/s (from 0.8 to 5.6 m/s). The Spearman rank correlation coefficients and scatter plot between daily air pollutant concentrations and meteorological factors in Anhui are shown in Figure 2. From Figure 2, we can see that there is a positive correlation between ozone and average temperature. As the temperature increases, the ozone concentration increases accordingly. On the contrary, as the temperature increases, the concentration of PM10 and NO2 decreases. O3, PM10, and NO2 are negatively correlated with relative humidity and wind speed. Low temperature and weak wind are beneficial for the formation of these three pollutants in the air. Figure 3 shows the association between the concentration of air pollutants and the distribution of the number of TB clinic visits from 2015 to 2020. We can roughly see the distribution of tuberculosis and these air pollutants. The concentration of ozone is low in spring and winter but high in summer and autumn. PM10 and NO2 are just opposite to ozone, and the distribution of tuberculosis is basically consistent with ozone. The purpose of Figures 2 and 3 is to make a multifactor model and exclude the interference of multicollinearity.
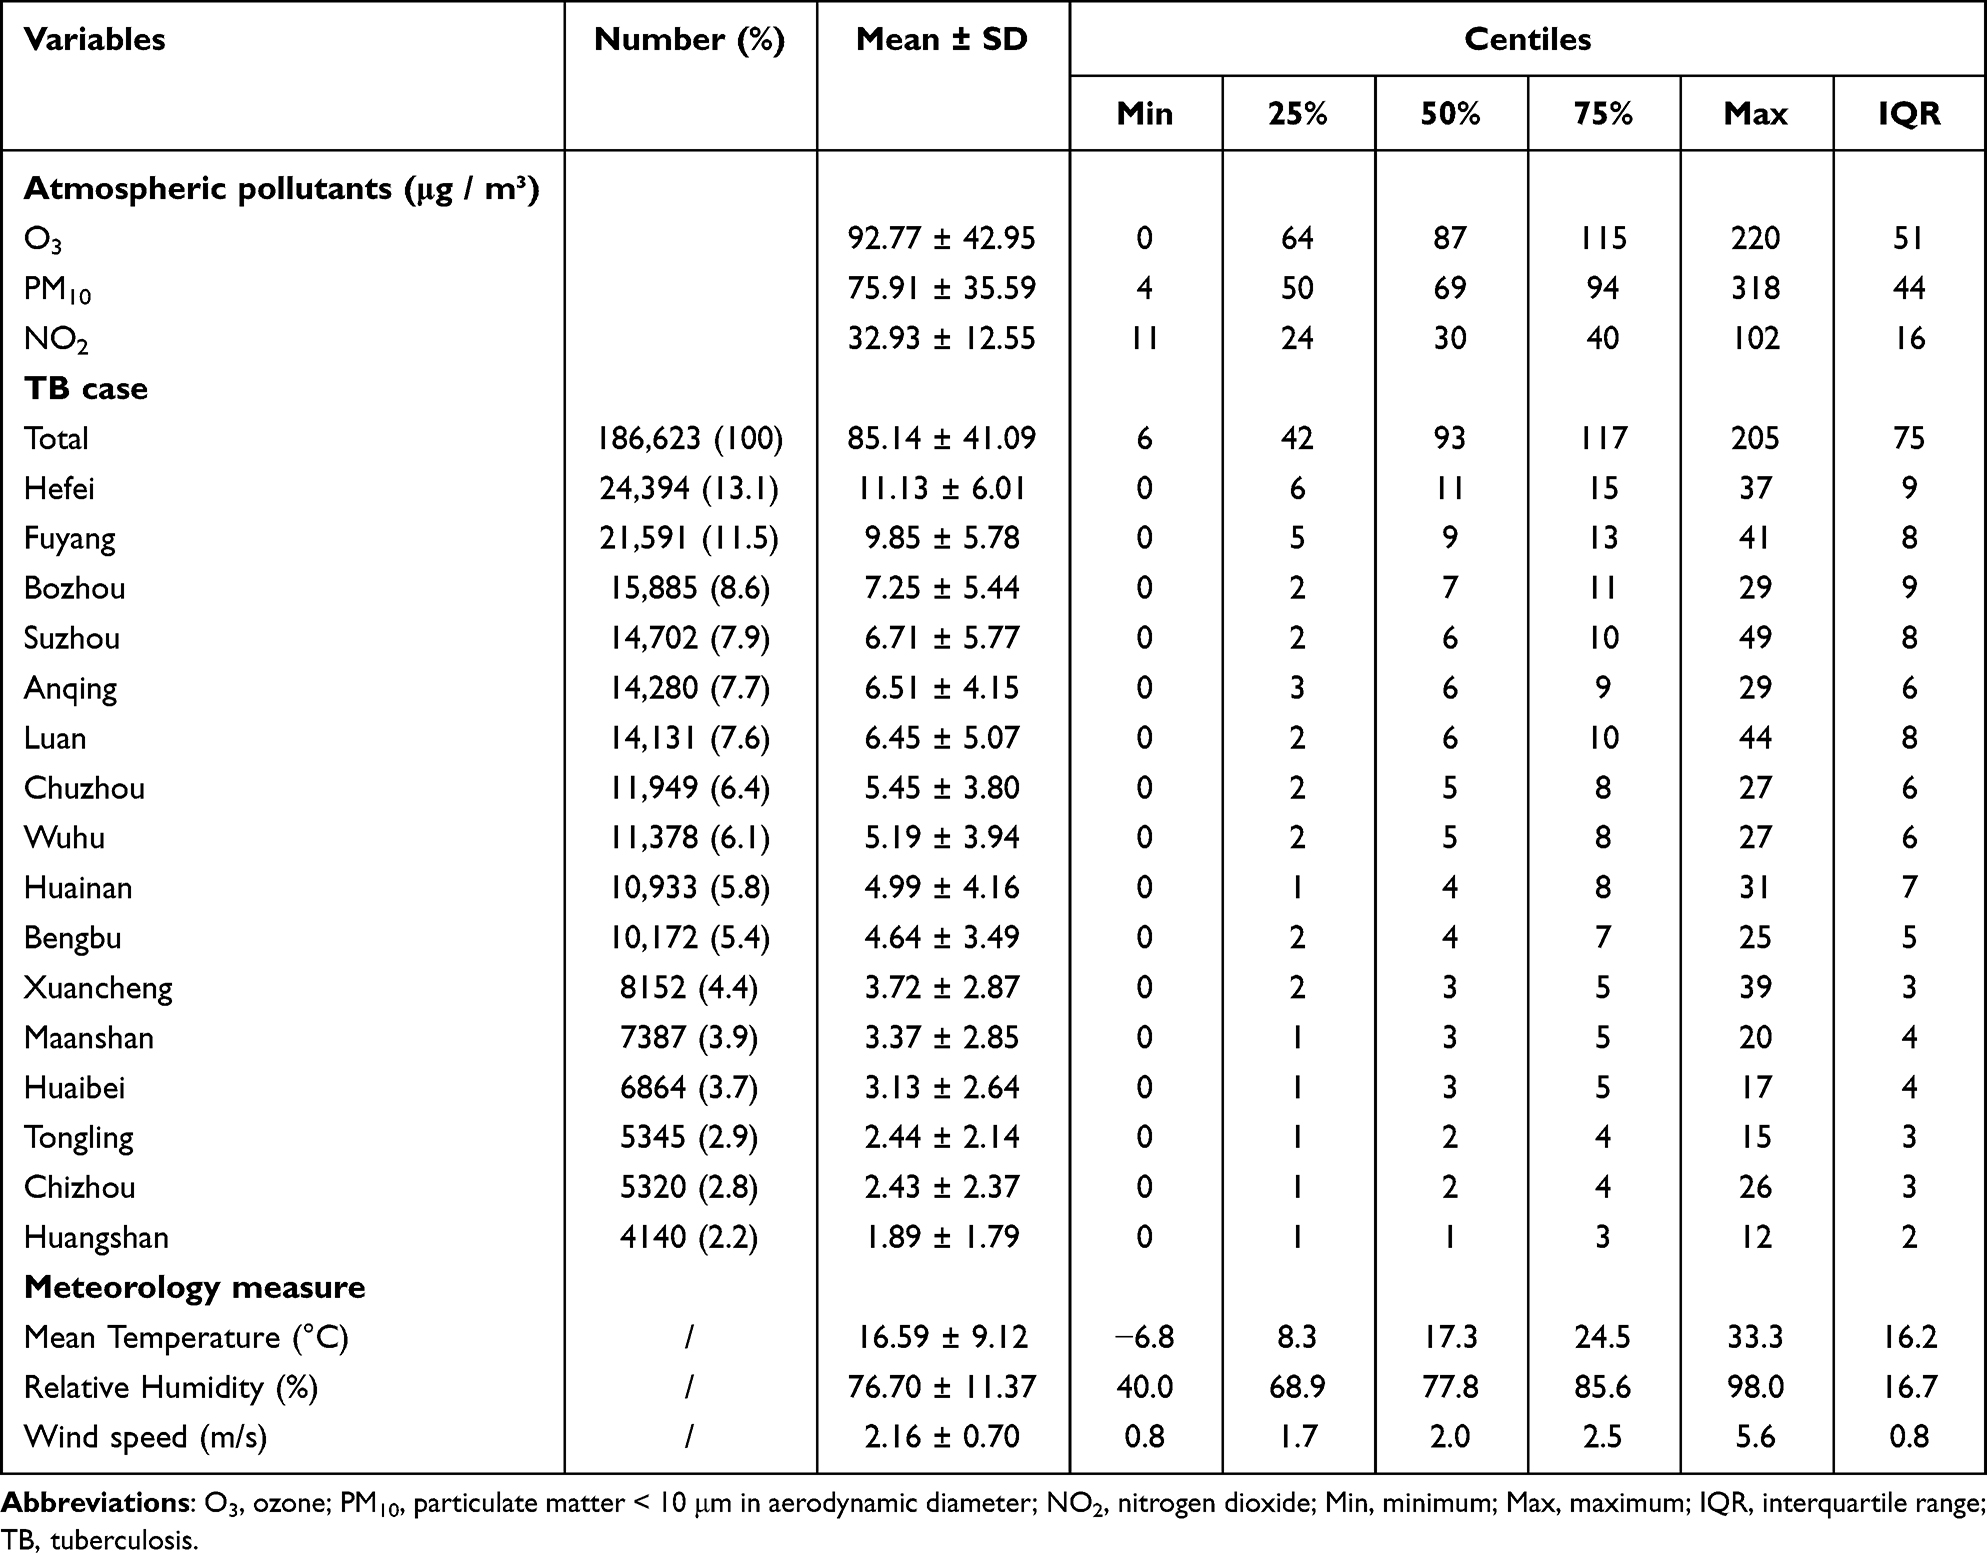 |
Table 1 Summary Statistics of Active TB Case in 16 Cities of Anhui Province and Air Pollutants, Meteorology Factor of Anhui, 2015–2020 |
 |
Figure 1 The geographical location of Anhui Province and 16 cities and tuberculosis outpatient number in cities of Anhui Province from 2015 to 2020. |
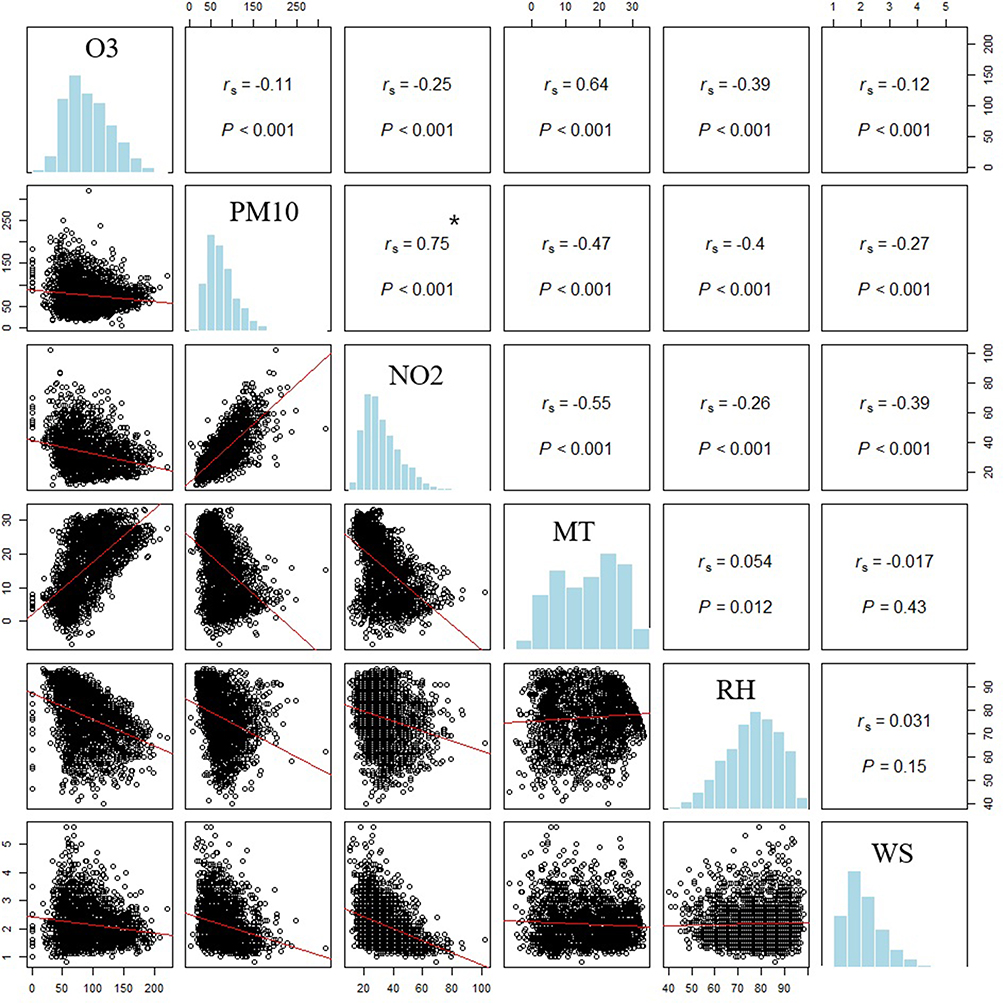 |
Figure 2 Spearman rank correlation coefficients and scatter plot between daily concentration of air pollutants and meteorological factors in Anhui Province. *Represents the correlation coefficient more than 0.7. |
 |
Figure 3 Time series of tuberculosis, O3, NO2 and PM10 in Anhui, 2015−2020. |
Stratified Analysis of Sex and Age
All patients were analyzed by age and sex in subgroups. (1) Divided into male and female groups, and it is shown in Figure 4 that results were statistically significant in ten cities (Anqing, Fuyang, Bozhou, Chizhou, Chuzhou, Huainan, Luan, Maanshan, Tongling, Suzhou) in the male’s group, compared with only six cities (Bozhou, Chuzhou, Huangshan, Luan, Maanshan, Suzhou) in the female’s group; (2) All patients were stratified by age into 3 groups (0-18 years old, 19-64 years old, and >64 years old), as shown in Figure 4, The difference between increased O3 concentration and TB risk within a lag of 28 days in Huainan, Maanshan and Wuhu cities were statistically significant (0-18 years old group). 6 cities (Anqing, Chuzhou, Luan, Maanshan, Tongling, Suzhou) in 19-64 years group, and 7 cities (Hefei, Fuyang, Bozhou, Huainan, Luan, Maanshan, Suzhou) in >64 years old group, The difference between increased O3 concentration and TB risk were also statistically significant.
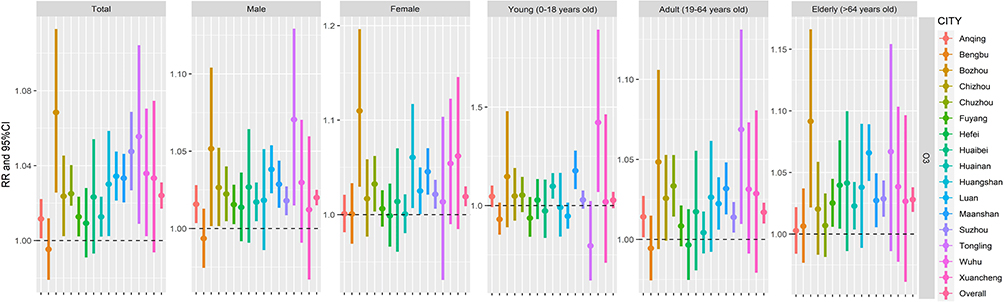 |
Figure 4 Relative risk and 95% confidence interval for cumulative association between each 10-unit increase in daily O3 concentration and TB risk within a lag of 28 days in 16 cities of Anhui Province from 2015 to 2020 stratified by gender and age. |
Association Between Daily TB Outpatient Visits and O3
As represented in Figure 5, the cumulative lag effect of 28 days in 12 of the 16 cities in Anhui is statistically significant when O3 concentration increased by 10μg/m3, and the risk of TB increased. Results from Bengbu (RR = 0.9953, 95% CI: 0.9790–1.0119), Hefei (RR = 1.0093, 95% CI: 0.9910–1.0280), Huaibei (RR = 1.0232, 95% CI: 0.9931–1.0541) and Xuancheng (RR = 1.0333, 95% CI: 0.9937–1.0746) showed no significant difference.
 |
Figure 5 Relative risk and 95% confidence interval for cumulative association between a 10 μg/m3 increase in concentration of O3 and TB risk in Anhui (multi-pollutant model). |
Sensitivity Analysis
We also fitted a multi-pollutant model including other pollutants to assess whether the correlations found in the single-pollutant model were affected by co-existing pollutants. We found that the main results did not change substantially after controlling for other pollutants, as shown in Figure 5. PM10, NO2, PM10+NO2 were added into the single model, and the results represent no significant changes.
Discussion
In this study, we first try to use the DLNM and the random effects model to analyse the impact of ozone exposure on TB risk in 16 cities in Anhui and to study the differences between different genders and different ages in different cities. We discovered that exposure to ozone increased the risk of outpatient TB visits, and subgroup analysis showed that exposure to pollutants had a greater influence on males and people aged 19–64 years and 65 years or older. At last, we use the multi-pollutant model to verify the stability of the results, and the data show that the results do not change much after adding other pollutants.
The previous studies show that O3 exposure is associated with the risk of myocardial infarction, pneumonia, acute respiratory distress syndrome and other special etiological diseases, but no positive association between O3 and tuberculosis has been found at present.30–32 Meanwhile, two studies in Taipei and Seoul only considered the link between individual pollutants and TB, without controlling for other air pollutants. This may obscure the real connection between the two, so no significant statistical association was found between the number of visits for ozone-plus TB.13,33 However, Smith14 discovered an inverse association between O3 and TB among Northern California residents, with exposures above the lowest quintile of O3 leading to a lower risk of TB. A Shanghai study based on monthly level data showed that O3 above 95 μg/m3 was negatively associated with the risk of tuberculosis.34
A time-series study from Hefei, China, shows ozone exposure reduces tuberculosis risk.35 But, A study in Jinan based on monthly level data found that O3 concentration was positively associated with the risk of tuberculosis and smear-negative tuberculosis in women during the 3-month exposure window.36 In a multi-city research in Shandong, China, there is a positive association between O3 exposure and TB visits.37 A study of ambient air pollutants in Fuyang also showed that O3 exposure is associated with the risk of TB outpatient visits (RR = 1.049, 95% CI: 1.0012–1.0086, 0-day lag).38 These findings are consistent with the present study, which confirmed that ozone exposure will increase the risk of TB visit for the following possible reasons: It is thought that this phenomenon may be related to the strong oxidizing properties of ozone. As a strong oxidizing gas, ozone can be oxidized at lower temperatures and can participate in a variety of chemical reactions in the atmospheric environment, and it has a severe irritation of the respiratory tract. These characteristics often result in the body to develop acute respiratory symptoms,39 such as coughing, breathing difficulties and lung function reducing, which can make TB patients worse and increase their risk of being admitted to hospital.40 Related laboratory studies also showed that O3 could worsen lung function, increase airway inflammation and gas exchange.41,42
Age and gender have always been the susceptibility factors in tuberculosis. Teenagers’ (high school students or college students) exposure to Mycobacterium tuberculosis has greatly increased, so the incidence rate of tuberculosis will increase. Elderly people often suffer from basic diseases, and their immunity may decline, and men may have bad habits such as smoking and drinking, which may increase the probability of tuberculosis. The total patients were grouped by age. These findings of this research showed that ozone exposure increased the risk of tuberculosis clinics in all groups except the 0–18yearsold group, and we speculate that ozone sensitivity may be related to physiological differences. The performance of the respiratory system changes with age, resulting in decreased chest wall compliance and lung capacity.43 In addition, the 0–18 age group was more likely to be students, spent most of their time at school or at home, spent less time outdoors and had less exposure to ozone. Compared with the 19–64 age group (1.0170, 95% CI: 1.0100–1.0230), >64 (1.0280, 95% CI: 1.0180–1.0380) age group had a higher risk of tuberculosis infection. This may be due to the reactivation (“rekindling”) of TB infection in elderly decades ago, which may increase their incidence of TB.44 At the same time, increased ozone exposure levels may also aggravate respiratory tract inflammation. In addition, a recent population-based study found that the proportion and phenotype of monocytes in peripheral blood varied with age and with Mycobacterium tuberculosis infection. These suggest a potential association between the systemic low levels of inflammation commonly found in older populations and their specific susceptibility to developing TB.33
When stratified by gender, the positive association between primary outpatient visits and tuberculosis was stronger in males with ozone exposure than in females, and ozone exposure was a risk factor for TB in males in 10 of the 16 cities but only in 6 of the 16 cities in females. Compared to females, greater lung capacity and higher rates of fatigue in men compared to women in jobs requiring labor might have caused a difference in the addition of TB risk between the two subgroups. Besides, males tend to have more negative lifestyle habits, such as smoking, drinking, and drug use, which may make males more susceptible to tuberculosis than females.45
The research has the following advantages: Firstly, this study is the first to explore the relationship between ozone exposure and TB in a large and well-represented provincial area; second, different from previous studies, we applied DLNM to comprehensively explore the relationship between exposure, lag effects and outpatient visits for TB and use sensitivity analysis to test the robustness of the model. Finally, we grouped the collected data by gender and age to study the impact of pollutant exposure on the risk of tuberculosis outpatient visits. However, there were some limitations in our research. First, our study is an ecological research design, which does not reflect inter-individual differences, and may lead to misclassification bias. Second, this study only investigated one kind of air pollutant, and there may be some common relationship between other air pollutants and ozone, so there may be some bias in the results of this study. Third, we did not investigate several covariates that may affect the outcomes, such as smoking history and body mass index (BMI). Additionally, most of the monitoring stations are located in cities and there are fewer in rural areas, resulting in lower accuracy in estimates of exposure to TB cases in rural areas.
Conclusion
This research indicated a positive association between exposure to O3 and the risk of TB outpatient visits. Stratified analyses suggested that middle-aged (19–64 years) and older age (≥65 years) than children and adolescent patients were more likely to be affected by ozone exposure. Therefore, establishing a complete environmental monitoring and early warning system is of great significance for the prevention and treatment of TB, and to control ozone emission and strengthen the protection of the elderly will help decrease the incidence of tuberculosis outpatient visits.
Data Sharing Statement
The data are not publicly available owing to privacy or ethical restrictions, as they contain sensitive information. The data are held by the Anhui Chest Hospital (Anhui Provincial Tuberculosis Institute). Requests to access the data can be sent to Xiaohong Kan ([email protected]), Chief of Scientific Research and Education at the Anhui Chest Hospital (Anhui Provincial Tuberculosis Institute).
Ethics Approval
The study was conducted in accordance with the Declaration of Helsinki and was approved by the Ethics Committee of Anhui Chest Hospital (K2020-011). Personal information of patients did not appear in this study; thus, informed consent was waived by the Ethics Committee of Anhui Chest Hospital.
Informed Consent Statement
Personal information of patients did not appear in this study; thus, informed consent was not needed.
Funding
This study was supported by grants from National Key Project for infectious Disease of China (2018ZX10722301-001-004) and Key medical and health specialty construction project of Anhui Province. The funders had no role in the study design, data collection and analysis, decision to publish, or preparation of the manuscript.
Disclosure
The authors report no competing interests in this work.
References
1. World Health Organization. Global tuberculosis report; 2021. Available from: https://www.who.int/teams/global-tuberculosis-programme/data.
2. Elf J, Eke O, Rakgokong M, et al. Indoor air pollution from secondhand tobacco smoke, solid fuels, and kerosene in homes with active tuberculosis disease in South Africa. BMC Res Notes. 2017;10(1):591. doi:10.1186/s13104-017-2892-23
3. Li Z, Mao X, Liu Q, et al. Long-term effect of exposure to ambient air pollution on the risk of active tuberculosis. Int J Infect Dis. 2019;87:177–184. doi:10.1016/j.ijid.2019.07.027
4. Abel L, Fellay J, Haas D, et al. Genetics of human susceptibility to active and latent tuberculosis: present knowledge and future perspectives. Lancet Infect Dis. 2018;18(3):e64–e75. doi:10.1016/S1473-3099(17)30623-0
5. Silva D, Muñoz-Torrico M, Duarte R, et al. Risk factors for tuberculosis: diabetes, smoking, alcohol use, and the use of other drugs. J Bras Pneumol. 2018;44(2):145–152. doi:10.1590/s1806-37562017000000443
6. Kim J. Is ambient air pollution another risk factor of tuberculosis? Korean J Intern Med. 2014;29(2):170–172. doi:10.3904/kjim.2014.29.2.170
7. Li Q, Liu M, Zhang Y, et al. The spatio-temporal analysis of the incidence of tuberculosis and the associated factors in mainland China, 2009–2015. Infect Genet Evol. 2019;75:103949. doi:10.1016/j.meegid.2019.103949
8. Cohen A, Brauer M, Burnett R, et al. Estimates and 25-year trends of the global burden of disease attributable to ambient air pollution: an analysis of data from the global burden of diseases study 2015. Lancet. 2017;389(10082):1907–1918. doi:10.1016/s0140-6736(17)30505-6
9. Fann N, Nolte C, Sarofim M, et al. Associations between simulated future changes in climate, air quality, and human health. JAMA Netw Open. 2021;4(1):e2032064. doi:10.1001/jamanetworkopen.2020.32064
10. Pope C, Dockery D. Health effects of fine particulate air pollution: lines that connect. J Air Waste Manag Assoc. 2006;56(6):709–742. doi:10.1080/10473289.2006.10464485
11. Yaohua T, Hui L, Zuolin Z, et al. Association between ambient air pollution and daily hospital admissions for ischemic stroke: a nationwide time-series analysis. PLoS Med. 2018;15(10):e1002668. doi:10.1371/journal.pmed.1002668
12. Bai L, Su X, Zhao D, et al. Exposure to traffic-related air pollution and acute bronchitis in children: season and age as modifiers. J Epidemiol Community Health. 2018;72(5):426–433. doi:10.1136/jech-2017-209948
13. Hwang S, Kang S, Lee J, et al. Impact of outdoor air pollution on the incidence of tuberculosis in the Seoul metropolitan area. South Korea. Korean J Intern Med. 2014;29(2):183–190. doi:10.3904/kjim.2014.29.2.183
14. Smith G, Eeden S, Garcia C, et al. Air pollution and pulmonary tuberculosis: a nested case-control study among members of a Northern California health plan. Environ Health Perspect. 2016;124(6):761–768. doi:10.1289/ehp.1408166
15. Thun MJ, Apicella LF, Henley SJ, et al. Smoking vs other risk factors as the cause of smoking-attributable deaths: confounding in the courtroom. JAMA. 2000;284(6):706–712. doi:10.1001/jama.284.6.706
16. Gasparrini A, Armstrong B, Kenward M. Distributed lag non-linear models. Stat Med. 2010;29(21):2224–2234. doi:10.1002/sim.3940
17. Xu M, Liao J, Yin P, et al. Association of air pollution with the risk of initial outpatient visits for tuberculosis in Wuhan, China. Occup Environ Med. 2019;76(8):560–566. doi:10.1136/oemed-2018-10532
18. Gao J, Yu F, Xu Z, et al. The association between cold spells and admissions of ischemic stroke in Hefei, China: modified by gender and age. Sci Total Environ. 2019;669:140–147. doi:10.1016/j.scitotenv.2019.02.452
19. Guo Y, Ma Y, Zhang Y, et al. Time series analysis of ambient air pollution effects on daily mortality. Environ Sci Pollut Res Int. 2017;24(25):20261–20272. doi:10.1007/s11356-017-9502-7
20. Lin H, Zhang Y, Xu Y, et al. Temperature changes between neighboring days and mortality in summer: a distributed lag non-linear time series analysis. PLoS One. 2013;8(6):e66403. doi:10.1371/journal.pone.0066403
21. Gasparrini A. Modeling exposure-lag-response associations with distributed lag non-linear models. Stat Med. 2014;33(5):881–899. doi:10.1002/sim.5963
22. Kan H, Wong C, Vichit-Vadakan N, et al. Short-term association between sulfur dioxide and daily mortality: the public health and air pollution in Asia (PAPA) study. Environ Res. 2010;110(3):258–264. doi:10.1016/j.envres.2010.01.006
23. Chen F, Deng Z, Deng Y, et al. Attributable risk of ambient PM10 on daily mortality and years of life lost in Chengdu, China. Sci Total Environ. 2017;581–582:426–433. doi:10.1016/j.scitotenv.2016.12.151
24. Chen R, Chu C, Tan J, et al. Ambient air pollution and hospital admission in Shanghai. China. J Hazard Mater. 2010;181(1–3):234–240. doi:10.1016/j.jhazmat.2010.05.002
25. Liu H, Tian Y, Xu Y, et al. Association between ambient air pollution and hospitalization for ischemic and hemorrhagic stroke in China: a multicity case-crossover study. Environ Pollut. 2017;230:234–241. doi:10.1016/j.envpol.2017.06.057
26. Zhu S, Xia L, Wu J, et al. Ambient air pollutants are associated with newly diagnosed tuberculosis: a time-series study in Chengdu, China. Sci Total Environ. 2018;631:47–55. doi:10.1016/j.scitotenv.2018.03.017
27. Dominici F, Peng R, Bell M, et al. Fine particulate air pollution and hospital admission for cardiovascular and respiratory diseases. JAMA. 2006;295(10):1127–1134. doi:10.1001/jama.295.10.1127
28. Wang X, Zhao J, Zhang K, et al. Short-term effect of sulfur dioxide (SO2) change on the risk of tuberculosis outpatient visits in 16 cities of Anhui Province, China: the first multi-city study to explore differences in occupational patients. Environ Sci Pollut Res Int. 2022;29(33):50304–50316. doi:10.1007/s11356-022-19438-x
29. Ministry of Ecology and Environment of People´s Republic of China. Ambient air quality standards (GB 3095—2012); 2012. Available from: https://www.mee.gov.cn/ywgz/fgbz/bz/bzwb/dqhjbh/dqhjzlbz/201203/t20120302_224165.shtml.
30. Chiu H, Weng Y, Chiu Y, et al. Short-term effects of ozone air pollution on hospital admissions for myocardial infarction: a time-stratified case-crossover study in Taipei. J Toxicol Environ Health A. 2017;80(5):251–257. doi:10.1080/15287394.2017.1321092
31. Tian Y, Wu Y, Liu H, et al. The impact of ambient ozone pollution on pneumonia: a nationwide time-series analysis. Environ Int. 2020;136:105498. doi:10.1016/j.envint.2020.105498
32. Rhee J, Dominici F, Zanobetti A, et al. Impact of long-term exposures to ambient PM2.5 and Ozone on Acute Respiratory Distress Syndrome (ARDS) risk for older adults in the United States. Chest. 2019;156(1):71–79. doi:10.1016/j.chest.2019.03.017
33. Chen K, Chuang K, Liu H, et al. Particulate matter is associated with sputum culture conversion in patients with culture-positive tuberculosis. Ther Clin Risk Manag. 2016;12:41–46. doi:10.2147/TCRM.S92927
34. Wang H, Tian C, Wang W, et al. Temporal cross-correlations between ambient air pollutants and seasonality of tuberculosis: a time-series analysis. Int J Environ Res Public Health. 2019;16(9):1585. doi:10.3390/ijerph16091585
35. Huang K, Ding K, Yang X, et al. Association between short-term exposure to ambient air pollutants and the risk of tuberculosis outpatient visits: a time-series study in Hefei. Environ Res. 2020;184:109343. doi:10.1016/j.envres.2020.109343
36. Liu Y, Cui L, Hou L, et al. Ambient air pollution exposures and newly diagnosed pulmonary tuberculosis in Jinan, China: a Time Series Study. Sci Rep. 2018;8(1):17411. doi:10.1038/s41598-018-35411-6
37. Liu Y, Zhao S, Li Y, et al. Effect of ambient air pollution on tuberculosis risks and mortality in Shandong, China: a multi-city modeling study of the short- and long-term effects of pollutants. Environ Sci Pollut Res Int. 2021;28(22):27757–277 68. doi:10.1007/s11356-021-12621-6
38. Wang X, Li Y, Hu C, et al. Short-term effect of ambient air pollutant change on the risk of tuberculosis outpatient visits: a time-series study in Fuyang, China. Environ Sci Pollut Res Int. 2022;29(20):30656–30672. doi:10.1007/s11356-021-17323-7
39. Afsah-Hejri L, Hajeb P, Ehsani RJ. Application of ozone for degradation of mycotoxins in food: a review. Compr Rev Food Sci Food Saf. 2020;19(4):1777–1808. doi:10.1111/1541-4337.12594
40. Yamazaki S, Shima M, Ando M, et al. Modifying effect of age on the association between ambient ozone and nighttime primary care visits due to asthma attack. J Epidemiol. 2009;19(3):143–151. doi:10.2188/jea.je20081025
41. Brown J, Bateson T, McDonnell W. Effects of exposure to 0.06 ppm ozone on FEV1 in humans: a secondary analysis of existing data. Environ Health Perspect. 2008;116(8):1023–1026. doi:10.1289/ehp.11396
42. Mudway I, Kelly F. An investigation of inhaled ozone dose and the magnitude of airway inflammation in healthy adults. Am J Respir Crit Care Med. 2004;169(10):1089–1095. doi:10.1164/rccm.200309-1325PP
43. Janssens J. Aging of the respiratory system: impact on pulmonary function tests and adaptation to exertion. Clin Chest Med. 2005;26(3):469–84, vi–vii. doi:10.1016/j.ccm.2005.05.004
44. Jassal M, Bakman I, Jones B. Correlation of ambient pollution levels and heavily-trafficked roadway proximity on the prevalence of smear-positive tuberculosis. Public Health. 2013;127(3):268–274. doi:10.1016/j.puhe.2012.12.030
45. Neyrolles O, Quintana-Murci L. Sexual inequality in tuberculosis. PLOS Med. 2009;6(12):e1000199. doi:10.1371/journal.pmed.1000199
 © 2023 The Author(s). This work is published and licensed by Dove Medical Press Limited. The
full terms of this license are available at https://www.dovepress.com/terms
and incorporate the Creative Commons Attribution
- Non Commercial (unported, 3.0) License.
By accessing the work you hereby accept the Terms. Non-commercial uses of the work are permitted
without any further permission from Dove Medical Press Limited, provided the work is properly
attributed. For permission for commercial use of this work, please see paragraphs 4.2 and 5 of our Terms.
© 2023 The Author(s). This work is published and licensed by Dove Medical Press Limited. The
full terms of this license are available at https://www.dovepress.com/terms
and incorporate the Creative Commons Attribution
- Non Commercial (unported, 3.0) License.
By accessing the work you hereby accept the Terms. Non-commercial uses of the work are permitted
without any further permission from Dove Medical Press Limited, provided the work is properly
attributed. For permission for commercial use of this work, please see paragraphs 4.2 and 5 of our Terms.
Recommended articles
The Association Between Air Pollutants and Daily Outpatient Visits for Allergic Rhinitis: A Time-Series Analysis Based on Distribution Lag Nonlinear Model in Chongqing, China
Yang D, Yan Y, Pu K
Risk Management and Healthcare Policy 2022, 15:1501-1515
Published Date: 8 August 2022
COPD in People with HIV: Epidemiology, Pathogenesis, Management, and Prevention Strategies
Byanova KL, Abelman R, North CM, Christenson SA, Huang L
International Journal of Chronic Obstructive Pulmonary Disease 2023, 18:2795-2817
Published Date: 29 November 2023