Back to Journals » OncoTargets and Therapy » Volume 13
The Acetone Indigo Red Dehydrating Agent IF203 Induces HepG2 Cell Death Through Cell Cycle Arrest, Autophagy and Apoptosis
Authors Shang Y, Wang Q, Li J, Zhao Q, Huang X, Dong H ![]() , Liu H, Zhang Y, Zhang J, Gui R, Nie X
, Liu H, Zhang Y, Zhang J, Gui R, Nie X
Received 26 September 2019
Accepted for publication 17 December 2019
Published 15 January 2020 Volume 2020:13 Pages 473—486
DOI https://doi.org/10.2147/OTT.S232594
Checked for plagiarism Yes
Review by Single anonymous peer review
Peer reviewer comments 4
Editor who approved publication: Dr Yao Dai
This paper has been retracted.
Yinghui Shang, 1 Qinghai Wang, 2 Jian Li, 1 Qiangqiang Zhao, 1 Xueyuan Huang, 1 Hang Dong, 1 Haiting Liu, 1 Ye Zhang, 3 Junhua Zhang, 1 Rong Gui, 1 Xinmin Nie 4
1Department of Blood Transfusion, The Third Xiangya Hospital, Central South University, Changsha, People’s Republic of China; 2Department of Cardiology, The Second Hospital of Shandong University, Jinan, People’s Republic of China; 3Department of Cell Biology, School of Basic Medicine, Peking University, Beijing, People’s Republic of China; 4Clinical Laboratory of the Third Xiangya Hospital, Central South University, Changsha, People’s Republic of China
Correspondence: Rong Gui
Department of Blood Transfusion, The Third Xiangya Hospital, Central South University, No. 138 TongziPo Street, Changsha, Hunan 410013, People’s Republic of China
Tel/Fax +86-731-8861 8513
Email [email protected]
Xinmin Nie
Clinical Laboratory of the Third Xiangya Hospital, Central South University, Changsha, No. 138 TongziPo Street, Changsha, Hunan 410013, People’s Republic of China
Tel/Fax +86-731-8861 8577
Email [email protected]
Background: Isatin derivatives have extensive biological activities, such as antitumor. IF203, a novel isatin derivative, has not previously been reported to have antitumor activity.
Methods: Acid phosphatase assays (APAs) and Ki-67 immunohistochemistry were used to detect the proliferation of HepG2 cells. Transmission electron microscope (TEM) was applied to detect ultrastructural changes. Flow cytometry (FCM) was used to detect cell cycle, apoptosis, reactive oxygen species (ROS) and mitochondrial membrane potential (MMP) of HepG2 cells in vitro. TUNEL, MMP and ROS immunofluorescence assays were applied to assess apoptosis, MMP, and ROS of HepG2 cells in vivo. Western Blotting was applied to assess the levels of apoptosis- and autophagy-related proteins.
Results: In this study, in vivo and in vitro experiments showed that IF203 possesses antitumor activity. The results of APAs and Ki-67 immunohistochemistry demonstrated that IF203 could inhibit the proliferation of HepG2 cells. Cell cycle assays, downregulation of Cyclin B1 and Cdc2, and upregulation of P53 suggested that IF203 could lead to G2/M cell cycle arrest. In addition, ultrastructural changes, apoptosis assays, TUNEL immunofluorescence results, upregulated expression of Bax, and downregulated expression of Bcl-2 suggest that IF203 can induce apoptosis in HepG2 cells. After IF203 treatment, intracellular ROS levels increased, MMP decreased, JC-1 green fluorescence was enhanced, and the levels of Caspase-9, Caspase-3 and Cytochrome C expression were upregulated, suggesting that IF203 could induce apoptosis of HepG2 cells through the mitochondrial apoptosis pathway. Moreover, characteristic apoptotic ultrastructural changes were accompanied by the appearance of many autophagy bubbles and upregulation of Atg5, Atg12, ULK1, Beclin-1 and LC3-II proteins, suggesting that IF203 could induce autophagy in HepG2 cells.
Conclusion: This study showed that IF203 leads to the death of HepG2 cells through cell cycle arrest, apoptotic induction, and autophagy promotion.
Keywords: acetone indigo red dehydrating agent, IF203, cell cycle arrest, autophagy, apoptosis
Introduction
Due to improvements in surgery, radiotherapy and chemotherapy, the prognosis of liver cancer patients has gradually improved, though the median survival period of liver cancer patients is currently approximately 12 months, and the 5-year survival rate remains less than 15%.1 Therefore, new anti-hepatocellular carcinoma drugs are urgently needed to improve the prognosis of patients with liver cancer.
Isatin (1H-indole-2, 3-dione), a precursor for many pharmacologically active compounds,2–4 is an important medicinal chemistry.5 Isatin derivatives have extensive biological activities, such as antitumor, anti-HIV, anti-inflammatory, anti-convulsion, antidepressant, and antifungal effects,5 attracting much attention. For example, studies have shown that certain isatin derivatives can significantly inhibit endothelial growth factor receptor (EGFR) activity,6 migration and angiogenesis,7 as well as vascular endothelial growth factor receptor (VEGFR), platelet-derived growth factor receptor (PDGFR) and Kit receptor families.8 Additionally, some of these derivatives, such as sunitinib, have been developed as antitumor drugs. Furthermore, synthetic indolediones suppress the activity of protein tyrosine kinases (PTKs) related to growth factor receptors and cell proliferation.9 Natural and synthetic indole derivatives can also inhibit the activity of cyclin-dependent kinases (CDKs) 10−13 and the proliferation of various cells.14–17 Recently, a 5-carboxyethenyl isatin derivative was shown to significantly induce cell cycle arrest and mitochondrial mediated apoptosis.18 Acetone indigo red dehydrating agent (IF203) (Figure 1A) is a derivative of indigo red and a novel indoledione compound, prepared and provided by Professor Zhang Ye in the laboratory of the Department of Cell Biology, Peking University. In this study, acid phosphatase assays (APAs), transmission electron microscopy (TEM), flow cytometry, immunohistochemistry, immunofluorescence and Western blotting were used to investigate the in vivo and in vitro antitumor effects of IF203 and its antitumor mechanism.
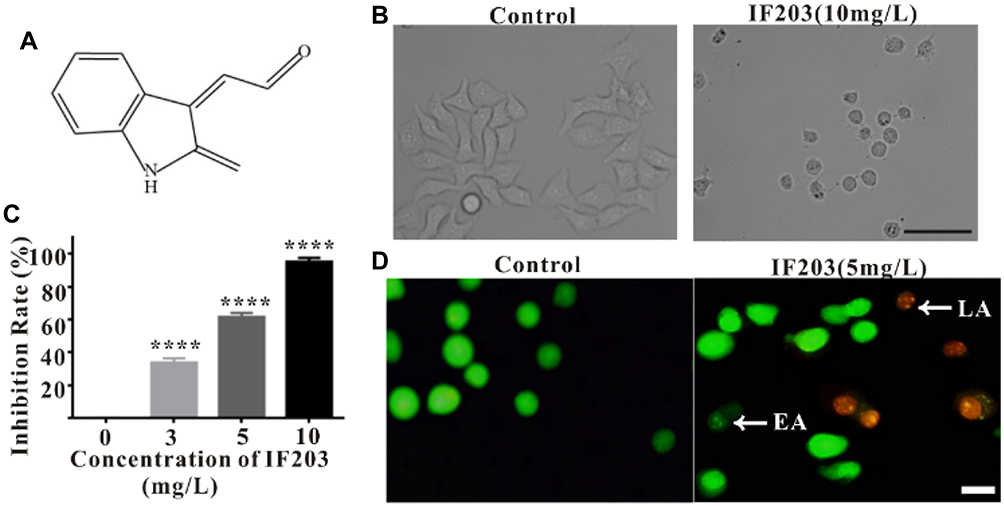 |
Figure 1 (A) Chemical structure of IF203. (B) The effect of IF203 on HepG2 cell morphology observed under an inverted phase contrast microscope. Scale bar: 100 μm. (C) Inhibitory effect of IF203 on the proliferation of HepG2 cells by APAs. Compared with the control group, * p < 0.05, ** p < 0.01, *** p < 0.001, and **** p < 0.0001. (D) Apoptosis of HepG2 cells induced by IF203 after AO/EB double staining observed under an inverted fluorescence microscope. White arrows indicate early apoptotic (EA) or late apoptotic (LA) cells. Scale bar: 10 μm. |
Materials and Methods
Materials
Rhodamine 123 (Rh123) was purchased from Yeasen Biotechnology (Shanghai, China). Cell Cycle Detection Kit, Annexin V-FITC/PI Apoptosis Detection Kit, MMP Detection Kit (JC-1), and ROS Assay Kit were purchased from KeyGEN BioTECH (Jiangsu, China). BCA Protein Assay Kit was purchased from Solarbio Science and Technology Co., Ltd. (Beijing, China). DMEM (high glucose), fetal bovine serum (FBS), trypsin EDTA, and a penicillin and streptomycin cocktail were purchased from Life Technologies (California, USA). One Step TUNEL Apoptosis Assay Kit, Ki-67 cell proliferation detection kit (IHC), and hematoxylin and eosin (H&E) were purchased from Wuhan Servicebio Technology Co., Ltd. (China). Anti-Bax (cat. no. 50599-2-Ig), anti-Bcl-2 (cat. no. 26593-1-AP), anti-Caspase-3 (cat. no. 19677-1-AP), anti-Caspase-9 (cat. no. 10380-1-AP), anti-Cytochrome C (cat. no. 10993-1-AP), anti-Beclin-1 (cat. no. 11306-1-AP), anti-LC3 (cat. no. 14600-1-AP), anti-ULK1 (cat. no. 20986-1-AP), anti-Atg5 (cat. no. 10181-2-AP), anti-Atg12 (cat. no. 11122-1-AP), anti-P53 (cat. no. 10442-1-AP), anti-CyclinB1 (cat. no. 55004-1-AP), anti-Cdc2 (cat. no. 19532-1-AP), and anti-β-actin (cat. no. 20536-1-AP) antibodies and horseradish peroxidase (HRP) goat anti-rabbit (cat. no. sa00001-1) and goat anti-mouse (cat. no. sa00001-2) IgG secondary antibodies were manufactured by Proteintech (Chicago, USA); DAPI, acridine orange (AO), ethidium bromide (EB) were obtained from Servicebio Technology Co., Ltd. (Wuhan, China).
Cell Culture and Subculture
The human liver cancer HepG2 cell line was purchased from American Type Culture Collection (Manassas, VA, USA) and cultured with DMEM medium (high glucose) containing 10% fetal bovine serum, 105 IU/L penicillin, and 105 IU/L streptomycin at 37 °C with a volume fraction of 0.01 CO2 saturated humidity. The cells were routinely digested and passaged with 0.25% trypsin.
Inverted Phase-Contrast Microscopy Morphological Observations
HepG2 cells in log phase were collected at a density of 6 × 10⁴/mL, and 500 μL of the cell suspension was inoculated into a 24-well plate and cultured at 37 °C for 24 h. Fresh medium containing 500 μL IF203 (10 mg/L) was added, and the cells were cultured for another 24 h. Morphological changes were observed under an inverted phase contrast microscope (TS100-F, Nikon, Japan).
Cell Proliferation Inhibition Detected by APA
HepG2 cells in log phase were collected and inoculated into 96-well plates (1 × 10⁵/well). The cells were completely adhered to the plate after 24 h and were divided into a blank control group, a negative control group and an IF203 (3 mg/L, 5 mg/L, 10 mg/L) group. The medium in the 96-well plate was removed after 24 h, the plate was washed twice with phosphate buffer solution (100 μL/well) 2 times, and 100 μL nitrobenzene phosphate solution (0.1 M acetic acid liquid cushion system, including 1 g/L Triton X-100) was added. After incubation at 37 °C for 2 h, 1 M sodium bicarbonate (10 μL/well) was added. Enzyme-linked immunoassays (M680, Bio-Rad, USA) were used to detect absorbance (A) at 405 nm. The inhibition rate (%) = (1 - average A value of IF203 group/average A value of negative control group) × 100%. The experiment was repeated 3 times.
AO/EB Double Staining to Detect HepG2 Cell Apoptosis
HepG2 cells were inoculated into culture bottles, and the residual liquid was removed when the cells grew to 60% confluence, after which IF203 solution (5 mg/L) or fresh medium was added. After 24 h, all the cells were collected and mixed with AO/EB double dye solution (final concentration of AO: 40 mg/L, EB: 100 mg/L). A 25 µL cell suspension was dropped onto a slide, and the slide was covered. The cells were immediately observed under an inverted fluorescence microscope (ECLIPSE TE2000-U, Nikon, Japan), and pictures were taken.
Preparation of Samples for Transmission Electron Microscopy
After treatment with IF203 (10 mg/L) for 24 h, HepG2 cells were collected by trypsin digestion, washed with PBS, and centrifuged at 1000 rpm for 5 min; the process was repeated 3 times. The cell clumps (approximately 1–2 mm^3) were fixed in 3% glutaraldehyde at 4 °C for 2 h, washed with PBS, and fixed with 1% osmic acid for 2 h. After dehydration with ethanol and acetone, embedding with Epon821, and polymerization, the clumps were sliced using an ultrathin slicing machine, counterstained with oil and citric lead acetate, and observed and photographed under TEM (GEM-100-CX II, JEO, Japan).
Cell Cycle Phases Distribution Detection by Flow Cytometry (FCM)
HepG2 cells were inoculated into culture bottles, and the cells were cultured at 37 °C for 24 h, after which IF203 solution (3 mg/L, 5 mg/L, 10 mg/L) or fresh medium without IF203 (as control) was added. The cells were cultured at 37 °C for 24 h, collected and treated according to the instructions of the Cell Cycle Detection Kit. DNA content was detected by FCM (Becton Dickinson-LSR, USA), and the distribution of cell cycle phase was analyzed by Modfit software. The experiment was repeated three times.
Apoptosis Assay by Annexin V-FITC/PI Double Staining
HepG2 cells were inoculated into culture bottles, treated with fresh medium, IF203 (3 mg/L), IF203 (5 mg/L), or IF203 (10 mg/L). After 24 h, the cells were collected, and staining was performed according to the method provided by the Annexin V-FITC/PI apoptosis detection kit; apoptosis was detected by FCM (Becton Dickinson-LSR, USA). The experiment was repeated three times.
Reactive Oxygen Species (ROS) Detection
HepG2 cells were inoculated into culture bottles and treated with fresh medium, IF203 (3 mg/L), IF203 (5 mg/L), or IF203 (10 mg/L). The cells were collected after 24 h and washed with PBS. Staining was carried out according to the method provided by the ROS detection kit and FCM (Becton Dickinson-LSR, USA). The experiment was repeated three times.
MMP Assay
HepG2 cells were inoculated into culture bottles, treated with fresh medium, IF203 (3 mg/L), IF203 (5 mg/L), or IF203 (10 mg/L). After 24 h, the cells were collected, washed, and suspended in 500 μL PBS, and 500 μL Rh123 (10 mg/L) was added to each cell suspension. After incubation at 37 °C for 30 min, the cells were washed 3 times with PBS and suspended in PBS. FCM (Becton Dickinson - LSR, USA) was used to detect MMP at an excitation wavelength of 488 nm and an emission wavelength of 525 nm. The experiment was repeated three times.
Establishment of a Xenograft Model
Male BALB/c nude mice aged 6 weeks (approximately 20 g) were purchased from Hunan Slake Jingda Laboratory Animal Co., Ltd (China). Xenograft tumors were established by subcutaneous inoculation of 1 × 10⁷/100 μL HepG2 cells.
Anticancer Effect of IF203 on Nude Mice with Xenograft Tumors
The tumor volume was calculated using the formula V = (W (2) × L)/2 for caliper measurements, where V is the volume of tumor, W is the width of tumor, L is the length of tumor. The time when the volume of tumor tissues exceeded 100 mm^3 was defined as day 1. The mice were randomly divided into 4 groups (5 each). PBS, IF203 (30 mg/kg/d), IF203 (50 mg/kg/d), or IF203 (100 mg/kg/d) at 100 μL was injected via the tail vein, once a day for four consecutive days. The tumor volume and body weight were measured every 4 days. On the 20th day, the mice were anesthetized and killed. Whole blood, tumors and target tissues (heart, liver, spleen, lung, kidney, brain and skeletal muscle) were collected. Whole blood samples with EDTA anticoagulant were assessed using the five-classification blood count instrument (BC-5390, Mindray, China). Whole blood samples were centrifuged at 3000 rpm for 10 min, and the serum enzymatic indexes were evaluated using an automatic biochemical analyzer (7100, HITACHI, Japan) and immune analyzer (Cobas 6000 e601, ROCHE, USA). All organs and tumor tissues were fixed with 4% paraformaldehyde or stored at −80 °C. Frozen tissue sections were prepared for immunofluorescence staining and Western blotting. The tissues fixed with paraformaldehyde were embedded in paraffin, and tissue sections were generated for H&E staining, immunofluorescence and immunohistochemical staining.
Ki-67, TUNEL, MMP and ROS Assays
Paraffin-embedded tumor sections were dewaxed, followed by antigen retrieval. Detection was performed according to the instructions of the Ki-67 cell proliferation detection kit. The sections were observed under a light microscope, and images were captured.
Apoptotic nuclei in frozen sections of tumor tissues were detected according to the instructions of One Step TUNEL Apoptosis Assay Kit. MMP and ROS levels in the frozen tumor tissues sections were treated according to the standard specification of the kits. JC-1 was applied to detect MMP, and DCFH-DA fluorescence dye was used to detect ROS. Nuclei were counterstained with DAPI. Tissue sections were observed under a fluorescence microscope (ECLIPSE TE2000-U, Nikon, Japan) and photographed.
Western Blotting Detection of Cell Cycle-, Apoptosis- and Autophagy-Related Proteins
The cryopreserved tumor tissues were blended with cell lysis solution for 40 min and centrifuged (13,000 rpm) at 4 °C for 20 min. The supernatant was used for protein quantification with a BCA Protein Assay Kit. Protein samples were separated by SDS polyacrylamide gel electrophoresis at 80 V and transferred to a nitrocellulose membrane. The membrane proteins were incubated with TBST buffer containing 5% skim milk at room temperature for 1 h, and anti-Bax, anti-Bcl-2, anti-Caspase-3, anti-Caspase-9, anti-Cytochrome C, anti-Beclin-1, anti-LC3, anti-Atg5, anti-Atg12, anti-ULK1, anti-P53, anti-CyclinB1, anti–Cdc2, and anti-β-actin antibodies were added and incubated at room temperature for 1 h. The membrane was washed 3 times with Tris-buffered saline Tween (TBST), 10 mins each, and then with a horseradish peroxidase (HRP)-labeled goat anti-mouse or goat anti-rabbit IgG secondary antibody at room temperature for 1 h. After the membrane was washed 3 times with TBST, 10 mins each, the blot was developed using enhanced chemiluminescence (ECL) (Tanon, Shanghai, China), and exposed to film.
Images and Statistical Analysis
SPSS 20.0 software was used for statistical analysis, and GraphPad Prism 6 was used to plot the data. The data are expressed as the mean ± standard deviation. ANOVA was used to evaluate differences between groups, and Tukey’s post-test was conducted. * p < 0.05, ** p < 0.01, *** p < 0.001, and **** p < 0.0001.
Results
Inhibitory Effect of IF203 on HepG2 Cell Growth
By inverted phase-contrast microscopy, the HepG2 cells in the control group showed polygonal spreading, their membranes were clear and complete, and the cytoplasm was clear. After treatment with IF203 (10 mg/L) for 24 h, the HepG2 cells became round and solid, the cell membranes crumpled and were sunken but still intact, and cytoplasmic particles increased (Figure 1B). APAs showed that the growth of HepG2 cells was significantly inhibited with an increasing dose of IF203 (Figure 1C). The survival dose curve was transformed into a dose-response curve for nonlinear regression fitting, and the half maximal inhibitory concentration (IC50) value was calculated. The IC50 value of IF203 for HepG2 cells in this study was 3.8 mg/L.
AO/EB Double Staining to Detect HepG2 Cell Apoptosis
Under fluorescence microscopy, the nuclei of the control group cells were bright green when stained with AO, and only a few nuclei were orange when stained with EB. After IF203 (5 mg/L) treatment for 24 h, some nuclei stained densely with AO, displaying dark green, clumpy or round particles (early apoptosis cells). Some of the nuclei were heavily stained by EB, showing orange red and pyknotic shapes (late apoptosis cells) (Figure 1D).
Ultrastructural Changes of HepG2 Cells Observed Under TEM
The membranes of HepG2 cells in the control group were intact, and the nuclei, nuclear membrane and nucleoli were clearly visible (Figure 2A). After IF203 treatment, the cells exhibited early apoptosis: they were wrinkled, the chromatin became dense and aggregated under the nuclear membrane, and the mitochondria were swollen and expanded, though the cell membrane was intact (Figure 2B). The middle stage of apoptosis was highlighted by shriveled cells, aggregated chromatin, and a vesicular cell membrane (Figure 2C). The manifestations of late apoptosis included broken nuclei, and cell membrane blebs and apoptotic bodies (Figure 2D). TEM also revealed that autophagy was associated with apoptosis. As shown in Figure 2E, no autophagic vacuoles were found in the cytoplasm of HepG2 cells in the control group. In contrast, autophagosomes (white arrows) were present in early, middle, and late apoptotic cells (Figure 2F–H), indicating that autophagy was associated with apoptosis.
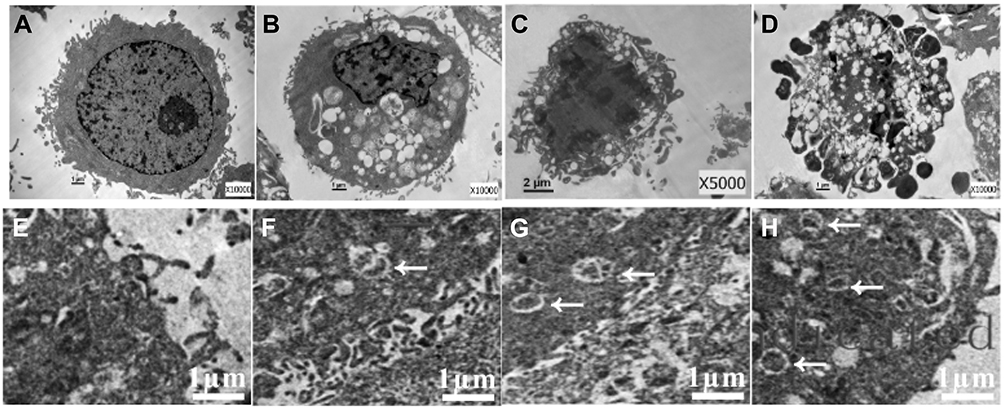 |
Figure 2 The ultrastructural changes of HepG2 cells after treatment with IF203 under TEM. White arrows indicate autophagy vesicles. |
Cell Cycle Arrest Effect of IF203 on HepG2 Cells
After treatment with IF203 (5 mg/L) or IF203 (10 mg/L) for 24 h, compared with control group, the proportion of cells in S phase was not significantly different, the proportion of cells in G0/G1 phase was significantly reduced, whereas the proportion in G2/M phase was significantly increased (18.50 ± 1.31%, 40.30 ± 2.41%, respectively) (Figure 3A and E), indicating that IF203 can cause cell cycle arrest in G2/M phase.
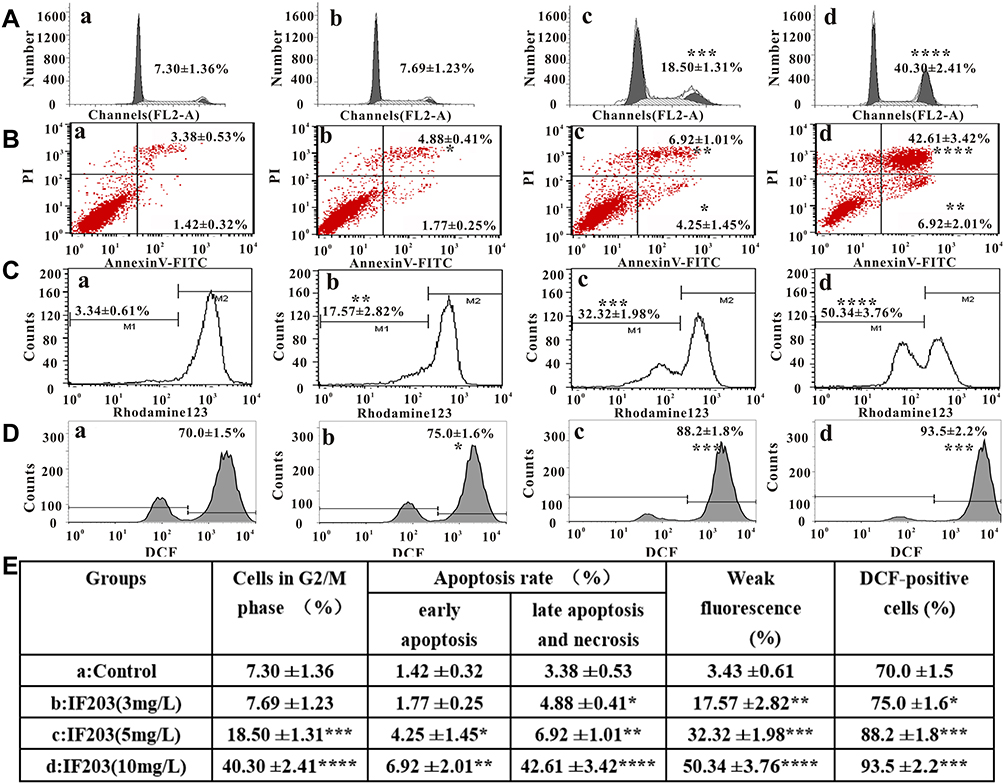 |
Figure 3 The effect of IF203 on the cell cycle, apoptosis, MMP and ROS levels detected by flow cytometry. (A) Cell cycle distribution of HepG2 cells after treatment with IF203. (B) Apoptosis ratio of HepG2 cells after treatment with IF203. (C) Changes in MMP in HepG2 cells after treatment with IF203. (D) Changes in ROS levels in HepG2 cells after treatment with IF203. (E) A table to summarize all data in (A–D) by putting the respective numbers. a: Control; b: IF203 (3 mg/L); c: IF203 (5 mg/L); d: IF203 (10 mg/L). Data are presented as the mean ± SD (n = 3). Compared with the control group, *p < 0.05, **p < 0.01, ***p < 0.001, and ****p < 0.0001. |
Apoptosis Rate Detected with Annexin V-FITC/PI Double Staining and FCM
The ratio of apoptotic cells and dead cells in the control group was very low, though the ratio of early apoptotic, late apoptotic and necrotic cells gradually increased after treatment with IF203 (3 mg/L, 5 mg/L or 10 mg/L), especially in the 10 mg/L group. The percentages of apoptotic and dead cells were 6.92 ± 2.01% and 42.61 ± 3.42%, respectively (Figure 3B and E).
MMP Changes in HepG2 Cells After Treatment with IF203
As shown in Figure 3C and E, the proportion of cells with weak fluorescence (M1 channel) in the control group was 3.43 ± 0.61%. After treatment with IF203 (3 mg/L, 5 mg/L or 10 mg/L) for 24 h, the proportion of HepG2 cells with weak fluorescence (M1 channel) increased significantly to 17.57 ± 2.82%, 32.32 ± 1.98% and 50.34 ± 3.76%, respectively. These differences were statistically significant compared with those of the control group. This result suggested that the ability of Rho123 to bind to mitochondria decreased, resulting in a reduction in fluorescent dye entering the cells, an increase in the percentage of cells with weak fluorescence, and a decrease in MMP.
Changes in ROS Levels in HepG2 Cells After Treatment with IF203
As shown in Figure 3D and E, the proportion of DCF-positive cells in the control group was 70.0 ± 1.5%; the proportion of DCF-positive cells after treatment with IF203 (3 mg/L), IF203 (5 mg/L), or IF203 (10 mg/L) accounted for 75.0 ± 1.6%, 88.2 ± 1.8%, and 93.5 ± 2.2%, respectively. These results suggest that ROS production in HepG2 cells was gradually enhanced with increasing IF203 concentration.
Antitumor Effect of IF203 in vivo
As shown in Figure 4A, there was no significant change in body weight of nude mice treated with IF203 compared to that of the control group. However, tumor volumes decreased significantly after IF203 treatment and gradually decreased with increasing IF203 dose (Figure 4B and C), suggesting that IF203 substantially inhibited tumor growth. Based on H&E staining of tumor tissue sections (Figure 4D), tumor cells in the control group grew vigorously. There were gradually more necrotic HepG2 cells with increasing IF203 concentration, further suggesting that IF203 inhibited HepG2 cell growth and that the tumor inhibitory effect gradually increased with IF203 dose.
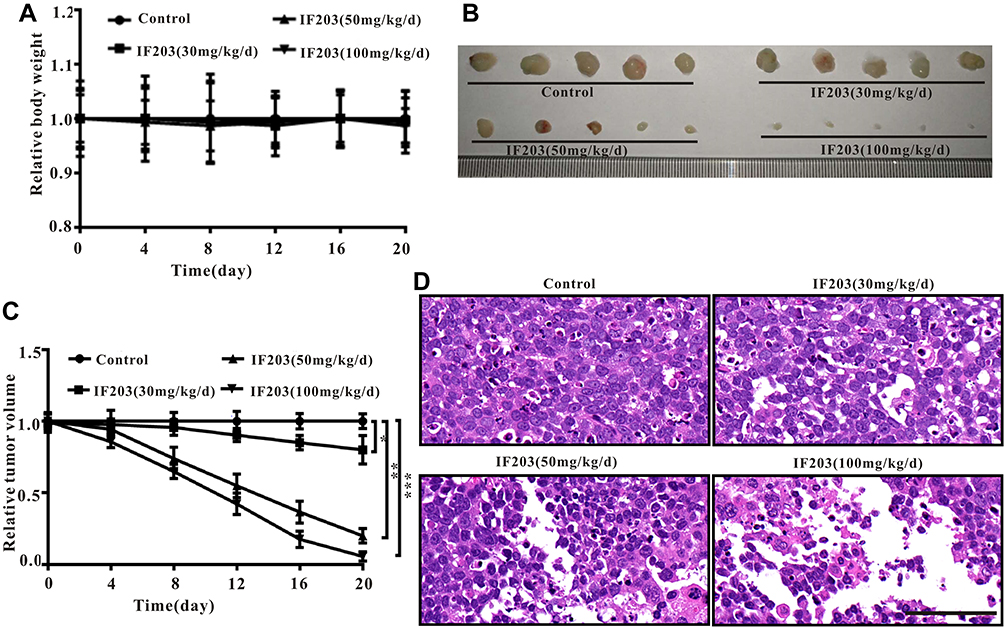 |
Figure 4 Anticancer effect of IF203 on HepG2-induced tumor-bearing BALB/c nude mice. (A) Changes in body weight after treatment with IF203. (B) Representative picture of tumors. (C) Changes in tumor volume after treatment with IF203. (D) Representative cell morphology of tumor tissues after treatment with IF203 and H&E staining. Scale bar: 100 μm. Data are presented as the mean ± SD (n = 3). Compared with the control group, *p < 0.05, **p < 0.01, and ***p < 0.001. |
Ki-67 Immunohistochemistry Assay, TUNEL, MMP and ROS Immunofluorescence Assay
Compared with the control cells, Ki-67-positive (brown) cells decreased gradually with IF203 treatment in a dose-dependent manner (Figure 5A), suggesting that IF203 suppressed HepG2 cell proliferation, an effect that was enhanced with increasing IF203 concentration. As shown in Figure 5B, the number of TUNEL-positive (green fluorescent) cells increased after IF203 treatment, compared with control cells, also in a dose-dependent manner; thus, IF203 induces apoptosis in HepG2 cells and the proportion of apoptotic cells increases with increasing IF203 concentration.
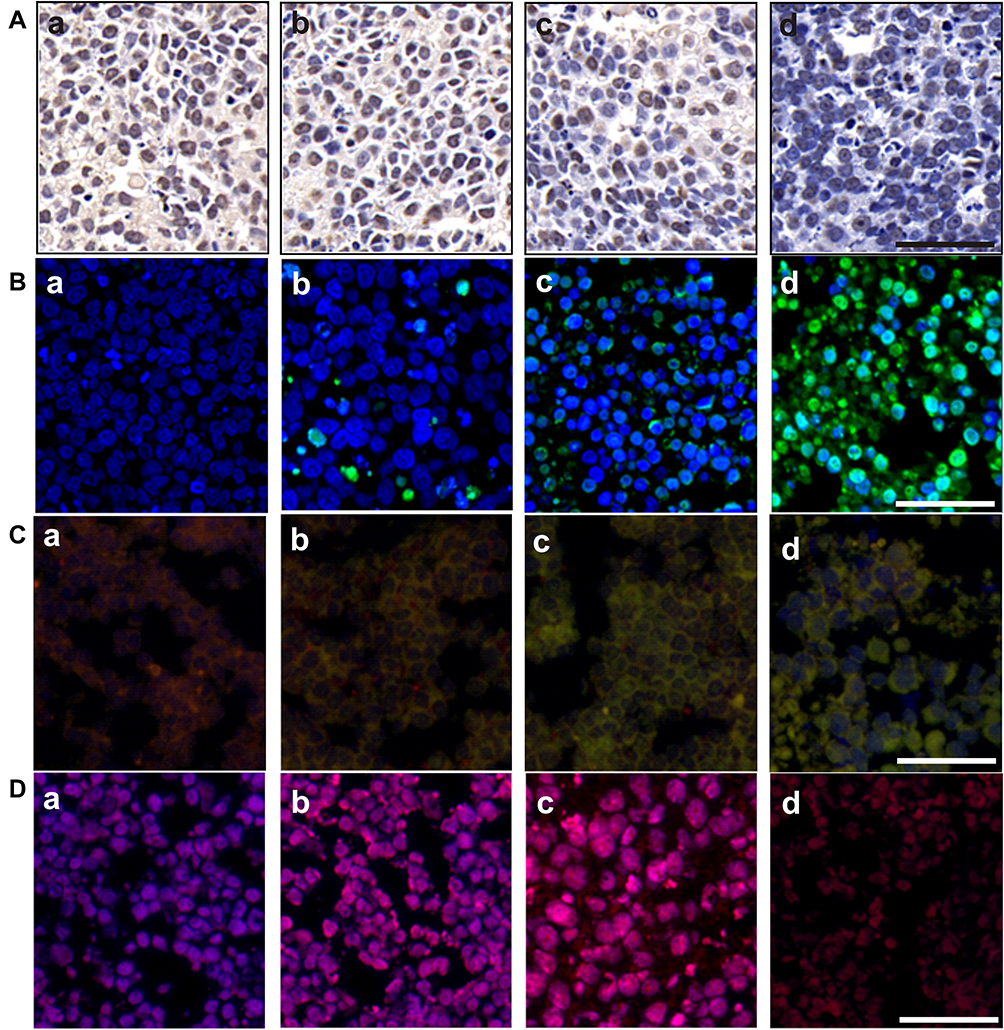 |
Figure 5 Immunohistochemical and immunofluorescence staining of tumor tissues. (A) Ki-67 assay, (B) TUNEL assay, (C) MMP assessment and (D) ROS analysis of tumor tissues on the 20th day after intravenous injection of IF203. a: Control; b: IF203 (30 mg/kg/d); c: IF203 (50 mg/kg/d); d: IF203 (100 mg/kg/d). Scale bar: 100 μm. |
As shown in Figure 5C, cells in tumor tissue sections of the control group were almost red after staining with JC-1. However, the proportion of green fluorescent cells gradually increased after treatment with IF203, suggesting that IF203 decreased the MMP level in HepG2 cells, especially in the 10 mg/L group. According to DCFH-DA staining and DAPI counterstaining of tumor tissue sections, the red fluorescence intensity of tumor cells treated with IF203 was significantly stronger than that of the control group (Figure 5D). In addition, the red fluorescence gradually increased with increasing IF203 concentration, demonstrating that IF203 induced ROS in tumor cells.
Changes in Cell Cycle-Related, Apoptotic and Autophagy-Associated Protein Expression
The relative expression level of P53 increased after treatment with IF203, and CyclinB1 and Cdc2 expression was significantly downregulated. These results were consistent with the results of the FCM cell cycle assay, confirming that IF203 caused G2/M phase cell cycle arrest in HepG2 cells (Figure 6). The level of Bax expression gradually increased, and that of Bcl-2 gradually decreased after treatment with IF203, suggesting that IF203 induced apoptosis in HepG2 cells. After treatment with IF203, the expression levels of Pro-caspase-9 and Pro-caspase-3 were downregulated, whereas those of Caspase-9 and Caspase-3 were upregulated, indicating that Caspase-9 and Caspase-3 were activation. Furthermore, Cytochrome C expression was significantly increased after treatment with IF203. As shown in Figure 6, after treatment with IF203, LC3-I and LC3-II expression was downregulated and upregulated in HepG2 cells, respectively, demonstrating gradual transformation of LC3-I into LC3-II. Compared with the control, IF203 treatment enhanced expression of the autophagy-related genes Atg5, Atg12, ULK1 and Beclin-1. The above results show that IF203 promotes autophagy in HepG2 cells by activating autophagy‐related genes (ATGs) and upregulating expression of autophagy-related proteins.
 |
Figure 6 Cell cycle-related, apoptosis-associated, autophagy-associated protein expression in tumor tissues at D20 after intravenous injection of IF203. 1: Cyclin B1; 2: Cdc 2; 3: P53; 4: Pro-caspase-9; 5: Caspase-9; 6: Pro-caspase-3; 7: Caspase-3; 8: cytoplasmic Cytochrome C; 9: Cytochrome C; 10: Bcl-2; 11: Bax; 12: Atg5; 13: Atg12; 14: ULK1; 15: Beclin-1; 16: LC3-I; 17: LC3-II. Data are presented as the mean ± SD (n = 3). Compared with the control group, * p < 0.05, ** p < 0.01, *** p < 0.001, and **** p < 0.0001. |
Complete Blood Count (CBC), Serum Enzyme Levels and Tissue Images
We performed CBC analysis to assess the hematologic toxicity of IF203. Based on CBC analysis, the counts of white blood cells (WBCs), red blood cells (RBCs) and platelets (PLTs) were all in the normal range after treatment with IF203. We also performed serum enzyme assays and histological assays to assess the effect of IF203 on visceral organ function. As shown in Table 1, liver function indicators [alanine transaminase (ALT) and aspartate amino-transferase (AST)] did not increase, and renal function indicators [blood urea nitrogen (BUN) and creatinine (Cr)] were not elevated. Moreover, cardiac toxicity indexes [lactate dehydrogenase (LDH), hypersensitive troponin T (TNT - HS), creatine kinase (CK), creatine kinase-MB (CK - MB) and myoglobin (Myo)] did not increase after treatment with IF203 (Table 1). Moreover, sectioning and H&E staining revealed no significant abnormalities in the heart, liver, spleen, lung, kidney, brain, and skeletal muscle (Figure 7). These results indicate that IF203 does not cause significant myelosuppression or toxicity to the heart, liver, spleen, lungs, kidneys, brain and skeletal muscle. In summary, IF203 has no apparent systemic toxic effects.
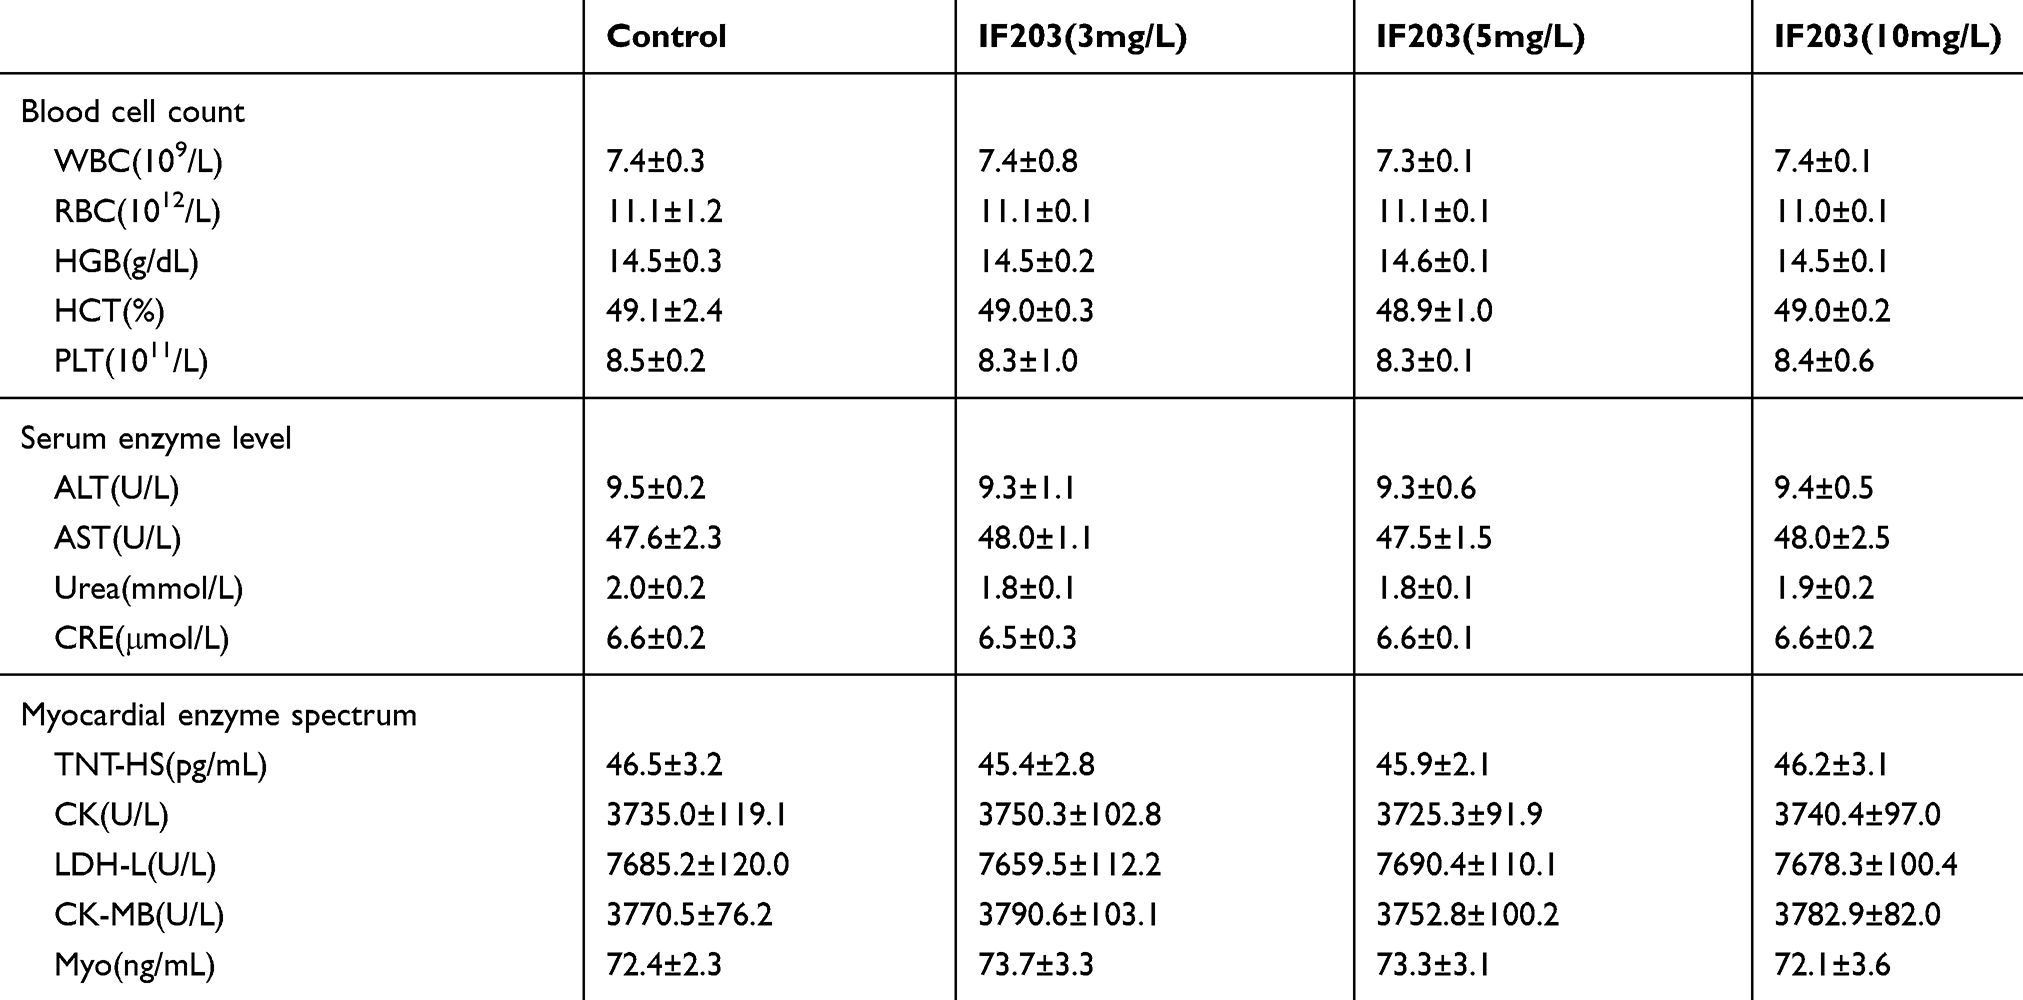 |
Table 1 The Blood Cell Counts, the Enzyme Level and Myocardial Enzyme Spectrum Analysis of Tumor Bearing Mice After Treated with IF203. Data are Mean ± SD (n=3) |
 |
Figure 7 The tissue morphology of the heart, liver, spleen, lungs, kidneys, brain and skeletal muscle after IF203 treatment and H&E staining. Scale bar: 100 μm. |
Discussion
Isatin is a pharmacophore of many types of antitumor drugs,19 and many isatin derivatives have antitumor activity.20–22 The antitumor mechanism of isatin derivatives has attracted much attention and become a focus of research. IF203, a new type of isatin derivative, was prepared by a dehydration and condensation reaction. In this study, HepG2 liver cancer cells were selected as a representative cell line to explore the in vivo and in vitro antitumor mechanism of IF203.
The cell cycle regulates cell growth and proliferation, and cell cycle arrest induces cell proliferation inhibition and apoptosis.23 Mitosis which the cell is separating the chromosomes is the phase where the cell is most poised to undergo apoptosis if something is wrong.24 Studies have shown that isatin derivatives can induce G2/M phase cell cycle arrest.25 Cell cycle progression to G2/M phase is regulated by a complex composed of the catalytic subgroup Cdc2 and the regulatory subgroup CDK1, and Cdc2 dephosphorylation and CyclinB1 downregulation lead to G2/M phase arrest.26 Thus, CyclinB1 and Cdc2 are related to G2/M arrest.27 The tumor suppressor P53 modulates the G2/M checkpoint in response to DNA damage.28 In this study, a cell cycle assay by FCM showed that IF203 induced G2/M-phase cell cycle arrest in HepG2 cells, which was consistent with the changes in CyclinB1 and Cdc2 expression. Ki-67 immunohistochemical staining further confirmed that IF203 significantly inhibited HepG2 cell proliferation.
An increasing number of studies have shown that cell cycle arrest is associated with apoptosis,28 and we found that IF203 induced cell cycle arrest and apoptosis in HepG2 cells. Apoptotic cells staining orange were observed after AO/EB double staining, and the typical ultrastructural changes of early, middle and late apoptosis were observed by TEM. Furthermore, apoptosis rate analysis by FCM showed that the percentage of early and late apoptotic cells gradually increased with increasing IF203 concentration, indicating that the cells gradually passed through the stages of apoptosis. TUNEL immunofluorescence staining also showed that IF203 promoted apoptosis in HepG2 cells.
Apoptosis signals can trigger caspases to activate different substrates, leading to cell disintegration and DNA fragmentation.29,30 There are two main pathways of apoptosis: the external apoptosis pathway mediated by the death receptor and the mitochondrial-mediated apoptosis pathway.31,32 Mitochondria, as the energy metabolism center of cells, play an important role in regulating apoptosis, autophagy and cell death.33 Mitochondrial apoptosis can be triggered by various factors, such as ROS accumulation30 and DNA damage.34 This study showed that IF203 can induce cell death through mitochondrial apoptosis mediated by ROS accumulation, DNA fragmentation and Caspase-3 and Caspase-9 activation. In addition, increasing evidence demonstrates that proteins of the Bcl‐2 family play an important role in the regulating apoptosis and can be divided into two main groups: proapoptotic proteins (such as Bax) and apoptotic inhibitory proteins (such as Bcl-2).35 In particular, the Bcl-2/Bax ratio is a crucial factor in the regulation of apoptosis.36 As a transcription factor, the P53 protein participates in cell proliferation, DNA damage repair and apoptosis, and downregulation of P53 expression promotes tumor formation and interferes with DNA damage repair. P53 regulates apoptosis by inhibiting expression of antiapoptotic proteins (e.g. Bcl-2).37 In our study, expression of P53 was upregulated after IF203 treatment, thereby inhibiting tumor cell growth and inducing tumor cell apoptosis.
Generally, autophagy is a protective cell response that promotes survival.38–40 However, in some cases, autophagy is a mechanism for cell death.41 In vivo and in vitro studies show that antitumor drugs can induce autophagy in tumor cells,42,43 and thus cell death induced by autophagy may be a new strategy for tumor treatment. Autophagy is a multistep process that includes autophagy, the formation of phagocytic vesicles and the formation of autophagosomes.44 ATGs regulate the autophagic process.45,46 Atg12 binds to Atg5 to form an irreversible Atg12-Atg5 complex, which in turn activates LC3-II.47 Mitochondrial-related membrane locations play a vital role in the closure of phagocytic vesicles and the formation of autophagosomes by targeting ATG complexes.48,49 The unc-51-like autophagy activating kinase 1 (ULK1) protein kinase complexes activate autophagy.50 Moreover, the Atg1/ULK complex is involved in the initiation and regulation of autophagy: it recruits downstream Atg proteins to the site of autophagy and regulates autophagosomes formation.51,52 In this study, TEM showed that IF203 promoted both apoptosis and autophagy in HepG2 cells. Autophagy induces apoptosis,53 and activation of ULK induces phosphorylation of VPS34 and promotes its kinase activity.54 In addition, binding between Beclin-1 and VPS34 promote the formation of autophagosomes.55 As a specific marker of autophagosome formation, LC3 exists in the forms of LC3-I and LC3-II. After activation of autophagy, LC3-I is transformed into LC3-II, promoting autophagosome formation.55 The tumor suppressor gene P53 can also induce autophagic cell death.56 In the present study, IF203 promoted autophagy in HepG2 cells by upregulating expression of Atg5, Atg12, ULK1 and Beclin-1 and stimulating the transformation from LC3-I to LC3-II.
ROS overproduction has an important function in the activation of apoptosis and autophagic signaling.57 Indeed, as a cellular signal, ROS regulate cell proliferation and survival and disrupt normal cell processes, leading to cell death. The induction of apoptosis and autophagy is usually associated with an increase in ROS and a decrease in MMP.58 ROS also upregulate expression of ATGs, promoting autophagosome formation.45 Overall, excessive ROS lead to an increase in autophagy.44 Our results showed that the ROS level of HepG2 cells increased with increasing IF203 dose, and that expression of apoptosis- and autophagy-related proteins increased with increasing ROS, suggesting that ROS can promote IF203-induced apoptosis and autophagy.
Conclusion
In conclusion, this study showed that IF203, an indigo red derivative, has antitumor activity by inhibiting proliferation and inducing apoptosis and autophagy in HepG2 cells both in vitro and in vivo. The findings lay a foundation for further studies on the antitumor activity of isatin derivatives.
Ethics Approval and Informed Consent
The animal experiment was approved by ethics committee of the Third Xiangya Hospital of Central South University (No. 2017-s66), and the animal care followed the guidelines released by the Ministry of Science and Technology of the People’s Republic of China in September 30th, 2006. Informed consent was not applicable.
Data Sharing Statement
All data generated or analyzed during this study are included in this published article.
Author Contributions
All authors contributed to data analysis, drafting and revising the article, gave final approval of the version to be published, and agree to be accountable for all aspects of the work.
Disclosure
The authors declare that they have no competing interests.
References
1. Kim H, Ahn SW, Hong SK, et al. Survival benefit of liver resection for Barcelona Clinic Liver Cancer stage B hepatocellular carcinoma. Br J Surg. 2017;104(8):1045–1052. doi:10.1002/bjs.10541
2. Xu Z, Zhao SJ, Lv ZS, et al. Fluoroquinolone-isatin hybrids and their biological activities. Eur J Med Chem. 2019;162:396–406. doi:10.1016/j.ejmech.2018.11.032
3. Abdel-Aziz HA, Eldehna WM, Keeton AB, et al. Isatin-benzoazine molecular hybrids as potential antiproliferative agents: synthesis and in vitro pharmacological profiling. Drug Des Devel Ther. 2017;11:2333–2346. doi:10.2147/DDDT.S140164
4. Hou Y, Shang C, Wang H, Yun J. Isatin-azole hybrids and their anticancer activities. Arch Pharm (Weinheim). 2019;e1900272.
5. Pakravan P, Kashanian S, Khodaei MM, Harding FJ. Biochemical and pharmacological characterization of isatin and its derivatives: from structure to activity. Pharmacological Reports: PR. 2013;65(2):313–335. doi:10.1016/S1734-1140(13)71007-7
6. Ammar YA, Sh El-Sharief AM, Belal A, et al. Design, synthesis, antiproliferative activity, molecular docking and cell cycle analysis of some novel (morpholinosulfonyl) isatins with potential EGFR inhibitory activity. Eur J Med Chem. 2018;156:918–932. doi:10.1016/j.ejmech.2018.06.061
7. Zhang Q, Teng Y, Yuan Y, et al. Synthesis and cytotoxic studies of novel 5-phenylisatin derivatives and their anti-migration and anti-angiogenic evaluation. Eur J Med Chem. 2018;156:800–814. doi:10.1016/j.ejmech.2018.07.032
8. Ibrahim HS, Abou-Seri SM, Abdel-Aziz HA. 3-Hydrazinoindolin-2-one derivatives: chemical classification and investigation of their targets as anticancer agents. Eur J Med Chem. 2016;122:366–381. doi:10.1016/j.ejmech.2016.06.034
9. Rives A, Le Calve B, Delaine T, Legentil L, Kiss R, Delfourne E. Synthesis and antitumor evaluation of analogues of the marine pyrroloiminoquinone tsitsikammamines. Eur J Med Chem. 2010;45(1):343–351. doi:10.1016/j.ejmech.2009.10.019
10. Baltus CB, Jorda R, Marot C, et al. Synthesis, biological evaluation and molecular modeling of a novel series of 7-azaindole based tri-heterocyclic compounds as potent CDK2/Cyclin E inhibitors. Eur J Med Chem. 2016;108:701–719. doi:10.1016/j.ejmech.2015.12.023
11. Kamal A, Mahesh R, Nayak VL, et al. Discovery of pyrrolospirooxindole derivatives as novel cyclin dependent kinase 4 (CDK4) inhibitors by catalyst-free, green approach. Eur J Med Chem. 2016;108:476–485. doi:10.1016/j.ejmech.2015.11.046
12. Parrino B, Attanzio A, Spano V, et al. Synthesis, antitumor activity and CDK1 inhibiton of new thiazole nortopsentin analogues. Eur J Med Chem. 2017;138:371–383. doi:10.1016/j.ejmech.2017.06.052
13. Sonawane V, Mohd Siddique MU, Jadav SS, Sinha BN, Jayaprakash V, Chaudhuri B. Cink4T, a quinazolinone-based dual inhibitor of Cdk4 and tubulin polymerization, identified via ligand-based virtual screening, for efficient anticancer therapy. Eur J Med Chem. 2019;165:115–132. doi:10.1016/j.ejmech.2019.01.011
14. Popolo A, Pinto A, Daglia M, Nabavi SF, Farooqi AA, Rastrelli L. Two likely targets for the anti-cancer effect of indole derivatives from cruciferous vegetables: PI3K/Akt/mTOR signalling pathway and the aryl hydrocarbon receptor. Semin Cancer Biol. 2017;46:132–137. doi:10.1016/j.semcancer.2017.06.002
15. Rathi AK, Syed R, Singh V, Shin HS, Patel RV. Kinase inhibitor indole derivatives as anticancer agents: a patent review. Recent Pat Anticancer Drug Discov. 2017;12(1):55–72. doi:10.2174/1574892811666161003112119
16. Deokar H, Deokar M, Wang W, Zhang R, Buolamwini JK. QSAR Studies of New Pyrido[3,4-b]indole derivatives as inhibitors of colon and pancreatic cancer cell proliferation. Med Chem Res. 2018;27(11–12):2466–2481. doi:10.1007/s00044-018-2250-5
17. Mhetre AB, Lee H, Yang H, Lee K, Nam DH, Lim D. Synthesis and anticancer activity of benzoselenophene and heteroaromatic derivatives of 1,2,9,9a-tetrahydrocyclopropa[c]benzo[e]indol-4-one (CBI). Org Biomol Chem. 2017;15(5):1198–1208. doi:10.1039/C6OB02729F
18. Li W, Sun H, Xu F, et al. Synthesis, molecular properties prediction and biological evaluation of indole-vinyl sulfone derivatives as novel tubulin polymerization inhibitors targeting the colchicine binding site. Bioorg Chem. 2019;85:49–59. doi:10.1016/j.bioorg.2018.12.015
19. El-Sharief AMS, Ammar YA, Belal A, et al. Design, synthesis, molecular docking and biological activity evaluation of some novel indole derivatives as potent anticancer active agents and apoptosis inducers. Bioorg Chem. 2019;85:399–412. doi:10.1016/j.bioorg.2019.01.016
20. Eldehna WM, Abo-Ashour MF, Nocentini A, et al. Enhancement of the tail hydrophobic interactions within the carbonic anhydrase IX active site via structural extension: design and synthesis of novel N-substituted isatins-SLC-0111 hybrids as carbonic anhydrase inhibitors and antitumor agents. Eur J Med Chem. 2019;162:147–160. doi:10.1016/j.ejmech.2018.10.068
21. Fernandez-Moreira V, Val-Campillo C, Ospino I, et al. Bioactive and luminescent indole and isatin based gold(i) derivatives. Dalton Trans (Cambridge, England: 2003). 2019;48(9):3098–3108. doi:10.1039/C8DT00298C
22. Muhammad ZA, Radwan MAA, Farghaly TA, Gaber HM, Elaasser MM. Synthesis and antitumor activity of novel [1,2,4,5]-tetrazepino[6,7-b] indole derivatives: marine natural product Hyrtioreticuline C and D analogues. Mini Rev Med Chem. 2019;19(1):79–86. doi:10.2174/1389557518666180724094244
23. Chao JI, Kuo PC, Hsu TS. Down-regulation of survivin in nitric oxide-induced cell growth inhibition and apoptosis of the human lung carcinoma cells. J Biol Chem. 2004;279(19):20267–20276. doi:10.1074/jbc.M312381200
24. Mukhopadhyay S, Saqcena M, Foster DA. Synthetic lethality in KRas-driven cancer cells created by glutamine deprivation. Oncoscience. 2015;2(10):807–808. doi:10.18632/oncoscience.253
25. Zhou Y, Zhao HY, Han KL, et al. 5-(2-carboxyethenyl) isatin derivative induces G(2)/M cell cycle arrest and apoptosis in human leukemia K562 cells. Biochem Biophys Res Commun. 2014;450(4):1650–1655. doi:10.1016/j.bbrc.2014.07.053
26. Kishimoto T. Entry into mitosis: a solution to the decades-long enigma of MPF. Chromosoma. 2015;124(4):417–428. doi:10.1007/s00412-015-0508-y
27. Stark GR, Taylor WR. Analyzing the G2/M checkpoint. Methods Mol Biol. 2004;280:51–82. doi:10.1385/1-59259-788-2:051
28. Ryu H, Nam KY, Kim JS, Hwang SG, Song JY, Ahn J. The small molecule AU14022 promotes colorectal cancer cell death via p53-mediated G2/M-phase arrest and mitochondria-mediated apoptosis. J Cell Physiol. 2018;233(6):4666–4676. doi:10.1002/jcp.26234
29. Elumalai P, Gunadharini DN, Senthilkumar K, et al. Induction of apoptosis in human breast cancer cells by nimbolide through extrinsic and intrinsic pathway. Toxicol Lett. 2012;215(2):131–142. doi:10.1016/j.toxlet.2012.10.008
30. Simon HU, Haj-Yehia A, Levi-Schaffer F. Role of reactive oxygen species (ROS) in apoptosis induction. Apoptosis. 2000;5(5):415–418. doi:10.1023/A:1009616228304
31. Goldar S, Khaniani MS, Derakhshan SM, Baradaran B. Molecular mechanisms of apoptosis and roles in cancer development and treatment. Asian Pac J Cancer Prev. 2015;16(6):2129–2144. doi:10.7314/APJCP.2015.16.6.2129
32. Khan KH, Blanco-Codesido M, Molife LR. Cancer therapeutics: targeting the apoptotic pathway. Crit Rev Oncol Hematol. 2014;90(3):200–219. doi:10.1016/j.critrevonc.2013.12.012
33. Yan H, Zareen N, Levinger L. Naturally occurring mutations in human mitochondrial pre-tRNASer(UCN) can affect the transfer ribonuclease Z cleavage site, processing kinetics, and substrate secondary structure. J Biol Chem. 2006;281(7):3926–3935. doi:10.1074/jbc.M509822200
34. McIlwain DR, Berger T, Mak TW. Caspase functions in cell death and disease. Cold Spring Harb Perspect Biol. 2013;5(4):a008656. doi:10.1101/cshperspect.a008656
35. Thiyagarajan V, Tsai MJ, Weng CF. Antroquinonol targets FAK-signaling pathway suppressed cell migration, invasion, and tumor growth of C6 glioma. PLoS ONE. 2015;10:10. doi:10.1371/journal.pone.0141285
36. Adams JM, Cory S. The Bcl-2 protein family: arbiters of cell survival. Science (New York, NY). 1998;281(5381):1322–1326. doi:10.1126/science.281.5381.1322
37. Zheng HC. The molecular mechanisms of chemoresistance in cancers. Oncotarget. 2017;8(35):59950–59964. doi:10.18632/oncotarget.19048
38. Denton D, Nicolson S, Kumar S. Cell death by autophagy: facts and apparent artefacts. Cell Death Differ. 2012;19(1):87–95. doi:10.1038/cdd.2011.146
39. White E. The role for autophagy in cancer. J Clin Invest. 2015;125(1):42–46. doi:10.1172/JCI73941
40. Yonekawa T, Thorburn A. Autophagy and cell death. Essays Biochem. 2013;55:105–117. doi:10.1042/bse0550105
41. Chen HY, White E. Role of autophagy in cancer prevention. Cancer Prev Res (Phila). 2011;4(7):973–983. doi:10.1158/1940-6207.CAPR-10-0387
42. Rubinsztein DC, Codogno P, Levine B. Autophagy modulation as a potential therapeutic target for diverse diseases. Nat Rev Drug Discov. 2012;11(9):709–730. doi:10.1038/nrd3802
43. Chen P, Yu J, Chalmers B, et al. Pharmacological ascorbate induces cytotoxicity in prostate cancer cells through ATP depletion and induction of autophagy. Anticancer Drugs. 2012;23(4):437–444. doi:10.1097/CAD.0b013e32834fd01f
44. Yu L, Chen Y, Tooze SA. Autophagy pathway: cellular and molecular mechanisms. Autophagy. 2018;14(2):207–215. doi:10.1080/15548627.2017.1378838
45. Mizushima N, Komatsu M. Autophagy: renovation of cells and tissues. Cell. 2011;147(4):728–741. doi:10.1016/j.cell.2011.10.026
46. Mizushima N, Yoshimori T, Ohsumi Y. The role of Atg proteins in autophagosome formation. Annu Rev Cell Dev Biol. 2011;27:107–132. doi:10.1146/annurev-cellbio-092910-154005
47. Otomo C, Metlagel Z, Takaesu G, Otomo T. Structure of the human ATG12~ATG5 conjugate required for LC3 lipidation in autophagy. Nat Struct Mol Biol. 2013;20(1):59–66. doi:10.1038/nsmb.2431
48. Reggiori F, Ungermann C. Autophagosome Maturation and Fusion. J Mol Biol. 2017;429(4):486–496. doi:10.1016/j.jmb.2017.01.002
49. Tagaya M, Arasaki K. Regulation of mitochondrial dynamics and autophagy by the mitochondria-associated membrane. Adv Exp Med Biol. 2017;997:33–47.
50. Feng Y, He D, Yao Z, Klionsky DJ. The machinery of macroautophagy. Cell Res. 2014;24(1):24–41. doi:10.1038/cr.2013.168
51. Mizushima N. The role of the Atg1/ULK1 complex in autophagy regulation. Curr Opin Cell Biol. 2010;22(2):132–139. doi:10.1016/j.ceb.2009.12.004
52. Wong PM, Puente C, Ganley IG, Jiang X. The ULK1 complex: sensing nutrient signals for autophagy activation. Autophagy. 2013;9(2):124–137. doi:10.4161/auto.23323
53. Maiuri MC, Zalckvar E, Kimchi A, Kroemer G. Self-eating and self-killing: crosstalk between autophagy and apoptosis. Nat Rev Mol Cell Bio. 2007;8(9):741–752. doi:10.1038/nrm2239
54. Dooley HC, Razi M, Polson HEJ, Girardin SE, Wilson MI, Tooze SA. WIPI2 links LC3 conjugation with PI3P, autophagosome formation, and pathogen clearance by recruiting Atg12-5-16L1. Mol Cell. 2014;55(2):238–252. doi:10.1016/j.molcel.2014.05.021
55. Funderburk SF, Wang QJ, Yue Z. The Beclin 1-VPS34 complex–at the crossroads of autophagy and beyond. Trends Cell Biol. 2010;20(6):355–362. doi:10.1016/j.tcb.2010.03.002
56. Maiuri MC, Galluzzi L, Morselli E, Kepp O, Malik SA, Kroemer G. Autophagy regulation by p53. Curr Opin Cell Biol. 2010;22(2):181–185. doi:10.1016/j.ceb.2009.12.001
57. Park SH, Kim JH, Chi GY, et al. Induction of apoptosis and autophagy by sodium selenite in A549 human lung carcinoma cells through generation of reactive oxygen species. Toxicol Lett. 2012;212(3):252–261. doi:10.1016/j.toxlet.2012.06.007
58. Zhang YX, Yu PF, Gao ZM, Yuan J, Zhang Z. Caffeic acid n-butyl ester-triggered necrosis-like cell death in lung cancer cell line A549 is prompted by ROS mediated alterations in mitochondrial membrane potential. Eur Rev Med Pharmacol Sci. 2017;21(7):1665–1671.
 © 2020 The Author(s). This work is published and licensed by Dove Medical Press Limited. The
full terms of this license are available at https://www.dovepress.com/terms
and incorporate the Creative Commons Attribution
- Non Commercial (unported, 3.0) License.
By accessing the work you hereby accept the Terms. Non-commercial uses of the work are permitted
without any further permission from Dove Medical Press Limited, provided the work is properly
attributed. For permission for commercial use of this work, please see paragraphs 4.2 and 5 of our Terms.
© 2020 The Author(s). This work is published and licensed by Dove Medical Press Limited. The
full terms of this license are available at https://www.dovepress.com/terms
and incorporate the Creative Commons Attribution
- Non Commercial (unported, 3.0) License.
By accessing the work you hereby accept the Terms. Non-commercial uses of the work are permitted
without any further permission from Dove Medical Press Limited, provided the work is properly
attributed. For permission for commercial use of this work, please see paragraphs 4.2 and 5 of our Terms.