Back to Journals » Neuropsychiatric Disease and Treatment » Volume 11
The ability of early changes in motivation to predict later antidepressant treatment response
Authors Gorwood P, Vaiva G, Corruble E, Llorca P ![]() , Baylé F, Courtet P
, Baylé F, Courtet P ![]() , Gauthier I
, Gauthier I ![]()
Received 21 July 2015
Accepted for publication 25 September 2015
Published 11 November 2015 Volume 2015:11 Pages 2875—2882
DOI https://doi.org/10.2147/NDT.S92795
Checked for plagiarism Yes
Review by Single anonymous peer review
Peer reviewer comments 3
Editor who approved publication: Dr Roger Pinder
Philip Gorwood,1,2 Guillaume Vaiva,3 Emmanuelle Corruble,4 Pierre-Michel Llorca,5 Franck J Baylé,1,2 Philippe Courtet6
1Centre Hospitalier Sainte-Anne (CMME), Paris, France; 2Centre of Psychiatry and Neuroscience, INSERM U894, University Paris-Descartes, Paris, France; 3Pôle de Psychiatrie, CHRU de Lille, Hôpital Michel-Fontan, Université Lille-Nord de France, Lille, France; 4Psychiatry Department of Bicêtre, University Hospital, INSERM U669, Paris XI University, Le Kremlin Bicêtre, France; 5CHU Clermont-Ferrand, Clermont Université, Université d’Auvergne, Clermont-Ferrand, France; 6Department of Emergency Psychiatry, CHU Montpellier, Montpellier, France
Introduction: Baseline values and early changes of emotional reactivity, cognitive speed, psychomotor function, motivation, and sensory perception have not been studied to any extent in unipolar depression, although they could help to characterize different dimensions of illness that are harder to capture by clinicians, give new insights on how patients improve, and offer new early clinical markers for later treatment response.
Methods: About 1,565 adult outpatients with major depressive disorder receiving agomelatine completed the clinician-rated 16-item quick inventory of depressive symptoms, Clinical Global Impression, and Multidimensional Assessment of Thymic States (MAThyS) rating scales at inclusion, Week 2 and Week 6. The MAThyS includes a 20-item self-rated visual analog scale (from inhibition [0] to activation [10], with [5] representing the usual state) leading to five a priori dimensions (emotional reactivity, cognitive speed, psychomotor function, motivation, and sensory perception).
Results: All MAThyS dimension scores increased from inclusion to Week 2 and from inclusion to Week 6 (P<0.001). Improvement was around 2 points (out of 10) for motivation, 1.5 points for psychomotor function, and 0.5 points for other dimensions. Motivation showed a trend to being more severely impaired at inclusion in future nonresponders (t=1.25, df=1,563, P=0.10). Its improvement at Week 2 was the most discriminating MAThyS dimension between future responders and nonresponders, and represents the best predictor of future response, with the highest area under the receptor operating characteristic curve (area under curve =0.616, 95% confidence interval [0.588–0.643], P<0.001). Finally, improvements in motivation correlated the most strongly with clinician-rated 16-item quick inventory of depressive symptoms improvement (r=-0.491, df=1,563, P<0.001).
Conclusion: Motivation had the most capacity for early improvement, the best predictive value for response, and the largest global margin of progress in depressed outpatients. Assessing the evolution of self-reported motivation over time in major depressive disorder could offer an interesting complementary approach to predict response.
Keywords: depression, agomelatine, dimension, motivation, treatment response
Introduction
Major depressive disorder (MDD) is a complex mental disorder, which presents with disturbances to many psychological functions other than mood, including vigilance, drive and motivation, self-esteem, concentration, and psychomotor function. Several of these different facets of MDD are captured in the Diagnostic and Statistical Manual of Mental Disorders (DSM-5) diagnostic criteria for the disorder.1 Numerous behavioral and psychophysiological studies have provided evidence that depression is associated with motivation-related deficits. These are manifested by decreased responsivity to positive or rewarding stimuli and reduced approach-related behaviors.2,3 Recent functional imaging studies have also indicated that depression is associated with reduced activity in the mesolimbic brain structures involved in motivation-related behaviors.4,5 Taken together, such findings suggest that loss of motivational drive is frequent in patients with MDD and may be related to the anhedonia that is commonly observed in these patients.2
Antidepressant medication has been demonstrated to improve depressive symptoms in patients presenting with a major depressive episode (MDE), and these symptoms are generally the focus of the large Phase III randomized clinical trials performed in order to demonstrate the efficacy of these drugs. Nonetheless, it is recognized that it is also important to consider other functional domains when evaluating treatment of MDD. Indeed, treatment effects on facets of the MDE other than depressive symptoms may vary between different classes of antidepressant drugs. For example, there is some evidence that mixed serotonin–noradrenaline reuptake inhibitors may improve psychomotor retardation more than selective serotonin reuptake inhibitors.6–8 Another study has suggested that agomelatine may have a more beneficial effect on anhedonia than venlafaxine.9
With regard to motivation, few data are available on the effects of antidepressants. The Multidimensional Assessment of Thymic States (MAThyS) scale is a useful patient-reported outcome measure with which to assess motivation in patients with depression in the clinical setting. The MAThyS scale was developed and validated to define mood states dimensionally.10,11 It was originally designed to assess levels of activation or inhibition in different mood states in bipolar disorder with a single tool and to determine whether a clinical description in terms of activation/inhibition can improve definition of mixed bipolar states associating both manic and depressive symptoms.10 This scale provides a measure of the degree of inhibition or activation on five a priori dimensions representing cognitive speed, motivation, emotional reactivity, psychomotor function, and sensory perception. This scale has been used in a range of mood states, essentially in patients with bipolar disorder.10–17 To date, the MAThyS has not been studied extensively in patients with unipolar depression, although we recently detected that an early increase in positive emotions rated by the MAThyS could be more predictive of later treatment response than a decrease in negative emotions.18
We have recently performed a large prospective naturalistic study which enrolled outpatients starting treatment for an MDE with agomelatine.19 The primary objective of the study was to describe the effectiveness of agomelatine, after 6 weeks of treatment as a function of patient characteristics at baseline and previous treatment history. The MAThyS was administered as a secondary outcome measure. In this analysis, we aimed at first describing the dimension score distribution of the MAThyS rating scale in a large population of patients with a diagnosis of unipolar depression and then assessing the relationship between MAThyS dimension scores over the course of the study and antidepressant treatment response.
Methods
This was a multicentre, observational Phase IV study of the effectiveness and tolerability of agomelatine conducted in a naturalistic treatment setting in 819 hospital and community psychiatry centers in France between April 2009 and April 2010. The study design and methods have been presented in detail elsewhere.19
Patients
The study included adult outpatients with a diagnosis of MDD who fulfilled DSM-IV diagnostic criteria for an MDE.20 The MDE was required to be moderate to severe and had to require the initiation or a change of antidepressant treatment. All patients received agomelatine (25–50 mg) once daily at bedtime.
Treatment, follow up, and data collection
Patients were evaluated at an inclusion visit (Week 0), when eligibility criteria were verified, data on demographic and clinical variables at baseline documented, and treatment with agomelatine 25 mg was initiated. Patients then returned for two follow-up visits at Week 2 and Week 6, when clinical response was evaluated with a number of rating scales completed by the physician and by the patient. At Week 2, the dose of agomelatine could be increased to 50 mg at the discretion of the investigator.
Outcome measures
At each study visit, depressive symptoms were rated with the clinician-rated 16-item quick inventory of depressive symptoms (QIDS-C16),21 and overall clinical status was rated with the Clinical Global Impression scale.22 Levels of activation and inhibition were assessed using MAThyS.10 Other secondary outcome measures included the Patient Global Impression – Improvement Questionnaire,22 the Sheehan Disability Scale,23 and the Leeds Sleep Evaluation Questionnaire;24 these data have been discussed previously20 and will not be presented in this article.
The MAThyS consists of a 20-item set of visual analog scales.10,11 Although the MAThyS is designed to be self-rated, it is recommended that a clinician assists in order to explain how the scoring is performed. Each item is scored on a visual analog scale from 0 to 10, with 0 representing the most “inhibited” level and 10 representing the most “excited” level. A score of 5 is considered to represent the patient’s usual mood state. The items are each assigned to one of five dimensions, representing emotional reactivity, cognitive speed, psychomotor function, motivation, and sensory perception.11,17 For each dimension score, scores on the individual constitutive items are added together and normalized on a scale of 0–10. The total score is generally represented as the sum of all the individual item scores, providing a possible range of 0–200. However, to facilitate comparison with the individual dimension scores, in the present analysis, we have normalized the total score on a scale of 0–10 by dividing by the number of items for each dimension.
Statistical analysis
The analysis was performed on a subgroup of the intent-to-treat population of the overall study19 for whom exploitable QIDS-C16 and MAThyS scores were available at baseline, Week 2, and Week 6. Missing data were not replaced. The analysis of MAThyS scores is principally descriptive, with changes in MAThyS scores between baseline and Weeks 2 and 6 being compared using analyses of variance. To compare Pearson’s correlation coefficients, all coefficients (r) were converted to the normally distributed variable z′ (z′=0.5[ln(1+r)−ln(1−r)]). Using its standard error (SE =1/√(N−3), confidence intervals were computed, with the endpoints being then converted back to r (r=(exp(2×z′)−1)/(exp(2×z′)+1).
The ability of MAThyS dimension scores to predict clinical response at Week 6, defined as a reduction in the QIDS-C16 score compared to baseline of at least 50%, was evaluated through construction of receiver operating characteristic (ROC) curves. Internal consistency of the MAThyS scale was evaluated using Cronbach’s α-coefficient.18 All data analyses were performed using IBM SPSS Statistics for Macintosh, Version 22.0 (IBM Corp, Armonk, NY, USA).
Ethics
The study was performed according to international and French regulatory guidelines and current codes of Good Clinical Practice. Each patient was informed about the aims and procedures of the study and provided written, informed consent. The study protocol was submitted to and approved by local independent ethics committees (C.P.P. Sud-Est 6 of Clermont-Ferrand and Comité Consultatif en Matière de Recherche Biomédicale of Monaco) and A.F.S.Sa.P.S. (French Health Authority). With respect to confidentiality of patient records, data handling for the study was authorized by the Commission Nationale d’Informatique et de Libertés, the French agency which ensures that all medical information is kept confidential and anonymous.
Results
Patients
From the initial sample of 2,351 patients, the QIDS-C16 and the MAThyS scores were available at each study assessment for 1,565 subjects (66.6% of the sample). These constituted the analysis population for this study. Given the relatively high numbers of patients for whom complete data was unavailable, the baseline characteristics of analysis population were compared with those of the patients evaluated in the primary analysis of the study (Table 1). The two populations were not significantly different (P>0.10), with a marginally shorter disease duration, younger age, and lower number of women in the MAThyS analysis population.
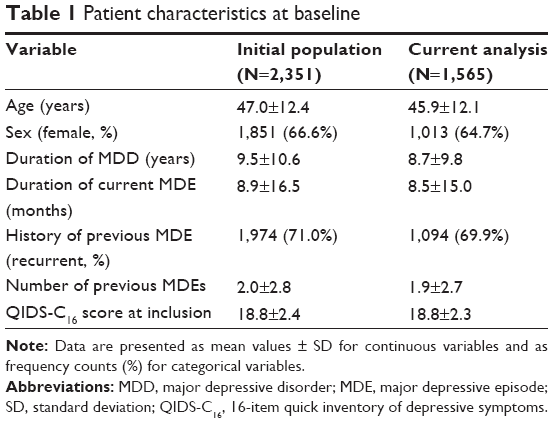 | Table 1 Patient characteristics at baseline |
Outcome
Over the course of the study, depressive symptoms as measured with the QIDS-C16 scale improved significantly (t=66.1, df=3,128, P<0.001), and mean symptom scores decreased by around 50% between baseline and Week 6 (Table 2). The proportion of responders at Week 6 was 58.0%. These observations were comparable (P>0.10) to those observed in the total intent-to-treat population. Over the same period, mean MAThyS scores increased from 4.05 to 4.87 (t=20.2, df=3,128, P<0.001).
 | Table 2 Evolution of QIDS-C16 and MAThyS scores over the course of the study |
At baseline, the mean MAThyS dimension scale scores were lower than the neutral value of 5 for motivation and psychomotor retardation. The evolution of individual MAThyS dimension scales is presented in Figure 1. All dimensions of the scale improved significantly (P<0.001) from inclusion to Week 2 and from inclusion to Week 6 (P<0.001). The two dimension scores that changed the most over the course of the study were motivation and psychomotor function. The other three dimension scores, whose baseline values were close to the neutral value of 5, changed to a lesser degree. The internal consistency of the dimension scores of the MAThyS was acceptable, with a Cronbach’s α coefficient of 0.69.
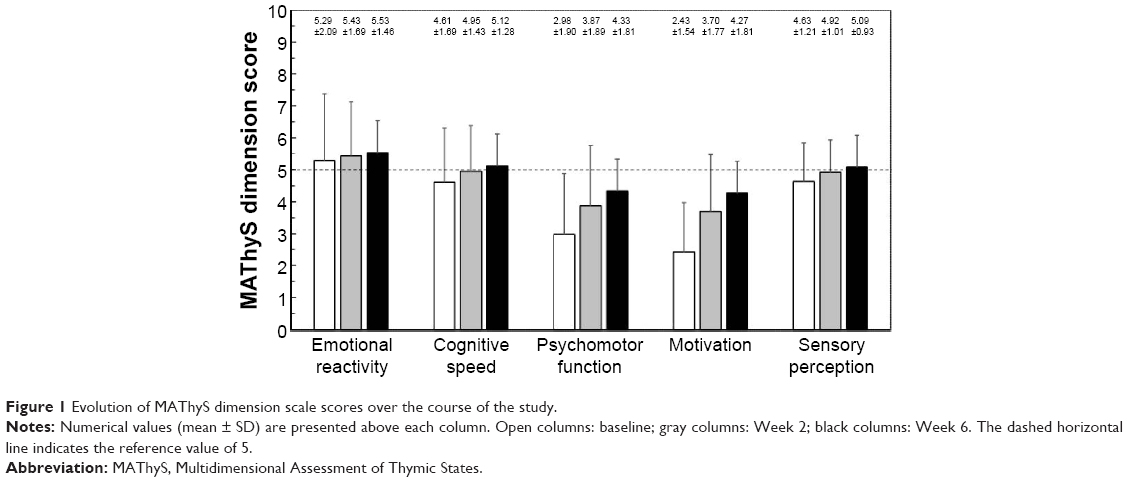 | Figure 1 Evolution of MAThyS dimension scale scores over the course of the study. |
Relationship between MAThyS and QIDS-C16 scores
For all MAThyS dimension scores, the extent of improvement between baseline and Week 6 was positively correlated with the improvement in depressive symptoms measured with the QIDS-C16 over the same period. The strongest correlation was observed for the motivation dimension of the MAThyS compared to all other dimensions (Table 3). When the baseline value of the QIDS-C16 was controlled for in a partial correlation analysis, the correlation between QIDS-C16 and MAThyS changes was still larger for motivation, once again with no overlap with other correlation coefficients (Table 3).
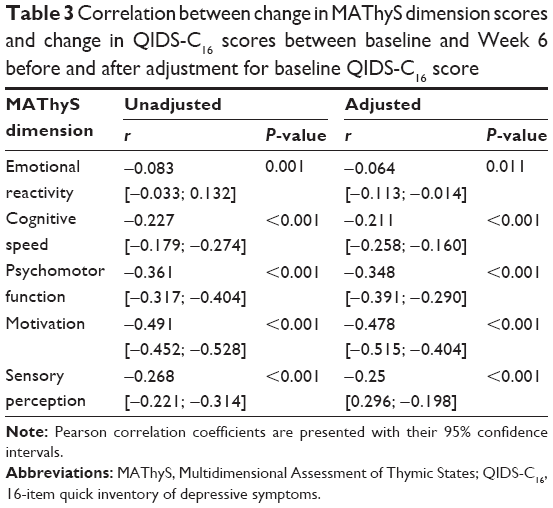 | Table 3 Correlation between change in MAThyS dimension scores and change in QIDS-C16 scores between baseline and Week 6 before and after adjustment for baseline QIDS-C16 score |
In the next step, we evaluated the capacity of the change in MAThyS motivation score between baseline and Week 2 to predict treatment response (reduction from baseline in QIDS-C16 score ≥50%) at Week 6 using ROC analysis. The ROC curve is illustrated in Figure 2. The area under the ROC curve was the highest for the change in motivation score at Week 2 (Figure 2 and Table 4). The latter also performed well as a predictor of clinical remission at Week 6, defined as a QIDS-C16 score <6 (area under the curve: 0.623; [95% confidence interval: 0.591–0.655]; P=0.016) and functional remission at Week 6, defined as a Sheehan Disability Scale score ≤2 (area under the curve: 0.606 [95% confidence interval: 0.567–0.644]; P=0.020) (Table 4). Finally, motivation showed a trend to being more severely impaired at inclusion in future QIDS-C16 nonresponders (t=1.25, df=1,563, P=0.10).
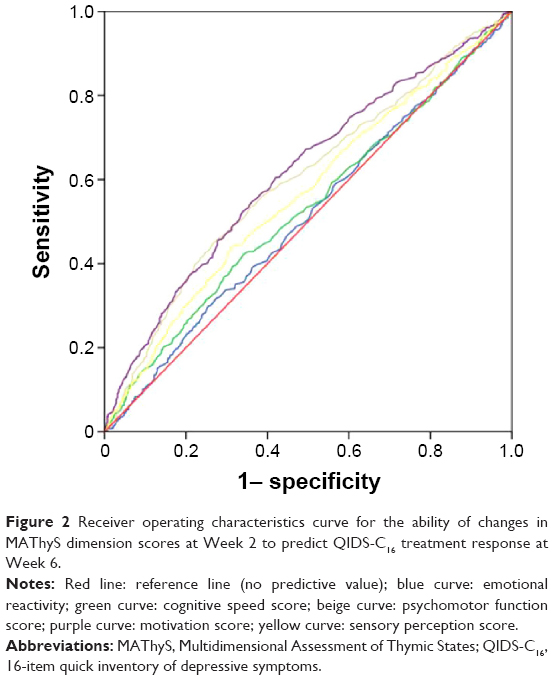 | Figure 2 Receiver operating characteristics curve for the ability of changes in MAThyS dimension scores at Week 2 to predict QIDS-C16 treatment response at Week 6. |
 | Table 4 Ability of changes in MAThyS dimension scores at Week 2 to predict QIDS-C16 clinical response, QIDS-C16 clinical remission, and SDS functional remission at Week 6 |
Discussion
The goal of this analysis was to evaluate facets of MDE other than depressive symptoms using the MAThyS scale, and in particular, the motivation dimension. To the best of our knowledge, this study has provided the first opportunity to assess the performance of the MAThyS dimensions in measuring impairment in a large population of patients with a diagnosis of MDD who experience an active MDE. The mean total normalized MAThyS score in our patients was 4.05, corresponding to a crude score of 81.0. The motivation dimension score (mean: 2.36) was the lowest individual dimension score at baseline, indicating a high degree of impairment on this dimension of depression. Significant inhibition was also observed for the psychomotor retardation dimension.
The finding that motivation is the most impaired dimension of the MAThyS scale is significant, since many studies have suggested depression to be related to motivation-related impairments.25 In particular, patients with depression appear to be less responsive to rewarding stimuli but more responsive to negative cues and punishment.26 In this context, it has been suggested by Kringelbach and Berridge27 that anhedonia, which is considered a cardinal symptom of MDD, may be secondary to motivational deficits, and a number of studies have indicated that anhedonia is specifically associated with decreased willingness to expend effort for rewards.28–30 Motivation is one of the functional domains of mental health that have been highlighted for further research in the Research Domain Criteria of the National Institute of Mental Health,31 and it is anticipated that this will lead to a better understanding of the relationship between motivational deficits and mood disorders.
Our findings can be compared with data obtained with the MAThyS scale in patients with bipolar disorder experiencing an MDE. Two such samples have been described previously. The mean total score was 54.4 in the first sample10,11 and 75.3 in the second.12 There are several possible explanations for the apparently lower scores in the bipolar patients. One such explanation is that the bipolar patients in the first sample may have been more severely ill, since they were recruited exclusively in a hospital department offering tertiary care for patients with bipolar disorder, whereas in our study, the patients were recruited from a mix of community care and hospital psychiatry centers. Alternatively, the difference may relate to the way the items are scored in the MAThyS on a visual analog scale between two extremes, for example, Item 17 “I am making decisions faster than usual”/“I am finding it harder than usual to make decisions”. This may permit differences in the frame of reference between different patient groups with respect, in this example, to what the patients consider as “usual”.
With respect to the individual dimension scores, our observations in patients with unipolar depression are also to some extent consistent with what has been reported in patients with bipolar depression.11 Notably, the motivation and psychomotor dimensions were the most impaired in both patient groups. However, in bipolar depression, marked impairment was also observed for the cognitive speed, emotional reactivity, and sensory perception dimensions, which was not the case in our sample. Again, this may reflect a difference in the frame of reference, with bipolar patients experiencing a wider range of, for example, perceptions of intensity of emotions or speed of thought processing compared to unipolar patients.
Over the course of the study, the total MAThyS score increased toward the normative value of 5. This observation is consistent with that observed in patients with bipolar depression following initiation of treatment with an atypical antipsychotic.12 In our sample, the psychomotor function and motivation dimension scores also increased toward the normative value and were both over 4 at Week 6. The motivation dimension was the most sensitive to change, the most impaired at baseline, and had the greatest margin for improvement. The other three dimension scores, which were close to the normative value at baseline, improved by <0.5 points.
We observed an association between the increase in MAThyS motivation scores during the first 2 weeks of treatment and antidepressant response and remission measured with the QIDS-C16 at Week 6, indicating that patients who became more motivated early in the treatment course were more likely to respond. Compared to other potential predictors of response and remission evaluated in the same study,19 this association was less strong than the association between QIDS-C16 score at Week 2 and remission, but of similar size to that of mood quality rated with a visual analog scale. However, this difference is not entirely unexpected, since motivation represents a different psychological construct to mood state. An association between autonomous motivation and treatment response has been demonstrated previously in a study of interpersonal therapy for depression.32 In studies such as ours, it is not possible to address the nature of the association between motivation and treatment response. However, it may be anticipated, for example, that more motivated patients may be more adherent to their medication or may be more prone to develop more positive social interactions.33 It is possible that motivation is also associated with more rapid spontaneous recovery from depressive episodes in the absence of treatment but, again, this cannot be addressed in studies such as ours.
The findings of this study indicate that assessing motivation, for example with the MAThyS scale, may be a useful adjunct to measuring the evolution of depressive symptoms in patients starting antidepressant treatment for an MDE. In addition, our study raises the important question of whether behavioral therapies aimed at building motivation, if offered at the time antidepressant medication is initiated, may facilitate a favorable treatment outcome.
This study only evaluated patients treated with agomelatine and there was no comparator group. For this reason, it is not possible to draw any conclusions as to the specificity of this effect. Nonetheless, agomelatine does facilitate dopaminergic activity in mesolimbic and mesocortical pathways,34–36 which are believed to be involved with the regulation of motivation.37 In this context it is also relevant to note that agomelatine has also been shown to have a beneficial effect on anhedonia,9,38,39 which may also be related to hypoactivity in these same dopaminergic circuits.40,41
The study has a number of strengths and weaknesses. Among the strengths are the large number of patients included and the naturalistic treatment setting. The principal limitations of the study have been described previously19 and include those inherent to observational studies in general and the possibility of residual effects of previous antidepressant therapy. In addition, the lack of a specific diagnostic workup for the purposes of the study may have led to the inclusion of some patients with bipolar depression, since misdiagnosis of bipolar disorder as MDD is frequent.42,43 However, the absence of major departures from the usual state in the emotional reactivity dimension of the MAThyS may argue against this. Finally, there was no active or placebo comparator group in the study, so the specificity of the association between motivation and antidepressant response cannot be addressed.
In conclusion, this study demonstrates the ability of the MAThyS scale to assess impairment in patients experiencing an MDE. Notably, motivation was the dimension the most impaired in depressed patients, but was also the dimension that responded best to treatment and showed the best predictive value for antidepressant treatment response. Assessing self-reported motivation in addition to depressive symptoms in MDD could offer an interesting approach to monitoring response.
Disclosure
This study was supported by a research grant from Euthérapie, Paris, France. The present analyses and the preparation of the manuscript were performed by the authors independently of the sponsor. These results have been presented in part at the European Psychiatric Association Congress 2014.
PG received research grants from Eli Lilly and Servier; honoraria for presentations in congresses from AstraZeneca, Bristol-Myers Squibb, Janssen, Lundbeck, and Servier; participated on advisory board of AstraZeneca, Janssen, Roche, and Servier; has a paid position at University of Paris-Descartes and Sainte-Anne Hospital, and no shares. FJB has received consulting fees within the last 4 years from Servier, Lundbeck, Eli Lilly, Bristol-Myers Squibb, and Janssen. GV received research grants from AstraZeneca; honoraria for presentations in congresses from AstraZeneca, Bristol-Myers Squibb, Janssen, Lundbeck, Eli Lilly, and Servier; participated on advisory board of Janssen, Lundbeck, and Servier; has a paid position at University of Lille 2 and Lille University Hospital, and no shares. PC received research grants from Eli Lilly and Servier; honoraria for presentations in congresses from AstraZeneca, Bristol-Myers Squibb, Lundbeck, and Servier; has a paid position at University of Montpellier and CHU Montpellier, and no shares. EC has received consulting fees within the last 4 years from Servier, Lundbeck, Sanofi, Bristol-Myers Squibb, and Eisai. PML has received consulting fees from AstraZeneca, Bristol-Myers Squibb, Eli Lilly, Euthérapie, Lundbeck, and Sanofi. The authors report no other conflicts of interest in this work.
References
American Psychiatric Association. Diagnostic and Statistical Manual of Mental Disorders. 5th ed. Washington, DC: American Psychiatric Association; 2013. | ||
Clery-Melin ML, Schmidt L, Lafargue G, Baup N, Fossati P, Pessiglione M. Why don’t you try harder? An investigation of effort production in major depression. PLoS One. 2011;6(8):e23178. | ||
Shankman SA, Klein DN, Tenke CE, Bruder GE. Reward sensitivity in depression: a biobehavioral study. J Abnorm Psychol. 2007;116(1):95–104. | ||
Epstein J, Pan H, Kocsis JH, et al. Lack of ventral striatal response to positive stimuli in depressed versus normal subjects. Am J Psychiatry. 2006;163(10):1784–1790. | ||
Pizzagalli DA, Holmes AJ, Dillon DG, et al. Reduced caudate and nucleus accumbens response to rewards in unmedicated individuals with major depressive disorder. Am J Psychiatry. 2009;166(6):702–710. | ||
Mallinckrodt CH, Prakash A, Houston JP, Swindle R, Detke MJ, Fava M. Differential antidepressant symptom efficacy: placebo-controlled comparisons of duloxetine and SSRIs (fluoxetine, paroxetine, escitalopram). Neuropsychobiology. 2007;56(2–3):73–85. | ||
Singh AB, Bousman CA, Ng CH, Byron K, Berk M. Psychomotor depressive symptoms may differentially respond to venlafaxine. Int Clin Psychopharmacol. 2013;28(3):121–126. | ||
Sechter D, Vandel P, Weiller E, Pezous N, Cabanac F, Tournoux A. A comparative study of milnacipran and paroxetine in outpatients with major depression. J Affect Disord. 2004;83(2–3):233–236. | ||
Martinotti G, Sepede G, Gambi F, et al. Agomelatine versus venlafaxine XR in the treatment of anhedonia in major depressive disorder: a pilot study. J Clin Psychopharmacol. 2012;32(4):487–491. | ||
Henry C, M’Bailara K, Mathieu F, Poinsot R, Falissard B. Construction and validation of a dimensional scale exploring mood disorders: MAThyS (Multidimensional Assessment of Thymic States). BMC Psychiatry. 2008;8:82. | ||
Henry C, M’Bailara K, Poinsot R, Falissard B. [Construction and validation of a dimensional scale for mood disorders: multidimensional assessment of thymic states (MAThyS)]. Encephale. 2007;33(5):768–774. French. | ||
Henry C, Luquiens A, Lancon C, et al. Inhibition/activation in bipolar disorder: validation of the Multidimensional Assessment of Thymic States scale (MAThyS). BMC Psychiatry. 2013;13:79. | ||
Atzeni T, Henry C, Minois I, et al. From inhibition to activation, from emotional hyporeactivity to emotional hyperreactivity: two pathways to discriminate mood in bipolar disorders. Psychiatry Res. 2013;209(1):50–54. | ||
M’Bailara K, Cosnefroy O, Vieta E, Scott J, Henry C. Group-based trajectory modeling: a novel approach to examining symptom trajectories in acute bipolar episodes. J Affect Disord. 2013;145(1): 36–41. | ||
Henry C, M’Bailara K, Lepine JP, Lajnef M, Leboyer M. Defining bipolar mood states with quantitative measurement of inhibition/activation and emotional reactivity. J Affect Disord. 2010;127(1–3): 300–304. | ||
Henry C, Etain B. New ways to classify bipolar disorders: going from categorical groups to symptom clusters or dimensions. Curr Psychiatry Rep. 2010;12(6):505–511. | ||
Henry C, M’Bailara K, Desage A, Gard S, Misdrahi D, Vieta E. Towards a reconceptualization of mixed states, based on an emotional-reactivity dimensional model. J Affect Disord. 2007;101(1–3):35–41. | ||
Cronbach LJ. Coefficient alpha and the internal structure of tests. Psychometrika. 1951;16(3):297–334. | ||
Gorwood P, Bayle F, Vaiva G, Courtet P, Corruble E, Llorca PM. Is it worth assessing progress as early as week 2 to adapt antidepressive treatment strategy? Results from a study on agomelatine and a global meta-analysis. Eur Psychiatry. 2013;28(6):362–371. | ||
American Psychiatric Association. Diagnostic and Statistical Manual of Mental Disorders. 4th ed., text revision. Washington, DC: American Psychiatric Association; 2000. | ||
Rush AJ, Trivedi MH, Ibrahim HM, et al. The 16-item quick inventory of depressive symptomatology (QIDS), clinician rating (QIDS-C), and self-report (QIDS-SR): a psychometric evaluation in patients with chronic major depression. Biol Psychiatry. 2003;54(5):573–583. | ||
National Institute of Mental Health. CGI, Clinical global impression. In: Guy W, editor. ECDEU Assessment Manual of Psychopharmacology Review. Rockville, MD: NIMH; 1976:217–222. | ||
Sheehan DV, Harnett-Sheehan K, Raj BA. The measurement of disability. Int Clin Psychopharmacol. 1996;11 Suppl 3:89–95. | ||
Parrott AC, Hindmarch I. The Leeds Sleep Evaluation Questionnaire in psychopharmacological investigations – a review. Psychopharmacology (Berl). 1980;71(2):173–179. | ||
Crocker LD, Heller W, Warren SL, O’Hare AJ, Infantolino ZP, Miller GA. Relationships among cognition, emotion, and motivation: implications for intervention and neuroplasticity in psychopathology. Front Hum Neurosci. 2013;7:261. | ||
Pizzagalli DA. Frontocingulate dysfunction in depression: toward biomarkers of treatment response. Neuropsychopharmacology. 2011;36(1):183–206. | ||
Kringelbach ML, Berridge KC. Towards a functional neuroanatomy of pleasure and happiness. Trends Cogn Sci. 2009;13(11):479–487. | ||
Treadway MT, Buckholtz JW, Schwartzman AN, Lambert WE, Zald DH. Worth the ‘EEfRT’? The effort expenditure for rewards task as an objective measure of motivation and anhedonia. PLoS One. 2009;4(8):e6598. | ||
Treadway MT, Bossaller NA, Shelton RC, Zald DH. Effort-based decision-making in major depressive disorder: a translational model of motivational anhedonia. J Abnorm Psychol. 2012;121(3):553–558. | ||
Yang XH, Huang J, Zhu CY, et al. Motivational deficits in effort-based decision making in individuals with subsyndromal depression, first-episode and remitted depression patients. Psychiatry Res. 2014;220(3):874–882. | ||
Cuthbert BN. Research domain criteria: toward future psychiatric nosologies. Dialogues Clin Neurosci. 2015;17(1):89–97. | ||
McBride C, Zuroff DC, Ravitz P, et al. Autonomous and controlled motivation and interpersonal therapy for depression: moderating role of recurrent depression. Br J Clin Psychol. 2010;49(Pt 4):529–545. | ||
Young SN, Moskowitz DS, aan het Rot M. Possible role of more positive social behaviour in the clinical effect of antidepressant drugs. J Psychiatry Neurosci. 2014;39(1):60–65. | ||
Guardiola-Lemaitre B, De Bodinat C, Delagrange P, Millan MJ, Munoz C, Mocaer E. Agomelatine: mechanism of action and pharmacological profile in relation to antidepressant properties. Br J Pharmacol. 2014;171(15):3604–3619. | ||
Chenu F, El Mansari M, Blier P. Electrophysiological effects of repeated administration of agomelatine on the dopamine, norepinephrine, and serotonin systems in the rat brain. Neuropsychopharmacology. 2013;38(2):275–284. | ||
Millan MJ, Gobert A, Lejeune F, et al. The novel melatonin agonist agomelatine (S20098) is an antagonist at 5-hydroxytryptamine2C receptors, blockade of which enhances the activity of frontocortical dopaminergic and adrenergic pathways. J Pharmacol Exp Ther. 2003;306(3):954–964. | ||
Wise RA. Forebrain substrates of reward and motivation. J Comp Neurol. 2005;493(1):115–121. | ||
Di Giannantonio M, Di Iorio G, Guglielmo R, et al. Major depressive disorder, anhedonia and agomelatine: an open-label study. J Biol Regul Homeost Agents. 2011;25(1):109–114. | ||
Llorca PM, Gourion D. Course of anhedonia and depressive symptoms in a population of depressed outpatients treated with agomelatine. Eur Neuropsychopharmacol. 2014;24(Suppl 2):S468. | ||
Eshel N, Roiser JP. Reward and punishment processing in depression. Biol Psychiatry. 2010;68(2):118–124. | ||
Pizzagalli DA. Depression, stress, and anhedonia: toward a synthesis and integrated model. Annu Rev Clin Psychol. 2014;10:393–423. | ||
Bowden CL. Diagnosis, treatment, and recovery maintenance in bipolar depression. J Clin Psychiatry. 2010;71(1):e01. | ||
Angst J. Do many patients with depression suffer from bipolar disorder? Can J Psychiatry. 2006;51(1):3–5. |
 © 2015 The Author(s). This work is published and licensed by Dove Medical Press Limited. The
full terms of this license are available at https://www.dovepress.com/terms
and incorporate the Creative Commons Attribution
- Non Commercial (unported, 3.0) License.
By accessing the work you hereby accept the Terms. Non-commercial uses of the work are permitted
without any further permission from Dove Medical Press Limited, provided the work is properly
attributed. For permission for commercial use of this work, please see paragraphs 4.2 and 5 of our Terms.
© 2015 The Author(s). This work is published and licensed by Dove Medical Press Limited. The
full terms of this license are available at https://www.dovepress.com/terms
and incorporate the Creative Commons Attribution
- Non Commercial (unported, 3.0) License.
By accessing the work you hereby accept the Terms. Non-commercial uses of the work are permitted
without any further permission from Dove Medical Press Limited, provided the work is properly
attributed. For permission for commercial use of this work, please see paragraphs 4.2 and 5 of our Terms.