")
Back to Journals » Diabetes, Metabolic Syndrome and Obesity » Volume 17
TG: A Mediator of the Relationship of Serum Uric Acid to Creatinine Ratio and Nonalcoholic Fatty Liver Disease in Non-Obese Patients with Type 2 Diabetes
Authors Wang Q , Liu K, Zhang T, Wang T, Li H, Wang C , Chen J , Ren L
Received 26 November 2023
Accepted for publication 19 February 2024
Published 27 February 2024 Volume 2024:17 Pages 913—923
DOI https://doi.org/10.2147/DMSO.S451852
Checked for plagiarism Yes
Review by Single anonymous peer review
Peer reviewer comments 2
Editor who approved publication: Prof. Dr. Juei-Tang Cheng
Qing Wang,1 Ke Liu,1 Tian Zhang,1 Ting Wang,2 Huan Li,1 Chang Wang,1 Jinhu Chen,1 Luping Ren1
1Department of Endocrinology, Hebei General Hospital, Shijiazhuang, Hebei, People’s Republic of China; 2Department of Clinical laboratory, Nanjing Medical College, Nanjing, Jiangsu, People’s Republic of China
Correspondence: Luping Ren, Email [email protected]
Background: The study estimated the association between NAFLD and SUA/Cr in Chinese non-obese patients with type 2 diabetes mellitus (T2DM) and also investigated mediating effect of TG.
Methods: All patients were divided into NAFLD group (n = 420) and non-NAFLD group (n = 347). The differences of biochemical indicators between the two groups were compared. The link between SUA/Cr and other parameters was checked through Spearman correlation analysis. Differences in the incidence rate of NAFLD between SUA/Cr and TG 3 tertile subgroups were tested by chi-squared. To explore the independent influence of SUA/Cr and TG on NAFLD, logistic regression was performed. The predictive value of SUA/Cr and SUA/Cr combined with BMI for NAFLD was analyzed using ROC curves. In addition, to confirm whether TG has a mediating effect on the link of SUA/Cr and NAFLD, we conducted a mediating analysis.
Results: NAFLD group had higher SUA/Cr values than individuals without NAFLD (P < 0.01). SUA/Cr was linked with TC and TG (r = 0.081, 0.215 respectively). NAFLD prevalence increased progressively from quartile 1 to quartile 3 of SUA/Cr (44% vs 57% vs 62%). Prevalence of NAFLD increased from quartile 1 to quartile 3 of TG (35.8% vs 58.7% vs 69.9%). Analysis of the logistic regression revealed that SUA/Cr and TG were statistically linked with NAFLD. The ROC curve pointed out that the area under the curve (AUC), sensitivity and specificity of SUA/Cr were 0.59, 0.629 and 0.522, respectively. The AUC, sensitivity and specificity for SUA/Cr combined with BMI were 0.719, 0.644 and 0.677, separately. The mediation analysis showed a statistically direct effect of SUA/Cr on NAFLD (β=0.148, 95% CI: 0.0393, 0.2585). The function of SUA/Cr on NAFLD partially mediated by TG (β=0.1571, 95% CI: 0.0704, 0.2869).
Conclusion: SUA/Cr was significantly associated with NAFLD in non-obese T2DM patients, and TG partially mediated this association. SUA/Cr can be applied to predict for NAFLD.
Keywords: nonalcoholic fatty liver disease, type 2 diabetes mellitus, serum uric acid to creatinine ratio
Introduction
Non-alcoholic fatty liver disease (NAFLD) is a series of diseases in which steatosis of at least 5% of hepatocytes in the liver has been confirmed by or histologic examination or imaging, while steatohepatic liver injury due to known damaging factors, such as excessive alcohol consumption, viral infections, or drugs, is excluded.1 NAFLD can progress from the early stages of liver steatosis to liver failure, liver cirrhosis and even hepatoma. In addition to hepatic manifestations, NAFLD raises a range of extrahepatic diseases. NAFLD has been reported to be linked to adverse cardiovascular events,2 extrahepatic tumors,3 chronic kidney disease,4 etc. NAFLD and T2DM, as common metabolic disorders, tend to go hand in hand. NAFLD seems to be more common in diabetes patients. A meta-analysis suggests that the NAFLD incidence rate is up to 65% among T2DM patients worldwide.5 With diabetes and obesity prevalence on the upswing, the incidence of NAFLD is anticipated to continue to increase. The bidirectional link between NAFLD and T2DM was commendably confirmed in prior studies. NAFLD is an independent risk factor in T2DM,6 while the prevalence of T2DM progressing to NAFLD is significantly higher compared to the general population, with approximately 50% or more T2DM combined with NAFLD.5 Worryingly, patients with NAFLD combined with T2DM have a significantly higher incidence of diabetic microvascular diseases such as diabetic peripheral neuropathy or diabetic nephropathy.7 Given the high incidence rate of NAFLD and the multiple adverse outcomes associated with it, the early discovery of NAFLD in T2DM patients is of particular importance.
In prior researches, serum uric acid (SUA) showed a strong connection with metabolic syndrome,8,9 and NAFLD has also been revealed to be linked with SUA as hepatic phenotype of metabolic syndrome.10 Creatinine (Cr) is an index of renal function. Recent cross-sectional research revealed that Cr was associated with NAFLD even if Cr was in the regular reference interval.11 Recently, the combination of these two metabolic indicators SUA/Cr has triggered an increasing interest, and since SUA is influenced by renal function, SUA/Cr reflects the true level of circulating SUA better than single SUA. According to previous studies, SUA/Cr is a reliable marker for metabolic syndrome,12 diabetic kidney disease,13 and cardiovascular events.14 Several prior studies have pointed out that SUA/Cr is an independent risk factor for NAFLD in the general individuals.15–19
Hepatic steatosis is triggered by dyslipidaemia; thus, it is logical to assume that dyslipidaemia causes NAFLD, which is typically characterized by high TG and low HDL. According to prior studies, high levels of TG are significantly linked with NAFLD. A research based on paediatric patients with NAFLD has shown that NAFLD is strongly linked to TG levels.20 One study of adults with NAFLD also pointed out that NAFLD was independently linked with high TG and low HDL but not with TC and LDL.21 Furthermore, SUA is associated with abnormal lipid metabolism, and some researches have pointed out a statistical link between SUA and TG in different populations,22–24 whose mechanism is unclear. Yet, studies on the link between SUA/Cr and TG are exceedingly rare.
Overweight and obesity are major perilous factors for NAFLD, and the bulk of T2DM patients are overweight or obese; the EASL guideline states that regular shift for NAFLD should be carried out in T2DM patients with co-morbid obesity.1 Some recent studies have shown a higher rate of detecting NAFLD even in normal-weight or lean T2DM patients,25 but these studies are limited. Empirical evidence suggests that liver injury may be less severe in non-obese patients than in obese patients. In clinical practice, however, non-obese NAFLD individuals have been found to have liver pathology alike to lean NAFLD individuals, and about 10% of non-obese NAFLD patients will eventually develop advanced fibrosis.26 In contrast to the Caucasian population, the majority of individuals with T2DM in Asia are standard weight or overweight. Yet the association between SUA/Cr and NAFLD in non-obese T2DM patients in Asian population has not been investigated to date. Thus, we carried out this retrospective research to discuss the association between SUA/Cr and NAFLD in non-obese T2DM patients. We also investigated the forecast performance of SUA/Cr for NAFLD and the mediating influence of TG on the link between SUA/Cr and NAFLD.
Methods and Materials
Materials
Totally 767 T2DM patients who attended the Endocrinology Department of Hebei General Hospital from January 2021 to December 2022 were included in this cross-sectional research. Inclusion criteria were as follows: 1) All T2DM patients must meet the standard of diagnosis for diabetes of the WHO in 1999; 2) BMI <28 kg/m2, on the basis of the Chinese guidelines for overweight and obesity in adults, the obesity criterion is 1) BMI ≥28 kg/m;27 (2) no significant alcohol intake; (3) no other liver diseases, including hepatitis virus and autoimmune hepatitis. Exclusion criteria: 1) comorbid severe acute complications such as diabetic ketoacidosis, hyperosmotic hyperglycemic coma infections, myocardial infarction, cardiac ischemia, and acute renal failure; 2) comorbid outcomes of pregnancy, trauma, and other conditions; 3) those who were using any medications that can affect SUA and Cr levels such as benzbromarone. SUA >420 µmol/L in men and >360 µmol/L in women were used to define HUA. The chronic kidney disease-epidemiology (CKD-EPI) formula was used to determine the estimated glomerular filtration rate (eGFR). Fatty liver was defined as echo enhancing parenchyma with attenuation of posterior liver tissue and poor visualization of intrahepatic ductal structures on ultrasound. The research was authorized by the Medical Ethics Committee of Hebei General Hospital in adherence to the Declaration of Helsinki (NO. 2023171), and all participants were informed and signed a consent form prior to enrolment. The information collected from the recruited participants was kept confidential.
Clinical Assessment and Biochemical Measurements
Anthropometric parameters (height, weight, blood pressure (SBP (systolic blood pressure) and DBP (diastolic blood pressure))) of all participants were measured by a single physician in our hospital. A doctor carefully recorded average information about all patients, including age, sex, and pharmacy history. In addition, fasting venous blood was collected at least 8 hours after fasting and tested in the clinical laboratory. Biochemical biomarkers, including alanine aminotransferase (ALT), aspartate transferase (AST), glutamyl transpeptidase (γ-GGT), high-density lipoprotein cholesterol (HDL), fasting plasma glucose (FPG), total cholesterol (TC), TG, low-density lipoprotein cholesterol (LDL), blood urea nitrogen (BUN), serum creatinine (Cr), estimated glomerular filtration rate (eGFR), serum uric acid (SUA), glycosylated haemoglobin (HbA1C) were measured. SUA/Cr is the SUA value divided by the Cr value.
Diagnostic Criteria for NAFLD
All liver ultrasound scans were performed by 2 professional sonographers who were kept blind to the purpose of the study. The standard for assessing NAFLD was based on the following characteristics including liver and kidney contrast agents, depth attenuation, liver parenchymal brightness, and unclear display of intrahepatic blood vessels. Subjects with other liver diseases or alcoholic behavior were excluded.
Statistics
SPSS 26.0 was used for data analysis and GraphPad Prism 8.0 for graphical presentation. Numerical continuous variables followed a normal distribution with the use of the Shapiro–Wilk test, and variables are presented as mean ± standard deviation. Non-normally distribution variables were represented as median (P25, P75). Student’s t-tests were employed to analyze collisions in normally distributed variables. Non-parametric tests were used to analyze differences in non-normally distributed variables. Chi-squared test was employed to analyze differences in the occurrence of NAFLD between groups. Spearman correlation analysis was used to test the correlation between non-normally distributed variables and SUA. We used logistic regression analysis to analyze whether SUA/Cr and TG were related independently to NAFLD. ROC curves were used to test the predicting capacity of SUA/Cr and SUA/Cr combined with BMI for NAFLD.
All P values < 0.05 was supposed to have statistical differences.
Results
General Characteristics and Clinical Parameters of Non-Obese T2DM Patients
Totally, 767 non-obese T2DM patients were included in this study, and they were divided into NAFLD group (n = 420) and non-NAFLD group (n = 347) (Figure 1). Among 767 non-obese T2DM patients, with median age 59 years and median BMI was 24.68 kg/m2. The incidence of NAFLD was 54% (n = 420). Patients with NAFLD had statistically higher SBP, DBP, ALT, AST, γ-GGT, TC, TG, LDL, FPG and SUA levels than those without NAFLD. In the NAFLD group, HDL levels were significantly lower. Furthermore, SUA/Cr levels were higher among NAFLD individuals than that in non-NAFLD individuals (4.55 (3.88, 5.55) vs 4.21 (3.50,4.95) P < 0.001) (Table 1 and Figure 2).
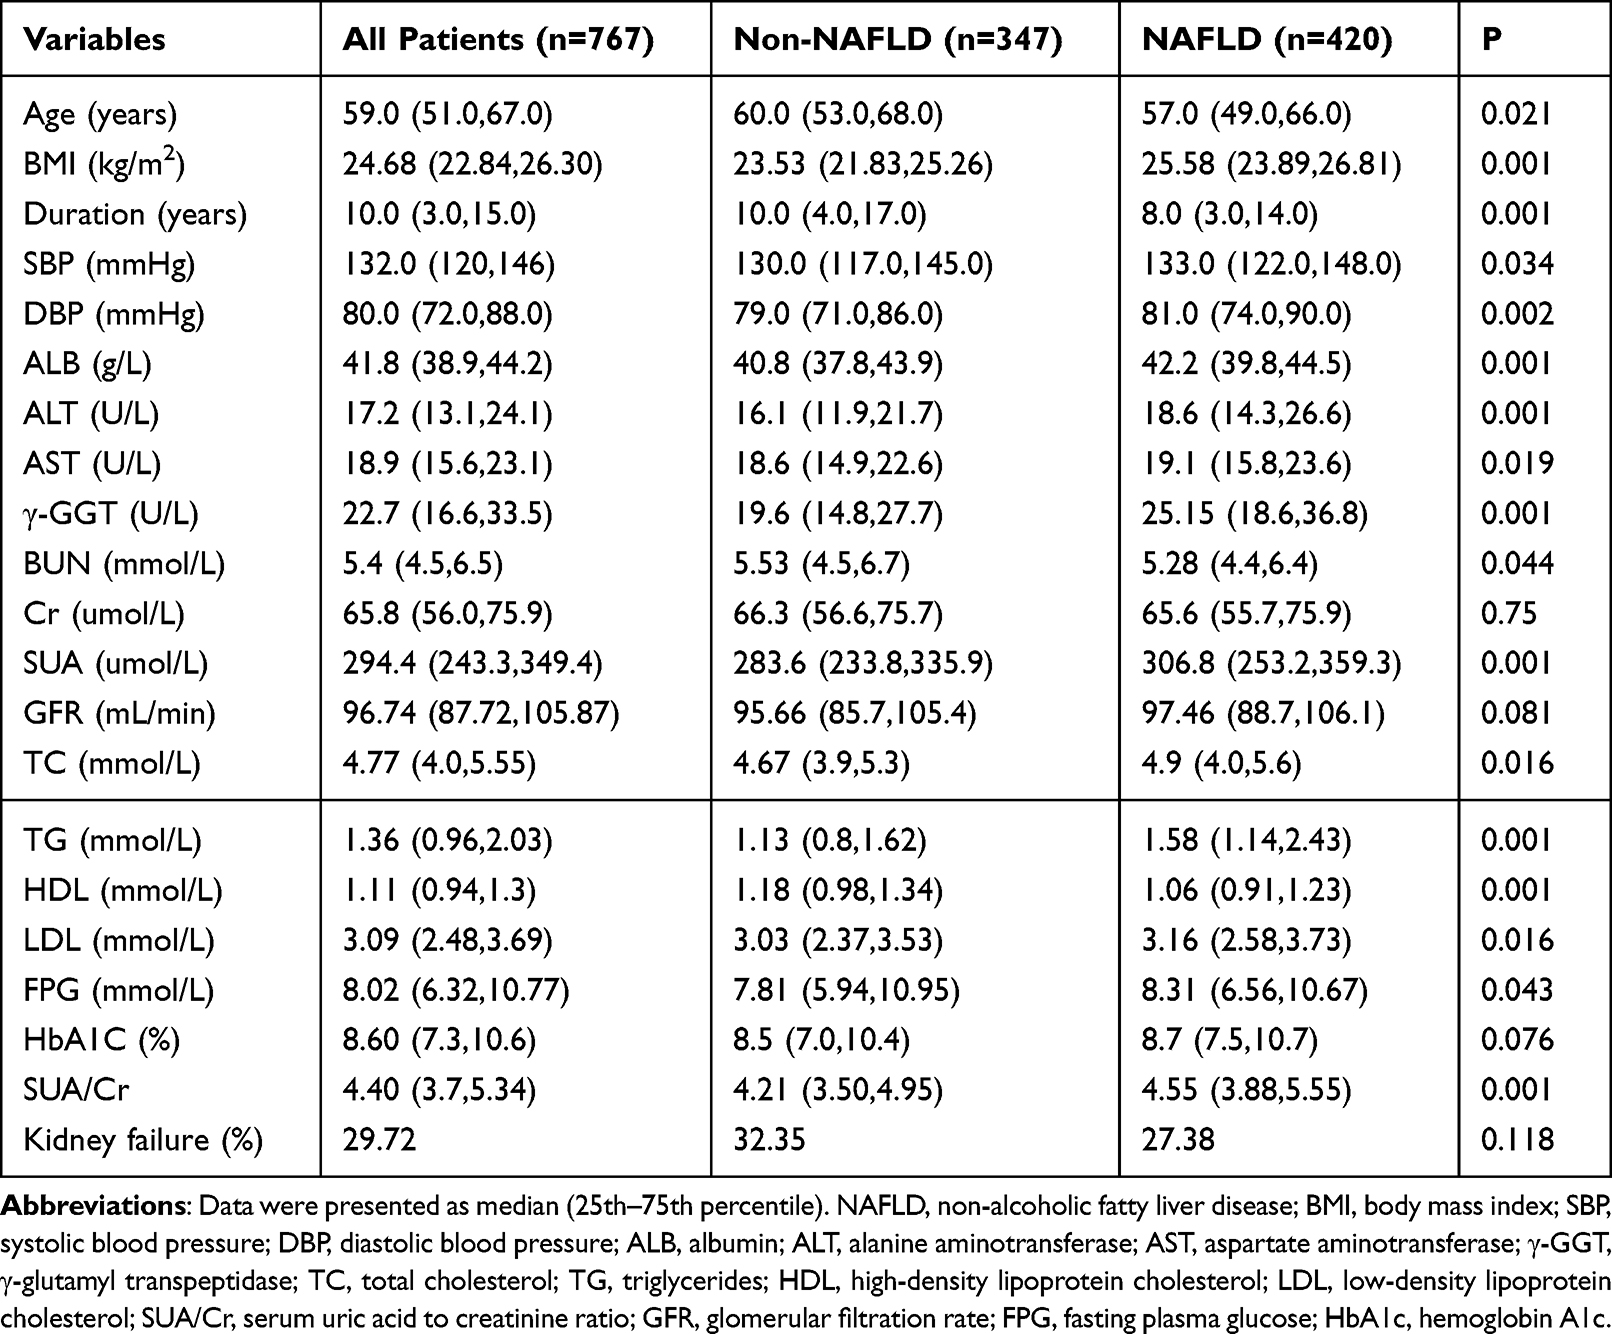 |
Table 1 Comparison of Clinical and Biochemical Parameters in NAFLD and Non-NAFLD Group |
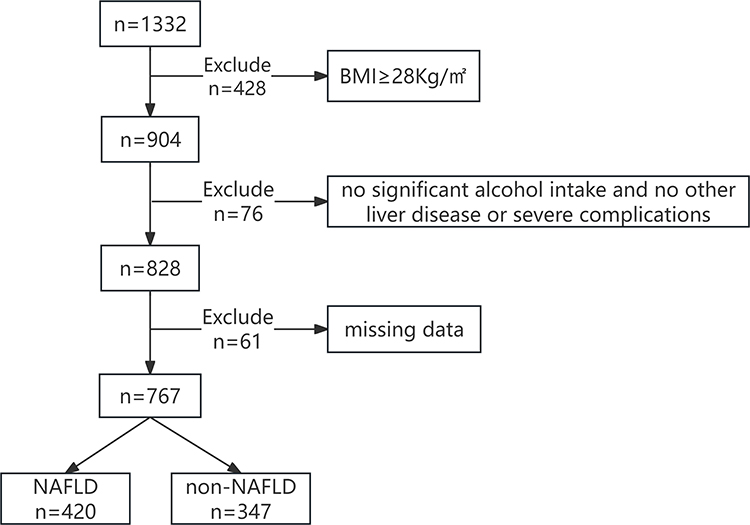 |
Figure 1 Flowchart of the patient selection process. |
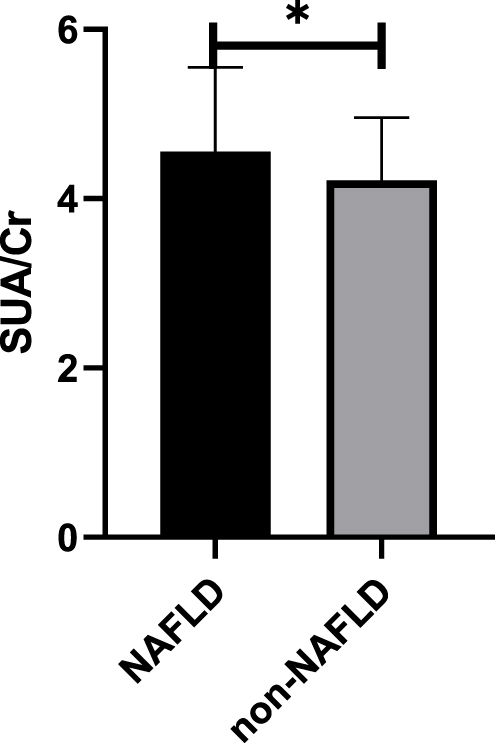 |
Figure 2 Comparison of SUA/Cr between NAFLD and non-NAFLD patients. Abbreviations: NAFLD, non-alcoholic fatty liver disease; SUA/Cr, serum uric acid to creatinine ratio. Note: *P < 0.05. |
Association of SUA/Cr with Other Clinical Arguments
As shown in Table 2, SUA/Cr had a positive link with AST (r = 0.079, P = 0.028), TC (r = 0.081, P = 0.024) and TG (0.215, P = 0.001). There was no link between SUA/Cr and BMI, SBP, DBP, ALT, GGT, HDL, LDL, FPG, HbA1C.
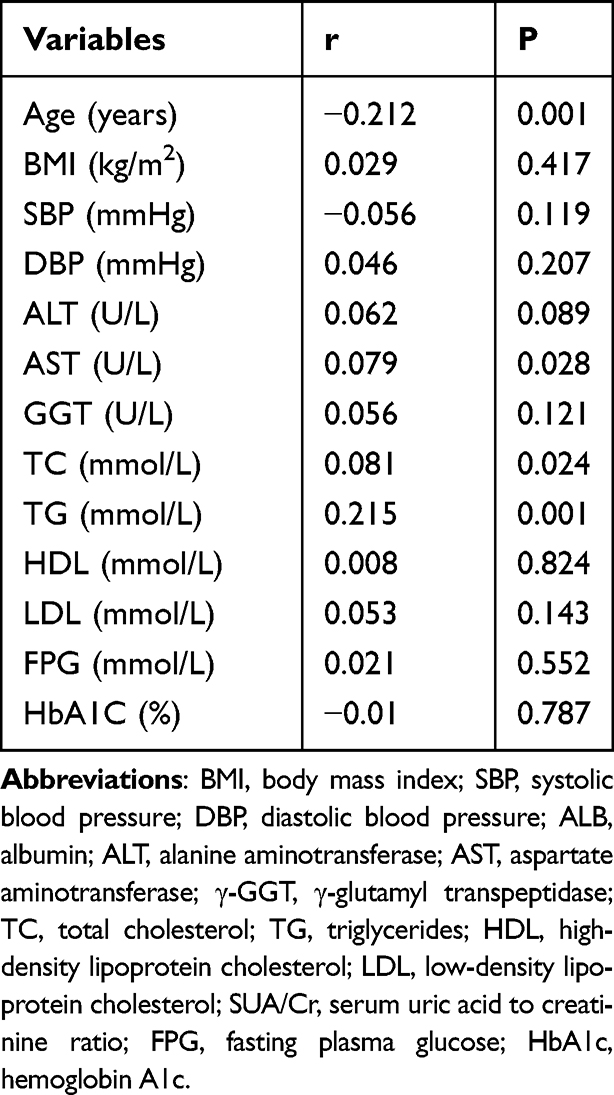 |
Table 2 Spearman Correlation of SUA/Cr with Potential Risk Factors of NAFLD |
Correlation Between SUA/Cr and the Risk of NAFLD
The incidence of NAFLD in SUA/Cr tertiles 1 was 44%, and the incidence of NAFLD raised to 57% and 62% in tertiles 2 and 3, respectively (P < 0.05) (Table 3). To test whether SUA/Cr was independent risk factors for NAFLD, we used 3 models. SUA/Cr was related to NAFLD independently in three different models. In model 1, the prevalence of NAFLD raised by 24.1% (OR = 1.241, 95% CI 1.119–1.376) for each unit increase in SUA/Cr, without adjustment for confounders. In model 2, which adjusted for the effects of age, BMI, sex, SBP and DBP, the prevalence of NAFLD raised by 21.1% (OR = 1.211, 95% CI 1.079–1. 360); Model 3 fully adjusted for ALT, AST, GGT, TC, TG, HDL, LDL, FPG, HbA1C, UA, Cr on the basis of model 2, and for each unit increase in SUA/Cr, prevalence of NAFLD raised 30.5% (OR = 1.305, 95% CI 1.050–1.623) (Table 4).
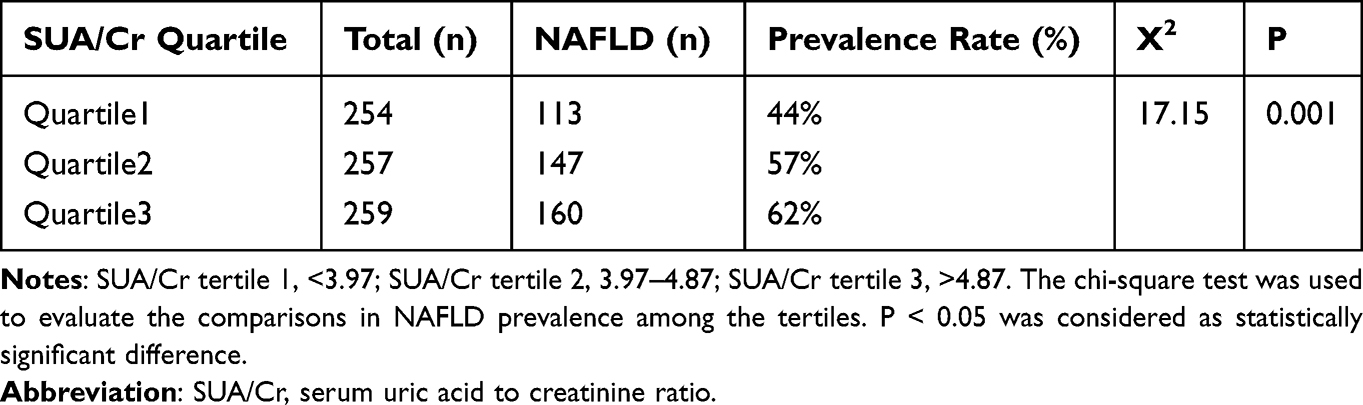 |
Table 3 Differences of the Prevalence Rate of NAFLD Among SUA/Cr Tertiles |
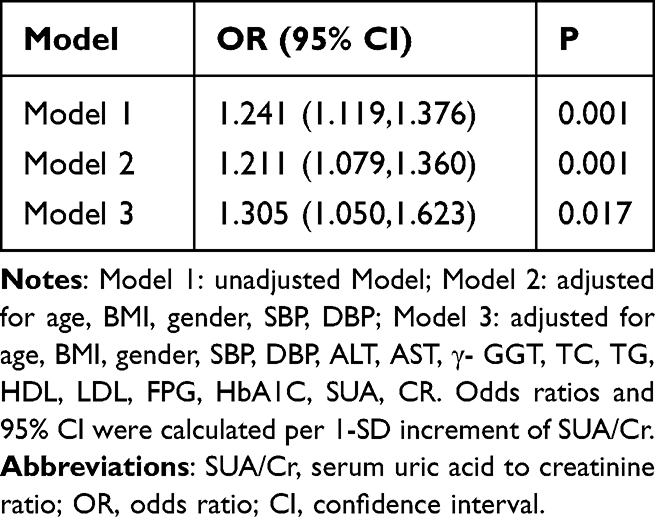 |
Table 4 Logistic Regression Analysis of SUA/Cr and NAFLD |
Correlation Between TG and the Risk of NAFLD
NAFLD incidence rate in the TG tertile 1 group was 35.8%, and the prevalence of NAFLD increased to 58.7% and 69.9% in tertile 2 and 3 groups, separately (P < 0.05) (Table 5). We used 3 models to test whether there was an independent link between TG and NAFLD. In all models, TG was independently connected to NAFLD. In model 1, which was not adjusted for confounders, each 1-unit increase in TG was linked with 83% raise in the risk of NAFLD (OR = 1.830, 95% CI 1.533–2.184); in model 2, which adjusted for the effects of age, sex, BMI, SBP and DBP, each 1-unit increase in SUA/Cr was linked with a raise in the risk of developing NAFLD of 64.5% (OR = 1.645, 95% CI 1.377–1.965); model 3 fully adjusted for ALT, AST, GGT, TC, TG, HDL, LDL, FPG, HbA1C, UA, Cr on the basis of model 2, and each 1-unit raise in SUA/Cr, with the risk of NAFLD raised by 68.9% (OR = 1.689, 95% CI 1.350–2.113) (Table 6).
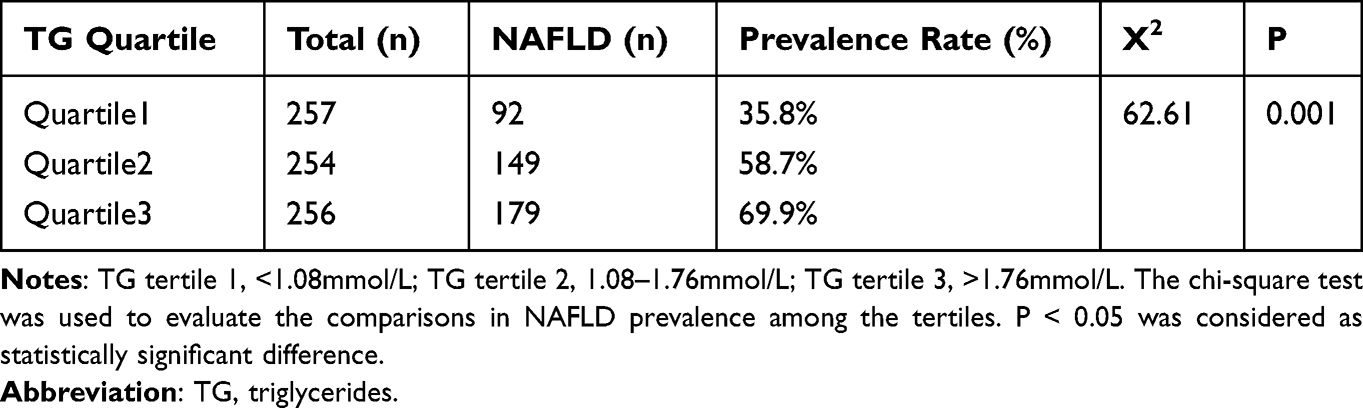 |
Table 5 Differences of the Prevalence Rate of NAFLD Among TG Tertiles |
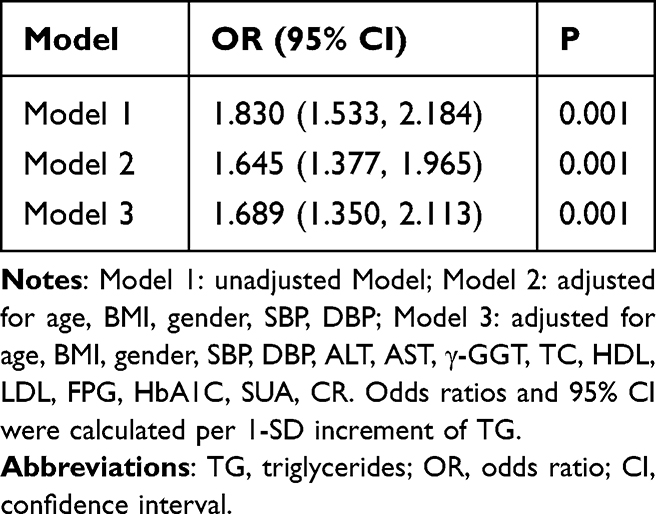 |
Table 6 Logistic Regression Analysis of TG and NAFLD |
ROC Curve of SUA/Cr and SUA/Cr Combined with BMI to Predict NAFLD
We further analyzed the predictive value of SUA/Cr and SUA/Cr in combination with BMI for NAFLD. ROC curve analysis was performed. The AUC of SUA/Cr was 0.590, and the cut-off point of SUA/Cr was 4.256. The AUC of SUA/Cr combined with BMI was 0.719. The sensitivity and specificity of SUA/Cr combined with BMI were 0.644 and 0.677, respectively (Figure 3 and Table 7).
 |
Table 7 ROC Curve Analysis for SUA/Cr, SUA/Cr Combined BMI |
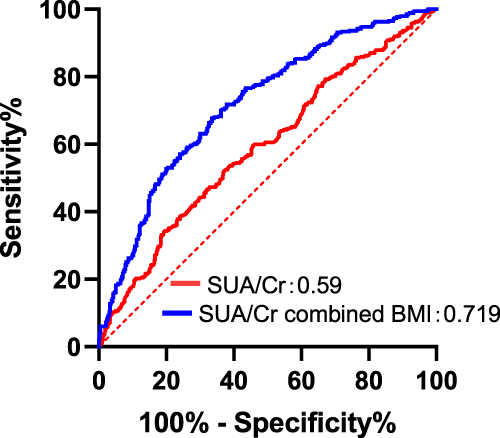 |
Figure 3 ROC curves for SUA/Cr, SUA/Cr combined BMI. |
Partial Mediation of TG on the Relationship of SUA/Cr and NAFLD
The above results revealed that the association of SUA/Cr with NAFLD may be partially related to TG. To investigate whether TG partially mediates the association between SUA/Cr and NAFLD, we carried out a mediation analysis. SUA/Cr had a direct performance on the incidence of NAFLD (β=0.148, 95% CI: 0.0393, 0.2585). TG mediated partially the performance of SUA/Cr on NAFLD incidence (β=0.1571, 95% CI: 0.0704, 0.2869). (Figure 4)
 |
Figure 4 Mediation of TG on the association between SUA/Cr and NAFLD. Abbreviations: NAFLD, non-alcoholic fatty liver disease; TG, triglycerides; SUA/Cr, serum uric acid to creatinine ratio. Note: Zero was not included in 95% confidence intervals representing statistical significance. |
Discussion
To data, this research evaluated the association between SUA/Cr and NAFLD in non-obese T2DM patients for the first time. Our study observed that patients with NAFLD had high SUA/Cr. SUA/Cr was independently linked with the risk of NAFLD in non-obese patients with T2DM. In non-obese T2DM patients, SUA/Cr can be used as a reliable noninvasive predictor for NAFLD.
In our study, the NAFLD incidence rate was as high as 54% in non-obese T2DM patients. Previous studies have confirmed the high co-morbidity of NAFLD and T2DM. A meta-analysis reported a global NAFLD incidence rate in T2DM patients up to 65%, and a subgroup analysis reported that NAFLD in Chinese T2DM patients was 52.56%.5 Studies have shown that the simultaneous of NAFLD and T2DM raises the risk of diabetic microvascular diseases. One prospective study reported that NAFLD increases the risk of diabetic retinopathy and diabetic nephropathy (OR = 1.338 (95% CI: 1.091–1.640) and 1.333 (1.007–1.764)).7 However, previous studies have not explored the interference of obesity as a factor. As we all know obesity and overweight are both risk factors for NAFLD, and it is easier to distinguish NAFLD in the obese population; however, Asian T2DM patients tend to be normal weight or overweight, and fewer studies have been conducted on the identification of NAFLD in non-obese T2DM individuals. In this research, 54% T2DM patients with BMI <28 kg/m2 combined with NAFLD, which is close to previous studies,25 but the results may be slightly biased due to the different criteria for defining obese BMI in different studies.
Our study found that NAFLD group showed higher SUA/Cr levels. In the SUA/Cr 3-quartile subgroup, the NAFLD incidence rate was statistically higher in the high-quartile subgroup than in the low-quartile subgroup. Logistic regression estimated that SUA/Cr was independently linked to the risk of developing NAFLD (OR = 1.305, 95% CI 1.050–1.623). The association between SUA and NAFLD has been well supported in earlier. A prospective study reported that patients with SUA in the high quartile at baseline had a 17.2% risk of developing NAFLD in the next 3 years.28 A large cross-sectional study including 21,798 subjects revealed that SUA was independently related to the risk of NAFLD.29 In fact, SUA can induce the development of NAFLD through a variety of pathogenesis, such as mediating insulin resistance, oxidative stress, inflammatory responses, and fructose metabolic pathways.30–32 Excessive SUA production and impaired excretion can lead to SUA accumulation, and T2DM patients are usually combined with renal injury, and a single SUA may not reflect the circulating SUA level in T2DM patients well. SUA/Cr is calculated by dividing SUA by Cr, and compared with a single SUA, SUA/Cr incorporates the influence of renal function, reduces the confounding effect of renal impairment, and more accurately reflects the circulating SUA level. Prior researches have observed the link between SUA/Cr and metabolic syndrome in adults.33,34 A previous study by our team based on T2DM showed that SUA/Cr is an independent risk factor for MAFLD, and the effect of BMI was not explored in that study. Since a significant proportion of NAFLD occurs in the non-obese individuals, we aimed to investigate the correlation between SUA/Cr and NAFLD in non-obese T2DM patients.35 NAFLD, as a hepatic phenotype of metabolic syndrome, has a small number of studies showing association between SUA/Cr and NAFLD.15–19 One retrospective study which included 11,791 people from the general population, the mean BMI was 24.45 ± 3.61 kg/m2 and the mean SUA/Cr was 6.64 ± 1.55. That study reported that SUA/Cr was significantly related to the severity of NAFLD, and that for each increase of 1 unit on SUA/Cr after adjusting for the interference of numerous confounders, the risk of NAFLD raised by 18.2%.15 One study based on the NHANES database population revealed that SUA/Cr was statistically related to NAFLD.17 One retrospective study based on a SUA-normalized population by Ma and Liu et al demonstrated that NAFLD was independently related to SUA/Cr after correcting for the effects of numerous confounders, and that SUA/Cr was significantly linked with the risk of NAFLD occurrence after adjusting for BMI, HDL, and LDL. The risk of NAFLD occurrence raised by 54.8% for each 1-each unit increase in SUA/Cr after correcting for BMI, HDL, and LDL.16 In one study based on a general population within the normal range of LDL, the mean SUA/Cr was 3.62 ± 0.92, and each one-unit increase in SUA/Cr after adjusting for confounding by numerous confounders increased the risk of NAFLD by 42.4% (OR = 1.424, 95% CI 1.396–1.454).18 In a study of NAFLD based on computerized scanning diagnosis in medical examination centers, the risk of NAFLD raised by 18.2% for each one-unit increase in SUA/Cr.19 However, most of the subjects in these studies were non-T2DM patients and only one study involved diabetic patients, but the effect of BMI was not explored in that study. Our research found that SUA/Cr was independently related to the risk of NAFLD in non-obese patients with T2DM, with a 30.5% raised risk of developing NAFLD for each unit increase in SUA/Cr, after adjusting for confounding factors.
In addition, the ROC curve revealed that SUA/Cr had some predictive value for NAFLD, but the predictive value was lower than that of SUA/Cr combined with BMI. The above findings indicate the significant value of SUA/Cr in identifying NAFLD in non-obese patients with T2DM, but also suggest that BMI remains relevant in the pathogenesis of NAFLD even in non-obese T2DM patients. Possibly due to underlying role of visceral obesity. Previous studies have shown that populations in Asia are easily to develop visceral adiposity with normal or overweight BMI.36 The effect of this factor was not explored in our study, and further researches are needed to demonstrate the association in future.
In addition, our research found that the effect of SUA/Cr for NAFLD could be partially mediated through TG. TG levels were higher among individuals with NAFLD than individuals without NAFLD, and the incidence of NAFLD was higher among those with the highest TG tertiles. Logistic regression revealed that TG was an independent risk factor for NAFLD. We observed a strong positive relation between SUA/Cr and TG. To investigate whether SUA/Cr could mediate the development of NAFLD through TG, we performed mediation analysis. The mediation analysis revealed that the influence of SUA/Cr on NAFLD could be partially mediated through TG. In prior studies, SUA was reported to associate with disorders of lipid metabolism. Prior researches have reported the correlation between SUA and high TG in different individuals.22–24 SUA induces insulin resistance by inhibiting NO synthesis, leading to more TG synthesis by the liver;37 in animal experiments, it was found that uric acid can lead to an attenuation of TG degradation by inhibiting hepatic lipase, which leads to increased TG levels;38 in addition, SUA can influence adipocytes by increasing monocyte macrophage chemotactic proteins and lowering the production of lipocalin.39 In a previous study, TG reflected the risk of NAFLD better than other lipid profiles.20 Abnormal elevation of TG triggers hepatic lipid deposition and hepatocellular steatosis, and hepatic lipid deposition underlies the pathogenesis of NAFLD.
Our study has the following strengths. First, our study population was non-obese T2DM patients, which is different from previous studies. Second, our study found that SUA/Cr is a reliable tool to predict NAFLD in non-obese T2DM patients, providing an economic tool in areas where liver imaging cannot be performed. There are several disadvantages to the current study. Firstly, the results of this single-center study may not apply to other populations. Secondly, the AUC of SUA/Cr was 0.59, which is a poor value for the prediction of NAFLD, and we still need to be further tested by a larger sample size research to detect the causality between SUA/Cr and NAFLD. Thirdly, this research used ultrasound to diagnose NAFLD, which has less diagnostic value than liver biopsy. In addition, this research did not consider the effect of abdominal obesity and simply defined obesity based on BMI.
Conclusion
In summary, SUA/Cr was related to NAFLD in non-obese T2DM patients and TG partially mediated this association. We should pay attention to UA and TG levels in non-obese T2DM patients. SUA/Cr can be applied to predict for NAFLD.
Acknowledgment
The study was supported by the Hebei General Hospital. This research did not receive any specific grant from any funding agencies in the public, commercial or not-for-profit sector.
Disclosure
The authors report no conflicts of interest in this work.
References
1. al EAftSotLEe. EASL–EASD–EASO Clinical Practice Guidelines for the management of non-alcoholic fatty liver disease. J Hepatol. 2016;64(6):1388–1402. doi:10.1016/j.jhep.2015.11.004
2. Li M, Wang H, Zhang X-J, Cai J, Li H. NAFLD: an emerging causal factor for cardiovascular disease. Physiology. 2023;38(6):255–265. doi:10.1152/physiol.00013.2023
3. Roderburg C, Kostev K, Mertens A, Luedde T, Loosen SH. Non-alcoholic fatty liver disease (NAFLD) is associated with an increased incidence of extrahepatic cancer. Gut. 2023;72(12):2383–2384. doi:10.1136/gutjnl-2022-328887
4. Roderburg C, Krieg S, Krieg A, et al. Non-alcoholic fatty liver disease (NAFLD) is associated with an increased incidence of chronic kidney disease (CKD). Eur J Med Res. 2023;28(1). doi:10.1186/s40001-023-01114-6
5. Li Cho E E, Ang CZ, Quek J, et al. Global prevalence of non-alcoholic fatty liver disease in type 2 diabetes mellitus: an updated systematic review and meta-analysis. Gut. 2023;72(11):2138–2148. doi:10.1136/gutjnl-2023-330110
6. Loosen SH, Krieg S, Krieg A, et al. Non-alcoholic fatty liver disease is associated with an increased risk of type 2 diabetes. Eur J Gastroenterol Hepatol. 2023;35(6):662–667. doi:10.1097/meg.0000000000002555
7. Deravi N, Dehghani Firouzabadi F, Moosaie F, et al. Non-alcoholic fatty liver disease and incidence of microvascular complications of diabetes in patients with type 2 diabetes: a prospective cohort study. Front Endocrinol. 2023;14. doi:10.3389/fendo.2023.1147458
8. Bowden RG, Richardson KA, Richardson LT. Uric acid and metabolic syndrome: findings from national health and nutrition examination survey. Front Med. 2022;9. doi:10.3389/fmed.2022.1039230
9. Jeong J, Suh YJ. Association between Serum Uric Acid and Metabolic Syndrome in Koreans. J Korean Med Sci. 2019;34(48). doi:10.3346/jkms.2019.34.e307
10. Oral A, Sahin T, Turker F, Kocak E. Relationship between serum uric acid levels and nonalcoholic fatty liver disease in non-obese patients. Medicina. 2019;55(9):600. doi:10.3390/medicina55090600
11. Niu Y, Zhang W, Zhang H, et al. Serum creatinine levels and risk of nonalcohol fatty liver disease in a middle‐aged and older Chinese population: a cross‐sectional analysis. Diabetes/Metab Res Rev. 2021;38(2). doi:10.1002/dmrr.3489
12. Al-Daghri NM, Al-Attas OS, Wani K, Sabico S, Alokail MS. Serum uric acid to creatinine ratio and risk of metabolic syndrome in Saudi type 2 diabetic patients. Sci Rep. 2017;7(1). doi:10.1038/s41598-017-12085-0
13. Chen L, Zhu Z, Ye S, Zheng M. The serum uric acid to serum creatinine ratio is an independent risk factor for diabetic kidney disease. Diabetes Metabol Syndr Obes. 2022;15:3693–3703. doi:10.2147/dmso.S387426
14. Casiglia E, Tikhonoff V, Virdis A, et al. Serum uric acid / serum creatinine ratio as a predictor of cardiovascular events. Detection of prognostic cardiovascular cut-off values. J Hypertens. 2023;41(1):180–186. doi:10.1097/hjh.0000000000003319
15. Aktas G, Choi J, Joe H, et al. The correlation between NAFLD and serum uric acid to serum creatinine ratio. PLoS One. 2023;18(7). doi:10.1371/journal.pone.0288666
16. Ma C, Liu Y, He S, et al. C-peptide: a mediator of the association between serum uric acid to creatinine ratio and non-alcoholic fatty liver disease in a Chinese population with normal serum uric acid levels. Front Endocrinol. 2020;11. doi:10.3389/fendo.2020.600472
17. Sookoian S, Pirola CJ. The serum uric acid/creatinine ratio is associated with nonalcoholic fatty liver disease in the general population. J Physiol Biochem. 2022;79(4):891–899. doi:10.1007/s13105-022-00893-6
18. Wang X, Han Y, Liu Y, Hu H. Association between serum uric acid-to-creatinine ratio and non-alcoholic fatty liver disease: a cross-sectional study in Chinese non-obese people with a normal range of low-density lipoprotein cholesterol. BMC Gastroenterol. 2022;22(1). doi:10.1186/s12876-022-02500-w
19. Seo YB, Han AL. Association of the serum uric acid-to-creatinine ratio with nonalcoholic fatty liver disease diagnosed by computed tomography. Metabol Syndr Related Disord. 2021;19(2):70–75. doi:10.1089/met.2020.0086
20. Alkassabany YM, Farghaly AG, El-Ghitany EM. Prevalence, risk factors, and predictors of nonalcoholic fatty liver disease among schoolchildren: a hospital-based study in Alexandria, Egypt. Arab J Gastroenterol. 2014;15(2):76–81. doi:10.1016/j.ajg.2014.05.002
21. DeFilippis AP, Blaha MJ, Martin SS, et al. Nonalcoholic fatty liver disease and serum lipoproteins: the Multi-Ethnic Study of Atherosclerosis. Atherosclerosis. 2013;227(2):429–436. doi:10.1016/j.atherosclerosis.2013.01.022
22. Ma W, Cui C, Feng S, et al. Serum uric acid and triglycerides in Chinese patients with newly diagnosed moyamoya disease: a cross-sectional study. Biomed Res Int. 2019;2019:1–7. doi:10.1155/2019/9792412
23. Chu Y, Zhao Q, Zhang M, Ban B, Tao H. Association between serum uric acid and triglycerides in Chinese children and adolescents with short stature. Lipids Health Dis. 2021;20(1). doi:10.1186/s12944-020-01429-x
24. Seyed-Sadjadi N, Berg J, Bilgin AA, Grant R. Visceral fat mass: is it the link between uric acid and diabetes risk? Lipids Health Dis. 2017;16(1). doi:10.1186/s12944-017-0532-4
25. Cui Y, Qu Z, Hu W, Shi H, Perez-Lopez FR, Perez-Lopez FR. Relationship between uric acid to high density lipoprotein cholesterol ratio and nonalcoholic fatty liver disease in nonoverweight/obese patients with type 2 diabetes. Int J Endocrinol. 2023;2023:1–7. doi:10.1155/2023/2513175
26. Denkmayr L, Feldman A, Stechemesser L, et al. Lean patients with non-alcoholic fatty liver disease have a severe histological phenotype similar to obese patients. J Clin Med. 2018;7(12):562. doi:10.3390/jcm7120562
27. Chen C. The guidelines for prevention and control of overweight and obesity in Chinese adults. Biomed Environ Sci. 2004;17:1–36.
28. Ng IOL, Xu C, Yu C, Xu L, Miao M, Li Y. High serum uric acid increases the risk for nonalcoholic fatty liver disease: a prospective observational study. PLoS One. 2010;5(7). doi:10.1371/journal.pone.0011578
29. Liang J, Pei Y, Gong Y, et al. Serum uric acid and non-alcoholic fatty liver disease in non-hypertensive Chinese adults the Cardiometabolic Risk in Chinese (CRC) study. Eur Rev Med Pharmacol Sci. 2015;19(2):305–311.
30. Sanchez-Lozada LG, Andres-Hernando A, Garcia-Arroyo FE, et al. Uric acid activates aldose reductase and the polyol pathway for endogenous fructose and fat production causing development of fatty liver in rats. J Biol Chem. 2019;294(11):4272–4281. doi:10.1074/jbc.RA118.006158
31. Liu J, Xu C, Ying L, et al. Relationship of serum uric acid level with non‐alcoholic fatty liver disease and its inflammation progression in non‐obese adults. Hepatol Res. 2016;47(3):E104–E112. doi:10.1111/hepr.12734
32. Cheng S, Yang Y, Zhou Y, Xiang W, Yao H, Ma L. Influence of different concentrations of uric acid on oxidative stress in steatosis hepatocytes. Exp Ther Med. 2018. doi:10.3892/etm.2018.5855
33. Tao J, Shen X, Li J, et al. Serum uric acid to creatinine ratio and metabolic syndrome in postmenopausal Chinese women. Medicine. 2020;99(17):e19959. doi:10.1097/MD.0000000000019959
34. Zhong D, Liu D, Guo Y, et al. Association of the serum uric acid to creatinine ratio with metabolic syndrome in the middle age and older population in China. Front Endocrinol. 2022;13. doi:10.3389/fendo.2022.1060442
35. Xing Y, Chen J, Liu J, Song G, Ma H. Relationship between serum uric acid-to-creatinine ratio and the risk of metabolic-associated fatty liver disease in patients with type 2 diabetes mellitus. Diabetes Metabol Syndr Obes. 2022;15:257–267. doi:10.2147/dmso.S350468
36. Liu X, Chen Y, Boucher NL, Rothberg AE. Prevalence and change of central obesity among US Asian adults: NHANES 2011–2014. BMC Public Health. 2017;17(1). doi:10.1186/s12889-017-4689-6
37. Waheed Y, Yang F, Sun D. Role of asymptomatic hyperuricemia in the progression of chronic kidney disease and cardiovascular disease. Korean J Intern Med. 2021;36(6):1281–1293. doi:10.3904/kjim.2020.340
38. Balasubramanian T. Uric acid or 1-methyl uric acid in the urinary bladder increases serum glucose, insulin, true triglyceride, and total cholesterol levels in Wistar rats. Sci World J. 2003;3:930–936. doi:10.1100/tsw.2003.90
39. Baldwin W, McRae S, Marek G, et al. Hyperuricemia as a mediator of the proinflammatory endocrine imbalance in the adipose tissue in a murine model of the metabolic syndrome. Diabetes. 2011;60(4):1258–1269. doi:10.2337/db10-0916
 © 2024 The Author(s). This work is published and licensed by Dove Medical Press Limited. The full terms of this license are available at https://www.dovepress.com/terms.php and incorporate the Creative Commons Attribution - Non Commercial (unported, v3.0) License.
By accessing the work you hereby accept the Terms. Non-commercial uses of the work are permitted without any further permission from Dove Medical Press Limited, provided the work is properly attributed. For permission for commercial use of this work, please see paragraphs 4.2 and 5 of our Terms.
© 2024 The Author(s). This work is published and licensed by Dove Medical Press Limited. The full terms of this license are available at https://www.dovepress.com/terms.php and incorporate the Creative Commons Attribution - Non Commercial (unported, v3.0) License.
By accessing the work you hereby accept the Terms. Non-commercial uses of the work are permitted without any further permission from Dove Medical Press Limited, provided the work is properly attributed. For permission for commercial use of this work, please see paragraphs 4.2 and 5 of our Terms.