Back to Journals » Journal of Inflammation Research » Volume 15
Tfh Exosomes Derived from Allergic Rhinitis Promote DC Maturation Through miR-142-5p/CDK5/STAT3 Pathway
Authors Teng ZX, Zhou XC, Xu RT, Zhu FY, Bing X, Guo N, Shi L, Qi WW, Liu CC, Xia M
Received 6 March 2022
Accepted for publication 24 May 2022
Published 31 May 2022 Volume 2022:15 Pages 3187—3205
DOI https://doi.org/10.2147/JIR.S365217
Checked for plagiarism Yes
Review by Single anonymous peer review
Peer reviewer comments 2
Editor who approved publication: Professor Ning Quan
Zhen-Xiao Teng,1,* Xuan-Chen Zhou,2,* Run-Tong Xu,2 Fang-Yuan Zhu,2 Xin Bing,1 Na Guo,2 Lei Shi,2 Wen-Wen Qi,1 Cheng-Cheng Liu,3 Ming Xia1,2
1Department of Otolaryngology, Shandong Provincial Hospital, Cheeloo College of Medicine, Shandong University, Jinan, People’s Republic of China; 2Department of Otolaryngology, Shandong Provincial Hospital Affiliated to Shandong First Medical University, Jinan, People’s Republic of China; 3Central Laboratory, Shandong Provincial Hospital Affiliated to Shandong First Medical University, Jinan, People’s Republic of China
*These authors contributed equally to this work
Correspondence: Ming Xia, Department of Otolaryngology, Shandong Provincial Hospital, Cheeloo College of Medicine, Shandong University, Jinan, People’s Republic of China, 250012, Tel +86-68779106, Email [email protected] Cheng-Cheng Liu, Department of Otolaryngology, Shandong Provincial Hospital, Cheeloo College of Medicine, Shandong University, Jinan, 250000, People’s Republic of China, Tel +86-68776913, Email [email protected]
Background: Dendritic cells (DCs) play an important role in allergen signal presentation. Many studies showed that follicular helper T cells (Tfhs) are related to allergic rhinitis (AR). However, the relationship between Tfhs and DCs and the mechanism of their interaction with AR remain unclear.
Purpose: To explore the mechanism of Tfhs on DC maturation in AR.
Methods: Tfhs were isolated from OVA-sensitized mice and co-cultured with DCs derived from mouse bone marrow. DCs maturity was monitored using flow cytometry and immunofluorescence staining. Exosomes of Tfhs were extracted, and miRNAs inside exosomes were analyzed using RNA-seq to identify differentially expressed genes. Using the TargetScan algorithm, it was predicted that CDK5 is a direct target gene, which is validated in a dual luciferase assay. DCs were treated with miR-142-5p mimics or inhibitors or transfected with CDK5 small interfering RNAs to verify the regulatory effects of miR-142-5p and CDK5 on DC maturation. How CDK5 regulates STAT3 signaling pathway was investigated to elucidate the molecular mechanism of DC maturation. Finally, in an in vivo experiment, the exosomes of AR-derived Tfhs were injected intravenously to detect their promotion of AR.
Results: Tfh exosomes derived from AR mice contributed to DC maturation. RNA-seq results showed that miR-142-5p was the differentially decreased gene. Using the TargetScan algorithm, it was predicted that CDK5 was the target gene for the direct action of miR-142-5p. By detecting the effects of changes in the expression levels of miR-142-5p and CDK5 on DC maturation, it was demonstrated that miR-142-5p inhibits DC maturation by inhibiting CDK5 expression. CDK5-regulated STAT3 signaling pathway during DC maturation, and inhibition of the STAT3 signaling pathway can reverse the regulation of miR-142-5p/CDK5 on DC maturation. Finally, in vivo experiment indicated that the injection of AR-derived Tfhs promoted AR in mice.
Conclusion: Tfh-derived exosomes induce DC maturation by regulating miR-142-5p/CDK5/STAT3 signaling pathway, thereby promoting the occurrence of AR.
Keywords: allergic rhinitis, Tfhs, exosome, dendritic cells, miR-142-5p, CDK5, STAT3
Introduction
The role of dendritic cells (DCs) in allergies has been recognized for decades.1–3 In allergic rhinitis (AR), DCs are regarded as the primary antigen presenting cells, which absorb and process allergens and undergo a maturation process.4 Mature DCs interact with T and B cells in lymphoid tissues to promote production of antigen-specific IgE, which promotes release of inflammatory mediators and appearance of AR symptoms, such as watery nose and sneezing.5 For example, in a mouse model of ovalbumin (OVA)-induced AR, upon deletion of DCs, there is a decrease in allergic symptoms, nasal inflammation, and OVA-specific IgE levels, demonstrating the essential role of DCs in AR.6 Furthermore, DCs interact with a multitude of chemokines to control AR. For example, by inducing AR in a mouse lacking lymphoid chemokines CCL19 and CCL21 gene, the allergic symptoms are much more severe, antigen-specific IgE level and number of DCs are much higher, than those in AR-induced in WT mouse, suggesting a relationship between chemokines CCL19 and CCL21 and DC in AR.7
Follicular helper T cells (Tfhs) are a specialized subpopulation of CD4+ helper T cells that mainly support germinal center response, in which humoral immunity involving B cells with high affinity and long lifespan is elicited.8 Recently, there has been considerable interest in the role of Tfhs in allergic diseases including AR.9 Tfhs, by expressing CD40L and secreting IL-4, play a key role in the conversion of IgG to IgE in B cells.10,11 In allergic diseases, IgE production in B cell was shown to be promoted by IL-4 secreted from Tfhs, instead of Th2 cells.12 In intestinal helminth infection, IL-4 secreted from Tfhs is required for IgE class switching and plasma-blast formation.13 It was also found that allergen-activated Tfhs produced inflammatory mediators, which promoted IgE response and allergic symptoms.14 In the allergic immune response caused by house dust mite, knock-out mice were generated lacking receptor for IL-6, a key cytokine that drives the development of Tfhs, and the key role of Tfhs in allergic diseases was confirmed.15 Apart from AR, Tfhs have also been reported to be involved in the pathophysiology of other diseases. For example, in atopic dermatitis, the reduction of Langerin DCs often lacks the response of Tfhs.16 In summary, Tfhs as a new player are largely involved in the progression of AR. Even though both Tfhs and DCs have been recognized to be involved in AR, the relationship between Tfhs and DCs has not been clarified, especially in AR, which limits our understanding of AR and is the topic of this study.
Exosomes are membrane-bound vesicles found in Tfhs and many other cells with a diameter of 40–100nm. The lumen of exosomes contains various nucleic acids, including mRNAs, microRNAs (miRNAs), and other non-coding RNAs. Secretion of exosomes and their uptake by neighboring or distant recipient cells can regulate the biological activity of the recipient cells.17 Further studies have demonstrated that miRNAs are accompanied by exosomes to transfer genetic information between cells.18 And miRNAs have been recognized to be involved in cell differentiation, proliferation and migration.1,17,19 For instance, chondrocytes in osteoarthritis can secrete exosomes, which stimulate the maturation of macrophages, production of IL-1β, and reduce autophagy, thereby causing synovial inflammation.20 Exosomes can promote tumor growth by acting on mesenchymal stem cell surface receptors and convert mesenchymal stem cells into producers of growth factors that promote tumor growth.21 Therefore, we speculated that Tfh cell-derived exosomes and the miRNA content in exosomes play an important role in the maturation of DCs.
In this study, a murine AR model was induced by challenging with ovalbumin (OVA). And Tfhs and exosomes in Tfhs were extracted from the AR mice. The effect of Tfhs on DC maturation and the underlying mechanism were studied in vitro. Additionally, exosomes extracted from AR mice were injected into healthy mice to explore the effect of AR development in vivo. Our study sheds light on the regulatory mechanism by which exosomes of Tfhs promote DC maturation.
Materials and Methods
Reagents
AF700 Rat Anti-Mouse CD3 (Cat# 100215), FITC Rat Anti-Mouse CD44 (Cat# 103005), BV605 Rat Anti-Mouse CD8 (Cat#100743) and 7AAD (Cat#420403) were purchased from Biolegend (San Diego, CA, USA). BV421 Rat Anti-Mouse CD62L (Cat#562910) was purchased from BD Biosciences (California US). Ovalbumin (OVA) (Cat# 9006-59-1) was purchased from Sigma-Aldrich (St Louis, MO, USA). Rabbit polyclonal anti-STAT3 antibody (Cat# A19566, 1:1000 diluted for WB), anti-phospho-STAT3-Y705 antibody (Cat# AP0705, 1:1000 diluted for Western blot), rabbit anti-CD80 antibody (Cat# A16039, 1:100 diluted for immunofluorescence, 1:2000 diluted for Western blot) and rabbit anti-CD86 antibody (Cat# A1199, 1:100 diluted for immunofluorescence, 1:1000 diluted for Western blot) were purchased from Abclonal (Wuhan, Hubei, China). Rabbit anti-CDK5 antibody (Cat# sc-173, 1:100 diluted for immunofluorescence, 1:1000 diluted for WB) from Santa Cruz Biotechnology (Santa Cruz, CA, USA). Fetal bovine serum (FBS) (Cat# 10099–141) and DMEM (Cat# 11320033) were purchased from Gibco (Rockville, MD, USA). TRIzol (Cat# 15596026) and SYBR Green (FP205) were purchased from Invitrogen (Shanghai, China). Rabbit polyclonal anti-CD9 (Cat# ab92726), TSG101 (Cat# ab125011) and Calnexin (Cat# ab22595) were purchase from Abcam (Cambridge, MA, USA). FITC mouse IgG (Cat# 400108) was purchase from Biolegend (San Diego, CA, USA) and Alexa Fluor R 568 goat anti-mouse IgG1 (Cat# A21124) from Invitrogen (Shanghai, China). GW4869 (Cat# No.6823-69-4) were obtained from Merck (Darmstadt, Germany). Lipopolysaccharides (LPS) (Cat# L2880) were purchased from Sigma-Aldrich (Shanghai, China). Colivelin TFA (STAT3 activator) and Stattic (STAT3 inhibitor) were purchased from MedChemExpress Inc (Shanghai, China).
Induction of AR in Mouse Model
Healthy male C57BL/6J mice (6–8 weeks, 20±2 g) were obtained from the Shandong Provincial Hospital Affiliated to Shandong University. The environment is equipped with a temperature of 20–22℃, a relative humidity of 50–60%, and a 12 hour:12 hour light–dark cycle, and ample food and water. A murine AR model is established by inducing C57BL/6J mice with OVA to as described.22 Briefly, 25 μg OVA and 2 mg aluminum hydroxide gel in 200 μL PBS solution were injected intraperitoneally into mice on day 1 and 5. From day 12 to 18, OVA diluted in PBS with a concentration of 6% was administered to mice intranasally, 20 μL/nostril once a day. For the next 4 weeks, mice were treated with OVA the same way as in day 12 to 18, except that the frequency was three times a day. Afterward, on day 47, the symptoms including secretion, sneezing frequency and nose-scratching times during a 30 min period were evaluated and scored as described.22 The AR model is regarded as being successfully established, if total scores reach 5 points or above.22 For negative control, wild type (WT) mice was generated by using PBS, instead of OVA or aluminum hydroxide, for intraperitoneal injection and intranasal administration.
To study the effect of exosomes from Tfhs on AR development in vivo, four mouse models were induced, following a similar procedure as stated above for AR mouse model. The first is induced by injecting each mouse intravenously with 2 mL exosomes from AR-derived Tfhs with 107 particles/mL concentration on day 1, 5, and 9. PBS was used for intranasal treatment for the rest of the 47-day duration. The second is induced by injecting with exosomes from WT-derived Tfh. The third was a negative control, called WT mice, was induced using PBS for intranasal treatment. The fourth, called OVA mice, was generated using intraperitoneal injection and nasal administration of OVA, the same as the above process for AR mouse model.
Tfhs Sorting and Exosomes Detection
Mouse spleens were collected and dispersed into a single cell suspension. Red blood cells were lysed and washed. The remaining cells were stained with specific antibodies and sorted according to the gating strategy and flow scheme shown in Figure 1A: 1) The remaining were separated based on the cell size (FSC-A) and granularity (SSC-A) to select lymphocyte (98.6% of the subtotal); 2) The lymphocytes are separated according to the combination of FSC-H and FSC-A into single cells (93.8% of the subtotal); 3) The combination of 7AAD, a dye with low binding affinity for living cells, and FSC-A is used for select the living cells (99.8% of the subtotal); 4) From the living cell, to separate T cells, the AF700-labelled anti-CD3 antibody and the BV510-labelled anti-CD19 antibody were used for staining B cells (CD19+) and T cells (CD3+), respectively, and B cells are gated out, leaving with only T cells (39.9% of the subtotal); 5) The PE-Cy7-labelled anti-CD4 antibody and the BV605-labelled anti-CD8 antibody were used for staining CD4+ and CD8+ T cells, respectively, and CD4+ T cells were selected (65.7% of the subtotal); 6) The FITC-labelled anti-CD44 antibody and BV421-labelled anti-CD62L antibody were used to screen effector Th (31.6% of the subtotal); 7) By staining PE-labelled anti-CXCR5 antibody, Tfhs, which are a subgroup of Th cells with CXCR5+ characteristics, were selected (7.05% of the subtotal); 8) At this point, Tfhs selected were further visualized by staining with the APC-labelled anti-CCR6 antibody and the BV650-labelled anti-CXCR3 antibody, the subpopulations of Tfh cells such as Tfh1, Tfh2, Tfh17, were visible in the contour plot. It is estimated that Tfhs comprises 0.54% (7.05% * 31.6% * 65.7% * 39.9% * 99.8% * 93.8% * 98.6% = 0.54%) of total spleen cell suspension devoid of red blood cells. Subsequently, the sorted cells are placed on a 96-well plate pre-coated with anti-CD3 and anti-CD28 antibodies and cultivated in a medium without serum. Afterward, IL-2 (Cat# 402-ML-020/CF; R&D Systems) and other stimulating factors were added, before the cells were cultured in vitro for 48 hours, to ensure the amount and activity of cells were comparable in single wells. And the supernatant was collected. Exosomes were extracted using ultracentrifugation. Scanning electron microscopic imaging was performed using Hitachi HT-7700 transmission electron microscope with an acceleration voltage of 100 kV. The diameter of exosomes was analyzed using a particle size analyzer (NanoFCM N30E, NanoFCM Inc., China).
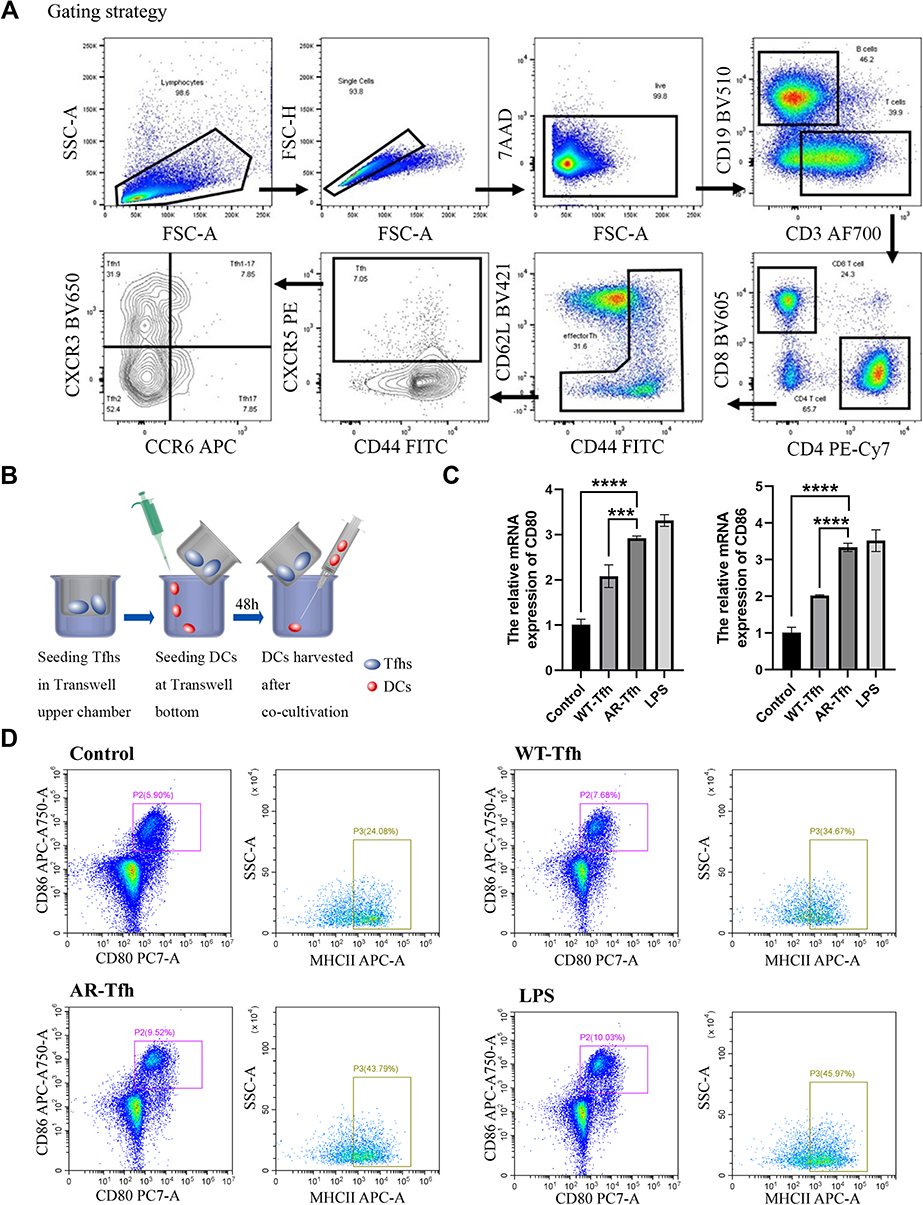 |
Figure 1 AR-derived Tfhs in a DC co-culture system promote DC maturation. (A) Gating strategy and flow plot for Tfhs sorting according to Materials and Methods. (B) A schematic of Tfhs/DCs Transwell co-culture system. (C) Relative mRNA expression levels of CD80 or CD86 in treated or untreated DCs are expressed as mean ± standard error from at least three independent experiments. *** P < 0.001; **** P < 0.0001. (D) Flow cytometry results of DC cell surface expression of the co-stimulatory molecules CD80, CD86 and MHCII in control (no treatment), WT mice-derived Tfhs, AR mice-derived Tfhs, or LPS treated group. Flow cytometry results demonstrate that the ratio of CD80, CD86 and MHC II of DCs was significantly increased in the AR-derived Tfhs/DCs co-culture group. Dot plots with the label for the proportion of CD80+ CD86+ or MHCII+ cells are representative of at least three independent experiments. |
Extraction and Culture of Bone Marrow-Derived DCs
The lower limbs of the mice were obtained aseptically, the femur and tibia were separated, the cartilage was cut off, and the medullary cavity was exposed. The medullary cavity was rinsed with medium, repeated 3 times to obtain sufficient DCs, and obtain bone marrow DCs after lysing red blood cells and centrifugation. Active DCs were counted and the concentration was adjusted to 1×10⁵/mL. And 20ng/mL of cytokines GM-CSF, 5% FBS, 0.1% 2-mercaptoethanol was added to 24-well plate to culture DCs. DCs were harvested after cell detachment in subsequent experiments.
Tfhs/DCs Co-Culture
Tfhs were isolated from the mouse spleen as described above and DCs were derived from mouse bone marrow. In a Transwell co-culture system, Tfhs were seeded in the upper chamber of the 24-well Transwell at a density of 1.5 × 10⁵ cells/well. Then, DCs were seeded at the bottom of the well at a density of 1.5 × 10⁶ cells/well (Figure 1B). After being co-cultured for 48 hours, the cell supernatants or cells were collected for subsequent experiments.
Reverse Transcription Quantitative PCR (RT-qPCR)
Total RNA was extracted with Trizol and chloroform, precipitated with isopropyl alcohol, washed with 75% ethanol, dissolved in DEPC water, dried, dissolved in RNase-free water. The cDNA was synthesized by reverse transcription and amplified in a PCR reaction composed of 40 cycles each with three steps (denaturation, annealing, and extension). The relative gene expression was obtained by using the amplification efficiency derived from the cDNA standard curve. Reverse transcriptase and SYBR Green I dye were purchased from TIANGEN (Hangzhou, China). Primers were designed as follows: 5′- TTACCTGCTTTGCTTCCG-3′ (forward) and 5′- GACGACGACTGTTATTACTGC-3′ (reverse) for CD80; 5′- ATGGGCTCGTATGATTGT-3′ (forward) and 5′- CTTCTTAGGTTTCGGGTG-3′ (reverse) for CD86; 5′- GCGCGCATAAAGTAGAAAGC-3′ (forward) and 5′- AGTGCAGGGTCCGAGGTATT-3′ (reverse) for miR-142-5p; 5′- GGGGAAGGCACCTATGGA-3′ (forward) and 5′- AGGGCTGAACTTGGCACA-3′ (reverse) for CDK5; 5′- CTCGCTTCGGCAGCACAT-3′ (forward) and 5′- AAATATGGAACGCTTCACG-3′ (reverse) for U6; and 5′- GGCTGTATTCCCCTCCATCG-3′ (forward) and 5′- CCAGTTGGTAACAATGCCATGT-3′ (reverse) for β-actin. Relative gene expression was calculated by 2−ΔΔCT method using β-actin as an endogenous control. Results were presented as fold change after normalizing to controls.
Flow Cytometry Analysis of DC Maturation
The DCs were collected after co-culture. The DC concentrations were adjusted to 1 × 10⁶ cells/mL with PBS. Then, DC samples were stained with anti-CD86 antibody (Cat#105045), anti-CD80 antibody (Cat#104733) or anti-MHCII antibody (Cat#107613) labeled with fluorescein (APC-A750-A, PC7-A, APC-A) from Biolegend. Cells were washed, fixed and analyzed using a BD FACS flow cytometer and Cell Quest Pro software version 5.1 (BD Biosciences, Franklin Lakes, NJ, USA).
Immunofluorescence Staining
DCs are planted on cell slides in a 24-well plate, cultured for 24 hours. After treatment (co-cultivation, exosomal or LPS stimulation), DCs were washed with PBS, and fixed with 4% paraformaldehyde for 15 minutes, permeabilized with 0.1%TritonX-100 for 10 minutes, blocked with 10% goat serum for 30 minutes, and incubated overnight at 4℃ with the respective antibodies at 1:100 dilution, including rabbit polyclonal anti-STAT3 antibody, rabbit anti-phospho-STAT3-Y705 antibody, rabbit anti-CD80 antibody, and rabbit anti-CD86 antibody, and rabbit anti-CDK5 antibody. The next day, DCs were stained with the corresponding secondary antibody for 1 hour at room temperature in the dark, and DAPI was used to stain the nucleus. After mounting with anti-quenching agent, images were captured with a confocal microscope (Leica).
RNA-Seq
Total RNA samples were extracted from AR or WT mouse-derived Tfhs using TRIzol (Invitrogen, Shanghai, China). RNA samples were subject to agarose electrophoresis, NanoDrop ND-1000 (Nano Drop Inc., Wilmington, DE, USA) quantification, and then used to prepare miRNA sequencing library using NEB Multiplex Small RNA Library Prep Set for Illumina in five steps: 1) 3’-adapter ligation; 2) 5’-adapter ligation; 3) cDNA synthesis; 4) PCR amplification; and 5) extraction and purification of 135–155 bp PCR amplified fragments (corresponding to ~15–35 nt small RNAs). An Agilent 2100 Bioanalyzer (Agilent, Beijing, China) was used to quantify the libraries. The DNA fragments in the library were denatured with 0.1 M NaOH, captured on Illumina flow cells, amplified in situ, and sequenced for 50 cycles on Illumina NextSeq 500 sequencer (Illumina, San Diego, CA, USA) at Aksomics, Inc. (Shanghai, China). Sequencing reaction was performed using TruSeq Rapid SR Cluster Kit (#GD-402-4001, Illumina).
Cell Transfection
DCs were cultured in 60 mm dish containing DMEM with 10% FBS for 24 h at a density of 3 × 10⁵ cells per dish. The miR-142-5p mimic and inhibitor and their negative control (NC) were purchased from Thermo Fisher Scientific (Waltham, MA, USA). CDK5 siRNAs was purchased from Shanghai Biotechnology Company (Shanghai, China). The cells were transfected with miR-142-5p mimic or inhibitor at a final concentration of 25 nmol/L or CDK5 siRNA at 20 nmol/L using jetPRIME® Transfection Agent (Cat# PT-114-15; Polyplus-transfection SA, Illkirch, FRANCE) according to the manufacturer’s instruction. The sequence of CDK5 siRNA was as follows: UAUGACAGAAUCCCAGCCCTT, GGGCUGGGAUUCUGUCAUATT.23 DCs were transfected twice to improve transfection efficiency. The second transfection was performed 24 hours after the end of the first transfection. Transfection efficiency of the DC transfection system was monitored by using siGLO Cyclophilin B Control siRNA purchased from Thermo Scientific (Waltham, MA, USA) as described.24
Dual-Luciferase Reporter Assay
Recombinant plasmids containing the firefly luciferase reporter were constructed by replacing the 3’-UTR of firefly luciferase gene with the WT and mutant 3’-UTR of CDK5, including PGL-3-CDK5-WT (WT vectors in the 3’-UTR region of CDK5) and PGL-3-CDK5-MT (mutant-type vectors in the 3’-UTR region of CDK5). On day 1, HEK293 cells were seeded at a concentration of 5 × 10⁴ cells/well in a 24-well plate. On day 2, the HEK293 cells were transfected with recombinant plasmids or miR-142-5p mimics with Lipofectamine 2000. As a transfection control for normalization purpose, Renilla luciferase reporter pRLCMV (Promega, Madison, WI, USA) was co-transfected. At 48 hours post-transfection, the luciferase activity was analyzed using the Dual-luciferase Reporter assay system (Promega, Madison, WI, USA).
Western Blot
Cells were washed with cold PBS, lysed on ice with a lysis buffer containing PMSF, and scraped with a cell scraper. The lysates were centrifuged and the supernatants were collected. After the protein content of the samples was determined, the sample containing 50 ng protein was electrophoresed on SDS-PAGE gel and transferred to PVDF membrane and blocked using a solution with dissolved skimmed milk powder. The PVDF membrane was incubated with the primary antibody at 4℃ overnight, washed with PBS, and incubated with the horseradish peroxidase–conjugated secondary antibody at 37℃ for 1 hour. The bands of antibody-stained proteins were detected using the enhanced chemiluminescence (ECL) reagent from Cell Signaling Technology (Beverly, MA, USA; Cat# 6883) according to the manufacturer’s procedures.
Hematoxylin and Eosin Staining
Fresh nasal mucosa tissue was fixed in 4% paraformaldehyde for 48 hours, embedded in paraffin, before being sliced into 4um sections. After using Xylene to dewax sections, and dehydrating in 100%, 95%, 80%, 75% alcohol, the sections were stained by using hematoxylin and eosin (Cat#G1120, Solarbio), dehydrated sequentially in 95%, 95%, and 100% alcohol. Then, the slices were sealed using neutral gum and observed under a microscope (Leica Microsystems CMSA GmbH, Wetzlar, Germany).
ELISA
Serum was collected from mice treated with exosomes of Tfhs on day 9 post-treatment. As a control, serum was collected from mice treated with OVA immediately after 46-day treatment. Inflammatory mediators in serum including IgE (Cat# 70-EK275), IFN-γ (Cat# EK280-96), IL-13 (Cat# EK213/2) and IL-17 (Cat# 70-EK217S) were measured with commercial ELISA kits (MultiSciences, Hangzhou, Zhejiang Province, China) according to manufacturer’s instructions. The absorbance value was read at 450 nm using Multiskan MK3 (Thermo Fisher Scientific, Inc.).
Statistical Analysis
Statistical analyses were performed using GraphPad Prism software version 8.0 (GraphPad Software, San Diego, CA, USA). Statistical analysis of differences among multiple groups was performed using one-way analysis of variance, or Student’s t-test. Differences were considered statistically significant if P values are smaller than 0.05.
Results
Tfhs Derived from AR Induce DC Maturation
A mouse model of AR was established by nasal and intraperitoneal induction with OVA as described in Materials and Methods. In order to determine whether Tfhs that are derived from AR mice can affect DC maturation, Tfhs were isolated from spleens of AR or control WT mice (Figure 1A), and co-cultured with DCs in a Transwell system (Figure 1B). The expression levels of the co-stimulatory molecules CD80 and CD86 or MHCII were measured using RT-qPCR and flow cytometry to determine the maturation of DCs. The RT-qPCR results indicated that the relative mRNA expression levels of CD80 and CD86 in the AR-Tfh/DCs co-culture group were significantly higher than those in the control PBS treated group and the WT-Tfh/DCs co-culture group. LPS served as a positive control for DC maturation (Figure 1C). The flow cytometry results showed that the proportion of CD80+, CD86+ and MHCII+ DCs was much higher in the AR-Tfhs/DCs co-culture group (9.52%), compared with the control PBS treated group (5.90%) and the WT-Tfhs/DCs co-culture group (7.68%) (Figure 1D). In addition, immunofluorescence staining was performed on the co-cultured DCs, and the results are consistent with the RT-qPCR and flow cytometry results (Figure 2). These results indicated that Tfhs derived from AR promote DC maturation.
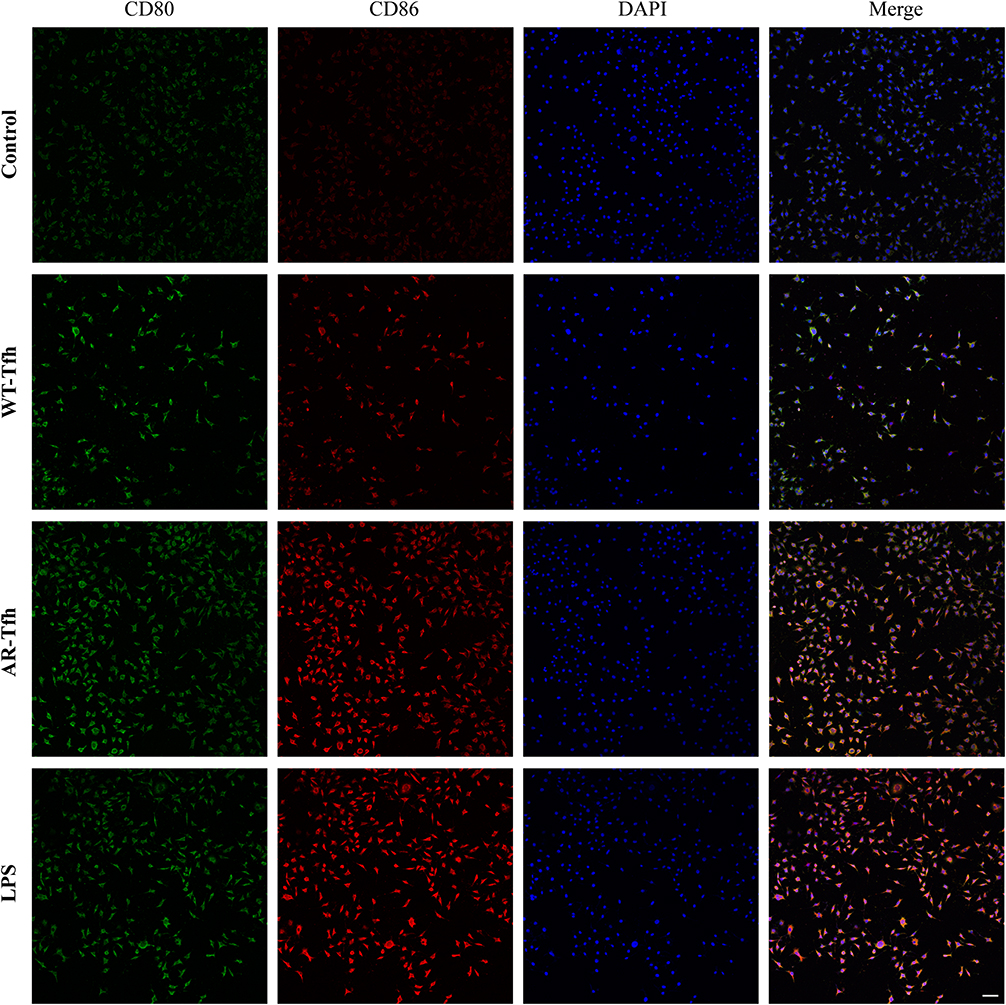 |
Figure 2 Expression of CD80 and CD86 of DCs under four different conditions. Immunofluorescence staining was performed to determine the expression level of CD80 and CD86 on DC cell surface. Scale bar at the bottom right stands for 50 μm. Data shown are representative of 3 independent experiments. Green represents CD80 staining, red CD86 staining, and blue DAPI staining for cell nuclei. |
Tfh Exosomes Derived from AR Contribute to DC Maturation
Recently, exosomes have been reported to play an important role in cell-to-cell communication.25 For instance, exosomes from B lymphocytes promoted T cell response that are MHC class II-restricted.26 The miRNA in exosomes released by adipocytes can participate in glucose tolerance.27 Therefore, we hypothesize that exosomes in Tfhs may mediate the interaction between Tfhs and DCs. In order to elucidate the mechanism by which AR-derived Tfhs promote DC maturation, exosomes were extracted from Tfhs derived from AR or WT mice and added to DCs culture medium. The presence of exosomes was confirmed using scanning electron microscopy. And the morphology of exosomes of WT and AR mice was indistinguishable (Figure 3A). PBS was added to DCs as a no treatment control. And DC maturation was measured by detecting the expression levels of CD80 and CD86 using RT-qPCR and flow cytometry. The RT-qPCR results showed that the expression level of CD80 and CD86 mRNA in the AR-Tfh-exosomes group were significantly higher than that in the non-treatment control group. As another control, GW4869, a non-competitive phospholipase inhibitor that blocks the secretion of exosomes, was added to Tfh culture before exosome extraction. It was found that with GW4869 addition, the expression levels of CD80 and CD86 mRNA in the AR-Tfh-exosomes group were significantly reduced (Figure 3B). These results suggested that exosomes mediate the effect of AR mouse-derived Tfhs in promoting DC maturation. In addition, the results from flow cytometry showed that, compared with the control group and the AR-Tfh-GW4869 group, the AR-Tfh-exosomes group had a much higher proportion of CD80+ CD86+ DCs (43.24%) and MHCII+ DCs (14.89%) (Figure 3C). Results from immunofluorescence staining experiment were consistent with the results from RT-qPCR and flow cytometry (Figure 4). Taken together, RT-qPCR, flow cytometry, and immunofluorescence staining results strongly indicate that AR-derived exosomes play a key role in promoting DC maturation.
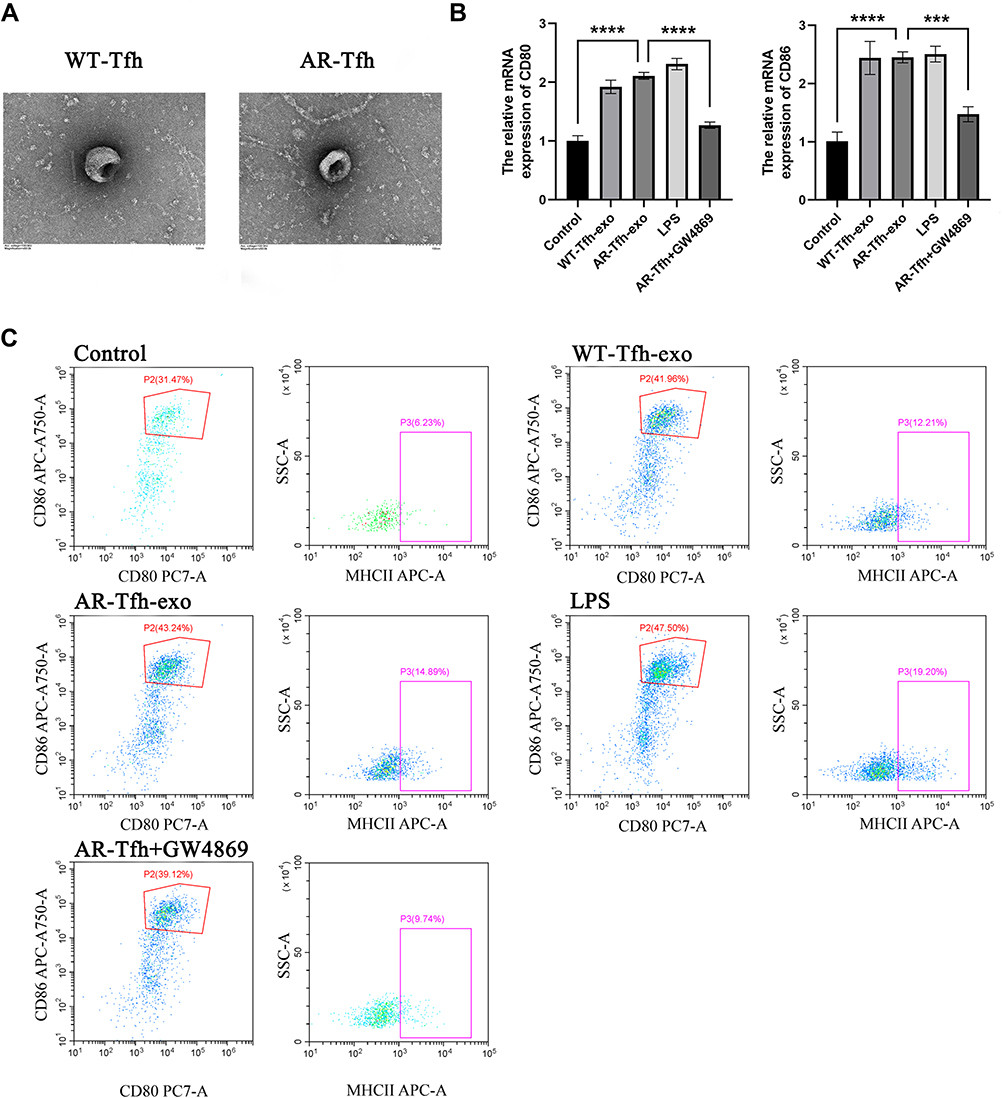 |
Figure 3 Tfhs secrete exosomes and AR-derived Tfh exosomes promote DC maturation. (A) Morphology of exosomes isolated from WT or AR mice by scanning electron microscopy. Scale bar represents 100 nm. (B) Comparison of relative mRNA expression level (mean ± standard error of at least three independent experiments) of CD80 and CD86 in the DCs treated with control (no treatment), WT mice-derived Tfh exosome, AR mice-derived Tfh exosome, LPS, or WT mice-derived Tfh exosomes with the addition of GW4869. *** P < 0.001; **** P < 0.0001. (C) Flow cytometry results of DC cell surface expression of the co-stimulatory molecules CD80, CD86 and MHCII in control (no treatment), WT mice-derived Tfhs exosome, AR mice-derived Tfhs exosome group, LPS, or WT mice-derived Tfh exosomes with the addition of GW4869 group. Dot plots with the label for the proportion of CD80+ CD86+ or MHCII+ cells are representative of at least three independent experiments. |
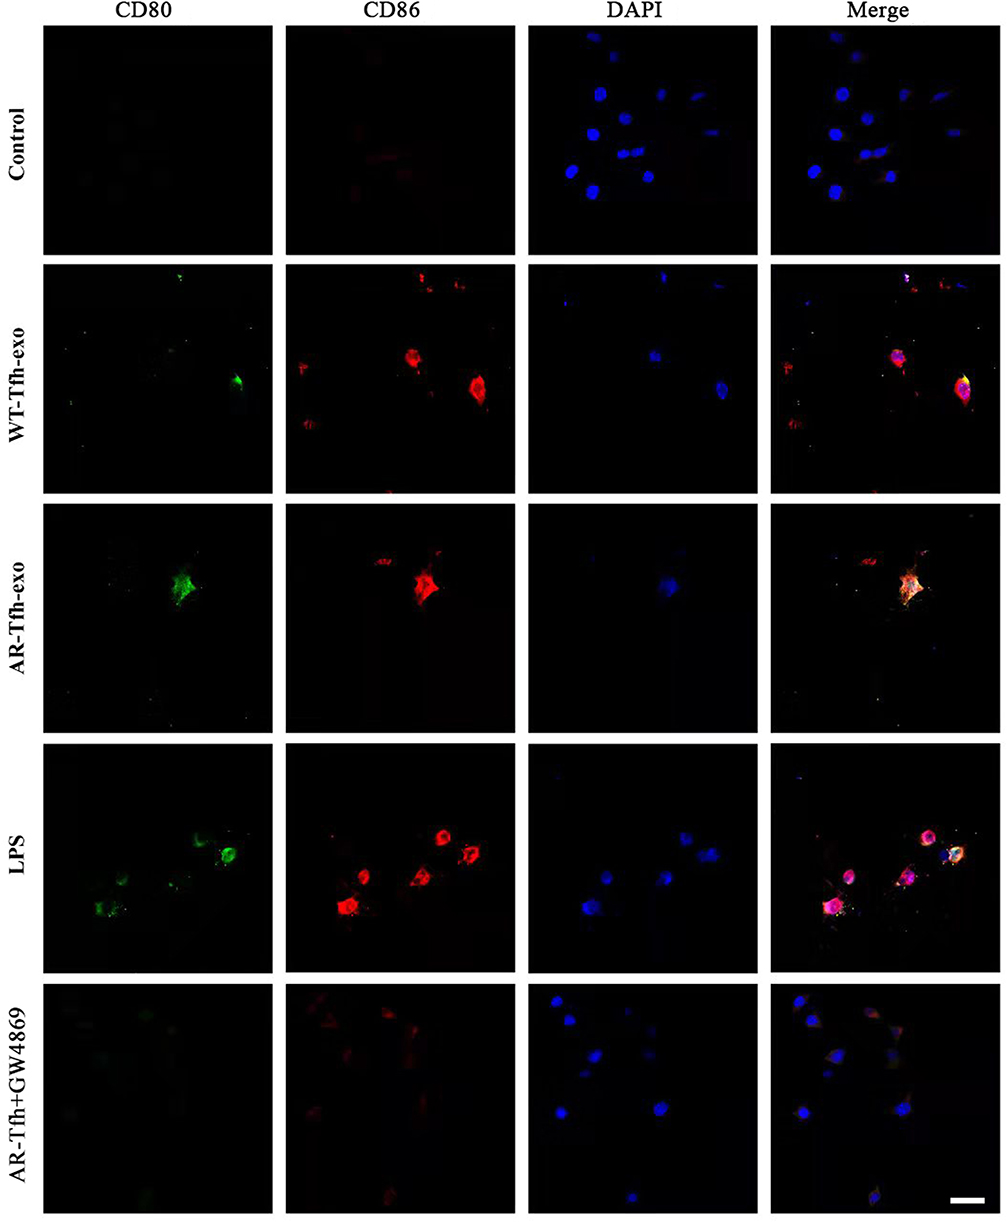 |
Figure 4 Expression of CD80 and CD86 on DC cells under five different conditions. Sections of DCs were stained Immunofluorescence dyes for CD80 (green) and CD86 (red). DAPI was used to stain nuclei (blue). Representative images are shown from at least three independent experiments. Scale bar at the bottom right stands for 50 μm. |
MiR-142-5p is a MicroRNA That is Significantly Decreased in AR-Derived Exosomes and is Involved in the Regulation of DC Maturation
Exosomes contain various proteins, DNA, and RNA enclosed in the phospholipid membrane.28 The RNAs include a variety of non-coding RNAs, such as miRNA, long-chain non-coding RNA, that are known to influence DC maturation.29–31 Therefore, we hypothesized that non-coding RNAs in exosomes in AR-derived Tfhs play a key role in DC maturation. Therefore, in a first attempt to screen the non-coding RNAs in exosomes related to DC maturation, RNA was extracted from exosomes and microRNA sequencing was performed using RNA-Seq to identify the differentially expressed microRNAs in exosomes of Tfhs derived from AR vs control WT mice. And miR-142b was isolated as a differentially expressed microRNA. Among the differentially expressed miRNA genes identified, the down-regulated miR-142b gene (Figure 5A) attracted our attention. The miR-142b gene has the same sequence as miR-142-5p and miR-142-5p has been studied by our laboratory as a miRNA playing a crucial role in acquired middle ear cholesteatoma.32 Therefore, miR-142-5p is the subject of subsequent analysis. First, by using RT-qPCR, it was found that the expression level of miR-142-5p in exosomes from AR group was significantly lower than that in the control WT group (Figure 5B). Second, in order to verify whether down-regulation of miR-142-5p is related to DC maturation, DCs were transfected with miR-142-5p mimics, mimics negative control (NC), inhibitor, or inhibitor NC (all as mirVanaTM products custom synthesized by Thermo Fisher Scientific). Transfection efficiency using the jetPRIME® Transfection Agent for transfecting DCs was regularly monitored to be between 70% and 90% by monitoring cell fluorescence after transfection fluorescent siRNA (siGLO Cyclophilin B Control siRNA) as described.24 In addition, siRNA knockdown efficiency was measured with each experiment as a proxy for transfection efficiency. After transfection, DC maturation was analyzed by measuring the relative expression level of CD80 and CD86 mRNA using RT-qPCR. The results showed that the relative expression level of CD80 and CD86 in the miR-142-5p mimics group was lower, than that in the mimic NC group. The relative expression of CD80 and CD86 was higher in the miR-142-5p inhibitor group, compared with the inhibitor NC group (Figure 5C). Flow cytometry results showed that the miR-142-5p mimics decrease the proportion of CD80+ CD86+ DCs, 37.7% for mimics vs 42.65% for mimics NC; while the inhibition of miR-142-5p significantly increased the proportion of CD80+ CD86+ DCs, 52.38% for inhibitor vs 44.00% for inhibitor NC (Figure 5D). The results from RT-qPCR and flow cytometry are consistent, suggesting that miR-142-5p in AR-derived exosomes is involved in the regulation of DC maturation.
 |
Figure 5 miR-142-5p in AR mouse-derived exosomes regulated DC maturation. (A) Heat map of differentially expressed miRNAs. The heat map was divided into two columns (left: AR; right: Control). Up- or down-regulation of the miRNAs was represented with red or green color, respectively. A specific miRNA, miR-142b, was down-regulated in AR, as indicated with a yellow arrow. (B) The expression level of miR-142-5p in exosomes of Tfhs from AR vs control mice. (C) Detection of the expression level of CD80 and CD86 in different groups with overexpression or inhibition of miR-142-5p. *** P < 0.001; **** P < 0.0001. (D) Flow cytometry analysis of co-stimulatory molecules CD80, CD86 and MHCII on surface of DCs transfected with miR-142-5p mimics or inhibitors. Dot plots with the label for the proportion of CD80+ CD86+ or MHCII+ cells are representative of at least three independent experiments. |
CDK5, a Target Gene of miR-142-5p, Mediates the Regulation of DC Maturation by miR-142-5p
In an effort to find the target gene of miR-142-5p, TargetScan prediction was performed (https://www.targetscan.org/mmu_80/). CDK5 was identified to be a candidate target gene (Figure 6A). CDK5 is a serine/threonine protein kinase known to play an important role in cell division and transcription regulation through phosphorylation of transcriptional regulator TrkB, NUDEL, and STAT3.33–35 To validate the TargetScan prediction results, a dual luciferase reporter assay was performed. First, HEK293T cells were transfected with two reagents: the miR-142-5p mimic and one of PGL3-Control, PGL3-CDK5-WT (WT vectors in the 3’-UTR region of CDK5), and PGL3-CDK5-MT (mutant vectors in the 3’-UTR region of CDK5). Compared with the PGL3-Control+mimic group, the luciferase activity in PGL3-WT+mimic and PGL3-MT+mimic group was significantly decreased. Compared with the PGL3-MT+mimics group, the luciferase activity of PGL3-WT+mimics group was significantly higher (Figure 6B), suggesting that miR-142-5p directly targets CDK5. To knockdown CDK5 expression, siRNA was used before miR-142-5p expression was detected by RT-qPCR. The results show that the relative expression of miR-142-5p was higher after si-CDK5 knockdown (Figure 6C). Subsequently, CDK5 expression level under the influence of miR-142-5p mimic or inhibition was measured. At both the mRNA level (Figure 6D) and the protein level (Figure 6E), the expression level of CDK5 was significantly higher in the mimic group than the mimic NC group, and significantly lower in the inhibitor group than the inhibitor NC group. These results demonstrate that there is a strong negative correlation between miR-142-5p and CDK5 expression. To determine the relation between CDK5 and DC maturation, CDK5 siRNA was transfected into DCs and the DC maturation was detected by flow cytometry. It was found that the proportion of CD80+ and CD86+ cells were decreased in the si-CDK5 group (Figure 6F), which was consistent with the previous results (Figure 6B–D). Therefore, our conclusion is that CDK5 mediates regulation of DC maturation by miR-142-5p.
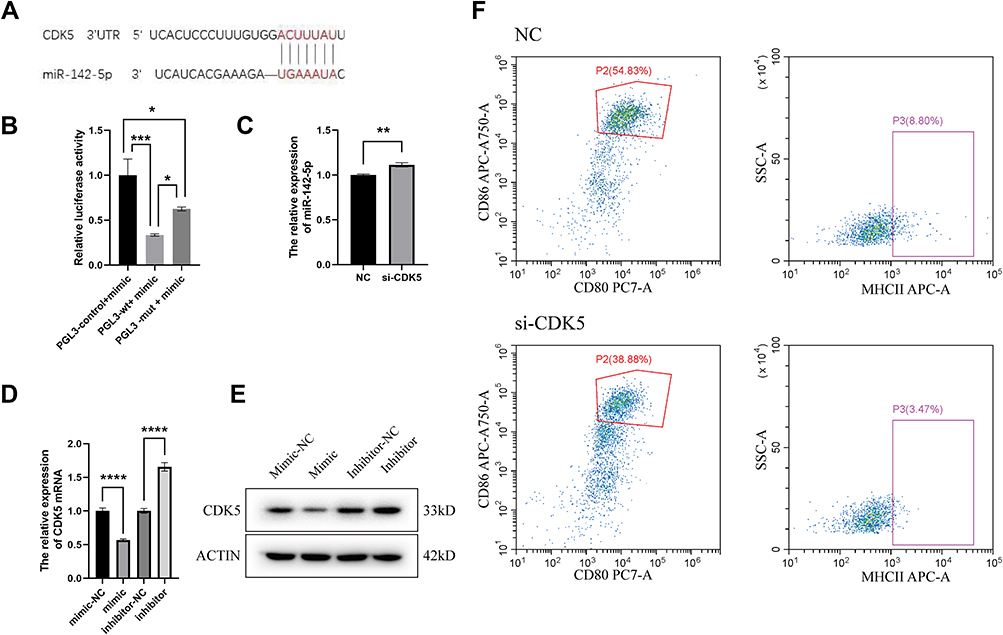 |
Figure 6 miR-142-5p targets CDK5 to mediate the regulation of DC maturation by Tfhs derived from AR mice. (A) The potential miR-142-5p target sites in CDK5 transcript. (B) Levels of relative luciferase activity in HEK293T cells following transfection with PGL-3-control-WT-miR-142-5p mimics, PGL-3-CDK5-WT-miR-142-5p mimics and PGL-3-CDK5-MT-miR-142-5p mimics respectively (1 μg). The relative luciferase activity refers to the ratio of firefly luminescence/renilla luminescence. (C) Relative expression of miR-142-5p after CDK5 knockdown. (D) CDK5 expression level under overexpression or inhibition of miR-142-5p by RT-qPCR. The values shown are mean ± SD of three independent experiments. * P < 0.05; ** P < 0.01; *** P < 0.001; **** P < 0.0001. (E) CDK5 expression level under overexpression or inhibition of miR-142-5p by Western Blot. (F) Flow cytometry assesses the CD80, CD86 and MHCII expression on the surface of DCs by inhibiting CDK5. Dot plots with the label for the proportion of CD80+ CD86+ or MHCII+ cells are representative of at least three independent experiments. |
Tfh-Derived Exosomes Regulate DC Maturation Through miR-142-5p/CDK5/STAT3 Signaling Pathway
The above results showed DC maturation is related to the expression level of miR-142-5p (Figure 5) and CDK5 (Figure 6). Therefore, in an effort to study the relative changes of miR-142-5p and CDK5 expression during DC maturation, the mRNA expression of miR-142-5p and CDK5 was monitored, after DCs were stimulated with LPS. It was found that upon DCs stimulation with LPS from 0 to 24 hours, the expression level of miR-142-5p gradually decreased, while expression of CDK5 increased. Significant changes were observed at 6 h to 12 h and 12 h to 24 h (Figure 7A). It was found that the fluorescence intensities of CD80, CD86 and CDK5 in DCs are increased significantly 24 h after LPS stimulation, and the change of pSTAT3 is also more pronounced than that of STAT3 at the same time point (Supplement Figures 1–3). The Western blot results showed that, consistent with results for the mRNA expression level, upon DCs stimulation with LPS from 0 to 24 hours, the proteins expression level of CDK5 increased over time, while the expression level of the control housekeeping protein, actin, remains stable (Figure 7B). Subsequently, DCs were transfected with miR-142-5p mimic, mimic-NC, inhibitor, or inhibitor-NC. The DCs transfected with mimic or with mimic-NC were also stimulated with LPS. Changes in the activity of STAT3 signaling pathway were measured by detecting the level of STAT3 phosphorylation in Western blot. A significant increase in STAT3 phosphorylation was observed in the inhibitor group, while the opposite result was observed in the mimic group (Figure 7C). The effect of LPS in inducting STAT3 phosphorylation was suppressed by miR-142-5p mimic. In another experiment, DCs were not transfected (control), transfected with miR-142-5p mimic, or miR-142-5p inhibitor with or without si-CDK5. DCs were also stimulated with LPS with or without si-CDK5 transfection. The results indicated that CDK5 knockdown using si-CDK5 attenuated STAT3 protein phosphorylation which is caused by miR-142-5p inhibitors or by LPS stimulation (Figure 7D). The results indicated that STAT3 signaling pathway can be activated by CDK5. Finally, flow cytometry results indicated that the expression level of CD80 and CD86 was decreased in the presence of Stattic (a STAT3 phosphorylation inhibitor), and was increased in the presence of Colivelin TFA (a STAT3 activator) (Figure 7E), which strongly suggested that activation of the STAT3 signaling pathway was required for DC maturation.
 |
Figure 7 Tfh-derived exosomes promote DC cell maturation through miR-142-5p/CDK5/STAT3 pathway. (A) Relative expression of miR-142-5p and CDK5 in DCs upon LPS stimulation at different time points. The values shown are mean ± SD of three independent experiments. ** P < 0.01; **** P < 0.0001. (B) CDK5 expression level changed with prolonged LPS stimulation. (C) Detection of STAT3 phosphorylation in overexpression and inhibition of miR-142-5p. (D) Detection of STAT3 phosphorylation in inhibition of miR-142-5p with or without si-CDK5. (E) Expression of CD80 and CD86 on DCs with STAT activator or STAT inhibitor and LPS stimulation for different times. Dot plots with the label for the proportion of CD80+ CD86+ or MHCII+ cells are representative of at least three independent experiments. |
The Effect of AR-Derived Tfh Exosomes on Occurrence of AR
In order to verify the effect of exosomes of AR-derived Tfhs on AR in vivo, healthy C57BL/6J mice were either not treated (negative control WT), treated with exosomes extracted from Tfhs of WT or AR mice, or treated with OVA to induce AR. Hematoxylin and eosin staining results showed that the extent of mucosal thickening and nasal mucosal inflammation in the AR-Tfh-exosomes group and OVA group, were more severe than those of WT group and WT-Tfh exosomes group. The yellow arrow indicates areas of intense dark blue staining in AR group, representing mucosal thickening and aggregation of inflammatory cells such as eosinophils or neutrophils, which are features of AR. Overall, AR-Tfh-exosome group image has the most intense dark blue staining, while OVA group has the second most intense dark-blue staining and the other two group has only light blue staining (Figure 8A). Flow cytometry and RT-qPCR were performed on the nasal cavity lavage fluid cells. And it was found that the results of CD80 and CD86 levels in the four groups were consistent with the results from hematoxylin and eosin staining, with expression levels of CD80 and CD86 the highest in the AR-Tfh-exosomes group (Figure 8B–C). To detect whether AR-derived Tfh exosomes affect the differentiation of naive T cells in mouse nasal mucosa, the serum levels of inflammatory factors IFN-γ, total IgE, IL-13 and IL-17 were measured using ELISA. The results showed that the level of IL-13 and total IgE that correspond to Th2-type differentiation was significantly higher in the AR-Tfh exosomes group than in the WT-Tfh exosomes group, while the levels of IFN-γ (correspond to Th1-type) and IL-17 (correspond to Th17-type) were significantly lower in the AR-Tfh exosomes group than in the WT-Tfh exosomes group (Figure 8D). The results indicated that AR-derived Tfh exosomes cause imbalance of naive T cells differentiation, mainly by promoting Th2-type inflammation.
 |
Figure 8 Results from an in vivo experiment showing the effect of AR-derived Tfh exosomes on occurrence of AR. (A) Hematoxylin and eosin staining of nasal mucosal from different group of mice. Scale bars at the bottom right of each image represent 50 µm. The area of mucosal thickening and inflammation appeared as dark blue area in the image, with one area indicated with a yellow arrow. (B) The relative mRNA expression of CD80 and CD86 in mouse nasal mucosa of various groups. The data shown are mean ± standard error of at least 3 independent experiments. (C) Flow cytometry results of the co-stimulatory molecules CD80, CD86 and MHCII in DCs. Dot plots with the label for the proportion of CD80+ CD86+ or MHCII+ cells are representative of at least three independent experiments. (D) Inflammatory factors including IFN-γ, IgE, IL-13 and IL-17 are studied in the serum of mice of various group. ** P < 0.01; *** P < 0.001; **** P < 0.0001. |
Discussion
In our study, a murine AR model was induced by challenging with OVA. Tfhs derived from AR mice were found to effectively promote DC maturation in an in vitro Transwell co-culture system (Figure 1). In the Transwell system, Tfhs were seeded at the upper chamber of the 24-well Transwell with a density of 1.5 × 10⁵ cells/well, while DCs were seeded at the bottom with a density of 1.5 × 10⁶ cells/well (Figure 1B). The ratio of their densities is 1:10 for Tfhs: DCs. Such a density ratio is not uncommon in experiments involving Transwell co-culture system. In one report, monocytes (comparable to DCs) were co-cultured with T cells (comparable to Tfhs) at a ratio of 5 to 10 monocytes per T cell.36 In another report, B cells and DCs were co-cultured with DCs. B cells were plated with a plating density of 0.5 × 10⁶ in 100 μL in the upper chamber, and DCs were plated with a density of 0.5 × 10⁶ in 600 μL at the bottom, which correspond to a ratio of 1:6.37 In yet another report, the ratio of mesenchymal stem cells to DCs in a co-culture experiment was 1:5.38 Transwell system is a “co-culture system that have long been used to study the interactions between cell populations”.39 Our explanation for using a 1:10 ratio is Transwell system is mimicking the natural system. The miR-142-5p/CDK5/STAT3 pathway is a signaling pathway and a natural signaling pathway is known to amplify signals when signals are transmitted from one step to the next due to many steps being enzymatic.40 Thus, one Tfh cell is capable of activating multiple DCs.
The scanning electron microscopy results showed that the morphology of the exosomes from WT and AR mice was indistinguishable from each other (Figure 3A). Thus, we ask this question: what is it in AR exosomes that makes AR exosomes different from WT exosomes? RT-qPCR results showed that the expression level of miR-142-5p in exosomes of AR group was significantly lower than that of the control WT group (Figure 5B). Such a difference in miR-142-5p level resulted in many consequences. First, the expression level of CD80 mRNA in the AR-Tfh-exosomes group was higher than that in WT-Tfh-exosomes group, whereas the expression level of CD86 mRNA in the AR-Tfh-exosomes group was similar to that in WT-Tfh-exosomes group (Figure 3B). Second, flow cytometry showed that, compared with the WT-Tfh-GW4869 group, the AR-Tfh-exosomes group had a higher proportion of CD80+ CD86+ DCs (43.24% for AR vs 41.96% for WT) and MHCII+ DCs (14.89% for AR vs 12.21% for WT) (Figure 3C). Therefore, our interpretation is that the fact that exosomes from AR mice are better at promoting DC maturation than exosome from WT mice (Figure 3B–C) is because miR-142-5p expression is decreased in AR mice (Figure 5B), resulting in an increase in CDK5 expression and an increase in Stat3 phosphorylation. In other words, when mice develop AR, there is no change in exosome morphology, but rather in exosome contents (specifically, miR-142-5p level) that make the difference. The role of miR-142-5p is allergy, and inflammation has been reported. In one report, miR-142-5p is shown to mediate abnormal T cell differentiation by interacting with SOCS1 and TGFBR-1 transcripts, and then participate in the occurrence of autoimmune neuroinflammation. Increased expression of miR-142-5p in glial cells and immune cells after traumatic brain injury led to neuroinflammation.41 Our results for the role of miR-142-5p are consistent with the report.
Besides miR-142-5p, many other non-coding RNA in exosome may also play a role in AR and other allergic diseases. GAS5, a long non-coding RNA derived from the exosomes of mucosal epithelial cells of AR patients, induced Th1/Th2 differentiation of naive CD4+ T cells, thereby inhibiting the transcriptional expression of EZH2 and T-bet proteins and promoting the occurrence of AR.42 Another miRNA, miR-146a-5p, released from the exosomes of mesenchymal stromal cells was reported to prevent airway inflammation induced by the second group of innate lymphocytes (ILC2).43 Besides miR-142-5p, our RNA-Seq study has identified many up-regulated and down-regulated miRNA genes (Figure 5A), and further studied should be carried out on these miRNA to gain more insight into signaling pathway regulating AR.
Our results demonstrated of miR-142-5p from Tfh exosomes promote DC maturation through CDK5-STAT3 pathway (Figure 6–7). Our previous study of miR-142-5p indicated that miR-142-5p plays a crucial role in acquired middle ear cholesteatoma (AMEC) via CDK5.32 CDK5 is a serine/threonine protein kinase known to play an important role in cell division and transcription regulation through phosphorylation of transcriptional regulators TrkB, NUDEL, and STAT3.33–35 In one report, CDK5-STAT3 pathway is activated in response to sciatic nerve injury and participates in axon regeneration upon peripheral nerve injury.34 Abnormal CDK5 expression lead to cellular inflammation, altered cell metabolism, and abnormal cell growth.1,19 CDK5 regulates phosphorylation of various proteins involved in neurodegenerative diseases, such as Alzheimer’s disease.44 In addition, CDK5 regulated mitochondrial activity through phosphorylation of STAT3 in neuron axons, which promoted the regeneration of axons. Phosphorylation of STAT3 also led to inhibition of topoisomerase I, which induced the up-regulation of CDK5.45 CDK5 regulated MAPK phosphorylation and affected IL-10 expression in LPS-induced macrophages. CDK5 can also regulate the expression of PDL1 and affect the maturation of DCs in CRSwNP.46 Taken together, these studies indicate the important role CDK5 plays in inflammatory diseases. Since the pathway of CDK5-STAT3 in AR has not been reported, our finding that miR-142-5p in AR-derived Tfh exosomes promotes DC maturation through regulation of CDK5/STAT3 pathway shed new light into the etiology of AR.
Conclusion
Our study revealed an important role of Tfh-derived exosomes in the pathogenesis of AR, in which the miR-142-5p/CDK5/STAT3 signaling pathway axis plays a key role in the maturation of DCs. Based on these findings, a novel strategy for the diagnosis and treatment of AR by targeting the miR-142-5p/CDK5/STAT3 signaling pathway may be proposed.
Ethics Approval and Consent to Participate
The animal study was reviewed and approved by the Ethics Committee of the Affiliated Hospital of Shandong First Medical University (No. 2020-443). The treatment and welfare of laboratory animals followed the national guideline #GB/T35892-2018. No human study was involved in this research. And no potentially identifiable human images or data are presented in this study.
Acknowledgments
This work was supported by the grants from the Medical Science and Technology Innovation Center, Shandong First Medical University & Shandong Academy of Medical Sciences, the National Natural Science Foundation of China (#81770979, #81900922), Natural Science Foundation of Shandong Province (#ZR2019BH019), Joint Fund of Shandong Province (#ZR202108050034) and Taishan Scholar Foundation of Shandong Province (#tsqn201812134).
Author Contributions
TZX and ZXC designed the study, analyzed the data, and wrote the manuscript. XRT performed most of the experiments. ZFY assisted with the generation of reagents and analysis of data. BX and GN provided reagents and participated in the preparation of the manuscript. SL and QWW worked supportively on the aspects of performing experiments. XM and LCC supervised the whole process. All authors made a significant contribution to the work reported, whether that is in the conception, study design, execution, acquisition of data, analysis and interpretation, or in all these areas; took part in drafting, revising or critically reviewing the article; gave final approval of the version to be published; have agreed on the journal to which the article has been submitted; and agree to be accountable for all aspects of the work.
Disclosure
The authors declare that they have no competing interests.
References
1. Lambrecht B. Dendritic cells and the regulation of the allergic immune response. Allergy. 2005;60(3):271–282. doi:10.1111/j.1398-9995.2005.00708.x
2. Van Rijt LS, Jung S, KleinJan A, et al. In vivo depletion of lung CD11c+ dendritic cells during allergen challenge abrogates the characteristic features of asthma. J Exp Med. 2005;201(6):981–991. doi:10.1084/jem.20042311
3. Kimber I, Cumberbatch M. Dendritic cells and cutaneous immune responses to chemical allergens. Toxicol Appl Pharmacol. 1992;117(2):137–146. doi:10.1016/0041-008X(92)90230-P
4. Froidure A, Shen C, Pilette C. Dendritic cells revisited in human allergic rhinitis and asthma. Allergy. 2016;71(2):137–148. doi:10.1111/all.12770
5. Eifan AO, Durham SR. Pathogenesis of rhinitis. Clin Exp Allergy. 2016;46(9):1139–1151. doi:10.1111/cea.12780
6. KleinJan A, Willart M, van Rijt LS, et al. An essential role for dendritic cells in human and experimental allergic rhinitis. J Allergy Clin Immunol Pract. 2006;118(5):1117–1125. doi:10.1016/j.jaci.2006.05.030
7. Takamura K, Fukuyama S, Nagatake T, et al. Regulatory role of lymphoid chemokine CCL19 and CCL21 in the control of allergic rhinitis. J Immunol. 2007;179(9):5897–5906. doi:10.4049/jimmunol.179.9.5897
8. Yao Y, Wang ZC, Yu D, Liu Z. Role of allergen-specific T-follicular helper cells in immunotherapy. Curr Opin Allergy Clin Immunol. 2018;18(6):495–501. doi:10.1097/ACI.0000000000000480
9. Yao Y, Chen Z, Zhang H, et al. Selenium-GPX4 axis protects follicular helper T cells from ferroptosis. Nat Immunol. 2021;22(9):1127–1139. doi:10.1038/s41590-021-00996-0
10. Tangye SG, Ma CS, Brink R, Deenick EK. The good, the bad and the ugly - TFH cells in human health and disease. Nat Rev Immunol. 2013;13(6):412–426.
11. Kemeny DM. The role of the T follicular helper cells in allergic disease. Cell Mol Immunol. 2012;9(5):386–389. doi:10.1038/cmi.2012.31
12. Liang HE, Reinhardt RL, Bando JK, Sullivan BM, Ho IC, Locksley RM. Divergent expression patterns of IL-4 and IL-13 define unique functions in allergic immunity. Nat Immunol. 2012;13(1):58–66. doi:10.1038/ni.2182
13. Meli AP, Fontés G, Soo CL, King IL. T follicular helper cell–derived IL-4 is required for IgE production during intestinal helminth infection. J Immunol. 2017;199(1):244–252. doi:10.4049/jimmunol.1700141
14. Kobayashi T, Iijima K, Dent AL, Kita H. Follicular helper T cells mediate IgE antibody response to airborne allergens. J Allergy Clin Immunol. 2017;139(1):300. doi:10.1016/j.jaci.2016.04.021
15. Noble A, Zhao J. Follicular helper T cells are responsible for IgE responses to Der p 1 following house dust mite sensitization in mice. Clin Exp Allergy. 2016;46(8):1075–1082. doi:10.1111/cea.12750
16. Marschall P, Wei R, Segaud J, et al. Dual function of Langerhans cells in skin TSLP-promoted TFH differentiation in mouse atopic dermatitis. J Allergy Clin Immunol Pract. 2021;147(5):1778–1794. doi:10.1016/j.jaci.2020.10.006
17. Zhang J, Li S, Li L, et al. Exosome and exosomal microRNA: trafficking, sorting, and function. Genomics Proteomics Bioinformatics. 2015;13(1):17–24. doi:10.1016/j.gpb.2015.02.001
18. van Balkom BW, de Jong OG, Smits M, et al. Endothelial cells require miR-214 to secrete exosomes that suppress senescence and induce angiogenesis in human and mouse endothelial cells. Blood. 2013;121(19):3997–4006. doi:10.1182/blood-2013-02-478925
19. Adler HS, Steinbrink K. Tolerogenic dendritic cells in health and disease: friend and foe! Eur J Dermatol. 2007;17(6):476–491. doi:10.1684/ejd.2007.0262
20. Ni Z, Kuang L, Chen H, et al. The exosome-like vesicles from osteoarthritic chondrocyte enhanced mature IL-1beta production of macrophages and aggravated synovitis in osteoarthritis. Cell Death Dis. 2019;10(7):522. doi:10.1038/s41419-019-1739-2
21. Whiteside TL. Exosome and mesenchymal stem cell cross-talk in the tumor microenvironment. Semin Immunol. 2018;35:69–79. doi:10.1016/j.smim.2017.12.003
22. Zheng X, Sun C, Yu R, et al. CD13-specific ligand facilitates Xanthatin nanomedicine targeting dendritic cells for therapy of refractory allergic rhinitis. Int J Pharm. 2020;577:119034. doi:10.1016/j.ijpharm.2020.119034
23. Maskey D, Marlin MC, Kim S, et al. Cell cycle‐dependent ubiquitylation and destruction of NDE 1 by CDK 5‐FBW 7 regulates ciliary length. EMBO J. 2015;34(19):2424–2440. doi:10.15252/embj.201490831
24. Smith N, Vidalain P-O, Nisole S, Herbeuval J-P. An efficient method for gene silencing in human primary plasmacytoid dendritic cells: silencing of the TLR7/IRF-7 pathway as a proof of concept. Sci Rep. 2016;6(1):1–12. doi:10.1038/srep29891
25. Mathieu M, Martin-Jaular L, Lavieu G, Théry C. Specificities of secretion and uptake of exosomes and other extracellular vesicles for cell-to-cell communication. Nat Cell Biol. 2019;21(1):9–17. doi:10.1038/s41556-018-0250-9
26. Raposo G, Nijman HW, Stoorvogel W. B lymphocytes secrete antigen-presenting vesicles. J Exp Med. 1996;183(3):1161–1172. doi:10.1084/jem.183.3.1161
27. Thomou T, Mori MA, Dreyfuss JM, et al. Adipose-derived circulating miRNAs regulate gene expression in other tissues. Nature. 2017;542(7642):450–455. doi:10.1038/nature21365
28. Conde-Vancells J, Rodriguez-Suarez E, Embade N, et al. Characterization and comprehensive proteome profiling of exosomes secreted by hepatocytes. J Proteome Res. 2008;7(12):5157–5166. doi:10.1021/pr8004887
29. Bobrie A, Colombo M, Raposo G, Théry C. Exosome secretion: molecular mechanisms and roles in immune responses. Traffic. 2011;12(12):1659–1668. doi:10.1111/j.1600-0854.2011.01225.x
30. Torralba D, Baixauli F, Villarroya-Beltri C, et al. Priming of dendritic cells by DNA-containing extracellular vesicles from activated T cells through antigen-driven contacts. Nat Commun. 2018;9(1):1–17. doi:10.1038/s41467-018-05077-9
31. Liu J, Zhang X, Chen K, et al. CCR7 Chemokine receptor-inducible lnc-Dpf3 restrains dendritic cell migration by inhibiting HIF-1α-Mediated Glycolysis. Immunity. 2019;50(3):600. doi:10.1016/j.immuni.2019.01.021
32. Sui R, Shi W, Han S, et al. MiR-142-5p directly targets cyclin-dependent kinase 5-mediated upregulation of the inflammatory process in acquired middle ear cholesteatoma. Mol Immunol. 2022;141:236–245. doi:10.1016/j.molimm.2021.11.017
33. Lukasik P, Zaluski M, Gutowska I. Cyclin-Dependent Kinases (CDK) and their role in diseases development-review. Int J Mol Sci. 2021;22(6):2935. doi:10.3390/ijms22062935
34. Hwang J, Namgung U. Cdk5 phosphorylation of STAT3 in dorsal root ganglion neurons is involved in promoting axonal regeneration after peripheral nerve injury. Int Neurourol J. 2020;24(Suppl 1):S19–27. doi:10.5213/inj.2040158.080
35. Hillmer EJ, Zhang H, Li HS, Watowich SS. STAT3 signaling in immunity. Cytokine Growth Factor Rev. 2016;31:1–15. doi:10.1016/j.cytogfr.2016.05.001
36. Eberl M, Roberts GW, Meuter S, et al. Crosstalk of human γδ T cells and monocytes drives the acute inflammation in bacterial infections. PLoS Pathog. 2009;5(2):e1000308. doi:10.1371/journal.ppat.1000308
37. Maddur MS, Sharma M, Hegde P, et al. Human B cells induce dendritic cell maturation and favour Th2 polarization by inducing OX-40 ligand. Nat Commun. 2014;5(1):4092. doi:10.1038/ncomms5092
38. Shi B, Qi J, Yao G, et al. Mesenchymal stem cell transplantation ameliorates Sjögren’s syndrome via suppressing IL-12 production by dendritic cells. Stem Cell Res Ther. 2018;9(1):308. doi:10.1186/s13287-018-1023-x
39. Goers L, Freemont P, Polizzi KM. Co-culture systems and technologies: taking synthetic biology to the next level. J R Soc Interface. 2014;11(96):20140065. doi:10.1098/rsif.2014.0065
40. Lan Y, Papoian GA. The interplay between discrete noise and nonlinear chemical kinetics in a signal amplification cascade. J Chem Phys. 2006;125(15):154901. doi:10.1063/1.2358342
41. Talebi F, Ghorbani S, Chan WF, et al. MicroRNA-142 regulates inflammation and T cell differentiation in an animal model of multiple sclerosis. J Neuroinflammation. 2017;14(1):1–14. doi:10.1186/s12974-017-0832-7
42. Zhu X, Wang X, Wang Y, Zhao Y. Exosomal long non-coding RNA GAS5 suppresses Th1 differentiation and promotes Th2 differentiation via downregulating EZH2 and T-bet in allergic rhinitis. Mol Immunol. 2020;118:30–39. doi:10.1016/j.molimm.2019.11.009
43. Fang SB, Zhang HY, Wang C, et al. Small extracellular vesicles derived from human mesenchymal stromal cells prevent group 2 innate lymphoid cell-dominant allergic airway inflammation through delivery of miR-146a-5p. Journal of Extracellular Vesicles. 2020;9:1723260. doi:10.1080/20013078.2020.1723260
44. Shukla V, Skuntz S, Pant HC. Deregulated Cdk5 activity is involved in inducing Alzheimer’s disease. Arch Med Res. 2012;43(8):655–662. doi:10.1016/j.arcmed.2012.10.015
45. Courapied S, Sellier H, De C, et al. The cdk5 Kinase regulates the STAT3 transcription factor to prevent DNA damage upon Topoisomerase I inhibition *. J Biol Chem. 2010;285(35):26765–26778. doi:10.1074/jbc.M109.092304
46. Liu CC, Zhang HL, Zhi LL, et al. CDK5 Regulates PD-L1 expression and cell maturation in dendritic cells of CRSwNP. Inflammation. 2019;42(1):135–144. doi:10.1007/s10753-018-0879-3
 © 2022 The Author(s). This work is published and licensed by Dove Medical Press Limited. The
full terms of this license are available at https://www.dovepress.com/terms
and incorporate the Creative Commons Attribution
- Non Commercial (unported, 3.0) License.
By accessing the work you hereby accept the Terms. Non-commercial uses of the work are permitted
without any further permission from Dove Medical Press Limited, provided the work is properly
attributed. For permission for commercial use of this work, please see paragraphs 4.2 and 5 of our Terms.
© 2022 The Author(s). This work is published and licensed by Dove Medical Press Limited. The
full terms of this license are available at https://www.dovepress.com/terms
and incorporate the Creative Commons Attribution
- Non Commercial (unported, 3.0) License.
By accessing the work you hereby accept the Terms. Non-commercial uses of the work are permitted
without any further permission from Dove Medical Press Limited, provided the work is properly
attributed. For permission for commercial use of this work, please see paragraphs 4.2 and 5 of our Terms.