Back to Journals » HIV/AIDS - Research and Palliative Care » Volume 12
TB and HIV Epidemiology and Collaborative Service: Evidence from Ethiopia, 2011–2015
Authors Gelaw YA ![]() , Assefa Y, Soares Magalhaes RJ, Demissie M
, Assefa Y, Soares Magalhaes RJ, Demissie M ![]() , Tadele W, Dhewantara PW, Williams G
, Tadele W, Dhewantara PW, Williams G
Received 15 October 2020
Accepted for publication 24 November 2020
Published 3 December 2020 Volume 2020:12 Pages 839—847
DOI https://doi.org/10.2147/HIV.S284722
Checked for plagiarism Yes
Review by Single anonymous peer review
Peer reviewer comments 2
Editor who approved publication: Professor Bassel Sawaya
Yalemzewod Assefa Gelaw,1,2 Yibeltal Assefa,2 Ricardo J Soares Magalhaes,3,4 Minilik Demissie,5 Wegayehu Tadele,5 Pandji Wibawa Dhewantara,3,6 Gail Williams2
1Institute of Public Health, College of Medicine and Health Science, University of Gondar, Gondar 196, Ethiopia; 2School of Public Health, Faculty of Medicine, The University of Queensland, Brisbane, Queensland 4006, Australia; 3UQ Spatial Epidemiology Laboratory, School of Veterinary Science, Faculty of Science, the University of Queensland, Gatton 4343, Queensland, Australia; 4Children’s Health and Environment Program, Child Health Research Centre, Faculty of Medicine, The University of Queensland, Brisbane 4101, Queensland, Australia; 5HIV/AIDS and Tuberculosis Research Directorate, Ethiopian Public Health Institute (EPHI), Addis Ababa, Ethiopia; 6Pangandaran Unit for Health Research and Development, National Institute of Health Research and Development, Ministry of Health of Indonesia, Pangandaran 46396, West Java, Indonesia
Correspondence: Yalemzewod Assefa Gelaw
School of Public Health, Faculty of Medicine, The University of Queensland, 288 Herston Road, Herston, Brisbane, Queensland 4006, Australia
Tel +61-469738918
Email [email protected]
Background: Integrating and scaling up tuberculosis (TB) and HIV services are essential strategies to achieve the combined goals ending both TB and HIV, especially in TB and HIV high burden countries. This study aimed to examine the prevalence of TB and HIV co-infection and the implementation of collaborative services in Ethiopia.
Methods: We used a national sentinel surveillance TB/HIV co-infection collected between 2010 and 2015. The Ethiopian Public Health Institute collected and collated the data quarterly from 79 health facilities in nine regional states and two city administrations.
Results: A total of 55,336 people living with HIV/AIDS were screened for active TB between 2011 and 2015. Of these, 7.3% were found co-infected with TB, and 13% TB-negative PLWHA were on isoniazid preventive therapy. Nine out of ten (89.2%) active TB patients were screened for HIV counselling and 17.8% were found to be HIV positive; 78.2% and 53.0% of HIV/TB co-infected patients were receiving cotrimoxazole preventive therapy and antiretroviral treatment, respectively.
Conclusion: This study showed that the prevalence of TB and HIV co-infection failed to decrease over the study period, and that, while there was an increasing trend for integration of collaborative services, this was not uniform over time. Aligning and integrating TB and HIV responses are still needed to achieve the target of ending TB and HIV by 2030.
Keywords: tuberculosis, TB, HIV, collaborative services, implementations, Ethiopia
Introduction
The risk of developing TB in people living with human immunodeficiency virus (HIV/AIDS) (PLWHA) is approximately 20−30 times higher than in people without HIV, depending on the prevalence of HIV in the general population.1,2 TB and HIV remain major public health challenges, particularly in eastern and southern Africa. It is estimated that about 45% of the world’s new HIV infections and 53% of PLWHA were living in these regions as of 2017.1
Ethiopia is in the highest 30 TB and TB and HIV co-infection countries in the world, with an estimated TB incidence rate of 164 per 100,000 TB, 112/100,00 TB cases within those with HIV.2 According to the Federal HIV/AIDS Prevention and Control Office (HAPCO) estimates, 613,000 adults (0.9% of the adult population) were HIV-positive.3 However, this distribution was highly heterogeneous, with the lowest prevalence (0.1%) in Somali and highest in the Gambela Region (4.8%). The majority of PLWHA were from the Amhara (30%), Oromia (26%) and Addis Ababa (18%) regions.3,4 Research suggests that TB incidence is high in areas where HIV is highly prevalent.5–7
Based on the WHO recommendation, integrated TB and HIV collaborative activities were launched in 2004 and updated in 2012.8 These collaborative activities aimed to reduce the burden of HIV among TB patients and the burden of TB among PLWHA. Since then, the integrated TB and HIV service has expanded to the tertiary, secondary and primary health care levels in Ethiopia.9 However, knowledge regarding the burden of TB and HIV co-morbidity and its collaborative service implementations at regional/city level in the country is limited. Our study aimed to describe the prevalence of TB and HIV co-infection and its collaborative activities at regional/city level using sentinel surveillance data in Ethiopia.
Methods
There were 266 hospitals, 3622 health centres and 16,660 functional health posts (the lowest level health system facility) in 2017 in Ethiopia. These health facilities provide health education, diagnosis and/or treatment for TB prevention and control, HIV counselling and testing (HCT), chronic care and follow-up, treatment adherence and response activities integrated with other healthcare services.10
Design and Data Source
We used a sentinel TB/HIV co-infection surveillance dataset collected quarterly between 2010 and 2015 and collated by the Ethiopian Public Health Institute (EPHI). A total of 79 sentinel sites from 11 regions were included in the surveillance to monitor and evaluate TB and HIV collaborative activities (Figure 1).
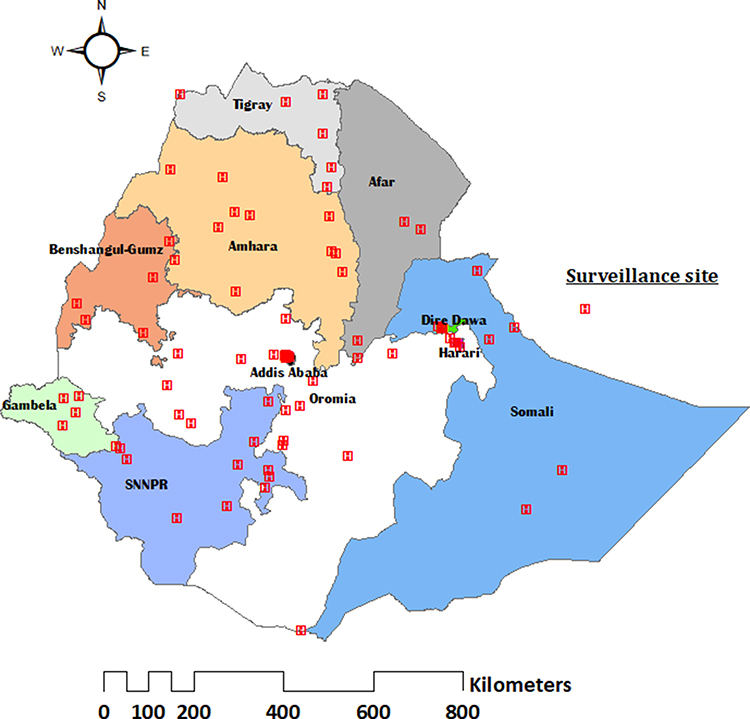 |
Figure 1 TB and HIV co-infection sentinel surveillance sites between 2010 and 2015 in Ethiopia. |
In consultation with Regional Health Bureaus, at least one health facility (Health Centre or Hospital) was included in each Region. The main criteria for the inclusion were: (a) providing TB and HIV care services; (b) representativeness of geographical areas and population groups (for example, urban and rural); (c) burden of TB cases (high); (d) covering high-risk areas; and (e) accessibility for supportive supervision. TB and HIV notification and collaborative activity data were extracted from the routine patient records at the TB and HIV-chronic care follow-up clinics and reported quarterly to the Regional Health Bureaus.11 The database includes WHO collaborative services such as
- The number of PLWHA screened for TB diagnosis and treatment;
- The number of presumptive and diagnosed TB patients screened for HIV counselling and testing;
- The number of TB-negative PLWHA who were put on isoniazid preventive therapy (IPT)
- The number of TB and HIV co-infected patients who received antiretroviral therapy (ART);
- The number of TB and HIV co-infected patients who received cotrimoxazole preventive therapy (CPT).
Management of Tuberculosis and HIV in Ethiopia
Figure 2 presents the national TB and HIV collaborative program flowchart that has been implemented in Ethiopia. The number of health facilities that provide collaborative activities may vary from region to region. The Ethiopia health system has a three-tier care system: tertiary level, secondary level and primary level health care. The lower level includes district hospitals, health centres and health posts.
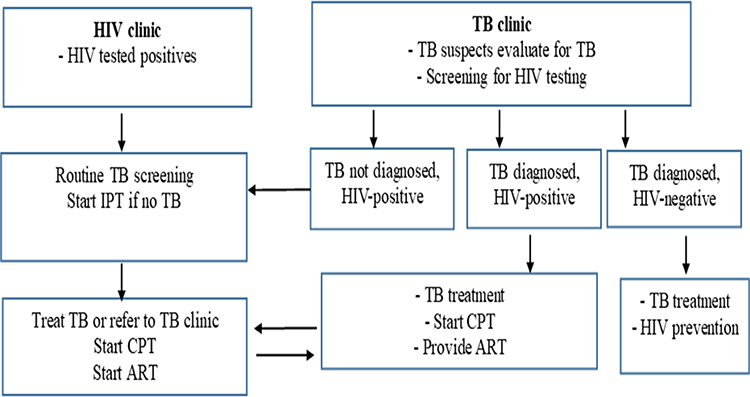 |
Figure 2 Collaborative TB and HIV co-infection management flowchart in Ethiopia. |
The TB and HIV prevention and control activities such as focused health education, counselling, diagnosis and treatment, care and support are provided in routine health care services. Each Kebele (lower administrative units) in the district has at least one health post (lowest health care unit), and each district has a minimum of one health centre, ensuring access to health services for each region.
TB and HIV prevention and control fall within the package of the health extension program. The health extension program provides essential health and medical care within the community via health extension workers, in order to increase access to and coverage of essential health service under the Ethiopia health care system.12 Health extension workers (HEWs) are the lowest level health care provider at the health post level. HEWs are expected to visit all households in their catchment area, to provide health education for TB patients as well as counselling on treatment adherence. They also refer to suspected TB cases or persons with presumptive TB to health centres for further diagnostic tests and treatment.
Measurement, Definitions and Data Analysis
The focus of this study was to describe and explore HIV/TB co-infection notifications and collaborative activities aimed at reducing the burden of TB and HIV in Ethiopia. Measures of collaborative TB and HIV activities were:
- TB and HIV co-infection (%): The number of active TB cases in PLWHA with unknown TB status before testing divided by the total number of PLWHA with unknown TB status per year in each region/city. The same calculation was used for newly diagnosed HIV infections in TB cases.
- HIV screening for TB cases (%): The number of new presumptive and active TB cases screened for HIV divided by the total number of newly enrolled PLWHA per year in each region/city. The same calculation was used for HIV screening for TB cases.
- CPT uptake (%): The number of TB and HIV co-infected patients within the region/city provided with CPT treatment divided by the total new number of TB and HIV co-infected patients per year in each region/city.
- ART coverage (%): The number of PLWHA who started ART within the region/city divided by the total new number of PLWHA per year in each region/city.
- IPT (%): The number of PLWHA with unknown or no active TB who received IPT treatment divided by the total reported the number of PLWHA with no active TB and have not taken IPT before per year in each region/city.
TB and HIV clinics regularly screened PLWHA for TB diagnosis using a bacteriological diagnosis test and/or clinical symptom-based algorithms in the absence of diagnostic test. HIV testing and counselling involves voluntary testing and counselling (VCT), and provider-initiated HIV testing and counselling (PITC) approaches.13 HIV blood tests were performed using KHB, STAT-PAK and Uni-Gold ASSAY.14
The proportions of TB and HIV co-infection and collaborative activities by region for 2011–2015 are described. Graphs, table and choropleth maps are used to present results.
Results
The Burden of TB in PLWHA
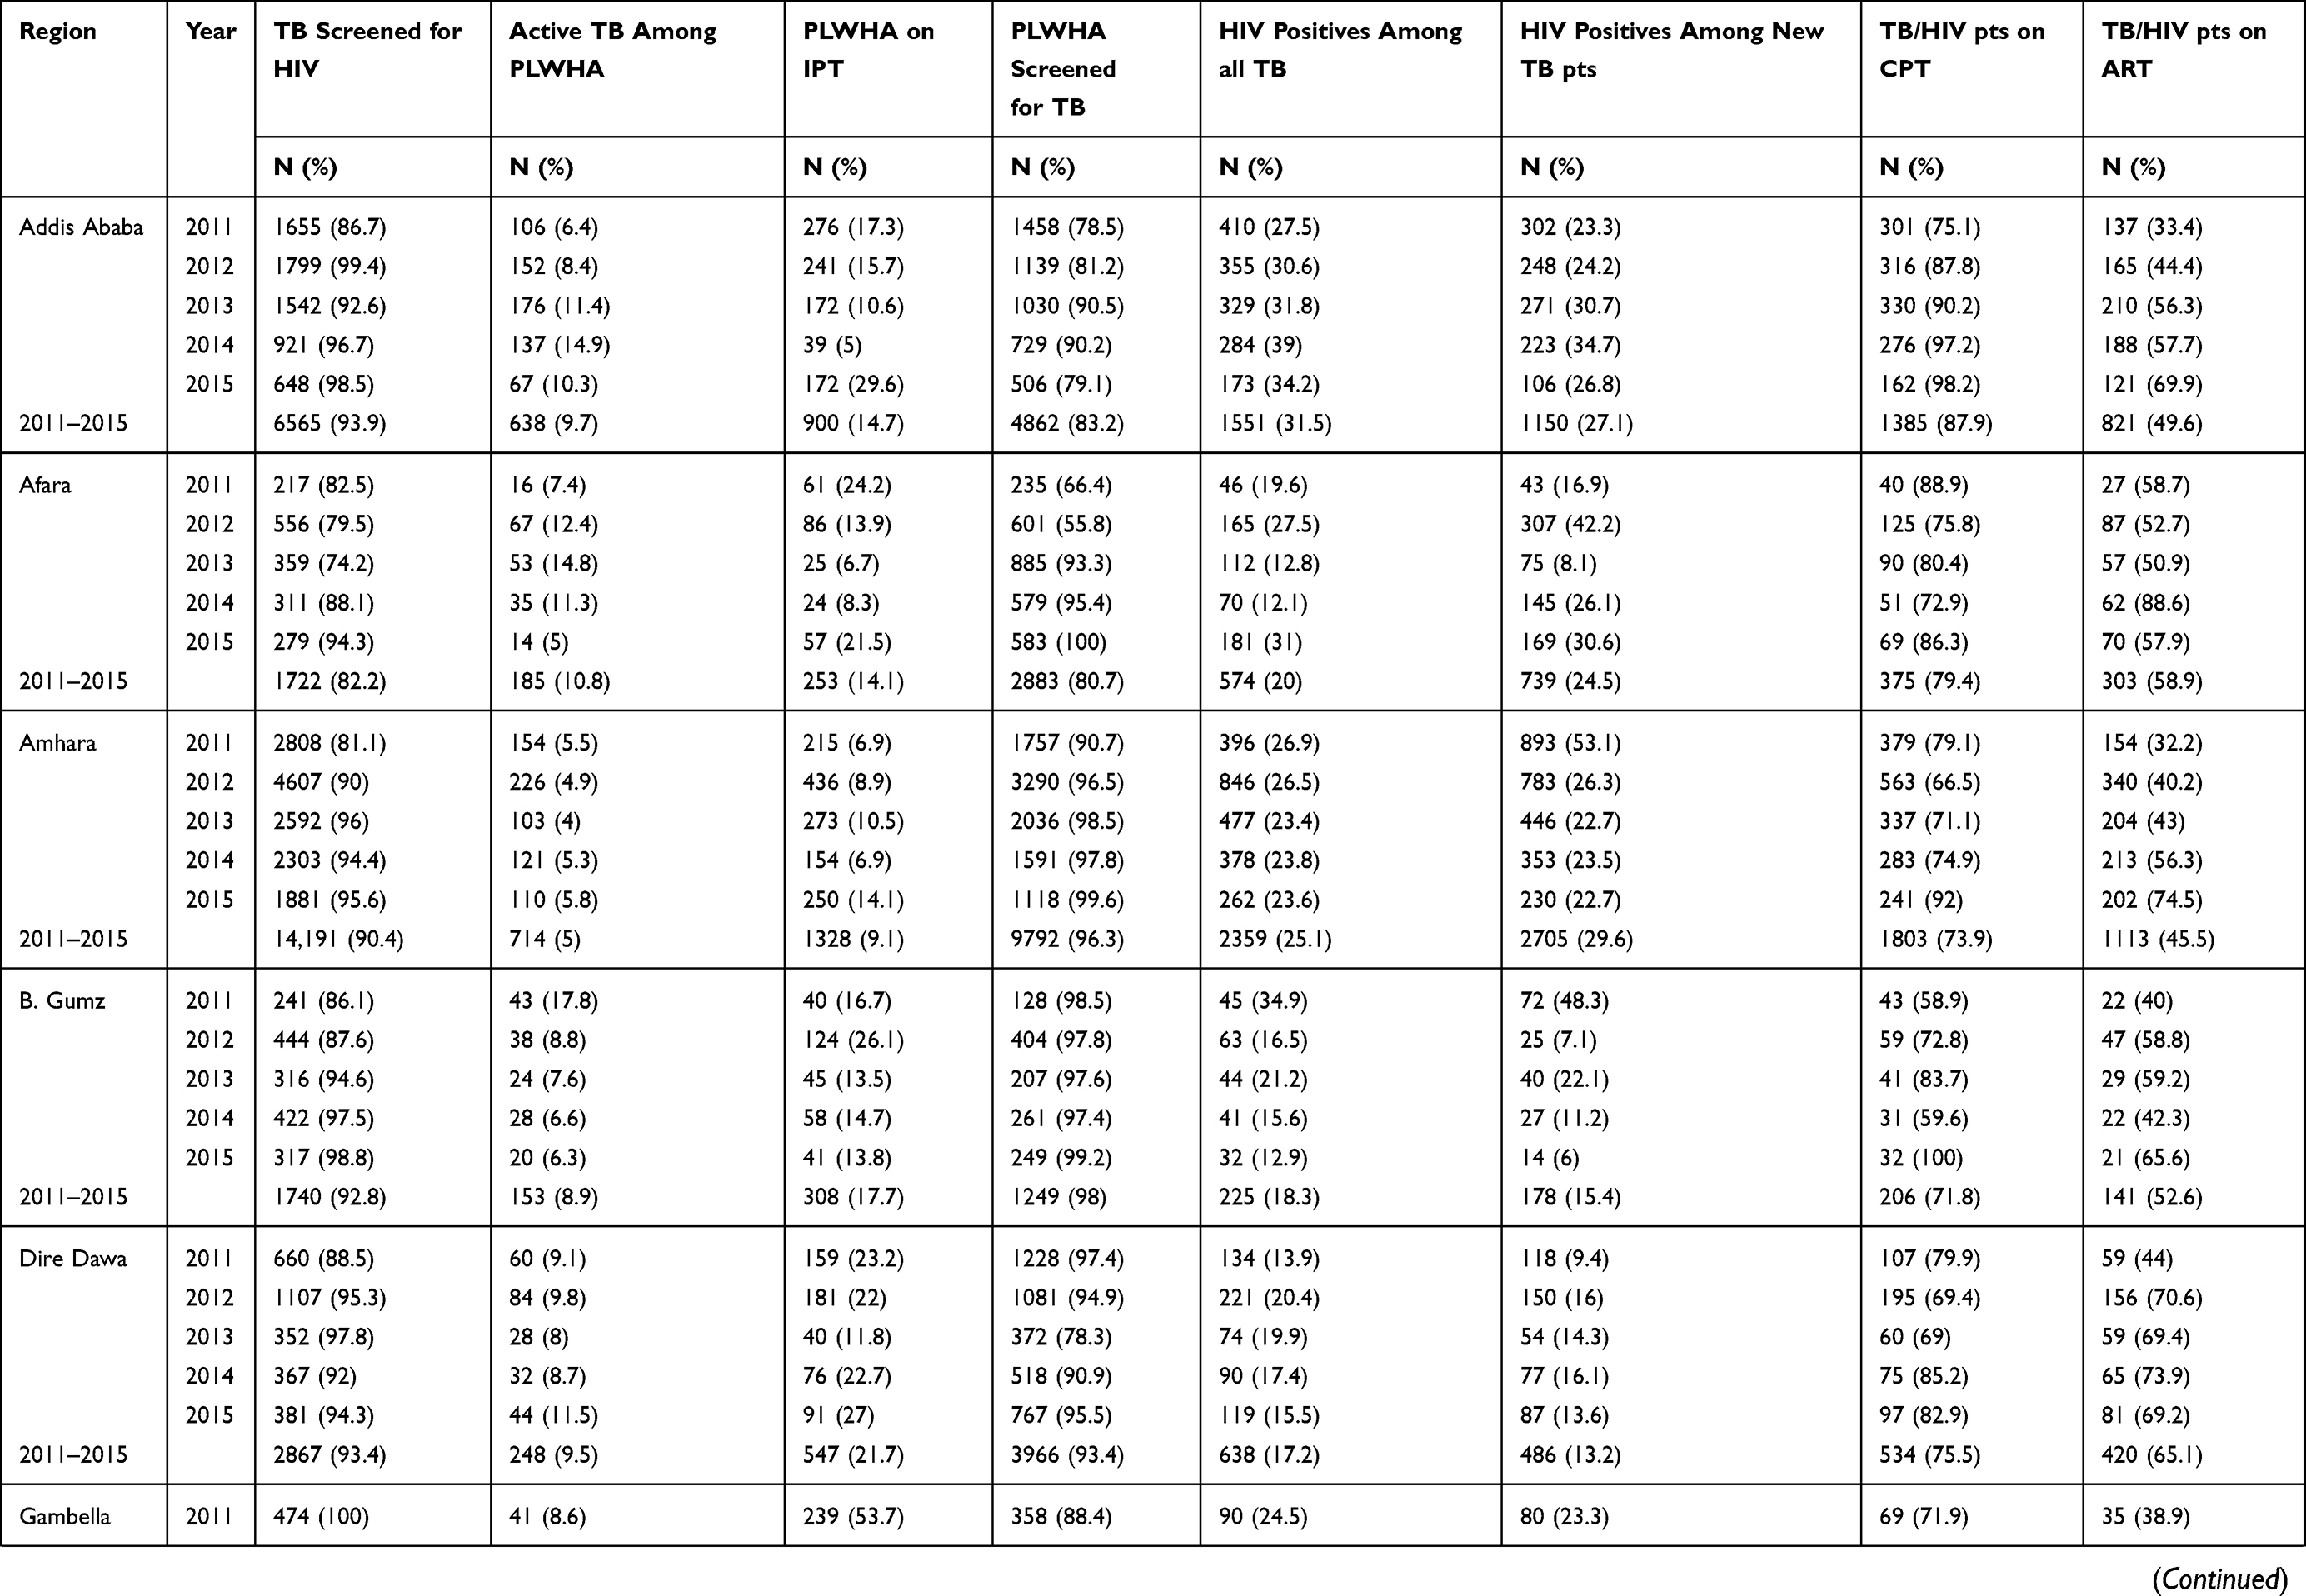
Between 2011 and 2015, there were 59,051 PLWHA in HIV chronic care nationally. Of these, 55,336 (93.7%) were screened for TB, and 3994 (7.3%) were bacteriologically confirmed diagnosed with active TB. The highest prevalences were reported in Afar (10.8%), Somalia (10.5%) and Oromia regions (10.2%). The level of provision of IPT for PLWHA without active TB was low, with about one in seven eligible PLWHA given IPT during the entire survey period (14.0%). The lowest proportion was in Tigray region (4%) (Figure 3, Table 1).
 |
 |
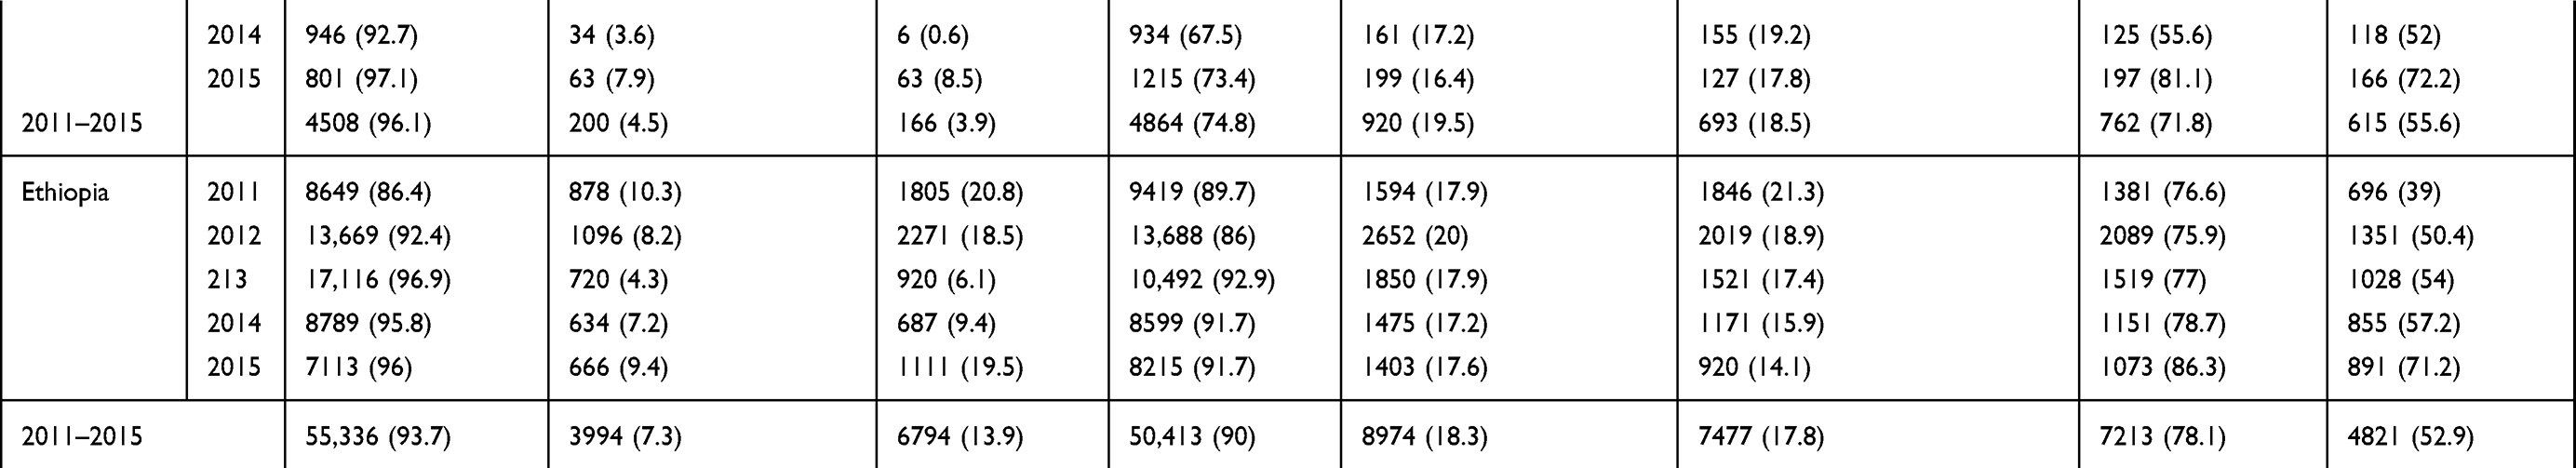 |
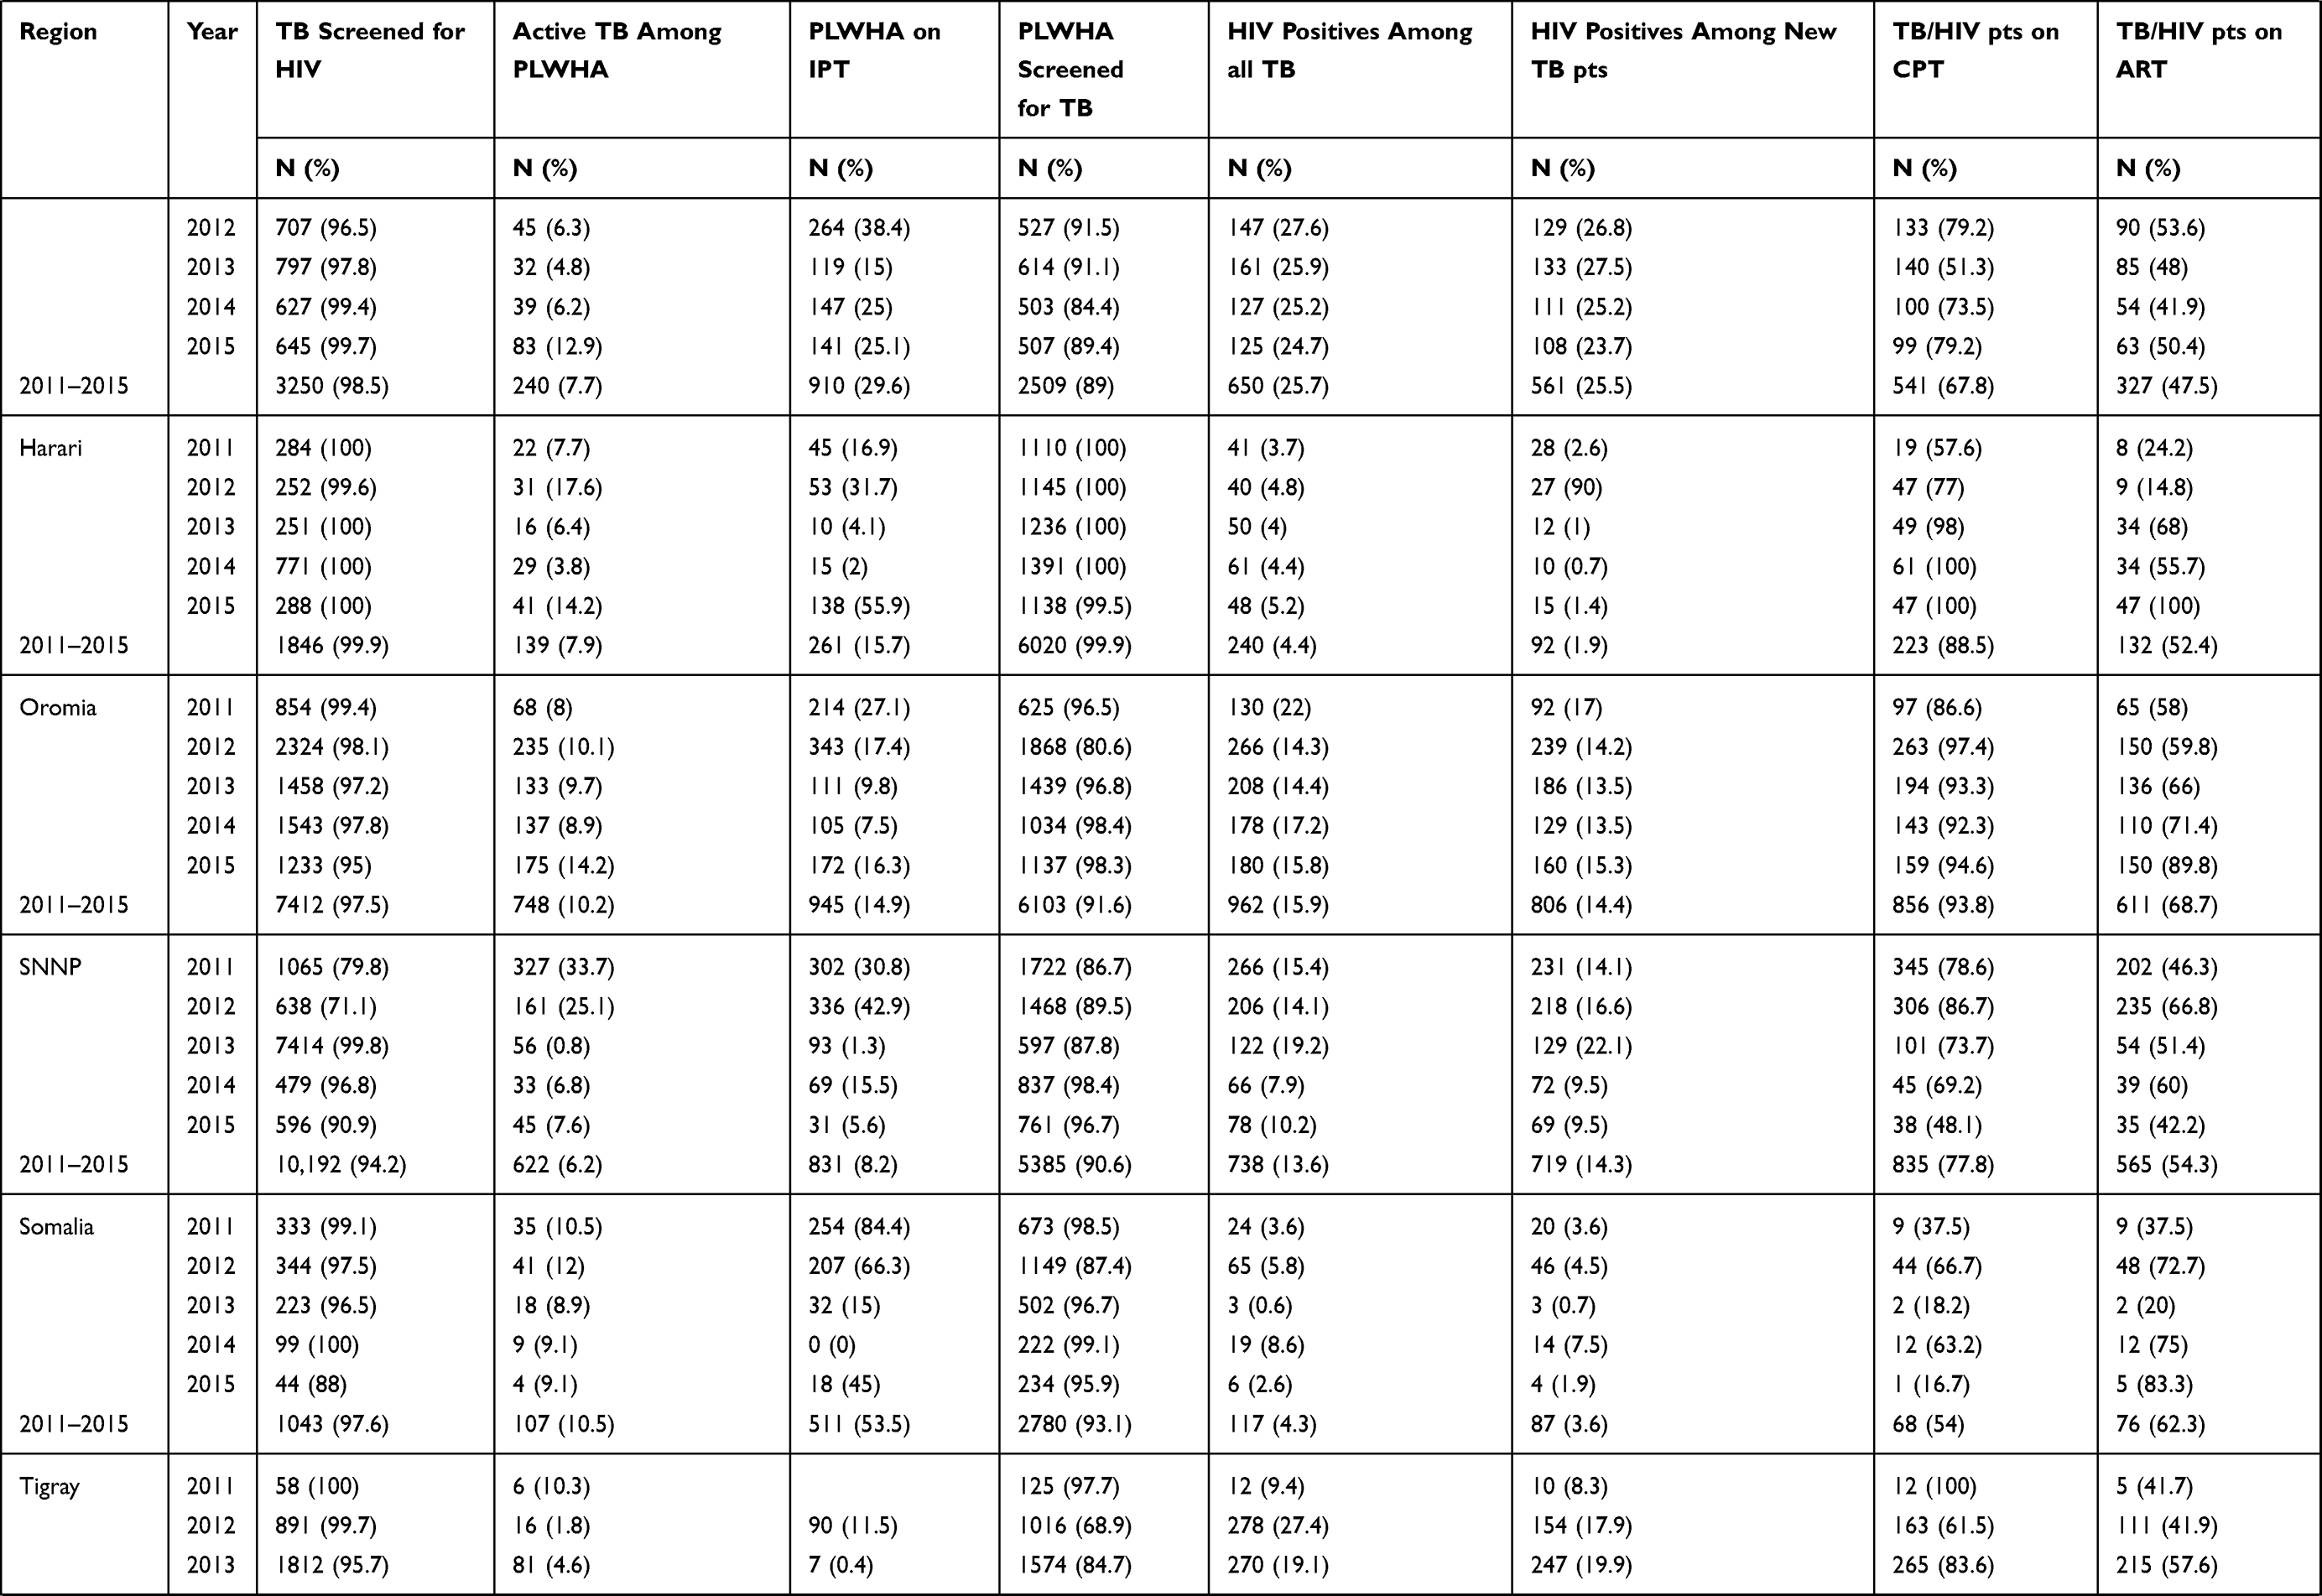
Table 1 Tuberculosis and HIV Co-Infection and Its Collaborative Services in Ethiopia by Region/Cities, 2011–2015 |
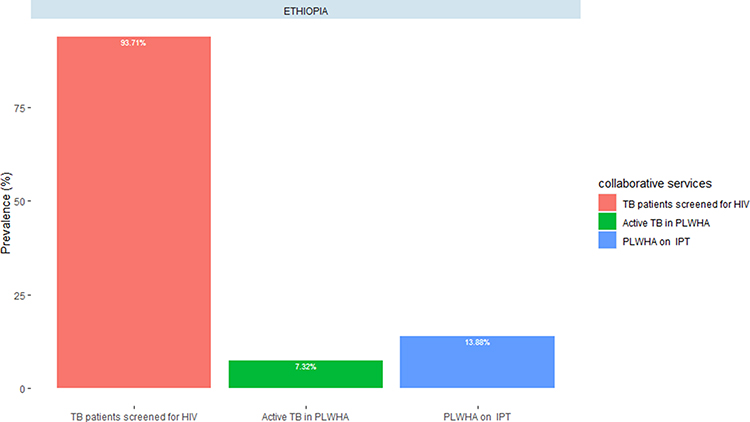 |
Figure 3 Screening of PLWHA for TB (%), the prevalence of active TB in PLWHA (%) and eligible PLWHA who were given IPT (%) in Ethiopia, 2011–2015. |
The Burden of HIV in TB Patients
Among 47,043 active TB cases, 41,958 (89.2%) were screened for HIV, of whom 7477 (17.8%) were found to be HIV positive. Between 2011 and 2015, there was a gradual increase in screening PLWHA for TB, provision of CPT and ART for TB and HIV co-morbid patients; 78.1% HIV/TB co-infected patients were given CPT and 53.0% were given ART (Table 1). HIV prevalence in TB cases varied by region, with the highest and lowest rates of notification in Gambela (30%) and in Tigray region (4.0%), respectively (Figure 4, Table 1).
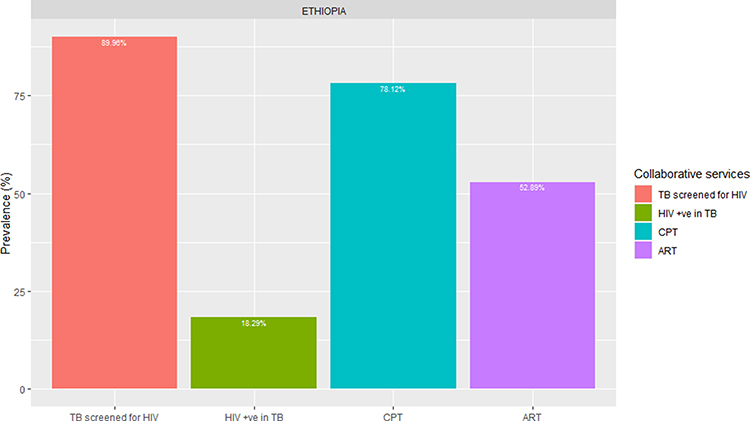 |
Figure 4 The proportion of screening TB patients for HIV, proportions of HIV positives among all and new TB patients, TB/HIV co-infected patients on CPT and ART in Ethiopia, 2011–2015. |
The geographical distribution of TB and HIV co-infection by sentinel sites from 2010 and 2015 is shown in Supplementary materials.
Discussion
Countrywide, 7.3% of PLWHA were found to be co-infected with active TB, and 17.8% of TB patients were newly diagnosed as HIV positive between 2011 and 2015. Overall, the proportion of new TB cases among HIV-positive people decreased over time, but this has varied across regions. This finding is consistent with the national health sector annual performance reports10,15 and successive WHO reports.2 This may be due to the expansion of the integrated TB and HIV collaborative activities, ie, an increasing number of health facilities providing therapeutic (ART) and preventive therapy (IPT).16 The proportion of active TB among PLWHA decreased to 4.6% in 2013 from 10.5% in 2011 and increased to 9.4% in 2015. This may be interpreted in two ways: (i) establishing and strengthening collaborative activities in the high HIV burden regions contributed to a decreasing trend between 2010 and 2013;15 and (ii) the WHO updating of universal guidelines in 2012, recommending the use of ART for all PLHIV co-infected with TB, may have led to improved health-seeking behaviour and intensified case finding.
Previous studies have indicated that the provision of IPT for HIV-positive people significantly reduces active TB.17–20 However, in the present study, the provision of IPT for eligible PLWHA was inadequate. Of 48,957 eligible PLWHA, only 13.2% were given IPT, with the lowest at 4% in Tigray region. This is likely to be due to variation in the prioritisation of programs such as scaling-up ART, IPT and other chronic care activities, which targeted high HIV-burdened areas.21
This study also found that the proportion of HIV infection in TB patients (new and all TB) showed a stable or declining trend during the study period. However, the variability was observed among region/city administrations, ranging from 31% (Addis Ababa) to 4.3% (Somali region) among all TB patients, and from 29.6% (Amhara) to 1.9% (Harari region) among new TB patients. Such variation is consistent with consecutive Ethiopian Ministry of Health annual performance reports,22 published government documents4,23 and research articles.24–26 These differences among regions may also be related to regional variation in TB and HIV responses, HIV burden, knowledge of HIV treatment, the existence of high-risk groups and other socio-economic and environmental factors.4
Overall collaborative TB and HIV services such as the offering of HIV test to TB patients, routinely screening HIV patients for TB and access to ART and CPT treatment increased in 2015 compared with 2011. However, the responses were not consistent across regions/city administrations.24 This could be attributed to variation among TB and HIV co-morbidity notification rates. For example, in the study period, more than half (53%) and one-in-every four (22%) TB and HIV co-infected patients did not have access to ART and CPT, respectively. This indicates a still higher proportion of TB and HIV co-infected patients who may be initiating treatment very late or dying before they can start treatment. Thus, efforts are needed to achieve the target of reducing TB-related deaths among PLWHA by enabling all people with TB to receive preventive or therapeutic treatment. Improved HIV and TB responses are important to reduce the burden of TB among HIV patients, and vice versa.27,28
The strength of this study is that it is the first of its kind to use nationally representative surveillance data to describe and assess the epidemiology of TB and HIV co-infection and the integration of services in relation to progress towards achieving the end-TB epidemic initiatives of the WHO. There are, however, some limitations which should be considered when interpreting the results. First, the data were health-facility based; therefore, the data could lack completeness, timely reporting, reliability and validity.20,21 For example, there were no IPT records for 2011 and 2012 in the Tigray region. Second, notification data were used, ie, HIV and TB co-infected individuals who did not access HCT or TB diagnosis during the survey period might be unreported. Access to TB diagnosis and HCT may vary across sentinel sites leading to variation in reporting of TB and HIV co-infection. Therefore, the report should be interpreted with caution. Thus, the data may not represent the actual burden of TB and HIV co-infection and its collaborative services implementations of the regions and the country.
In conclusion, implementing collaborative TB and HIV services is essential to achieve the end-TB epidemic strategies even though these are not uniform or consistently implemented across the country. Some form of an effort to scale-up the integration of collaborative TB and HIV activities is required to reduce the burden of co-infections. Furthermore, strengthening the surveillance system and conducting epidemiological studies on a small scale could be influential in identifying a high-risk population and thus areas for targeted prevention, and control programs to reduce the dual burden of TB and HIV in Ethiopia.
Ethical Approval
Ethical approval was obtained from the School of Public Health, University of Queensland, and permission to access the data was obtained from the Ethiopian Public Health Institute (EPHI). Our data did not contain individual records. All data accessed complied with relevant data protection and privacy regulations of Helsinki Declaration in research.
Acknowledgment
We thank the Ethiopian Public Health Institute (EPHI) for providing access to the data to carry out this study. This study is based on my PhD thesis.29
Author Contributions
YAG conceived the research question, performed data analysis, interpreted data and drafted the manuscript. All authors made substantial contributions to conception and design, acquisition and interpretation of data; took part in drafting the article or revising it critically for important intellectual content; have agreed to submit to the current journal; gave final approval of the version to be published; agree to be accountable for all aspects of the work.
Disclosure
The authors report no conflicts of interest for this work.
References
1. UNAIDS. UNAIDS Data 2018; 2018.
2. World Health Organization. Global Tuberculosis Report 2018; 2018.
3. Federal HIV/AIDS Prevention and Control Office (FHAPCO). Country Progress Report on the HIV Response, 2014. FHAPCO, editor. Addis Ababa; 2014.
4. Central Statistical Agency [Ethiopia] and ICF International. Ethiopia Demographic and Health Survey 2016: HIV Report [Ethiopia] and ICF. Addis Ababa, Ethiopia and Rockville, Maryland, USA: CSA and ICF; 2018.
5. Belay M, Bjune G, Abebe F. Prevalence of tuberculosis, HIV, and TB-HIV co-infection among pulmonary tuberculosis suspects in a predominantly pastoralist area, northeast Ethiopia. Glob Health Action. 2015;8(1):27949. doi:10.3402/gha.v8.27949
6. Gelaw YA, Williams G, Assefa Y, Asressie M, Soares Magalhães RJ. Sociodemographic profiling of tuberculosis hotspots in Ethiopia, 2014–2017. Trans R Soc Trop Med Hyg. 2019;113:379–391. doi:10.1093/trstmh/trz017
7. Mekonnen D, Derbie A, Desalegn E. TB/HIV co-infections and associated factors among patients on directly observed treatment short course in northeastern Ethiopia: a 4 years retrospective study. BMC Res Notes. 2015;8(1):666. doi:10.1186/s13104-015-1664-0
8. World Health Organization. Recommendations of the interim policy on collaborative TB/HIV activities. Weekly Epidemiological Record. 2004;79(01–02):6–11.
9. World Health Organization. Guide to Monitoring and Evaluation for Collaborative TB/HIV Activities–2015. Update: World Health Organization; 2015.
10. Ethiopian Federal Ministry of Health. Health sector transformation plan 1 version 1 annual performance report EFY 2008 (2015/16). Addis Ababa; 2015.
11. Ethiopian Public Health Institute (EPHI). Report on National TB/HIV Sentinel Surveillance. Addis Ababa; 2015.
12. Wang H, Tesfaye R, Ramana G NV. Ethiopia Health Extension Program: An Institutionalised Community Approach for Universal Health Coverage. The World Bank; 2016.
13. Frehiwot N, Mizan K, Seble M, Fethia K, Tekalign M, Zelalem T. National Guidelines for Comprehensive HIV Prevention, Care and Treatment. Addis Ababa: Ministry of Health; 2014.
14. World Health Organization. Service Delivery Approaches to HIV Testing and Counselling (HTC); A Strategic HTC Programme Framework. Geneva: WHO; 2012.
15. Federal Democratic Republic of Ethiopia. Country Progress Report on the HIV Response, 2014. Addis Ababa; 2014.
16. Gupta S, Abimbola T, Suthar A, Bennett R, Sangrujee N, Granich R. Cost-effectiveness of the three I’s for HIV/TB and ART to prevent TB among people living with HIV. Int J Tuberculosis Lung Disease. 2014;18(10):1159–1165. doi:10.5588/ijtld.13.0571
17. Ahmed A, Mekonnen D, Shiferaw AM, Belayneh F, Yenit MK. Incidence and determinants of tuberculosis infection among adult patients with HIV attending HIV care in north-east Ethiopia: a retrospective cohort study. BMJ Open. 2018;8(2):e016961. doi:10.1136/bmjopen-2017-016961
18. Semu M, Fenta TG, Medhin G, Assefa D. Effectiveness of isoniazid preventative therapy in reducing incidence of active tuberculosis among people living with HIV/AIDS in public health facilities of Addis Ababa, Ethiopia: a historical cohort study. BMC Infect Dis. 2017;17(1):5. doi:10.1186/s12879-016-2109-7
19. Datiko DG, Yassin MA, Theobald S, Cuevas L. A community-based isoniazid preventive therapy for the prevention of childhood tuberculosis in Ethiopia. Int J Tuberculosis Lung Disease. 2017;21(9):1002–1007. doi:10.5588/ijtld.16.0471
20. Abossie A, Yohanes T. Assessment of isoniazid preventive therapy in the reduction of tuberculosis among aRT patients in arba Minch hospital, Ethiopia. Ther Clin Risk Manag. 2017;13:361. doi:10.2147/TCRM.S127765
21. Ethiopia Ministry of Health. Health Sector Transformation Plan-I Annual Performance Report. Addis Ababa: Ethiopia Ministry of Health; 2016 17.
22. FMOH. Health Sector Transformation Plan I Annual Performance Report. Addis Ababa; 2015 16.
23. World Health Organization. Epidemiology of HIV/AIDS in Ethiopia. WHO Country Office, editor. Addis Abeba, ETHIOPIA: WHO; 2015.
24. Assefa Y, Gilks CF, Lynen L, et al. Performance of the Antiretroviral Treatment Program in Ethiopia, 2005–2015: strengths and weaknesses toward ending AIDS. Int J Infectious Diseases. 2017;60:70–76. doi:10.1016/j.ijid.2017.05.012
25. Woldemariame SH. Factors Determining the Prevalence of HIV/AIDS in Ethiopia: Master’s Thesis in Mathematical Statistics. Stockholms universitet; 2013.
26. Hladik W, Shabbir I, Jelaludin A, Woldu A, Tsehaynesh M, Tadesse W. HIV/AIDS in Ethiopia: where is the epidemic heading? Sex Transm Infect. 2006;82(suppl 1):i32–i5. doi:10.1136/sti.2005.016592
27. Organisation WH. WHO Policy on Collaborative TB/HIV Activities: Guidelines for National Programmes and Other Stakeholders. Geneva: WHO; 2012:2014.
28. Gelaw YA, Williams G, Magalhães RJS, Gilks CF, Assefa Y. HIV prevalence among tuberculosis patients in sub-Saharan Africa: a systematic review and meta-analysis. AIDS Behav. 2019;1–15.
29. Gelaw Y. Towards sustainable TB control in Ethiopia – profiling high-risk geographical areas using spatial modelling. espace.libraryuq.edu.au. 2020.
 © 2020 The Author(s). This work is published and licensed by Dove Medical Press Limited. The
full terms of this license are available at https://www.dovepress.com/terms
and incorporate the Creative Commons Attribution
- Non Commercial (unported, 3.0) License.
By accessing the work you hereby accept the Terms. Non-commercial uses of the work are permitted
without any further permission from Dove Medical Press Limited, provided the work is properly
attributed. For permission for commercial use of this work, please see paragraphs 4.2 and 5 of our Terms.
© 2020 The Author(s). This work is published and licensed by Dove Medical Press Limited. The
full terms of this license are available at https://www.dovepress.com/terms
and incorporate the Creative Commons Attribution
- Non Commercial (unported, 3.0) License.
By accessing the work you hereby accept the Terms. Non-commercial uses of the work are permitted
without any further permission from Dove Medical Press Limited, provided the work is properly
attributed. For permission for commercial use of this work, please see paragraphs 4.2 and 5 of our Terms.