Back to Journals » OncoTargets and Therapy » Volume 11
Targeting the autophagy in bone marrow stromal cells overcomes resistance to vorinostat in chronic lymphocytic leukemia
Authors Ding L ![]() , Zhang W, Yang L, Pelicano H, Zhou K
, Zhang W, Yang L, Pelicano H, Zhou K ![]() , Yin R, Huang R, Zeng J
, Yin R, Huang R, Zeng J
Received 7 April 2018
Accepted for publication 23 June 2018
Published 24 August 2018 Volume 2018:11 Pages 5151—5170
DOI https://doi.org/10.2147/OTT.S170392
Checked for plagiarism Yes
Review by Single anonymous peer review
Peer reviewer comments 2
Editor who approved publication: Dr Samir Farghaly
Lu Ding,1,2,* Wan Zhang,1,* Lili Yang,3,* Helene Pelicano,4 Kaiwen Zhou,5 Ran Yin,1 Ruibin Huang,1 Junyi Zeng1
1Department of Leukemia, The First Affiliated Hospital of Nanchang University, Nanchang, China; 2School of Basic Medical Sciences, Nanchang University, Nanchang, China; 3Department of Hematology, People’s Hospital of Jiangxi Province, Nanchang, China; 4Department of Translational Molecular Pathology, The University of Texas MD Anderson Cancer Center, Houston, TX, USA; 5The First Clinical Medical College, School of Medicine, Nanchang University, Nanchang, China
*These authors contributed equally to this work
Background: The bone marrow microenvironment constitutes a sanctuary for leukemia cells. Recent evidence indicates that environment-mediated drug resistance arises from a reciprocal influence between tumor cells and the surrounding stroma. The present study aimed to investigate the effect of chronic lymphocytic leukemia (CLL) cells on the metabolism of bone marrow stroma, to determine the role of this metabolic change in the stroma in vorinostat resistance of CLL cells, and thus to assess a novel strategy to target stroma and achieve the maximum therapeutic effect of vorinostat.
Methods: To evaluate this issue, we used freshly isolated CLL cells from peripheral blood samples of patients with CLL, and co-cultured them with bone marrow stromal cell lines to examine autophagy activity and metabolic changes in both CLL cells and stromal cells after vorinostat treatment.
Results: The results demonstrated that CLL cells were under intrinsic oxidative stress which was further enhanced by vorinostat treatment, and released H2O2 outside the cells. The adjacent stromal cells took up H2O2 and drove autophagy, mitophagy and glycolysis, resulting in the local production of high-energy mitochondrial fuels, which were then taken up by CLL cells to be effectively utilized through mitochondrial oxidative phosphorylation to enable more ATP production. Notably, targeting autophagic stromal cells with autophagy inhibitor remarkably decreased stromal protection against vorinostat treatment in CLL cells.
Conclusion: This study demonstrated that the stroma in the CLL microenvironment is abnormal and undergoes autophagy, and manipulation of autophagic stromal cells could serve as a novel promising strategy to circumvent stroma-mediated drug resistance in CLL cells.
Keywords: autophagy, chronic lymphocytic leukemia, bone marrow stroma, drug resistance, reactive oxygen species, vorinostat
Introduction
Chronic lymphocytic leukemia (CLL) is a homogeneous disease originating from the continuous and excessive accumulation of defective B cells.1,2 CLL has become the most common form of adult leukemia in Europe and North America, and has a drastically increasing trend in China.3–5 Although great progress has been made in CLL therapy for improved patient outcomes,6–8 CLL is still viewed as an incurable disease owing to the presence of residual drug-resistant leukemia cells that will eventually induce CLL recurrence.9,10 Accumulating evidence suggests that bone marrow stroma serves as the leukemia cell sanctuary and contributor to promote the survival of CLL cells and leads to drug resistance in vivo.1,11 Understanding the interaction between bone marrow stromal cells and CLL cells will facilitate the development of novel therapeutic strategies to inhibit the protective effect of stromal cells and eliminate residual CLL cells in vivo.
An increasing number of studies have suggested that the tumor microenvironment communicates with cancer cells through either soluble factors or adhesive interactions, and activates survival signaling pathways or antioxidant systems in cancer cells to promote cell survival.12–16 Although many studies have focused on the tumor microenvironment-initiated survival pathway in cancer cells, more recent studies found that the tumor-associated fibroblasts undergo cancer cell-initiated changes, which, in turn, foster the metabolic and mutagenic activities of cancer cells.17–19 In hematologic malignancies, leukemia cells can create bone marrow niches that disrupt the behavior of normal hematopoietic progenitor cells.20 Therefore, it seems that cancer cells could shape the surrounding stromal cells to best support their survival. Understanding the changes in both leukemia cells and their niche can help us to design new therapeutic strategies to circumvent the stromal cell-mediated protection to completely kill leukemic cells, avoiding the emergence of drug resistance and relapse, and thus prolonging patient survival time.
Suberoylanilide hydroxamic acid (SAHA or vorinostat) is a histone deacetylase inhibitor that has been approved by the US Food and Drug Administration for the treatment of cutaneous T-cell lymphoma.21–23 Vorinostat can effectively kill cancer cells by promoting cell-cycle arrest and apoptosis, inducing cell oxidative damage, and triggering autophagic cell death and senescence.23,24 Preclinical trials have demonstrated the potential antitumor activity of vorinostat against leukemia cells and other hematologic malignancy cells in vitro, and improved survival in animal models of leukemia.25–27 Nonetheless, vorinostat exhibits only limited antitumor activity in CLL patients.28,29 Although several research groups, including our group, have attributed the drug-resistance CLL cell survival to stromal cell-induced antioxidant defense mechanisms,30,31 more details underlying this stromal cell-mediated vorinostat resistance remain largely unknown and need to be elaborated.
Autophagy, also called cellular self-digestion, is an evolutionarily conserved dynamic catabolic process that is involved in the degradation and recycling of damaged proteins and cellular components such as whole organelles as a response to survive starvation and stress.32–35 Autophagy acts as an alternative energy source to maintain the energy balance for regulating cellular survival.36,37 Recent research demonstrated that cancer cells in the center of the tumor mass exploit autophagy to survive situations of nutrient starvation, thus contributing to tumor progression.38,39 On the other hand, autophagy is vital for the clearance of damaged mitochondria by mitophagy, by which the impaired mitochondria are selectively delivered into lysosomes for degradation.40–42 In addition, it has been widely accepted that the accumulation of ROS induces autophagy and mitophagy, which, in turn, relieve the ROS-driven oxidative damage to enhance cell survival.43,44 Our previous report showed that, compared to normal lymphocytes, CLL cells exhibit higher intracellular ROS levels, which are further enhanced by vorinostat treatment.31 Thus, we speculated that the considerable amount of ROS originating from CLL cells after vorinostat treatment could regulate autophagy in adjacent stromal cells and thus remodel stromal cells, which, in turn, may influence CLL cell survival and drug resistance.
In brief, the aims of this study are to check the role of the autophagy and mitophagy in stromal cell-mediated protection against vorinostat-induced CLL cell death, to investigate the effect of vorinostat in combination with autophagic inhibitors in promoting CLL cell death and to evaluate its potential in removing stromal-protected CLL cells to improve CLL treatment. Our results indicated that the manipulation of stromal cell autophagy could serve as a novel promising strategy to eliminate drug resistance and sensitize CLL cells to chemotherapy. Thus, this study presents a new mechanism for stromal-mediated drug resistance in CLL cells, providing a new vision for improving CLL therapeutics.
Materials and methods
Materials
Commercially available antibodies used in this work were as follows: β-actin (Sigma-Aldrich, St Louis, MO, USA, #A5441), autophagy marker light chain 3 (LC3; Cell Signaling Technology, #12,741S, Beverly, MA, USA), cytochrome c oxidase subunit IV (COX IV; Abcam, #ab16056, Cambridge, UK), heat shock protein 60 (Hsp60; Abcam, #ab46798), glucose transporter 1 (Glut-1; Abcam, #ab652), Na,K-ATPase (Cell Signaling Technology, #3010), hexokinase-II (HK-II; Abcam, #ab37593), autophagy protein 5 (Atg5; Cell Signaling Technology, #12994), goat anti-rabbit polyclonal antibody (Pierce Biotechnology, #31210, Rockford, IL, USA) and goat anti-mouse polyclonal antibody (Pierce Biotechnology, #62-6700). Annexin V–fluorescein isothiocyanate (FITC) was purchased from BD Biosciences (San Jose, CA, USA). Vorinostat, glutathione (GSH), catalase, propidium iodide (PI), lactate, β-hydroxybutyrate, hydrogen peroxide (H2O2), 3-methyladenine (3-MA), chloroquine (CQ) and lactate assay kit were purchased from Sigma-Aldrich (St Louis, MO, USA). The β-hydroxybutyrate assay kit was purchased from Cayman Chemical Company (Ann Arbor, MI, USA). CM-H2DCF-DA, Mitotracker green, amplex red H2O2 assay kit, Lipofectamine 3000, Atg5 siRNA and Lipofectamine RNAiMAX were purchased from Thermo Fisher Scientific (Waltham, MA, USA). 3H-2-Deoxyglucose was acquired from NEN Life Science Products (Boston, MA, USA). Green fluorescent protein (GFP)–LC3 plasmid was purchased from Addgene (Cambridge, MA, USA). The CellTiter-Glo Luminescent Cell viability assay kit was purchased from Promega (Madison, WI, USA).
Cell lines
The human bone marrow cell line Stroma NKtert immortalized by hTERT,45 the murine bone marrow stromal cell line KUSA-H146 and the human bone marrow stromal cell line HS5 immortalized by E6/E747 were cultured in RPMI 1640 medium (Cellgro; Mediatech, Hendon, VA, USA) supplemented with 10% FBS as described previously.48 These three stromal cell lines used in this study (Stroma NKtert, murine stromal cell line KUSA and HS5 human bone marrow stromal cell line) were purchased from RIKEN and obtained from the American Type Culture Collection (Manassas, VA, USA), RIKEN Cell Bank (Ibaraki, Japan) and American Type Culture Collection, respectively.
Patients
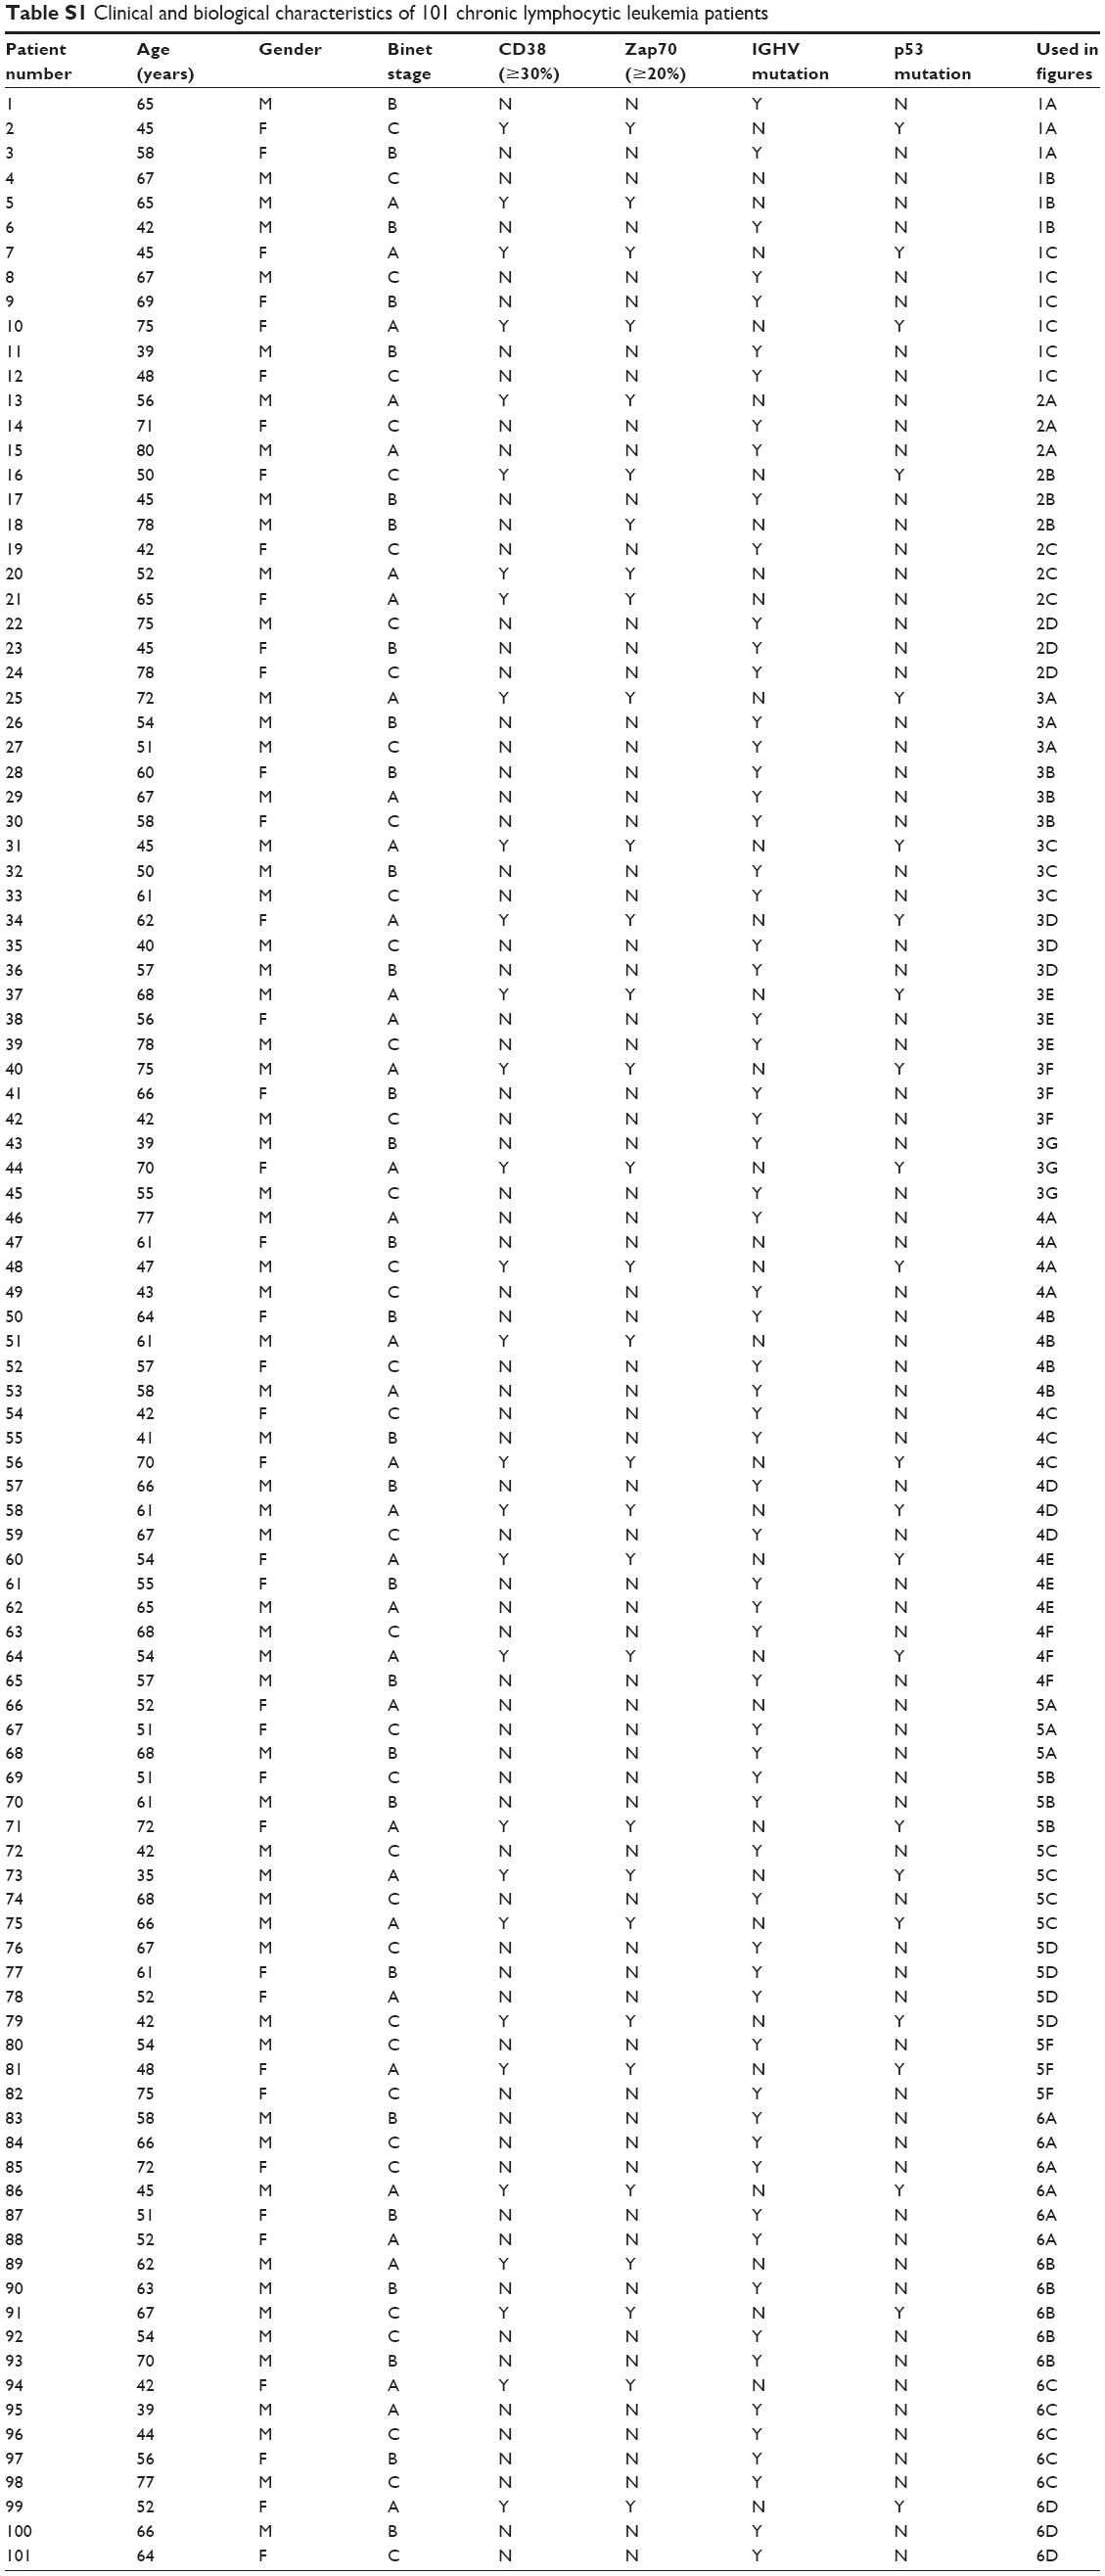
In this study, 101 blood samples were collected from 101 CLL patients at the First Affiliated Hospital of Nanchang University. Each patient provided signed written informed consent and the study was approved by the ethics committee of the First Affiliated Hospital of Nanchang University. Clinical and biological characteristics, including age, gender, Binet stage, CD38 expression (≥30%), Zap70 expression (≥20%), IGHV mutation and p53 mutation, were recorded in all CLL patients, and are summarized in Table S1.
Isolation of CLL cells and normal lymphocytes
Primary CLL cells were obtained from the peripheral blood samples of B-CLL patients, who had been diagnosed based on clinical criteria and laboratory features according to National Cancer Institute criteria.31 In all experiments, CLL cells were isolated from peripheral blood samples, which were collected from the patients by density gradient centrifugation.30 In brief, 5 mL blood was slowly added to a Falcon tube containing 6 mL pre-warmed Fico/Lite LymphoH buffer (Atlanta Biological, Lawrenceville, GA, USA) and then centrifuged at 435 × g for 20 minutes at room temperature. The isolated CLL cells were washed with pre-warmed PBS and incubated in RPMI-1640 medium (Cellgro; Mediatech) supplemented with 10% FBS, penicillin (100 U/mL) and streptomycin (100 μg/mL; all Cellgro; Mediatech) overnight before experimentation. Normal lymphocytes were isolated from blood samples of five healthy donors using similar procedures.
Cell viability assays
Cell death was determined by flow cytometry after double staining cells with annexin V–FITC and PI as described previously.30 Stromal cells (5×10⁴ cells/mL) were seeded in 24-well plates and allowed to adhere and grow overnight before the addition of CLL cells or normal B cells or CQ. The CLL cells were isolated from the blood samples and incubated overnight with RPMI-1640 medium supplemented with 10% FBS, penicillin (100 U/mL) and streptomycin (100 μg/mL), and then transferred (1×10⁶ cells) into 24-well plates with or without the pre-seeded stromal cells. Following co-culture for 1 day, CLL cells were treated with various compounds under the conditions indicated in the figure legends. All assays were carried out at least three times.
Measurement of cellular ROS levels and mitochondrial contents
The cellular ROS levels and mitochondrial contents were detected with a fluorescent probe of CM-H2DCF-DA and Mitotracker green, respectively. In brief, NKtert cells and CLL cells were cultured under various experimental conditions, and then incubated with 1 μM CM-H2DCF-DA for 60 minutes or with 61.6 nM Mitotracker green for 30 minutes at 37°C in the dark. After washing twice, the resulting samples were measured using flow cytometry, and the results were analyzed based on forward scatter/side scatter gating to differentiate between dead and viable cells using the built-in software.
Western blot analysis
After being cultured under various experimental conditions, NKtert cells and CLL cells were harvested and washed in cold PBS, and directly solubilized in buffered solution containing 10 mM pH 7.6 Tris–HCl, 1% SDS and protease inhibitor (Hoffman-La Roche Ltd., Basel, Switzerland, #11836170001). Membrane fractionation was performed as described previously.49 The total and membrane protein concentrations were quantified using a BCA Protein Assay Kit (Pierce Biotechnology, #23225), and then adjusted to 2 μg/mL with sample buffer containing 250 mM pH 6.8 Tris–HCl, 4% SDS, 10% glycerol, 0.006% bromophenol blue and 2% mercaptoethanol. The cell lysates were heated at 95°C for 10 minutes, and equal amounts of proteins were separated on SDS–PAGE in a Mini-Protean II Dual Slab Cell (Bio-Rad Laboratories, Hercules, CA, USA). The proteins were then transferred on to nitrocellulose membranes using a Mini Trans-Blot Transfer Cell (Bio-Rad Laboratories). The transfer was performed at 4°C for 2 hours at a constant voltage setting of 110 V. The blots were blocked in 5% skimmed milk for 1 hour at room temperature. The membranes were then probed with the following primary antibodies: LC3, COX IV, Hsp60, Glut-1, Na,K-ATPase, HK-II and Atg5, all at 1:1,000 dilution, and β-actin at 1:10,000 dilution. After incubation for 2 hours at room temperature, the blots were washed three times for 10 minutes in PBS containing 0.1% Tween-20, and then incubated for 1 hour at room temperature in the following secondary antibodies: goat anti-rabbit polyclonal antibody for LC3, COX IV, Hsp60, Glut-1, Na,K-ATPase, HK-II and Atg5 detection, all at 1:3,000 dilution, and goat anti-mouse polyclonal antibody for β-actin detection at 1:20,000 dilution. The blots were then washed three times for 10 minutes with the same buffer as above and incubated in enhanced chemiluminescence detection reagents (GE Healthcare Life Sciences, Chalfont, UK) for 1 minute. The blots were then exposed to an X-OMAT AR X-ray film (Kodak, Rochester, NY, USA) for between 10 seconds and 5 minutes.
Plasmid transfection and confocal microscopy
NKtert cells were transfected with adenovirus harboring GFP-LC3 plasmid with Lipofectamine 3000 according to the manufacturer’s protocol. After transfection for 6 hours, the cells were changed into fresh medium and cultured for 24 hours. Then, the NKtert cells were cultured alone or with CLL cells incubated with or without vorinostat or H2O2 for another 24 hours, and the cells were fixed and examined with a Nikon Eclipse TE2000 confocal microscope. The number of autophagosomes (green dots) per cell was calculated using ImageJ software.
siRNA transfection
siRNA for Atg5 and non-targeting sequence control siRNA (NC) were transfected to NKtert cells with Lipofectamine RNAiMAX (Thermo Fisher Scientific) according to the manufacturer’s instructions. After transfection for 6 hours, the cells were changed into fresh medium and cultured for 24 hours. Then, the NKtert cells were co-cultured with CLL cells and incubated with vorinostat for another 48 hours for Western blot and apoptosis analysis.
Mitochondrial respiration activity
Mitochondrial respiration in whole cells was measured by an oxygen consumption assay, as described previously.50 Following NKtert cell and CLL cell cultures under various experimental conditions, the cells were resuspended in 1 mL of fresh culture medium pre-equilibrated with 21% oxygen at 37°C, followed by applying the cells to the sealed respiration chamber of a Clark-type oxygen measuring system (Oxytherm; Hansatech Instruments, Cambridge, UK) with constant stirring.
Glucose uptake
Cellular glucose uptake was measured as described previously.51 NKtert cells cultured alone or with CLL cells were treated with vorinostat. Then, the cells were washed with glucose-free medium and incubated in fresh glucose-free RPMI 1640 medium for 3 hours before incubation with 0.2 Ci/mL 3H-2-deoxyglucose for 1 hour. After washing the cells with ice-cold PBS, the glucose uptake represented by 3 hours’ radioactivity was determined by liquid scintillation counting and normalized by cell number.
Lactate release
Lactate release into the medium was measured using an assay kit from Sigma-Aldrich, based on an enzymatic–spectrophotometric method. NKtert cells cultured alone or with CLL cells were treated with vorinostat. Then, the cells were replenished with fresh medium. Aliquots of the medium were removed at the indicated time for measurement of lactate. At each time point, cell number was also counted for normalization of lactate generation.
β-Hydroxybutyrate (ketone body) release
β-Hydroxybutyrate release into the medium was measured using an assay kit from Cayman Chemical Company, based on an enzymatic–spectrophotometric method. NKtert cells cultured alone or with CLL cells were treated with vorinostat. Then, the medium was collected and the ketone body concentration was measured according to the manufacturer’s instructions. Results were normalized for total cellular protein per well.
Cellular ATP measurement
The level of cellular ATP was determined using the CellTiter-Glo Luminescent Cell viability assay kit from Promega, based on a luciferase method. CLL cells were cultured under various experimental conditions, then the cellular ATP contents were measured according to the manufacturer’s recommendations. Results were normalized according to cell number.
Determination of the effect of oxygen levels on CLL cell viability
The effect of oxygen levels on CLL cell viability was detected as described previously.31 In brief, CLL cells were cultured with or without a pre-seeded NKtert cell layer, and incubated in normoxic or hypoxic conditions (2% oxygen) for 1 day at 37°C. The CLL cells were then treated with the combination of autophagy inhibitor and vorinostat under normoxia and hypoxia at 37°C. Cell viability was determined using flow cytometry following double staining with Annexin V and PI. Hypoxic culture conditions were created by incubating the cells in a sealed modular incubator chamber flushed with 2% oxygen, 5% carbon dioxide and balanced nitrogen.
Statistical analysis
All experiments were conducted on CLL cells separated from at least three patients, and stromal cells from three separated culture flasks were applied. Statistical significance was estimated using the Student’s t-test. P<0.05 was considered to indicate a statistically significant difference. Bar graphs and plots were produced on GraphPad Prism 5 software (GraphPad Software, La Jolla, CA, USA).
Results
Disrupting the autophagy pathway circumvents stromal protection of CLL cells
Previous studies demonstrated that vorinostat can effectively kill CLL cells for the treatment of CLL patients.23,24 However, the treatment effects are fairly limited owing to the presence of drug-resistant CLL cells leading to leukemia recurrence. To demonstrate that bone marrow stromal cells provide protection against spontaneous and vorinostat-induced cell apoptosis, stromal NKtert cells were co-cultured with primary leukemia cells isolated from CLL patients and treated with vorinostat. As shown in Figure 1A, a significantly increased apoptosis rate for single-cultured CLL cells was observed, from 25% to 69%, with the increase in vorinostat concentration from 0 to 2 μM, whereas the CLL cells co-cultured with NKtert cells exhibited an obvious decrease in the apoptosis rate at all given vorinostat concentrations, demonstrating that the stromal NKtert cells prevented CLL cells from undergoing spontaneous and vorinostat-induced apoptosis. To investigate the role of autophagy in stroma-mediated protection against vorinostat-induced apoptosis, two common small molecular chemical inhibitors, 3-MA and CQ, were used to manipulate autophagy. After treatment with vorinostat for 24 hours and 48 hours, the apoptotic cell death rate of CLL cells in the presence of NKtert cells was 14% and 34%, respectively (Figure 1B). However, the use of 10 μM CQ to inhibit autophagy remarkably increased apoptotic cell death of CLL cells co-cultured with NKtert cells to 37% and 45% after treatment with 2 μM vorinostat for 24 hours and 48 hours, respectively. Notably, the increase in CQ concentration to 20 μM was able to eliminate 60%–70% of CLL cells in the presence of stromal layers after treatment with vorinostat for 24 hours and 48 hours. Similar results of enhanced cell death of CLL cells co-cultured with NKtert cells with vorinostat treatment were observed when using another autophagy inhibitor, 3-MA. Similar results were also observed in experiments using more CLL samples (Figure 1C). These observations indicate that the presence of an autophagy inhibitor, CQ or 3-MA, could effectively enhance vorinostat-induced apoptosis in CLL cells in the presence of NKtert cells, demonstrating that autophagy inhibitors circumvent the stromal protection of CLL cells against vorinostat-induced apoptosis.
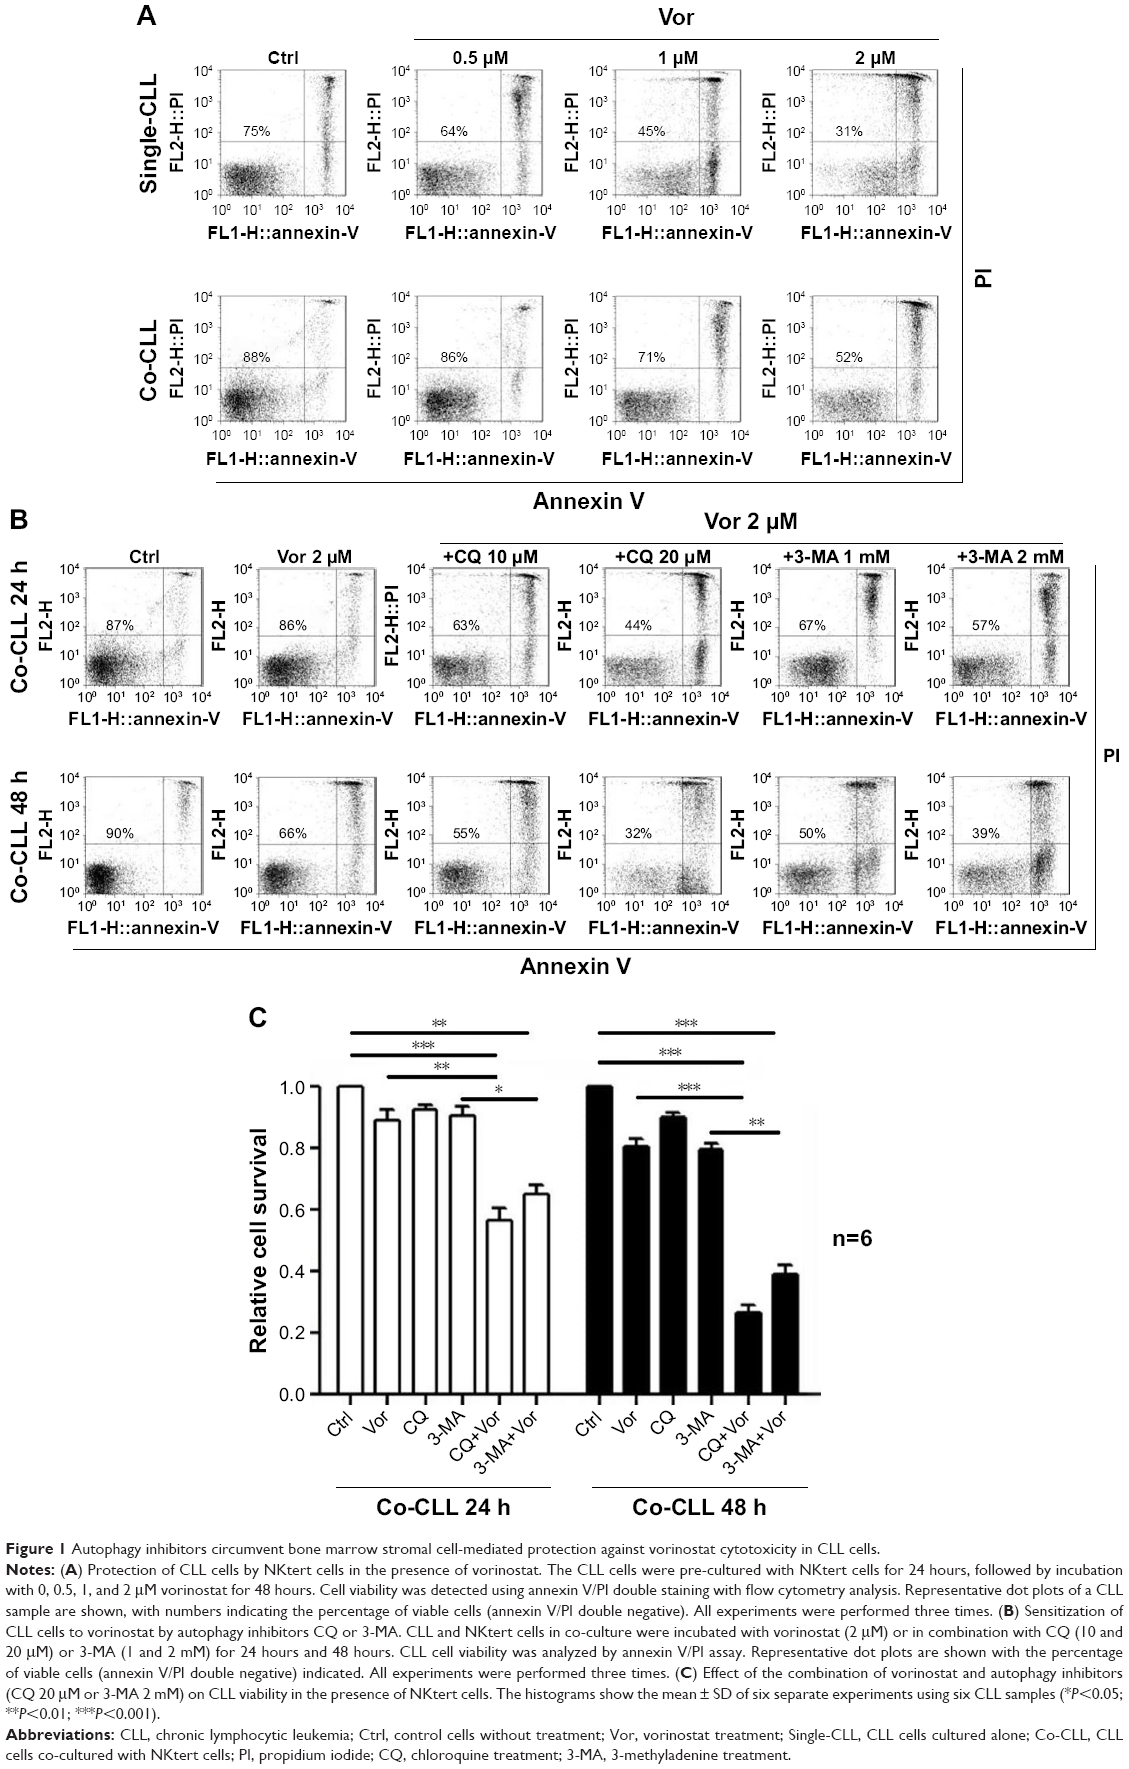 | Figure 1 Autophagy inhibitors circumvent bone marrow stromal cell-mediated protection against vorinostat cytotoxicity in CLL cells. |
Vorinostat induces autophagy and mitophagy in stromal cells in the presence of CLL cells but not in CLL cells
As stated above, our results showed that the stromal protection of CLL cells against vorinostat-induced apoptosis was related to autophagy. However, it remains unknown whether this autophagy-based protective effect comes from stromal cells or CLL cells. In the process of autophagy, the degree of LC3-I to LC3-II conversion correlates with the extent of autophagosome formation. We analyzed expression levels of LC3-II and LC3-I in both single- and co-cultured CLL and stromal cells with or without vorinostat treatment. In addition, to distinguish whether autophagosome accumulation is due to autophagy induction or impaired autophagic degradation, we performed autophagic flux assays using CQ to block autophagy in the late stages. Surprisingly, the results showed that no significant LC3-II signals and no further increase in LC3-II with CQ treatment were detected in either single-cultured or co-cultured CLL cells under any conditions (Figure 2A), indicating that autophagy in CLL cells was weak. Conversely, an obviously increased LC3-II accumulation was seen in NKtert cells co-cultured with CLL cells, which was further enhanced by vorinostat treatment for 24 hours, and the accumulation of LC3-II was further increased by CQ treatment (Figure 2A). Moreover, since LC3 is visualized in small puncta corresponding to autophagosomes, NKtert cells were infected with an adenovirus expressing LC3 fused to GFP (GFP-LC3) and co-cultured with CLL cells with or without vorinostat treatment, and assessed for GFP-LC3 localization. In the absence of CLL cells, as expected, GFP-LC3 was diffused within the cytoplasm with occasional puncta. When co-cultured with CLL cells, more GFP-LC3 puncta were observed, which were markedly increased after treatment with vorinostat for 24 hours (Figure 2B). These results indicated a clear role for CLL cells in the regulation of autophagy in NKtert cells, especially after vorinostat treatment (single-cultured CLL cells or NKtert cells showed weak autophagy). Moreover, flow cytometry analysis displayed a decreased mitochondrial mass in NKtert cells in the presence of CLL cells, which further decreased after vorinostat treatment for 48 hours (Figure 2C). Immunoblotting analysis for mitochondrial matrix protein Hsp60 and inner mitochondrial membrane protein COX IV, which are markers of mitochondrial mass, was used as a quantitative way to monitor the last step in the degradation process of mitophagy. Consistently, both Hsp60 and COX IV were significantly decreased in the NKtert cells co-cultured with CLL cells after treatment with vorinostat for 24 hours and 48 hours (Figure 2D). All these data suggested increased mitophagy and autophagy in stromal cells in the presence of CLL cells, and vorinostat treatment enhanced autophagy in stromal cells in the presence of CLL cells.
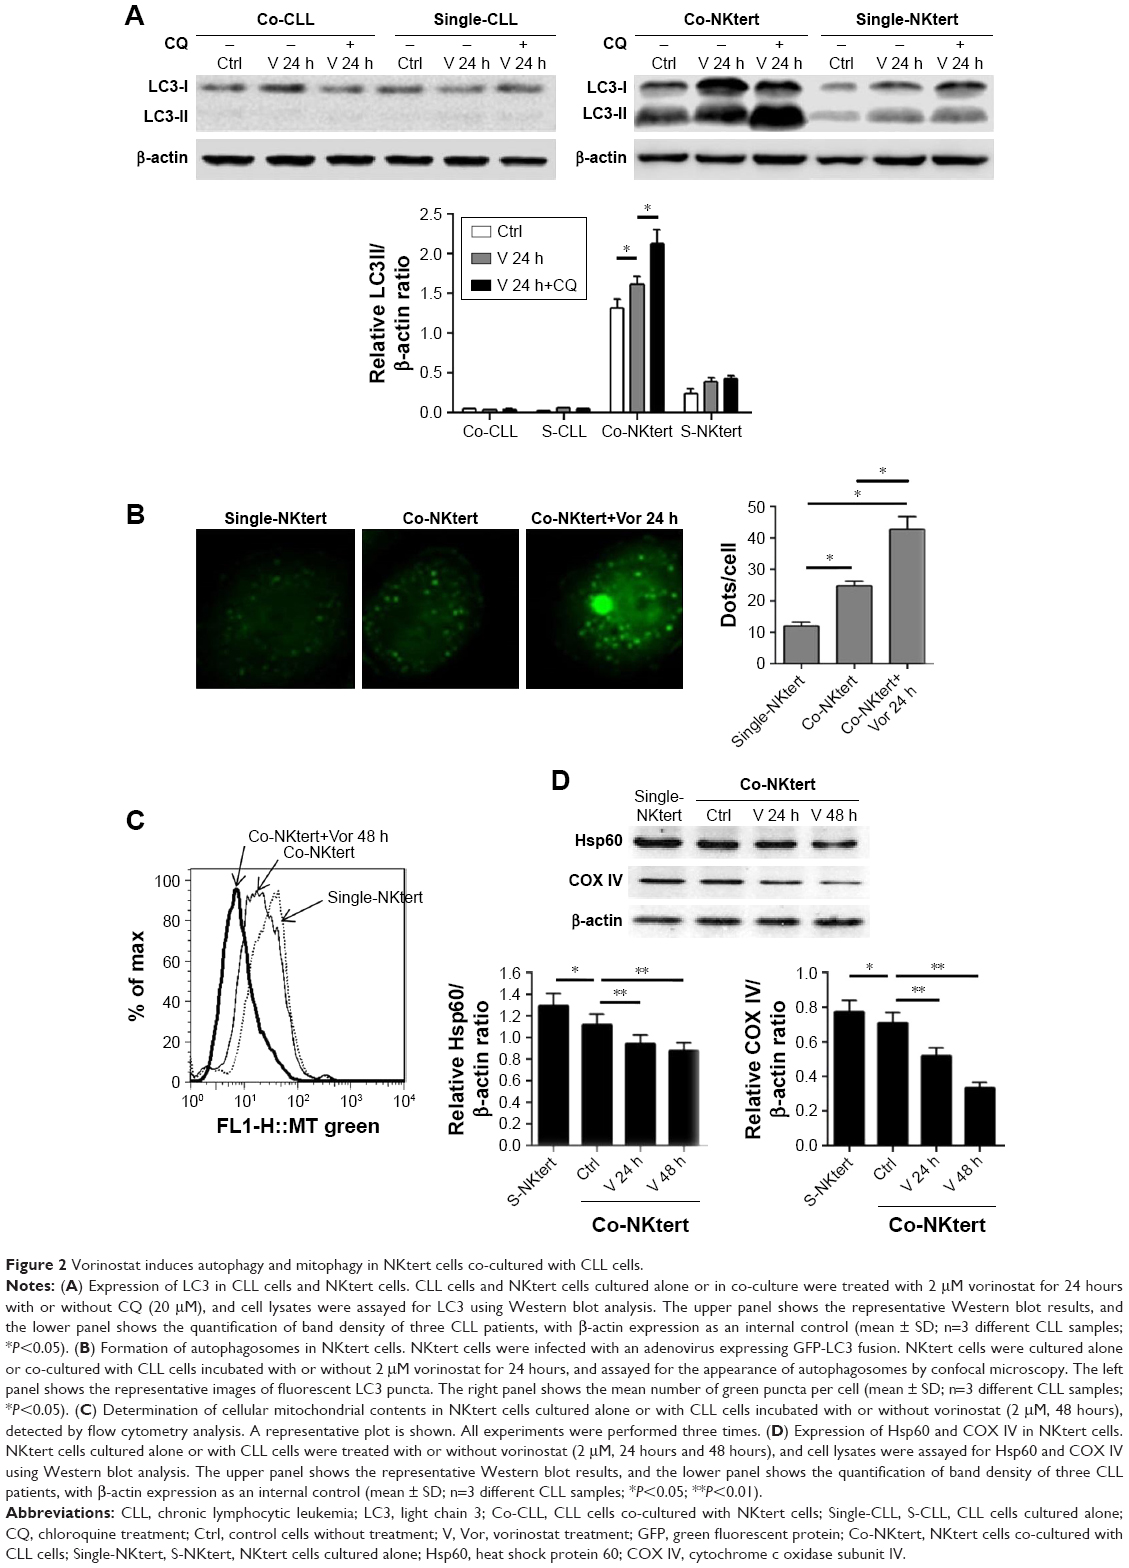 | Figure 2 Vorinostat induces autophagy and mitophagy in NKtert cells co-cultured with CLL cells. |
ROS originating from CLL cells by vorinostat treatment induce autophagy and mitophagy in stromal cells
Accumulating data have implicated the important role of ROS in autophagy.43 Our previous study indicated that CLL cells exhibit intrinsically high intracellular ROS levels, and yield an excessive accumulation of ROS after vorinostat treatment.31 We suspected that the excessive intracellular ROS levels in CLL cells would diffuse into the extracellular space, thus causing strong oxidative stress in adjacent stromal cells. Flow cytometry analysis revealed that compared with single-cultured NKtert cells, the intracellular ROS levels increased in NKtert cells co-cultured with CLL cells, and further increased after 30 hours of vorinostat treatment (Figure 3A). Our previous work suggested that stromal cells alleviate oxidative stress in CLL cells.31 Consistent with this, Figure 3B shows that there was a decreased level of ROS in CLL cells in the presence of NKtert cells, whereas vorinostat treatment increased ROS in both single- and co-cultured CLL cells. By determining the corresponding H2O2 concentration in the culture media, we found an increased H2O2 accumulation in the medium of CLL cells, which further increased after vorinostat treatment (Figure 3C). In contrast, the group of NKtert cells cultured alone exhibited much lower H2O2 levels in culture medium either with or without vorinostat treatment, whereas an increased H2O2 accumulation was observed in the medium from the group of CLL plus NKtert, demonstrating that the presence of CLL cells in co-cultured system caused enhanced H2O2 accumulation. In addition, compared with this group of NKtert cells cultured with vorinostat, the group with CLL in the presence of NKtert and vorinostat showed a significant increase in H2O2 accumulation, indicating that vorinostat treatment increased H2O2 concentration in the culture medium of NKtert cells only in the presence of CLL cells. These results suggest that although stromal cells decreased ROS in CLL cells, the latter still can release ROS into the medium and increase ROS levels in adjacent stromal cells after vorinostat treatment. To investigate the effects of increased ROS levels on autophagy in stromal cells, NKtert cells were treated with H2O2. As shown in Figure 3D, following 8 hours of incubation with H2O2, there was a significant increase in LC3-II expression in NKtert cells, which was further enhanced by CQ treatment. Consistent with this, the addition of H2O2 increased GFP-LC3 puncta in NKtert cells (Figure 3E), indicating autophagy induction in NKtert cells by H2O2 treatment. Further immunoblotting analysis (Figure 3F) demonstrated that the mitochondrial Hsp60 and COX IV protein levels decreased in NKtert cells treated with exogenous H2O2 for 8 hours, and reduced further with further incubation. Collectively, these results show that the exogenous H2O2 induced mitophagy and autophagy in NKtert cells. To further validate this result, the antioxidants catalase and GSH were applied to relieve oxidative stress in stromal cells. The results in Figure 3G illustrate that the addition of those antioxidants decreased autophagy flux in NKtert cells co-cultured with CLL cells, further confirming that the induction of autophagy was highly related to the ROS generation in NKtert cells. Given all this, we demonstrated that oxidative stress originating from adjacent CLL cells induced autophagy and mitophagy in NKtert cells, especially after vorinostat treatment.
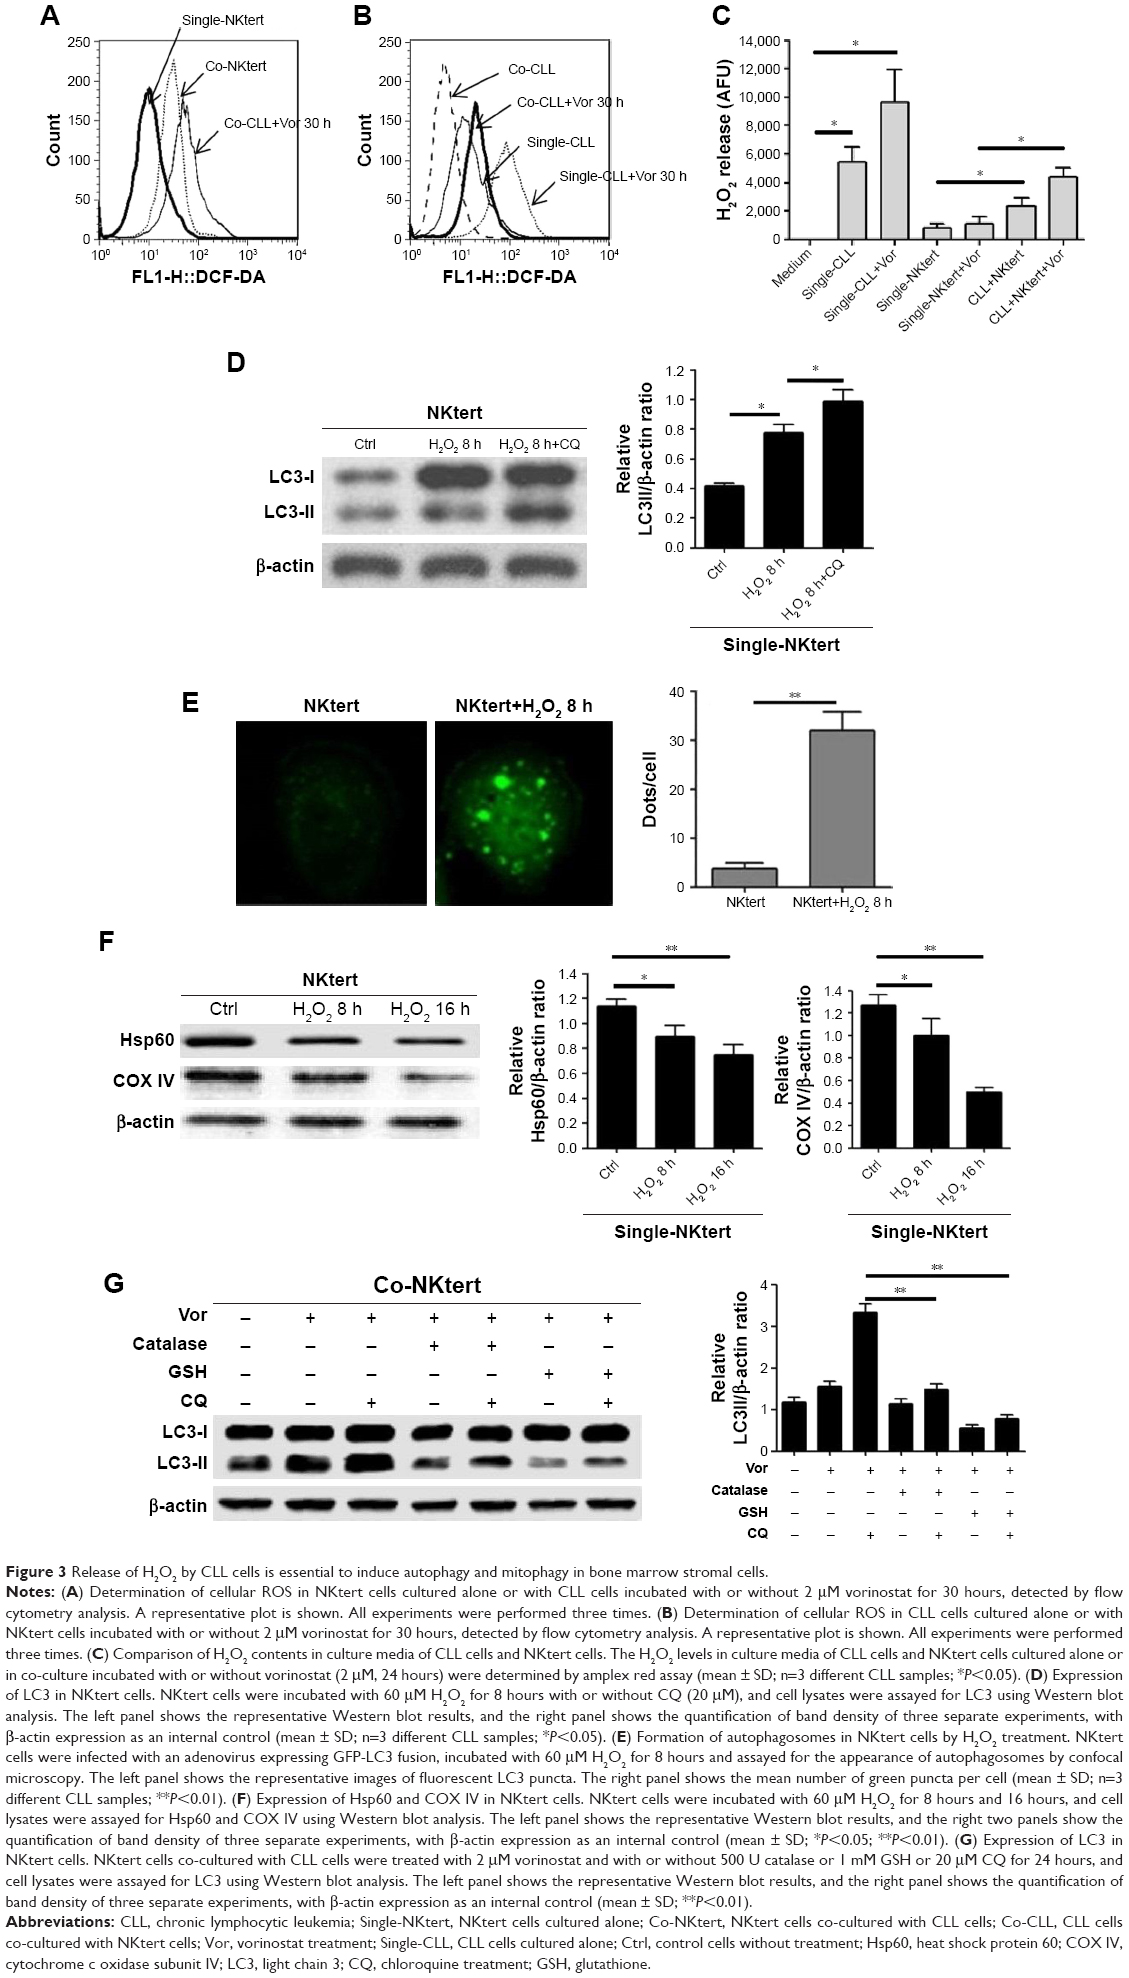 | Figure 3 Release of H2O2 by CLL cells is essential to induce autophagy and mitophagy in bone marrow stromal cells. |
Vorinostat activates glycolysis in stromal cells in the presence of CLL cells
The autophagic NKtert cells in the presence of CLL cells demonstrated a decrease in mitochondrial mass. We speculated that the autophagic NKtert cells could not maintain the energy balance needed for cell survival. Therefore, we compared the oxygen consumption in NKtert cells with or without CLL cells. As shown in Figure 4A, compared to single-cultured NKtert cells, NKtert cells co-cultured with CLL cells had decreased oxygen consumption, which was further reduced after vorinostat treatment, showing that CLL cells and vorinostat treatment in the presence of CLL cells disturbed the mitochondrial oxidative phosphorylation, and lowered oxygen consumption in NKtert cells. In addition, Figure 4B shows that NKtert cells co-cultured with CLL cells increased glucose uptake, especially after vorinostat treatment, indicating that glycolysis in stromal cells may be increased in the presence of CLL cells and further enhanced by vorinostat treatment. To further study the effect of CLL cells and vorinostat treatment on glycolysis in NKtert cells, the expression levels of Glut-1 and the glycolytic enzyme HK-II were examined. The results in Figure 4C and D show that increased expression of Glut-1 in the membrane fraction and HK-II was observed in NKtert cells co-cultured with CLL cells, which further increased after vorinostat treatment, whereas no significant changes in the expression of Glut-1 and HK-II were detected in single-cultured NKtert cells, either with or without vorinostat treatment. Moreover, by measuring the accumulation of glycolytic products, including lactate and ketone bodies in the culture medium, we found that co-culture of NKtert cells with CLL cells induced more accumulation of lactate and ketone bodies in the culture medium than single-cultured NKtert cells. A greater accumulation of lactate and ketone was also observed in the presence of vorinostat (Figure 4E and F). These results demonstrate that autophagic NKtert cells reduced the mitochondrial oxidative phosphorylation and increased the aerobic glycolysis to overcome the energy shortage to ensure cell survival.
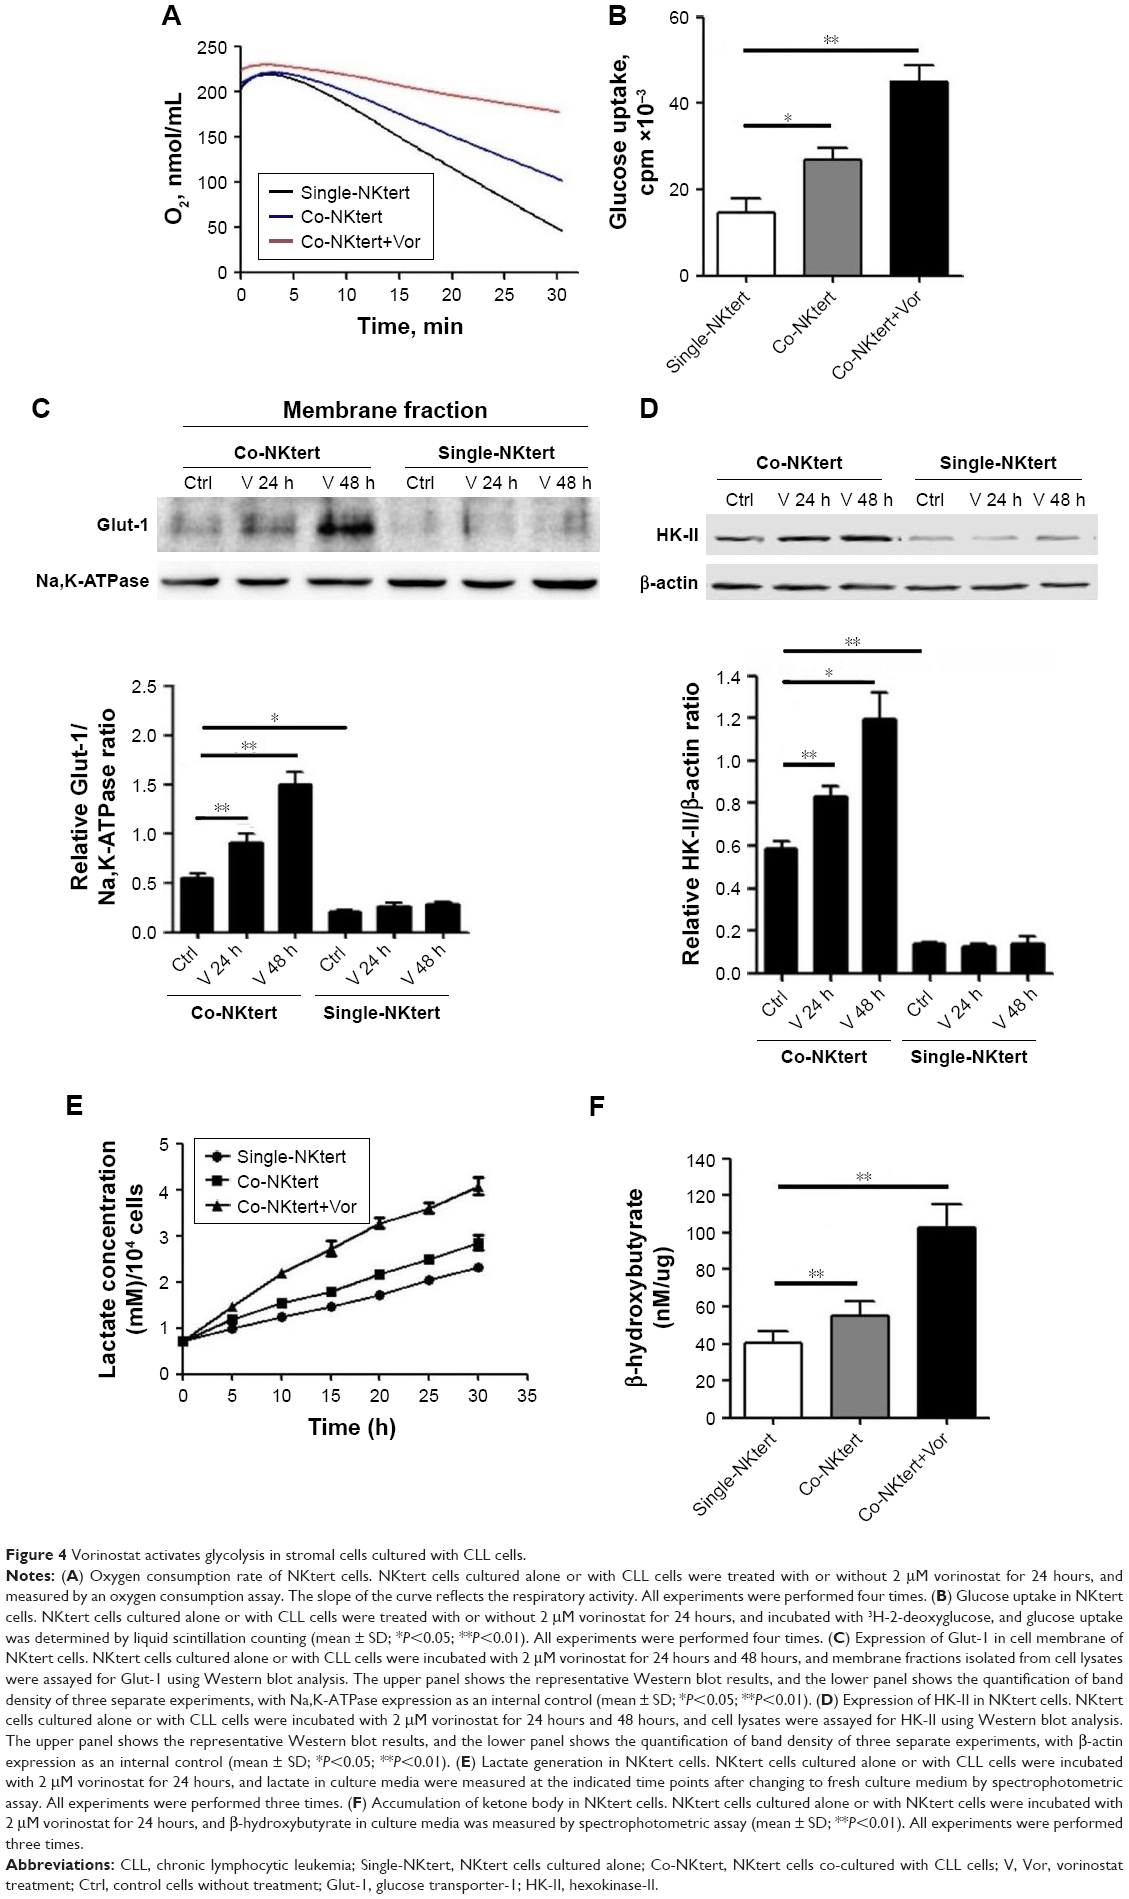 | Figure 4 Vorinostat activates glycolysis in stromal cells cultured with CLL cells. |
Glycolysis in stromal cells supports CLL cell survival through the maintenance of mitochondrial metabolic function and energy levels
As shown in Figure 5A, enhanced CLL cell survival against vorinostat treatment was seen in the presence of lactate and ketone bodies, and a further increase was obtained by adding GSH, which partially offset the vorinostat-induced oxidative damage. This result indicates that the presence of lactate and ketone bodies was beneficial for CLL cell survival, and synergistically enhanced CLL cell survival was achieved in the presence of GSH. We also examined the ATP levels in CLL cells treated with vorinostat. The results in Figure 5B show that NKtert cells increased ATP levels in CLL cells after vorinostat treatment. Importantly, exogenous addition of lactate and ketone bodies increased ATP levels in CLL cells in a similar manner, and these levels were further enhanced in the presence of GSH. By monitoring the changes in oxygen consumption under different conditions, we found that vorinostat treatment decreased oxygen consumption in single-cultured or co-cultured CLL cells, whereas the presence of NKtert cells resulted in increased oxygen consumption in co-cultured CLL cells with or without vorinostat treatment (Figure 5C). Moreover, we found that exogenous addition of lactate and ketone bodies could partially replace NKtert cells to increase oxygen consumption in CLL cells after vorinostat treatment (Figure 5D). These results imply that NKtert cells may support CLL cell survival by providing the energy-rich metabolites for ATP production based on mitochondrial oxidative phosphorylation in the adjacent CLL cells. Since we found that NKtert cells generate lactate and ketone bodies through glycolysis, and autophagy activated glycolysis in NKtert cells, to check the role of stromal cell autophagy in CLL cell survival, the essential autophagy gene Atg5 in the NKtert cells was selectively knocked down using siRNA (Figure 5E). Then, SiAtg5-NKtert cells were co-cultured with CLL cells. The results in Figure 5F show that SiAtg5-NKtert cells exhibited a decreased ability to protect CLL cells against vorinostat treatment compared with the Atg5-expressing NKtert cells. Overall, the glycolysis in the co-cultured NKtert cells played an important role in supporting CLL cell survival, and the inhibition of glycolysis by the interfering autophagy gene could circumvent stromal protection.
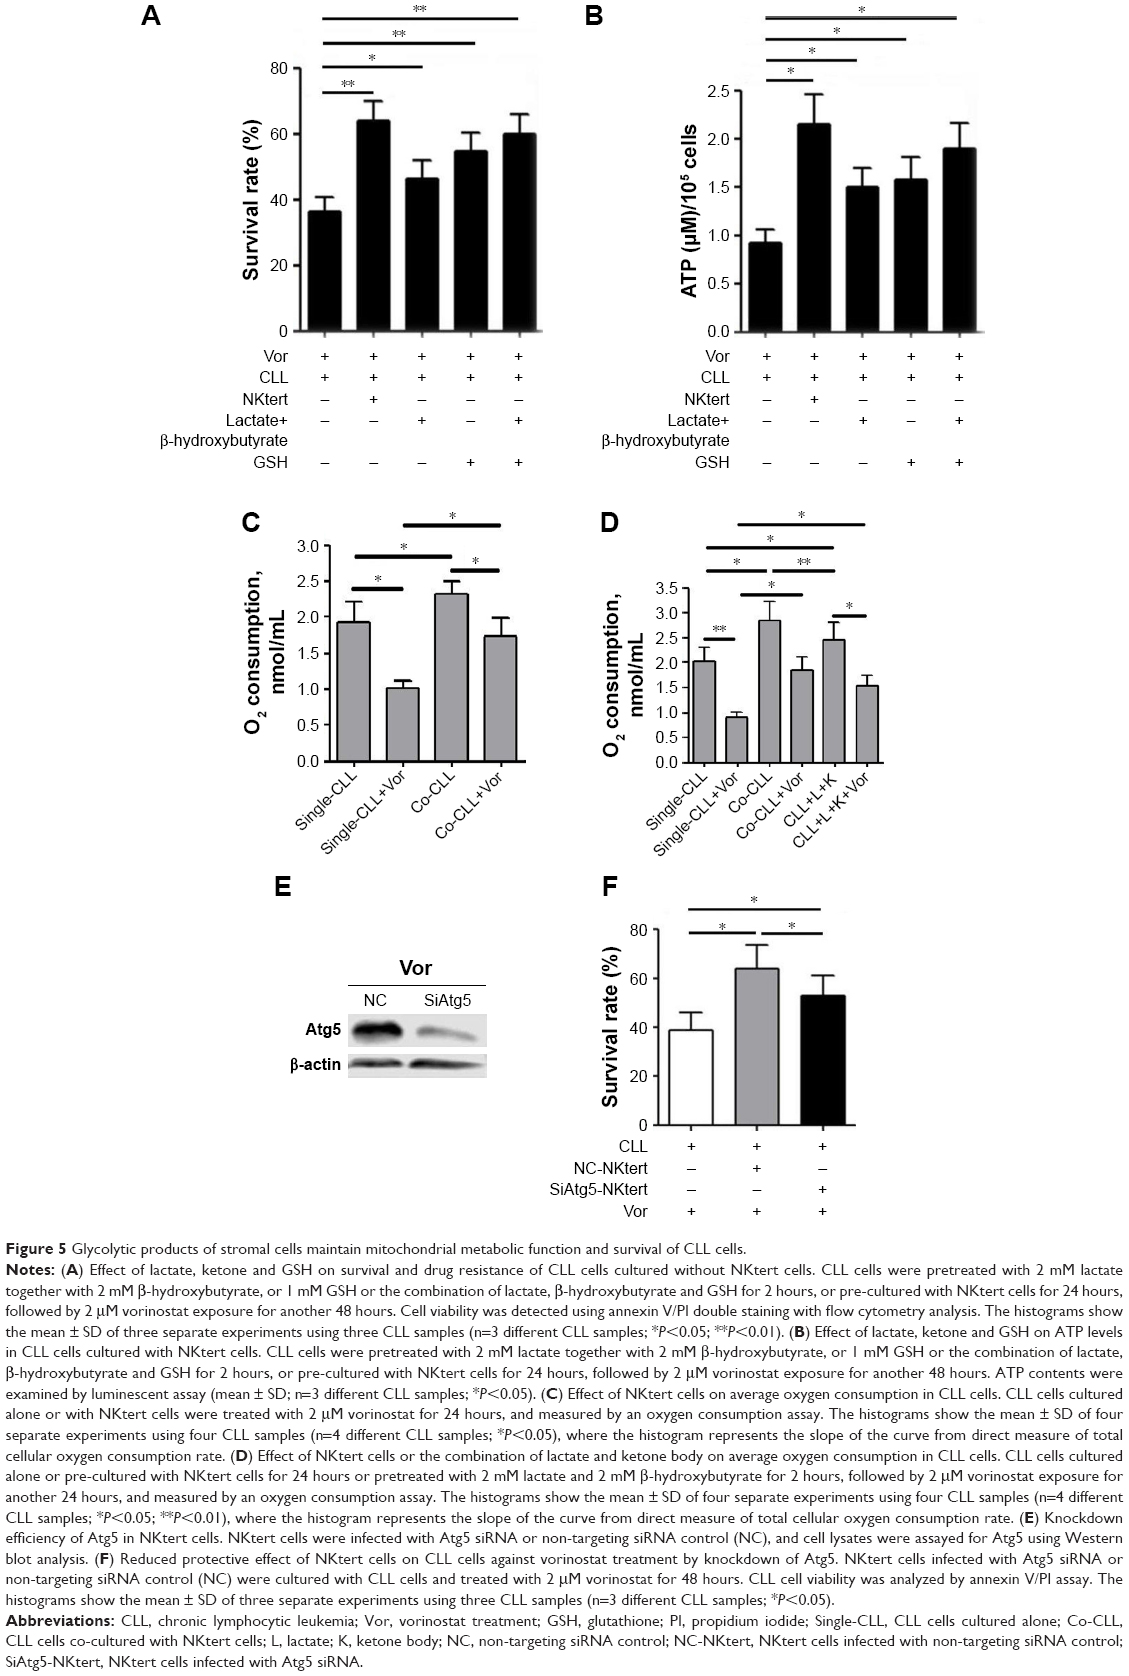 | Figure 5 Glycolytic products of stromal cells maintain mitochondrial metabolic function and survival of CLL cells. |
The combination of autophagy inhibitor and vorinostat circumvents stromal-mediated drug resistance in CLL cells
Encouraged by the above findings, we investigated a strategy to abolish stromal protection of CLL cells by inhibiting autophagy in stromal cells. Two autophagy inhibitors, CQ and 3-MA, were used in this study. As shown in Figure 6A, NKtert cells reduced the sensitivity of CLL cells to vorinostat treatment, and a subtoxic concentration of CQ or 3-MA greatly enhanced vorinostat-induced cytotoxicity to a level comparable to that observed in CLL cells alone. Similar results were observed in experiments using different CLL samples and other two bone marrow stromal cell lines (HS5 and KUSA-H1) (Figure 6A). These results further confirmed that the stromal protection against vorinostat treatment in CLL cells was greatly related to autophagy, and the autophagy-mediated stromal protection could be circumvented by using autophagy inhibitors. In control experiments, we found that the combination of vorinostat with CQ or 3-MA caused minimal cytotoxicity in normal bone marrow stromal cells, with around 90% viable cells after treatment with vorinostat and CQ for 24 hours and 48 hours (Figure 6B). We also examined the cytotoxicity of this drug combination strategy in normal B cells, and found that the combination of vorinostat with CQ or 3-MA caused only a slight decrease in cell survival in normal B cells (Figure 6C). These results indicate that the combination of vorinostat and autophagy inhibitors resulted in only limited toxicity to normal B cells and stromal cells, with acceptable side effects. Moreover, owing to the hypoxic bone marrow environment, the effects of treatment combinations of vorinostat with CQ or 3-MA in CLL cells cultured on a stromal layer in normoxia and hypoxia were examined. Consistent with our previous report,31 NKtert cells enhanced CLL viability under different oxygen concentrations, and the significant cell death induced by the combination of vorinostat with CQ or 3-MA in CLL cells was observed under both normoxic and hypoxic conditions (Figure 6D), suggesting that co-administration of vorinostat and autophagy inhibitors may effectively eliminate CLL cells in the hypoxic bone marrow environment.
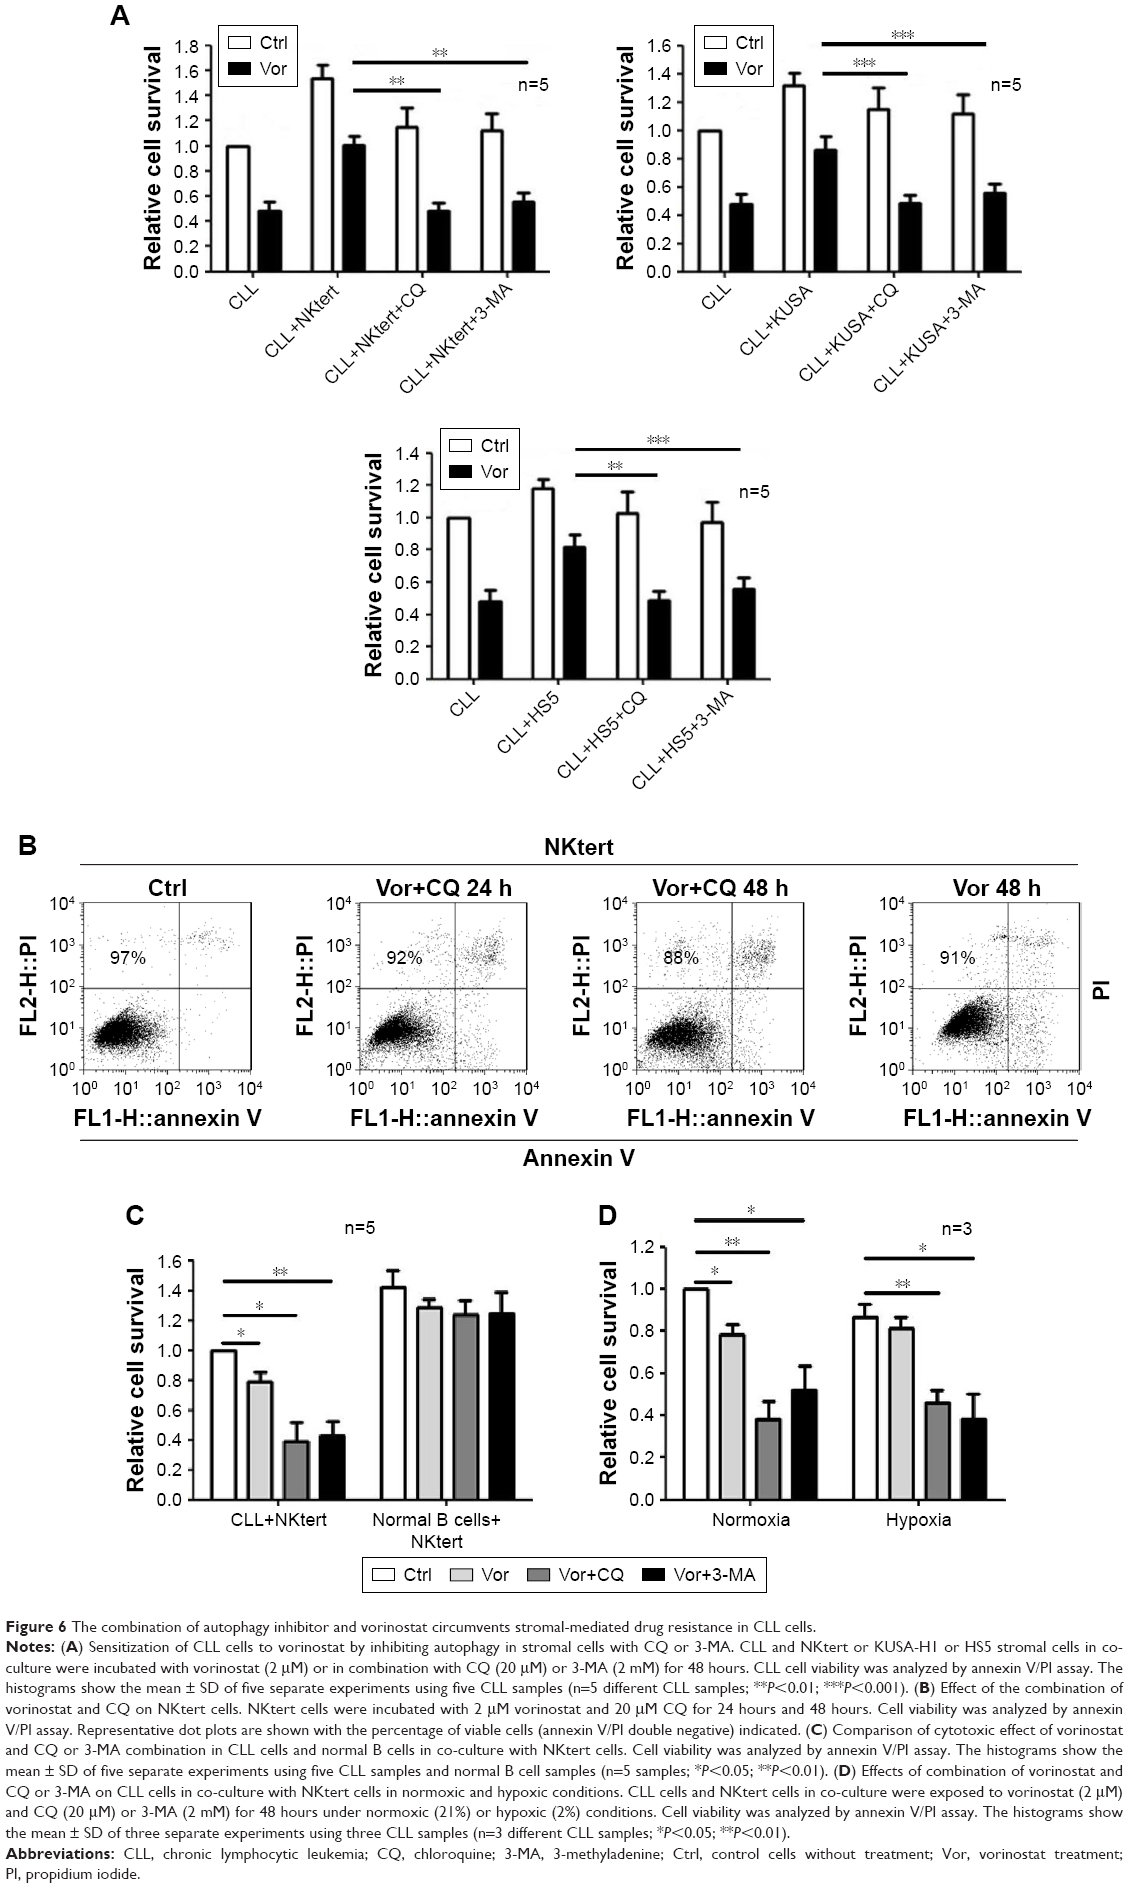 | Figure 6 The combination of autophagy inhibitor and vorinostat circumvents stromal-mediated drug resistance in CLL cells. |
Discussion
Despite the development of novel regimens, the overall survival of CLL patients has not improved sufficiently. The presence of drug resistance has severely hindered the successful treatment of CLL patients, leading to poor outcomes. Previous studies have suggested that the cross-talk between CLL cells and bone marrow stroma contributes to drug resistance.20,48,52,53 For example, bone marrow stromal cells secrete soluble factors, such as SDF-1a54 and IL-6,55 or upregulate extracellular matrix proteins such as integrins,56 which allows CLL cells to survive the insult of chemotherapy and therefore increases the probability of the development of drug resistance. Moreover, our previous work showed that stromal cells induced drug resistance by regulating the redox balance in CLL cells.31 In this work, we found that CLL cells induced oxidative stress in the co-cultured stromal cells, triggering stromal autophagy, which, in turn, supported the adjacent CLL cell survival through autophagy-activated glycolysis, thus contributing to the drug resistance of CLL cells.
To date, most studies of microenvironment-mediated drug resistance in leukemia have attributed the emergence of drug resistance to stroma-induced molecular or redox signaling pathways in leukemia cells, but little is known about how leukemia cells affect stroma, how stroma respond to chemotherapy, and how these factors influence leukemia cell survival and the development of drug resistance. In recent years, studies in solid tumors have revealed that cancer cell growth alters the normal tissues and affects their metabolism, which, in turn, provides various nutrient substances for tumor cell survival.57,58
Studies on hemotopoietic malignancy found that leukemic cell proliferation in the bone marrow disturbs the normal stromal microenvironment, and thus results in abnormal and malignant niches.20 This indicates that the stroma in leukemia patients is not normal. Here, by using a stroma–leukemia co-culture system, we found that bone marrow stroma underwent autophagy and glycolysis to feed adjacent CLL cells, especially after cytotoxic drug treatment. These findings verify that the leukemia cells and chemotherapy convert normal bone marrow stroma into leukemia-associated stroma, which could serve as an “energy factory” for leukemia cell survival and growth.
Autophagy is a process of cellular self-digestion that involves the degradation of intracellular cytoplasmic organelles and proteins.59 With cell autophagy, a large number of degraded products are supplied as recycled energy inputs for both biosynthesis and energy generation to prolong cell survival under metabolic stress.35,38,60 Mitophagy is a selective form of autophagy that is triggered by impaired mitochondria to maintain mitochondrial quality. The role of autophagy in cancer is complex, and its action depends on the cell type and the type of stress.38,61,62 In cancer cells with defects in apoptosis, autophagy promotes cell survival, whereas other studies suggest that autophagy provides a protective function to inhibit tumorigenesis.64–66 Some studies suggest that autophagy occurs not only in the cancer cell, but also in adjacent normal fibroblasts in the microenvironment of solid tumors.17–19 More specifically, oncogenic mutations in cancer cells promote autophagy and aerobic glycolysis in stroma to promote tumor progression and metastasis. In this study, the “autophagic tumor stroma model” was proven for the first time in a leukemia microenvironment. It is generally accepted that ROS induce autophagy.43,44 We found that CLL cells were under intrinsic oxidative stress that was enhanced by an ROS-generating drug, and released H2O2 outside the cells. The NKtert cells in co-culture took up H2O2 and then drove the onset of autophagy, mitophagy and glycolysis, resulting in the local production of high-energy mitochondrial fuels (such as L-lactate and ketone bodies). These energy nutrients were then taken up by CLL cells to be effectively utilized by mitochondrial oxidative phosphorylation to enable more ATP production. Furthermore, our previous study demonstrated that stroma increased GSH levels in the co-cultured CLL cells to release oxidative stress and protect CLL cells to ensure their survival.31 Indeed, in this study we found that the addition of exogenous GSH potentiated mitochondrial fuel-mediated upregulation of oxidative phosphorylation. A possible explanation for the synergistic effect is that GSH relieved the oxidative stress in CLL cells to some extent, which partially inhibited the oxidative damage to mitochondria and preserved functional mitochondria to effectively burn lactate or ketone bodies for oxidative mitochondrial metabolism. Given all this, this work provided a new molecular mechanism for understanding stroma-mediated protection of CLL cells.
Vorinostat, a histone deacetylase inhibitor, has been proven to kill CLL cells by inducing ROS-driven oxidative damage. Accumulating data point to an essential role for ROS in the activation of autophagy. Surprisingly, although CLL cells exhibited increased ROS levels, especially after vorinostat treatment, no obvious autophagy was observed in CLL cells. The result is consistent with our previous study, in which we demonstrated that vorinostat inhibited CLL cell survival by inducing apoptosis.31 Unlike CLL cells, NKtert cells showed no detectable increase in ROS after vorinostat treatment, which may be due to the failure of the ROS-generating system or the effectiveness of the antioxidant system in NKtert cells. Accordingly, no autophagy was observed in NKtert cells after vorinostat treatment. However, a considerable amount of ROS from CLL cells in the presence of vorinostat was taken up by NKtert cells and failed to be cleared by the antioxidant system, and finally promoted autophagy in NKtert cells. Our previous study demonstrated that bone marrow stroma efficiently decreased ROS level in CLL cells through increasing GSH synthesis.31 Nevertheless, in the present study, we showed that CLL cells in co-culture still maintained a considerable amount of ROS, especially after treatment with vorinostat, which caused an increased ROS level in adjacent stroma that could not be buffered, thus leading to the occurrence of stromal autophagy.
Although vorinostat has been proven to be effective to kill CLL cells in vitro, unfortunately, preclinical trials indicated that this vorinostat-induced cell killing effect is very limited in CLL patients,28,29 largely restricting its wider application for CLL treatment. Our previous work demonstrated that bone marrow stromal cells induce vorinostat resistance in CLL cells.31 Stroma-induced signaling pathways in cancer cells are increasingly being targeted by therapeutic approaches aiming to combat tumor microenvironment-mediated drug resistance. However, since little is known about cancer-associated changes in stroma and how such changes influence the development of drug resistance in cancer, most studies have not sought to target the cancer-associated stroma. One study showed that chemotherapy of bone marrow stromal cells decreased their ability to protect primary acute myeloid leukemia cells from the drug treatment.63 In the present study, we demonstrated that the treatment of stroma with autophagy pathway-specific siRNA or inhibitors, such as 3-MA or CQ, reduced the ability of stromal cells to protect CLL cells against vorinostat-induced apoptosis, and the combination of 3-MA or CQ and vorinostat had a combinatory effect to induce apoptosis in CLL cells in the presence of stromal cells. Notably, this combinatory effect killed CLL cells but spared normal B cells and stromal cells, indicating that the combination has therapeutic selectivity. Collectively, these data suggest that directly targeting leukemia-associated stroma may be an effective means of leukemia therapy, and the combination of autophagy inhibitors and vorinostat would have significant clinical impact.
Conclusion
We demonstrated that vorinostat treatment indirectly promotes autophagy, mitophagy and glycolysis of bone marrow stroma in leukemia microenvironment, and thus promotes the development of drug resistance in CLL cells. This finding broadens our understanding of microenvironment-mediated drug resistance in CLL cells and suggests that directly targeting stroma and associated signaling pathways may be an effective means of leukemia therapy.
Acknowledgment
The present study was supported by the Jiangxi Science and Technology Department (grant no 20161BBH80074, 20171BAB215080) and the National Natural Science Foundation of China (grant no 81760052).
Author contributions
WZ and HP conceived and designed the experiments; LD, LY, KZ and JZ performed the experiments; LD, RY, RH and WZ analyzed the data; and LD, WZ and HP drafted the manuscript. All authors contributed toward data analysis, drafting and revising the paper and agree to be accountable for all aspects of the work.
Disclosure
The authors report no conflicts of interest in this work.
References
Chiorazzi N, Rai KR, Ferrarini M. Chronic lymphocytic leukemia. N Engl J Med. 2005;352(8):804–815. | ||
Keating MJ, Chiorazzi N, Messmer B, et al. Biology and treatment of chronic lymphocytic leukemia. Hematology Am Soc Hematol Educ Program. 2003;2003(1):153–175. | ||
Puente XS, Pinyol M, Quesada V, et al. Whole-genome sequencing identifies recurrent mutations in chronic lymphocytic leukaemia. Nature. 2011;475(7354):101–105. | ||
Furman RR, Sharman JP, Coutre SE, et al. Idelalisib and rituximab in relapsed chronic lymphocytic leukemia. N Engl J Med. 2014;370(11):997–1007. | ||
Eichhorst B, Robak T, Montserrat E, et al. Chronic lymphocytic leukaemia: ESMO clinical practice guidelines for diagnosis, treatment and follow-up. Ann Oncol. 2015;26(Suppl 5):v78–v84. | ||
Zenz T, Mertens D, Küppers R, Döhner H, Stilgenbauer S. From pathogenesis to treatment of chronic lymphocytic leukaemia. Nat Rev Cancer. 2010;10(1):37–50. | ||
Montserrat E, Rozman C. Chronic lymphocytic leukaemia treatment. Blood Rev. 1993;7(3):164–175. | ||
Tam CS, Keating MJ. Chemoimmunotherapy of chronic lymphocytic leukemia. Nat Rev Clin Oncol. 2010;7(9):521–532. | ||
Rai KR, Chiorazzi N. Determining the clinical course and outcome in chronic lymphocytic leukemia. N Engl J Med. 2003;348(18):1797–1799. | ||
Tam CS, Keating MJ. Chemoimmunotherapy of chronic lymphocytic leukemia. Best Pract Res Clin Haematol. 2007;20(3):479–498. | ||
Munk Pedersen I, Reed J. Microenvironmental interactions and survival of CLL B-cells. Leuk Lymphoma. 2004;45(12):2365–2372. | ||
Gibson LF. Survival of B lineage leukemic cells: Signals from the bone marrow microenvironment. Leuk Lymphoma. 2002;43(1):19–27. | ||
Manabe A, Murti KG, Coustan-Smith E, et al. Adhesion-dependent survival of normal and leukemic human B lymphoblasts on bone marrow stromal cells. Blood. 1994;83(3):758–766. | ||
Paraguassú-Braga FH, Borojevic R, Bouzas LF, Barcinski MA, Bonomo A. Bone marrow stroma inhibits proliferation and apoptosis in leukemic cells through gap junction-mediated cell communication. Cell Death Differ. 2003;10(9):1101–1108. | ||
Wang L, Fortney JE, Gibson LF. Stromal cell protection of B-lineage acute lymphoblastic leukemic cells during chemotherapy requires active Akt. Leuk Res. 2004;28(7):733–742. | ||
Trachootham D, Zhang H, Zhang W, et al. Effective elimination of fludarabine-resistant CLL cells by PEITC through a redox-mediated mechanism. Blood. 2008;112(5):1912–1922. | ||
Chiavarina B, Whitaker-Menezes D, Migneco G, et al. HIF1-alpha functions as a tumor promoter in cancer associated fibroblasts, and as a tumor suppressor in breast cancer cells: Autophagy drives compartment-specific oncogenesis. Cell Cycle. 2010;9(17):3534–3551. | ||
Mao Y, Keller ET, Garfield DH, Shen K, Wang J. Stromal cells in tumor microenvironment and breast cancer. Cancer Metastasis Rev. 2013;32(1–2):303–315. | ||
Martinez-Outschoorn UE, Pavlides S, Whitaker-Menezes D, et al. Tumor cells induce the cancer associated fibroblast phenotype via caveolin-1 degradation: Implications for breast cancer and DCIS therapy with autophagy inhibitors. Cell Cycle. 2010;9(12):2423–2433. | ||
Colmone A, Amorim M, Pontier AL, et al. Leukemic cells create bone marrow niches that disrupt the behavior of normal hematopoietic progenitor cells. Science. 2008;322(5909):1861–1865. | ||
Mann BS, Johnson JR, Cohen MH, Justice R, Pazdur R. FDA approval summary: Vorinostat for treatment of advanced primary cutaneous T-cell lymphoma. Oncologist. 2007;12(10):1247–1252. | ||
Grant S, Easley C, Kirkpatrick P. Vorinostat. Nat Rev Drug Discov. 2007;6(1):21–22. | ||
Duvic M, Vu J. Vorinostat: A new oral histone deacetylase inhibitor approved for cutaneous T-cell lymphoma. Expert Opin Investig Drugs. 2007;16(7):1111–1120. | ||
Clarke JD, Hsu A, Yu Z, Dashwood RH, Ho E. Differential effects of sulforaphane on histone deacetylases, cell cycle arrest and apoptosis in normal prostate cells versus hyperplastic and cancerous prostate cells. Mol Nutr Food Res. 2011;55(7):999–1009. | ||
Marks PA, Breslow R. Dimethyl sulfoxide to vorinostat: Development of this histone deacetylase inhibitor as an anticancer drug. Nat Biotechnol. 2007;25(1):84–90. | ||
Petruccelli LA, Dupéré-Richer D, Pettersson F, et al. Vorinostat induces reactive oxygen species and DNA damage in acute myeloid leukemia cells. PLoS One. 2011;6(6):e20987. | ||
Richon VM, Garcia-Vargas J, Hardwick JS. Development of vorinostat: Current applications and future perspectives for cancer therapy. Cancer Lett. 2009;280(2):201–210. | ||
Blum KA, Advani A, Fernandez L, et al. Phase II study of the histone deacetylase inhibitor MGCD0103 in patients with previously treated chronic lymphocytic leukaemia. Br J Haematol. 2009;147(4):507–514. | ||
Byrd JC, Marcucci G, Parthun MR, et al. A phase 1 and pharmacodynamic study of depsipeptide (FK228) in chronic lymphocytic leukemia and acute myeloid leukemia. Blood. 2005;105(3):959–967. | ||
Zhang W, Trachootham D, Liu J, et al. Stromal control of cystine metabolism promotes cancer cell survival in chronic lymphocytic leukaemia. Nat Cell Biol. 2012;14(3):276–286. | ||
Zhang W, Pelicano H, Yin R, et al. Effective elimination of chronic lymphocytic leukemia cells in the stromal microenvironment by a novel drug combination strategy using redox-mediated mechanisms. Mol Med Rep. 2015;12(5):7374–7388. | ||
Levine B, Kroemer G. Autophagy in the pathogenesis of disease. Cell. 2008;132(1):27–42. | ||
Mizushima N, Levine B. Autophagy in mammalian development and differentiation. Nat Cell Biol. 2010;12(9):823–830. | ||
White E, Karp C, Strohecker AM, Guo Y, Mathew R. Role of autophagy in suppression of inflammation and cancer. Curr Opin Cell Biol. 2010;22(2):212–217. | ||
Mathew R, White E. Autophagy in tumorigenesis and energy metabolism: Friend by day, foe by night. Curr Opin Genet Dev. 2011;21(1):113–119. | ||
Kim KH, Lee MS. Autophagy – a key player in cellular and body metabolism. Nat Rev Endocrinol. 2014;10(6):322–337. | ||
Rabinowitz JD, White E. Autophagy and metabolism. Science. 2010;330(6009):1344–1348. | ||
Mathew R, Karantza-Wadsworth V, White E. Role of autophagy in cancer. Nat Rev Cancer. 2007;7(12):961–967. | ||
Lavieu G, Scarlatti F, Sala G, et al. Regulation of autophagy by sphingosine kinase 1 and its role in cell survival during nutrient starvation. J Biol Chem. 2006;281(13):8518–8527. | ||
Kubli DA, Åb G. Mitochondria and mitophagy. Circ Res. 2012;111:1208–1221. | ||
Kim I, Rodriguez-Enriquez S, Lemasters JJ. Selective degradation of mitochondria by mitophagy. Arch Biochem Biophys. 2007;462(2):245–253. | ||
Novak I. Mitophagy: A complex mechanism of mitochondrial removal. Antioxid Redox Signal. 2012;17(5):794–802. | ||
Scherz-Shouval R, Elazar Z. Regulation of autophagy by ROS: physiology and pathology. Trends Biochem Sci. 2011;36(1):30–38. | ||
Scherz-Shouval R, Shvets E, Fass E, et al. Reactive oxygen species are essential for autophagy and specifically regulate the activity of Atg4. EMBO J. 2007;26(7):1749–1760. | ||
Kawano Y, Kobune M, Yamaguchi M, et al. Ex vivo expansion of human umbilical cord hematopoietic progenitor cells using a coculture system with human telomerase catalytic subunit (hTERT)-transfected human stromal cells. Blood. 2003;101(2):532–540. | ||
Matsumoto S, Shibuya I, Kusakari S, et al. Membranous osteogenesis system modeled with KUSA-A1 mature osteoblasts. Biochim Biophys Acta. 2005;1725(1):57–63. | ||
Roecklein BA, Torok-Storb B. Functionally distinct human marrow stromal cell lines immortalized by transduction with the human papilloma virus E6/E7 genes. Blood. 1995;85(4):997–1005. | ||
Kurtova AV, Balakrishnan K, Chen R, et al. Diverse marrow stromal cells protect CLL cells from spontaneous and drug-induced apoptosis: development of a reliable and reproducible system to assess stromal cell adhesion-mediated drug resistance. Blood. 2009;114(20):4441–4450. | ||
Fischer Y, Thomas J, Sevilla L, et al. Insulin-induced recruitment of glucose transporter 4 (GLUT4) and GLUT1 in isolated rat cardiac myocytes. J Biol Chem. 1997;272(11):7085–7092. | ||
Pelicano H, Feng L, Zhou Y, et al. Novel strategy to enhance druginduced apoptosis in human leukemia cells by a reactive oxygen species-mediated mechanism. J Biol Chem. 2003;278:37832–37839. | ||
Hu Y, Lu W, Chen G, et al. K-ras(G12V) transformation leads to mitochondrial dysfunction and a metabolic switch from oxidative phosphorylation to glycolysis. Cell Res. 2012;22(2):399–412. | ||
Meads MB, Hazlehurst LA, Dalton WS. The bone marrow microenvironment as a tumor sanctuary and contributor to drug resistance. Clin Cancer Res. 2008;14(9):2519–2526. | ||
Panayiotidis P, Jones D, Ganeshaguru K, Foroni L, Hoffbrand AV. Human bone marrow stromal cells prevent apoptosis and support the survival of chronic lymphocytic leukaemia cells in vitro. Br J Haematol. 1996;92(1):97–103. | ||
James DF, Choi MY, Betty M, Mosadeghi R, Kipps TJ. Primary chronic lymphocytic leukemia (CLL) cells survival support from NLC and SDF-1a (CXCL-12) in vitro and the effect of lenalidomide (LEN). J Clin Oncol. 2008;26(15_suppl):7070. | ||
Dankbar B, Padró T, Leo R, et al. Vascular endothelial growth factor and interleukin-6 in paracrine tumor-stromal cell interactions in multiple myeloma. Blood. 2000;95(8):2630–2636. | ||
Bhatia R, Wayner EA, Mcglave PB, Verfaillie CM. Interferon-alpha restores normal adhesion of chronic myelogenous leukemia hematopoietic progenitors to bone marrow stroma by correcting impaired beta 1 integrin receptor function. J Clin Invest. 1994;94(1):384–391. | ||
das SK, Eder S, Schauer S, et al. Adipose triglyceride lipase contributes to cancer-associated cachexia. Science. 2011;333(6039):233–238. | ||
Nieman KM, Kenny HA, Penicka CV, et al. Adipocytes promote ovarian cancer metastasis and provide energy for rapid tumor growth. Nat Med. 2011;17(11):1498–1503. | ||
Boya P, Reggiori F, Codogno P. Emerging regulation and functions of autophagy. Nat Cell Biol. 2013;15(7):713–720. | ||
Jin S, White E. Role of autophagy in cancer: Management of metabolic stress. Autophagy. 2007;3(1):28–31. | ||
Eskelinen EL. The dual role of autophagy in cancer. Curr Opin Pharmacol. 2011;11(4):294–300. | ||
Kondo Y, Kanzawa T, Sawaya R, Kondo S. The role of autophagy in cancer development and response to therapy. Nat Rev Cancer. 2005;5(9):726–734. | ||
Garrido SM, Appelbaum FR, Willman CL, Banker DE. Acute myeloid leukemia cells are protected from spontaneous and drug-induced apoptosis by direct contact with a human bone marrow stromal cell line (HS-5). Exp Hematol. 2001;29(4):448–457. | ||
Aita VM, Liang XH, Murty VV, et al. Cloning and genomic organization of beclin 1, a candidate tumor suppressor gene on chromosome 17q21. Genomics. 1999;59(1):59–65. | ||
Liang XH, Jackson S, Seaman, M, et al. Induction of autophagy and inhibition of tumorigenesis by beclin 1. Nature. 1999;402(6762):672–676. | ||
Karantza-Wadsworth V, Patel S, Kravchuk O, et al. Autophagy mitigates metabolic stress and genome damage in mammary tumorigenesis. Genes Dev. 2007;21(13):1621–1635. |
Supplementary material
 | Table S1 Clinical and biological characteristics of 101 chronic lymphocytic leukemia patients |
 © 2018 The Author(s). This work is published and licensed by Dove Medical Press Limited. The
full terms of this license are available at https://www.dovepress.com/terms
and incorporate the Creative Commons Attribution
- Non Commercial (unported, 3.0) License.
By accessing the work you hereby accept the Terms. Non-commercial uses of the work are permitted
without any further permission from Dove Medical Press Limited, provided the work is properly
attributed. For permission for commercial use of this work, please see paragraphs 4.2 and 5 of our Terms.
© 2018 The Author(s). This work is published and licensed by Dove Medical Press Limited. The
full terms of this license are available at https://www.dovepress.com/terms
and incorporate the Creative Commons Attribution
- Non Commercial (unported, 3.0) License.
By accessing the work you hereby accept the Terms. Non-commercial uses of the work are permitted
without any further permission from Dove Medical Press Limited, provided the work is properly
attributed. For permission for commercial use of this work, please see paragraphs 4.2 and 5 of our Terms.