Back to Journals » OncoTargets and Therapy » Volume 10
Targeted TPX2 increases chromosome missegregation and suppresses tumor cell growth in human prostate cancer
Authors Pan HW, Su HH ![]() , Hsu C, Huang GJ, Wu TT
, Hsu C, Huang GJ, Wu TT
Received 8 March 2017
Accepted for publication 1 June 2017
Published 17 July 2017 Volume 2017:10 Pages 3531—3543
DOI https://doi.org/10.2147/OTT.S136491
Checked for plagiarism Yes
Review by Single anonymous peer review
Peer reviewer comments 3
Editor who approved publication: Dr Carlos E Vigil
Hung-Wei Pan,1,2,* Hsing-Hao Su,3,4,* Chao-Wen Hsu,5,6 Guan-Jin Huang,7 Tony Tong-Lin Wu6,8
1Department of Medical Education and Research, Kaohsiung Veterans General Hospital, Kaohsiung, 2Department of Applied Chemistry, National Pingtung University, Pingtung, 3Department of Otorhinolaryngology-Head and Neck Surgery, 4Department of Pharmacy and Graduate Institute of Pharmaceutical Technology, Tajen University, Pingtung, 5Division of Colorectal Surgery, Department of Surgery, Kaohsiung Veterans General Hospital, Kaohsiung, 6Faculty of Medicine, School of Medicine, National Yang-Ming University, Taipei, 7Department of Pathology, National Chung Kung University Hospital, Tainan, 8Department of Surgery, Kaohsiung Veterans General Hospital, Kaohsiung, Taiwan
*These authors contributed equally to this work
Abstract: Prostate cancer is a complex disease that can be relatively harmless or extremely aggressive. Although androgen-deprivation therapy is a commonly used treatment for men with prostate cancer, the adverse effects can be detrimental to patient health and quality of life. Therefore, identifying new target genes for tumor growth will enable the development of novel therapeutic intervention. TPX2 plays a critical role in chromosome segregation machinery during mitosis. Low rates of chromosome missegregation can promote tumor development, whereas higher levels might promote cell death and suppress tumorigenesis. Hence, the strategy of promoting cell death by inducing massive chromosome missegregation has been a therapeutic application for selectively eliminating highly proliferating tumor cells. RNAi was used for TPX2 protein expression knockdown, and a clonogenic assay, immunostaining, double thymidine block, image-cytometry analysis, and tumor spheroid assay were used to analyze the role of TPX2 in tumor cell growth, cell cycle progression, multinuclearity, ploidy, and tumorigenicity, respectively; finally, Western blotting was used to analyze anticancer mechanisms in TPX2 targeting. We demonstrated that targeting TPX2 reduced cell cycle regulators and chromosome segregation genes, resulting in increased cell micronucleation. Moreover, TPX2 depletion led to prostate cancer cell growth inhibition, increased apoptosis, and reduced tumorigenesis. These results confirmed the therapeutic potential of targeting TPX2 in prostate cancer treatment. Moreover, we found that TPX2 silencing led to deregulation of CDK1, cyclin B, securin, separase, and aurora A proteins; by contrast, p21 mRNA was upregulated. We also determined the molecular mechanisms for TPX2 targeting in prostate cancer cells. In conclusion, our study illustrates the power of TPX2 as a potential novel target gene for prostate cancer treatment.
Keywords: TPX2, prostate cancer, micronucleation
Introduction
Prostate cancer is the second most frequently diagnosed cancer and the sixth leading cause of cancer death in the Western male population.1 Prostate cancer, a complex disease, can be relatively harmless or extremely aggressive. Nevertheless, <15% of the cases with high-risk disease present with clinically significant prostate cancer.2 The use of neoadjuvant androgen-deprivation therapy and chemotherapy either solely or in combination before radical prostatectomy is generally safe and feasible for reducing prostate volume and tumor burden.3 Currently, pathologically complete response rates are low and no long-term survival benefit has been observed with the addition of neoadjuvant therapies over surgery alone. Although androgen-deprivation therapy is a commonly used treatment for men with prostate cancer, the adverse effects can be detrimental to patient health and quality of life.4 Therefore, the identification of new target genes for tumor growth can enable the development of novel therapeutic intervention.
A systems biology approach identified 20 significant mRNA associations with the aggressive phenotype of prostate cancer.5 These modules of interest were characterized by the overrepresentation of cell cycle-related genes. Notably, 10 of these 20 genes had a role in mitotic spindle regulation and chromosome segregation, including TPX2 (the targeting protein for Xklp2), which is a microtubule-associated homologue.5 This suggests that chromosome segregation machinery regulation is likely to be a molecular pathway causing aggressive phenotype prostate cancer.
In a study by Vainio et al, RNAi-based cell viability assay was performed in VCaP and LNCaP prostate cancer cells. TPX2 expression associated with prostate-specific antigen failure and TPX2 silencing reduced prostate-specific antigen expression and increased prostate cancer cell apoptosis, indicating that TPX2 is a potential novel drug target in prostate cancer.6 However, the molecular mechanisms of TPX2 targeting in prostate cancer cells and, particularly, the effect on cell cycle progression remain unclear.
TPX2 was first described in 1997 when Heidebrecht et al detected a 100 kDa protein, the expression of which was induced from the G1/S transition to cytokinesis.7 TPX2 was then reported to localize to the nucleus during the S and G2 phases and at the mitotic spindle poles during mitosis. TPX2 was found to play an important role in the spatial regulation of spindle assembly through small GTPase Ran modulation;8 after being released from import by Ran-GTP, it also triggers the nucleation of microtubules. Subsequent functional studies have established that TPX2 is essential for spindle assembly, especially for spindle pole organization in a variety of cell types.9 These features indicate that TPX2 plays a critical role in chromosome segregation machinery during mitosis.
Genomic instability is one of the hallmarks of cancer and it comprises different levels of genetic changes, ranging from the nucleotide to the chromosome level; the resulting genetic diversity expedites oncogenesis, together with epigenetic changes. Aneuploidy and chromosomal instability (CIN) are distinct, but closely related concepts that describe the chromosome-level genetic changes. Aneuploidy is the state that denotes the presence of an abnormal number of chromosomes in cells, which is found in the majority (70%–90%) of cancer cells.10–12 However, loss or gain of chromosomes is associated with many cancer cells. CIN can arise through chromosome missegregation from a lesion in the chromosome segregation machinery,13–15 and thus, new proposals include targeting the intrinsic CIN or aneuploidy that many tumor cells exhibit.16 Compelling evidence highlighted the double role of CIN in cancer: low levels of CIN result in a slight growth advantage and tumor promotion, whereas high levels of CIN lead to cell death and act as a tumor-suppressor mechanism.17 Consequently, the idea of promoting cell death by inducing massive chromosome missegregation during mitotic division has been proposed as a therapeutic strategy to selectively eliminate highly proliferating tumor cells.18
In this study, we proposed that targeting TPX2 leads to chromosome segregation error and increases massive aneuploidy during mitotic division, and that TPX2 serves as a target for therapeutic evolution in prostate cancer. Our results demonstrate that targeting TPX2 reduces cell cycle regulators and chromosome segregation genes, resulting in increased cell polyploidy and multinucleation. Moreover, TPX2 depletion leads to prostate cancer cell growth inhibition, reduced tumorigenesis, and increased apoptosis. These results confirm the therapeutic potential of targeting TPX2 during prostate cancer treatment.
Materials and methods
Immunohistochemistry staining for TPX2 protein detection
Four prostate cancer tissues from consecutive patients with clinically localized prostate cancer were treated with radical prostatectomy at Kaohsiung Veterans General Hospital. Our study was approved by the Ethical Committee of the Kaohsiung Veterans General Hospital (Institutional Review Board protocol: VGHKS13-CT2-007). All patients provided written informed consent for the use of tissue samples in this research. The TPX2 protein in whole-mount sections for radical prostatectomy specimens was detected on formalin-fixed, paraffin-embedded sections with an anti-TPX2 antibody (Sigma-Aldrich Corp, St Louis, MO, USA), by using the Mouse/Rabbit Probe HRP Labeling Kit (BioTnA, Kaohsiung, Taiwan).
TPX2 gene expression analysis from The Cancer Genome Atlas database
The Cancer Genome Atlas (TCGA) prostate adenocarcinoma (PRAD) gene expression was analyzed using RNAseq. The gene expression profile was experimentally measured using the Illumina HiSeq 2000 RNA Sequencing platform from the TCGA genome characterization center at the University of North Carolina. Level 3 interpreted data were downloaded from the TCGA data coordination center. This data set (ID=TCGA_PRAD_exp_HiSeqV2, version: 20150224) presents the gene-level transcription estimates according to the RSEM-normalized read counts. It was downloaded from the TCGA database (https://tcgadata.nci.nih.gov/tcgafiles/ftp_auth/distro_ftpusers/anonymous/tumor/prad/cgcc/unc.edu/illuminahiseq_rnaseqv2/rnaseqv2/) and includes both the clinical and gene expression data subsets. For clinicopathologic outcome and survival analysis, the RNA expression levels (read counts) of TPX2 were dichotomized as low expression and high expression with the cutoff value (6.8805) based on the 95th percentage expression level of 52 normal solid tissues. Hence, 276 PRADs scored as high expression and 191 PRADs as low expression. TPX2 expression level (read counts) was retrieved from the gene expression data subset and assembled into the clinical data subset for further analysis in the tumor versus normal and Gleason score data clusters.
Cell culture
Prostate cancer cell lines (PPC1, LNCap), breast cancer cell lines (AU565, MCF7, MDA-MB361, MDA-MB231), and human normal retinal pigmented epithelium cell line (ARPE19) were cultured in Roswell Park Memorial Institute (RPMI) 1640 or DMEM:F12 medium supplemented with 10% fetal bovine serum. The PPC1 cells were kindly provided by Dr John Reed. The cytogenetics and isoenzyme profiles of PPC1 are identical to PC-3 cells. The cell line also has been used in the field of prostate cancer research.19,20 The LNCap and breast cancer cell lines were kindly provided by Prof Hey-Chi Hsu, Graduate Institute of Pathology, College of Medicine, National Taiwan University, Taipei, Taiwan. The ARPE19 cells were kindly provided by Dr Wen-Huei Chang, Department of Applied Chemistry, National Pingtung University, Pingtung, Taiwan.
Reverse transcription-polymerase chain reaction
We used reverse transcription-polymerase chain reaction (RT-PCR) assays for the semiquantitative analysis of TPX2 mRNA by following previously described methods.21–24 The mRNA encoding S26 ribosomal protein (RPS26) was used as an internal control for the initial RNA loading. Polymerase chain reaction (PCR) was performed using a SelectCycler Thermal Cycler SBT9600 (Select BioProducts, Edison, NJ, USA). The quantification of mRNA expression levels (quantitative RT-PCR) was performed in an automated DNA thermal cycler, the StepOnePlus Real-Time PCR System (Thermo Fisher Scientific, Waltham, MA, USA). The human beta-actin gene (ACTB) was used as an internal control for quantitative RT-PCR. All quantitative PCR data were calculated and expressed using the 2−ΔCt method.
Western blot
The cells were harvested at specific time points after transient transfection, washed with phosphate-buffered saline (PBS), and subsequently lysed with lysis buffer (50 mM Tris-HCl at pH 8.0, 150 mM NaCl, 1% NP-40, 0.02% sodium azide, 1 μg/mL aproteinin, 1 mM phenylmethanesulfonyl fluoride). Protein samples (60 μg) were then separated using sodium dodecyl sulfate polyacrylamide gel electrophoresis (10% gels) and transferred to nitrocellulose membranes (GE Healthcare Europe GmbH, Freiburg, Germany). The membranes were then incubated with primary and secondary antibodies, and immunoreactive signals were detected using the WesternBright ECL kit (Advansta Inc., Menlo Park, CA, USA). Primary antibodies (dilution) for Western blot: cyclin A (1:100), cyclin B1 (1:100), cyclin B2 (1:200), cyclin E (1:100), CDK1 (1:100), CDK2 (1:100), and CDK4 (1:100), (Thermo Fisher Scientific); β-actin (1:10,000), separase (1:1,500), securin (1:500), and aurora B (1:500), all from Abcam (Cambridge, Milton Keynes, UK); TPX2 (Sigma-Aldrich Co.); aurora A (1:1,000; Leica, UK); and P21 (1:200; Cell Signaling Technology, Inc., Danvers, MA, USA). Secondary antibodies (dilution) for Western blot: goat anti-mouse IgG (1:10,000) and goat anti-rabbit IgG (1:10,000) (Thermo Fisher Scientific).
Small interfering RNA (siRNA) and knockdown of gene expression
The TPX2 siRNA oligos pool (1: 5′-GGACGAACCGGUAGUGAU-3′; 2: 5′-GCAUAAGGCAAAUCCAAUA-3′; 3: 5′-GUACCAUUGUUAAGCCUUU-3′; 4: 5′-GAAAUUCUACCCUCUAAGA-3′) was synthesized by Sigma-Aldrich Co. All transient transfections of the TPX2 siRNA oligos pool at a final concentration of 20 nM were accomplished with LipofectAMINE RNAiMAX (Thermo Fisher Scientific) according to the manufacturer’s protocols.
Cell proliferation, colony formation, and anchorage-independent (spheroid) growth
The initiated cell density for TPX2 siRNA transfection was 1.5×10⁵ cells per 2 mL suspension. For cell proliferation analysis, 1,000 living cells were plated on 96-well plates after transfection with the 20 nM siRNA oligos pool. The luminescence units indicating cell growth were determined at 0, 1, 2, and 3 days through the CellTiter-Glo Luminescent Cell Viability Assay (Promega, Madison, WI, USA). For colony formation assays, 2,500 cells were seeded in six-well plates and incubated for 2 weeks. The colonies were then fixed in 2% formaldehyde and stained with 0.5% crystal violet. Photographs were taken, and the number of colonies in each well was counted. For spheroid assays, 1,000 living cells were seeded in an ultralow attachment 96-well microplate (Corning Incorporated, Corning, NY, USA) and cell spheroids were visualized under a microscopic low-power field. Spheroid sizes (n=30) were measured using ImageJ software. The experiments and readings were repeated and analyzed using a two-sided Student’s t-test.
Cell cycle analysis (image-flow cytometry assay)
The cells were harvested and washed with PBS and then fixed in 0.5% formaldehyde for 1 h at 0°C. After a second wash with PBS, the cells were resuspended in 50% ethanol in PBS for 1 h at −20°C. The cells were again washed at least once with cold PBS and then resuspended in 300–500 μL of 4′,6-diamidino-2-phenylindole (DAPI)/Triton X-100 staining solution (1 μg/mL DAPI, 0.1% triton X-100 in PBS). Data for analysis were acquired using the NucleoCounter NC-3000 machine (Chemometec, Lillerød, Denmark) and Nucleoview NC-3000 software for automated image-flow cytometry analysis. Cell cycle distribution was determined using Nucleoview NC-3000 software.
Immunofluorescence staining
Cells cultured on coverslips were fixed in 4% paraformaldehyde in 1X PBS for 10 min at room temperature. After a wash in PBS, the cells were incubated with 1X phosphate buffered saline with Tween-20 (PBST) (0.2% Triton X-100 in 1X PBS) for 20 min and then in 5% fetal bovine serum blocking solution for 30 min. The cells were incubated with α-tubulin (1:500) and TPX2 (1:500) antibodies at 4°C overnight. After three 5 min washes with 1X PBST, the coverslips were incubated with a secondary antibody (1:1,000, Alexa Fluor-488 or 568-conjugated IgG; Thermo Fisher Scientific) and DAPI (2.5 μg/mL) for 60 min; the coverslips were then rewashed in 1X PBST another three times for 5 min each. The cells were mounted in 90% glycerol in Tris buffer (pH 10.0) and observed under a fluorescence microscope. Images were acquired with an Olympus IX81F-3 fluorescence microscope mounted with an Olympus DP70 digital camera. The nucleus morphology was counted at a low-power field (×20 magnifications, 20 fields were counted and averaged). The experiments and readings were repeated and analyzed using the two-sided Student’s t-test.
Annexin V detection
For image-flow cytometry assay, annexin V-fluorescein isothiocyanate/propidium iodide staining assay (Strong Biotech Corp., Taipei, Taiwan) was used for detecting cells in early apoptotic and late apoptotic stages. Cells were transfected with siRNA oligos for 72 h, harvested after incubation, and then washed in cold PBS. Subsequently, the cells were resuspended in 100 μL of annexin V-fluorescein isothiocyanate/propidium iodide staining solution and incubated for 10–15 min at 15°C–25°C. Next, the cells were collected and observed with a NucleoCounter NC-3000 machine (Chemometec) and Nucleoview NC-3000 software for automated image-flow cytometry analysis. A total of 20,000 cells were analyzed per sample. For fluorescence microscopy analysis, cells were transfected with siRNA oligos and grown on chamber slides for 72 h before the medium was removed and the slides were covered with a staining solution (100 μL/chamber); the cells were then further incubated for 10–15 min at 15°C–25°C. For the immunofluorescence assay, annexin V-positive cells were counted using low-power field fluorescence microscopy images. More than 10 low-power field images were counted and averaged.
Cell cycle PCR arrays
RT2 profiler PCR arrays were acquired from QIAGEN (Taipei, Taiwan) to analyze the expression of genes associated with cell cycle regulation (PAHS-020Z). To compare the expression of these genes in siRNA control (si-CTL)-transfected or si-TPX2-transfected cells, we used total RNA from si-CTL-transfected cells or si-TPX2-transfected cells from the 72 h siRNA oligos treatment. Two biologic RNA replicate mixtures were used to determine the gene expression in each group, and the five housekeeping genes on each array were used for normalization. RNA was reverse transcribed, and quantitative PCR reaction assays for PCR arrays were used in combination with the specially formulated and instrument-specific SYBR Green real-time PCR master mixes (Promega) according to the manufacturer’s instructions. Data were analyzed using the web-based software package PCR Array Data Analysis tool from QIAGEN to determine the gene expression fold-change calculations; the fold change of normalized expressions between si-CTL-transfected and si-TPX2-transfected cells was also calculated using the analysis tool. All genes that exhibited an expression change greater than fourfold were depicted on a graph with a logarithmic scale. All control features implemented on the array were passed and no genomic DNA contamination was detected. Furthermore, reverse transcription controls indicated no inhibition of the reaction and positive PCR controls demonstrated interwell and intraplate consistency.
Results
Upregulation of TPX2 expression in prostate cancer tissue specimens and prostate cancer cell lines
To elucidate the role that the level of TPX2 gene expression has on prostate cancer and form the basis for novel therapeutic strategies, we used an informatics-based analysis to determine the TPX2 gene expression in prostate cancer. We adopted an RNA sequence database of 498 PRADs and 52 normal solid tissues retrieved from the TCGA website, and found that the TPX2 gene had a higher expression level (read counts) in the tumor part (P<0.001), as shown in Figure 1A. Moreover, TPX2 expression levels were positively correlated with Gleason grade levels (R=0.467, P<0.001), as shown in Figure 1B. These results indicated that TPX2 is potentially upregulated in prostate cancer and is associated with malignant prostate cancer. We further evaluated the association of TPX2 levels with survival in prostate cancer patients. The TPX2 expression level was not significantly different in relation to cumulative survival (Figure 1C). However, in this TCGA cohort, the Gleason score was also not significantly different in relation to cumulative survival in prostate cancer patients (Figure 1D). To determine TPX2 expression in the cultured cell lines and prostate cancer tissues, we performed end-point and quantitative RT-PCR assay and immunohistochemistry staining for TPX2 mRNA and protein detection. The prostate and breast cancer cell lines versus ARPE19 cells (a human normal retinal pigmented epithelium cell) were used to figure out that TPX2 was upregulated on cancer cells but not on normal cells. By using end-point RT-PCR at the linear range and quantitative RT-PCR assay, we observed that TPX2 mRNA was highly expressed in human prostate and breast cancer cell lines than in normal retinal pigmented epithelium cell (Figure 1E). In addition, the immunohistochemistry staining results for TPX2 protein in the prostate cancer tissue sections revealed upregulated expression proportions in the tumor cell sections (Figure 1F).
 | Figure 1 Profile of TPX2 expression in prostate cancer and human cancer cells. |
TPX2 silencing inhibits prostate cancer cell growth
PPC1 cell was identified as the PC3 cell. We used the PPC1 cell for further experiments because it was easy to cultivate and higher transfection efficiency. To investigate the role of TPX2 in prostate cancer cell proliferation and to evaluate TPX2 functions in PPC1 cells, we synthesized four commercial siRNAi oligos for TPX2 silencing. A Western blot analysis revealed that the TPX2 transcript was downregulated by the TPX2 siRNA oligos (Figure 2A). Furthermore, depletion of TPX2 protein expression potently inhibited anchorage-dependent cell growth in the luminescent cell viability assay (Figure 2B), clonogenic formation assay (Figure 2C), and anchorage-independent cell growth by spheroid formation assay (Figure 2D) in PPC1 prostate cancer cells. These results indicated that TPX2 is a potential therapeutic target for prostate cancer.
 | Figure 2 Inhibition of cell growth and reduction of tumorigenesis in human prostate cancer cell lines via TPX2 silencing. |
TPX2 silencing increased sub-G1 and reduced G1 to S phase cells
To highlight the biologic role of TPX2 in the cell cycle progression of prostate cancer cells, we analyzed TPX2 expression during cell cycle progression using double thymidine or nocodazol block and release treatment. A Western blot analysis revealed that TPX2 protein expression was high at the G2/M phase, decreased at the G1 to S phase, increased at the beginning of S phase, and then peaked again at the next G2/M phase (Figure 3A). TPX2 depletion reduced the G1- and S-phase proportions; by contrast, inhibition of TPX2 expression resulted in high amounts of sub-G1 cells (cell death) and G2/M phase cells (4N DNA), as shown in Figure 3B and C. Annexin V staining assay (Figure 4A) revealed that TPX2 targeting increased annexin V-positive cells fourfold (Figure 4B); image-flow cytometry assay analysis revealed similar results for annexin-positive cells (Figure 4C). Overall, these results indicated that TPX2 targeting inhibited cell cycle progression and increased cell apoptosis of prostate cancer cells.
 | Figure 3 Increase of sub-G1 and reduction of G1 to S phase cells via TPX2 silencing. |
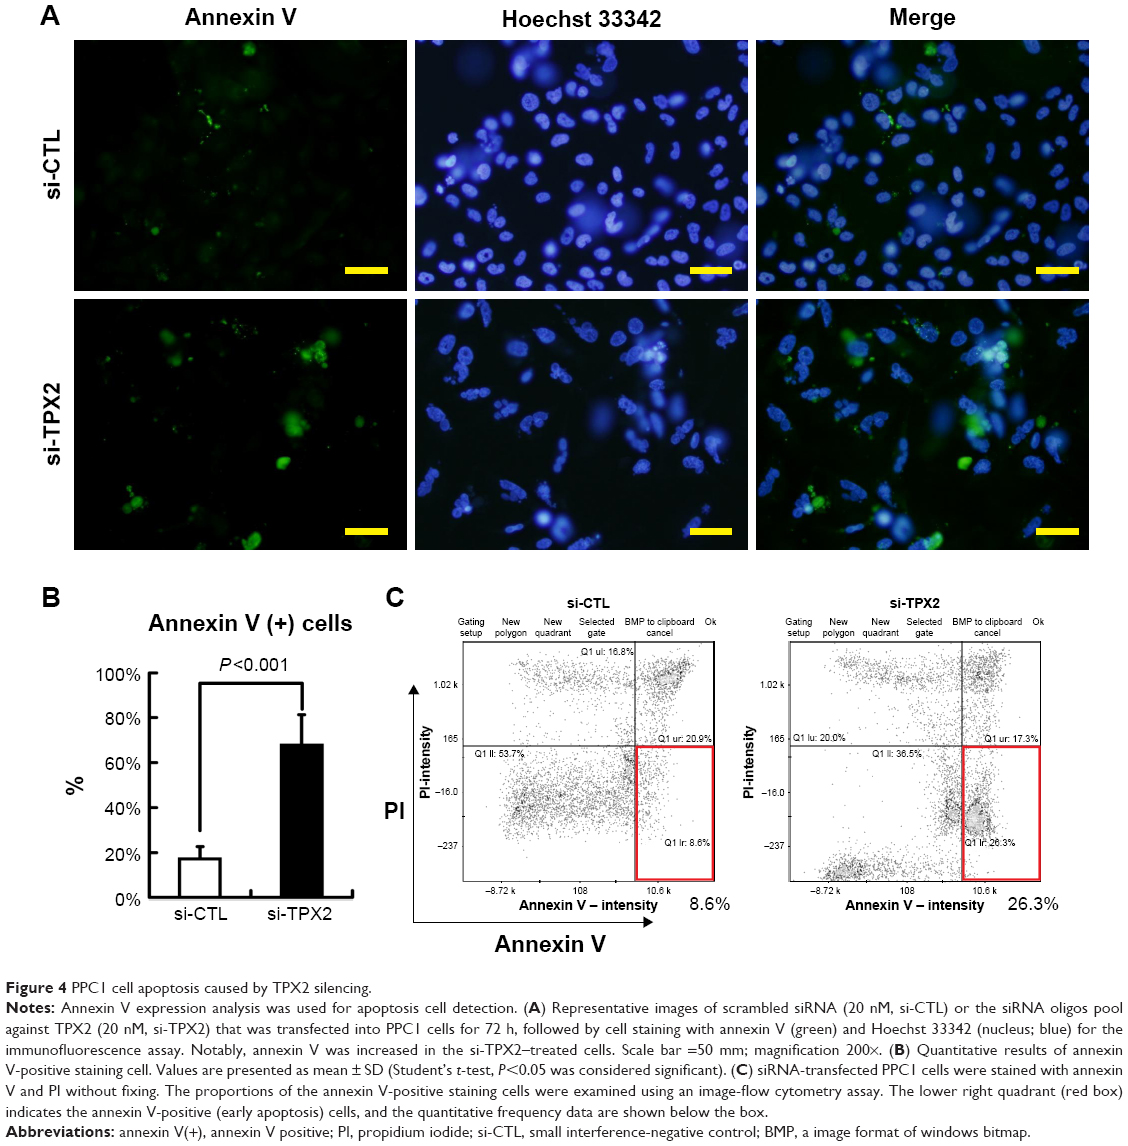 | Figure 4 PPC1 cell apoptosis caused by TPX2 silencing. |
Change in cell fitness in TPX2 depletion was reflected by changes in cell cycle regulation and features genes of chromosome segregation
To further characterize the molecular changes accompanying the depletion of TPX2 levels, we performed cell cycle pathway-focused real-time PCR analyses with PCR arrays. We queried the transcript of 84 genes involved in cell cycle regulation and assayed five housekeeping genes, comparing the expression levels of these genes in si-CTL-transfected and si-TPX2-transfected PPC1 cells. By using web-based analysis tools, we set a fourfold change as the cutoff to indicate the genes with significant expression change in TPX2-depleted PPC1 cells; the heat map shown in Figure 5A is a graphical representation of these fourfold gene expression changes. In TPX2-depleted PPC1 cells, we observed a global downregulation of cell cycle markers crucial for cell cycle progression and proliferation involved in all phases of the cell cycle. The scatter plot analysis (Figure 5B) revealed that 1 gene was upregulated and 15 genes were downregulated, and the relative fold change of all genes between si-CTL-transfected and si-TPX2-transfected PPC1 cells is presented in Figure 5C. A few genes were upregulated, among which one significantly upregulated gene was associated with cell cycle arrest (CDKN1A/p21); moreover, the top two and three upregulated genes were involved in antiproliferative or growth inhibitory action (CCNG1, CCNG2). By contrast, the 15 significantly downregulated genes were closely associated with G2/M transition and chromosome segregation procession (CDK1, CCNA2, AURKB, MAD2L1, CDC20, GTSE1, cyclin B2, and CDC25C), checkpoint and DNA damage control (CHEK1 and BRCA2), and the downregulation of proliferation markers (MKI67, BIRC5, CDK2, and CDK6) that resemble the lack of proliferation. These results suggested that targeting TPX2 causes defects in the G2/M transition and chromosome segregation progression in prostate cancer cells.
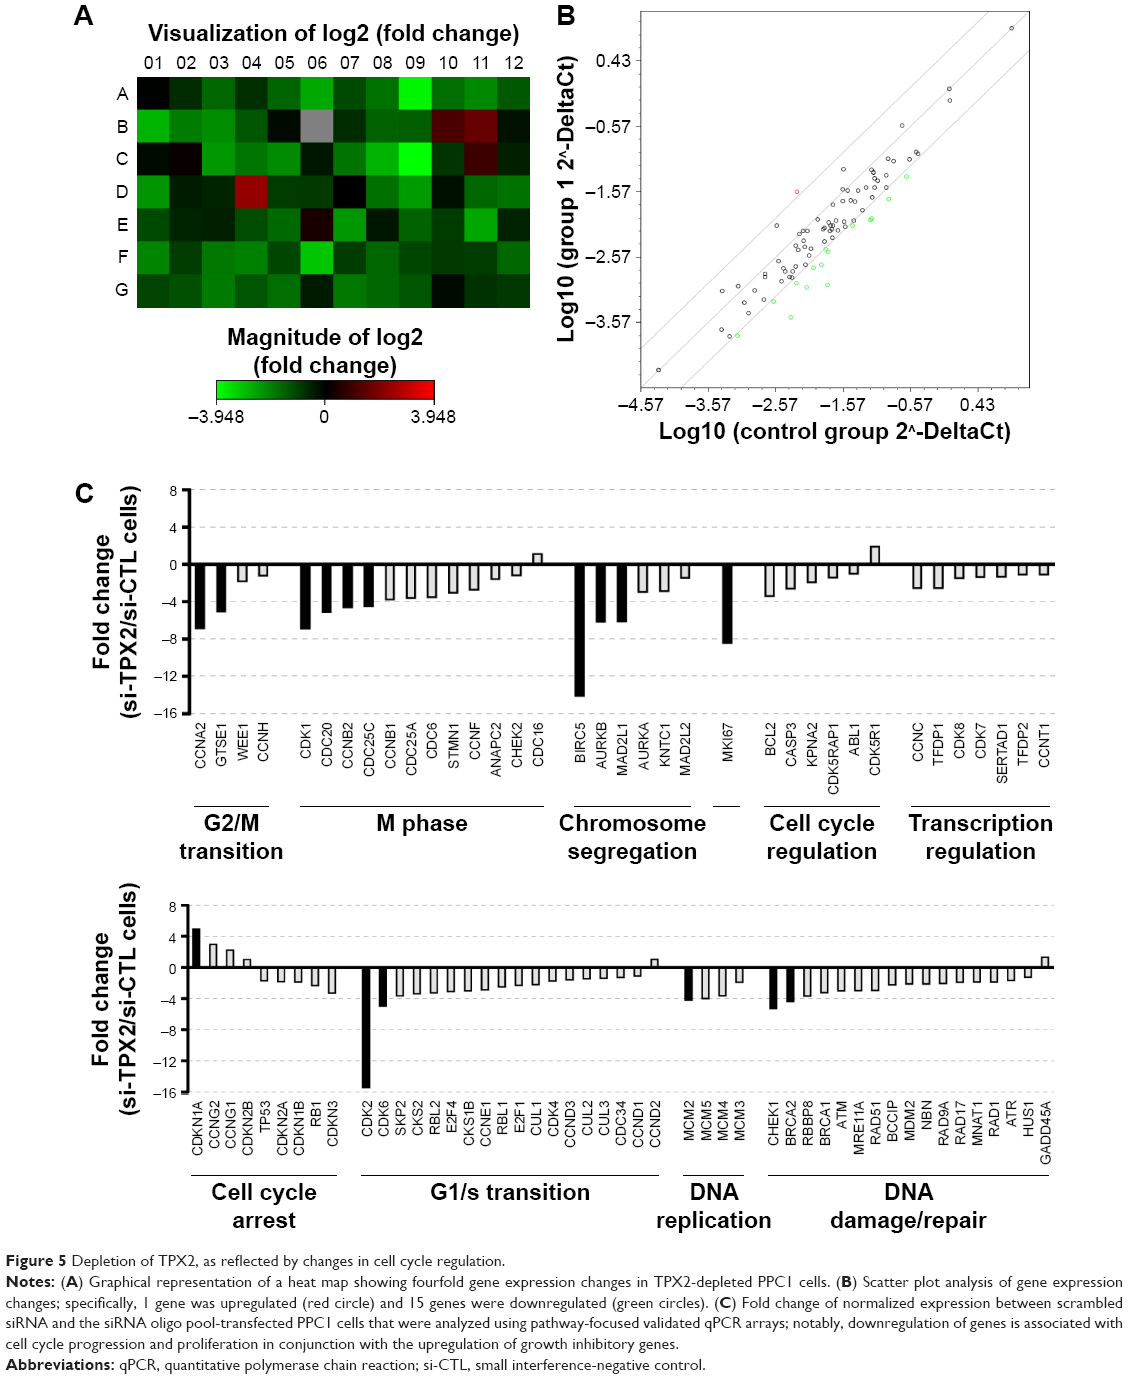 | Figure 5 Depletion of TPX2, as reflected by changes in cell cycle regulation. |
TPX2 targeting enhances micronucleated prostate cancer cells
Our results also demonstrated the change in the G2/M phase proportion and the feature genes of chromosome segregation after TPX2 depletion in prostate cancer cells. To further elucidate the role of TPX2 in the mitosis of prostate cancer cells, the morphologic examination of the nucleus was carried out, which revealed that TPX2 depletion markedly increased the number of micronucleated PPC1 cells, compared with the control RNAi oligo-transfected cells (Figure 6A and B). This result suggests defects during chromosome segregation; therefore, we further examined the chromosome segregation-related genes. A Western blot assay demonstrated that cyclin D1, CDK4, and CDK6 (G1 phase proteins) were reduced and p21 (cyclin-dependent kinase inhibitor) was increased; moreover, cyclin A and CDK2 (S phase proteins) were reduced, indicating the presence of a cell proliferation defect (Figures 2 and 4). Additionally, the G2/M phase proteins required for chromosome segregation, comprising cyclin B1, cyclin B2, CDK1, securin, separase, aurora A, and aurora B, were reduced after TPX2 depletion in prostate cancer cells (Figure 6C).
 | Figure 6 Increase in genomic instability via TPX2 depletion, resulting in micronucleation and DNA damage in PPC1 cells. |
TPX2 depletion changes the cell fitness in LNCap prostate cancer cell line
To elucidate the biologic role of TPX2 in cell fitness in prostate cancer cells, we analyzed the cell growth, spheroid formation, cell cycle progression, and nucleus morphologic examination in another prostate cancer cell line, LNCap. LNCaP cells grew as a loosely adherent layer of cells that were prone to growth in clusters. An RT-PCR and Western blot analysis revealed that the TPX2 transcript and protein were downregulated by the TPX2 siRNA oligos (Figure 7A). Depletion of TPX2 protein expression potently inhibited anchorage-dependent cell growth in the luminescent cell viability assay (Figure 7B) and anchorage-independent cell growth by spheroid formation assay (Figure 7C–E) in LNCap prostate cancer cells. TPX2 depletion reduced the sub-G1 phase proportions; by contrast, inhibition of TPX2 expression resulted in higher G2/M phase cells (4N DNA), as shown in Figure 7F and G. Similar to PPC1 cells, TPX2 depletion in LNCap cells reduced the protein expression of CDK1, cyclinB1, CDK2, cyclin A, and cyclin E (Figure 7H), indicating the presence of a cell proliferation defect. Morphologic examination of the nucleus revealed that TPX2 depletion slightly increased the number of multinucleated LNCap cells compared with the control RNAi oligo-transfected cells (Figure 7I and J). These results indicated that TPX2 depletion changes the cell fitness in LNCap prostate cancer cell line.
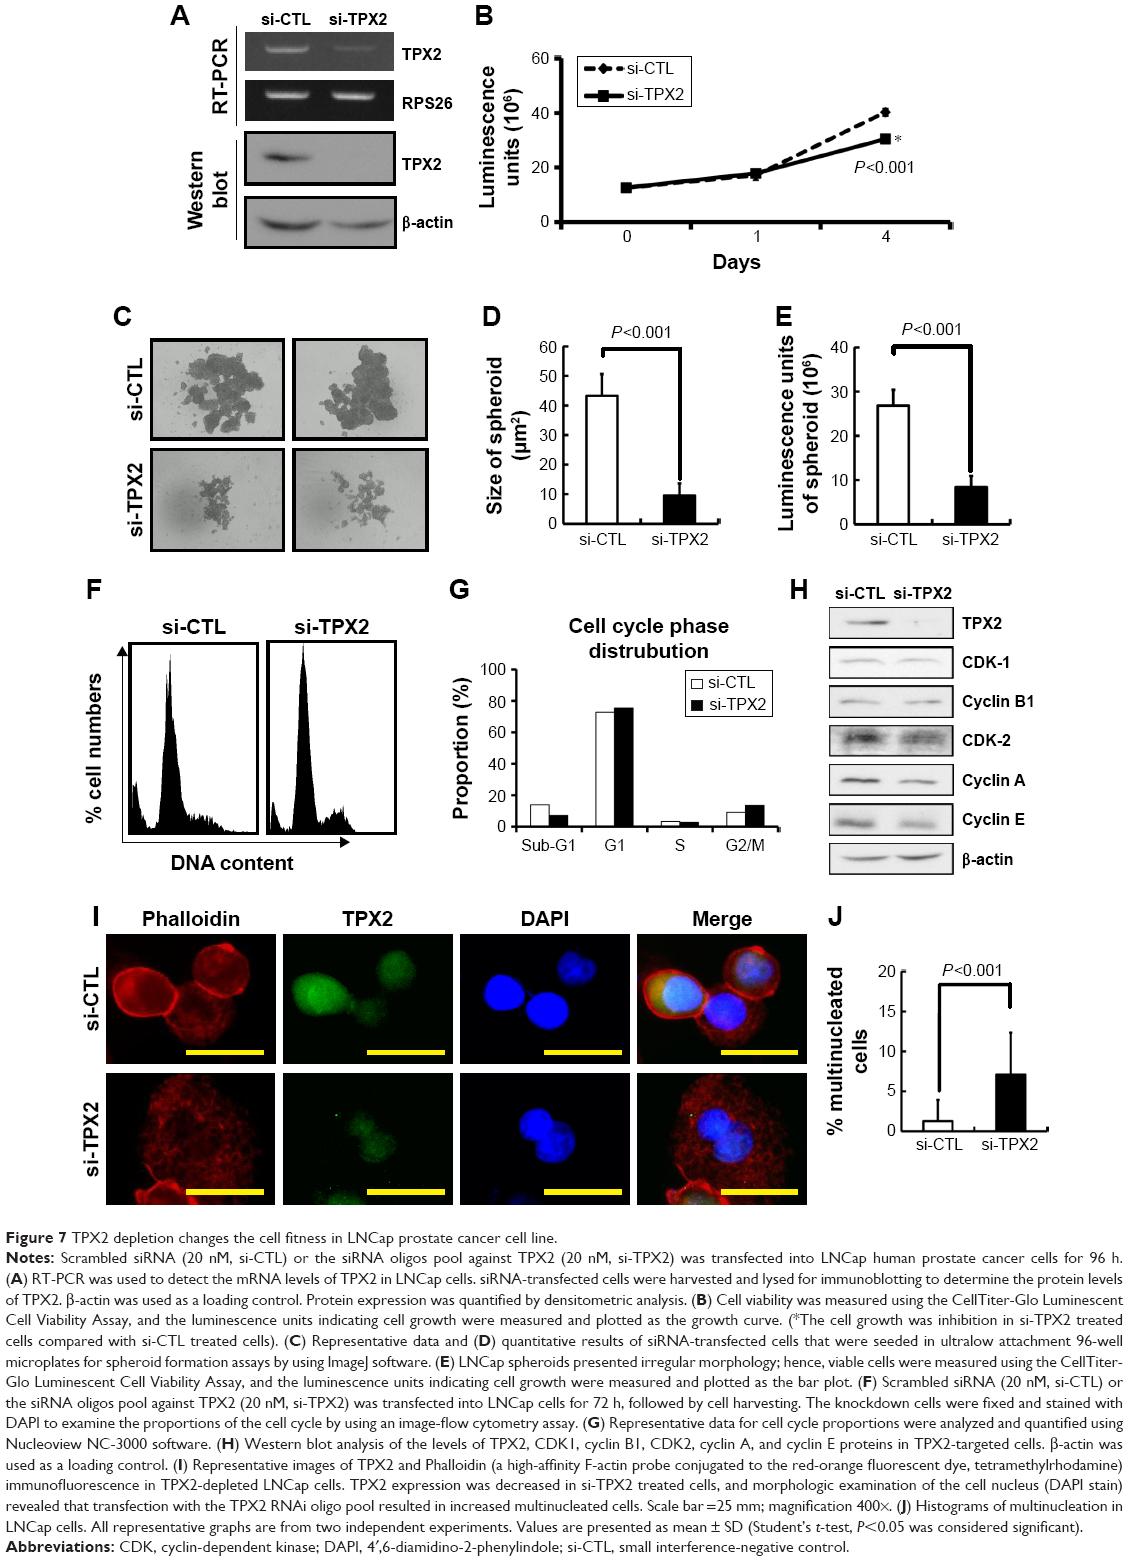 | Figure 7 TPX2 depletion changes the cell fitness in LNCap prostate cancer cell line. |
Discussion
Poor prognosis and drug resistance associated with CIN tumors render their treatment a considerable challenge.16,25 However, the frequency and clinical significance of CIN and its restriction to neoplastic tissue suggest that the CIN phenotype could be an attractive therapeutic target.10,16 CIN is a type of genomic instability characterized by mitotic defects that increase the rate of chromosome missegregation.26 Low rates of chromosome missegregation can promote tumor development, but higher levels can lead to cell death and suppression of tumorigenesis.17,27 Hence, the strategy of promoting cell death by inducing massive aneuploidy at chromosome missegregation has been used as a therapeutic application to selectively eliminate highly proliferating tumor cells.10,14–16,18,26 Most cancer cells are aneuploid and contain abnormal numbers of chromosomes, which is mainly caused by elevated levels of chromosome missegregation.10,27 Notably, as the micronuclei are cytoplasmic chromatin masses with the appearance of small nuclei that arise from lagging chromosomes at anaphase or from acentric chromosome fragments,28 and as they have mitotic defects and are genomically unstable, they can be used as a biomarker. In this study, we demonstrated that targeting TPX2 reduced cell cycle regulators and chromosome segregation genes, thus resulting in increased cell micronucleation. Moreover, TPX2 depletion led to prostate cancer cell growth inhibition, increased apoptosis, and reduced cancer cell growth. These results confirm the therapeutic potential of targeting TPX2 in prostate cancer treatment.
The spindle assembly checkpoint monitors the integrity of spindle microtubules, which attach to sister chromatids at kinetochores and play a vital role in preserving genome stability by preventing missegregation.29 Following DNA replication in the S phase, the sister chromatids are held together by cohesin. At the anaphase onset, the cohesin ring is opened, chromatid cohesion is lost, and the sisters are separated, which allows the spindle forces to pull them to opposite sides of the cell.30 The anaphase program is induced by the activity of the anaphase-promoting complex or cyclosome. Upon release from the spindle assembly checkpoint arrest, the anaphase-promoting complex or cyclosome begins to promote proteolysis of securin and cyclin B1. Degradation of cyclin B1 causes a decline in CDK1 activity, and that of securin induces the activation of separase. Thus, these changes promote the dissociation of sister chromatid cohesion and the poleward movement of sisters,31 which induces a change in the microtubule dynamics and results in the movement of sister chromatids to spindle poles, spindle elongation, and the onset of cytokinesis.32 This finding provides evidence that CDK1–cyclin-B–securin–separase axis regulation is essential for chromosome segregation procession. Moreover, inhibition of aurora B activated p21 and correlated with increased chromosome missegregation and aneuploidy in U2OS and HCT116 cells.33 Our results demonstrated that TPX2 silencing led to protein deregulation of CDK1, cyclin B, securin, separase, and aurora A protein; by contrast, p21 mRNA and protein were upregulated. This suggests that targeting TPX2 reduced the cell cycle regulators and chromosome segregation genes and resulted in increased cell micronucleation.
Several studies have proposed TPX2 as a potential drug target in ovarian, liver, and pancreatic cancers.34–37 Furthermore, a previous study revealed TPX2 as a potent candidate drug target in prostate cancer.6 Collectively, TPX2 is a candidate therapeutic target in a majority of prostate cancers.
Conclusion
Our study illustrated the power of TPX2 as a potential novel target gene for prostate cancer treatment. Furthermore, our study provided the molecular mechanisms for TPX2 targeting in prostate cancer cells. Finally, the study results provide several starting points for future preclinical and eventual clinical efforts for treating prostate cancer.
Acknowledgments
This study was supported by grants from the Ministry of Science and Technology in Taiwan (MOST103-2320-B-075B-001-MY3 to Hung-Wei Pan) and the Kaohsiung Veterans General Hospital Research Program in Taiwan (VGHKS104-073, VGHKS105-089 to Tony Tong-Lin Wu). We acknowledge Wallace Academic Editing for editing this manuscript.
Disclosure
The authors report no conflicts of interest in this work.
References
Torre LA, Bray F, Siegel RL, Ferlay J, Lortet-Tieulent J, Jemal A. Global cancer statistics, 2012. CA Cancer J Clin. 2015;65(2):87–108. | ||
Jemal A, Bray F, Center MM, Ferlay J, Ward E, Forman D. Global cancer statistics. CA Cancer J Clin. 2011;61(2):69–90. | ||
Lou DY, Fong L. Neoadjuvant therapy for localized prostate cancer: Examining mechanism of action and efficacy within the tumor. Urol Oncol. 2016;34(4):182–192. | ||
Grossmann M, Cheung AS, Zajac JD. Androgens and prostate cancer; pathogenesis and deprivation therapy. Best Pract Res Clin Endocrinol Metab. 2013;27(4):603–616. | ||
Wang L, Tang H, Thayanithy V, et al. Gene networks and microRNAs implicated in aggressive prostate cancer. Cancer Res. 2009;69(24):9490–9497. | ||
Vainio P, Mpindi JP, Kohonen P, et al. High-throughput transcriptomic and RNAi analysis identifies AIM1, ERGIC1, TMED3 and TPX2 as potential drug targets in prostate cancer. PLoS One. 2012;7(6):e39801. | ||
Heidebrecht HJ, Buck F, Steinmann J, Sprenger R, Wacker HH, Parwaresch R. p100: a novel proliferation-associated nuclear protein specifically restricted to cell cycle phases S, G2, and M. Blood. 1997;90(1):226–233. | ||
Gruss OJ, Vernos I. The mechanism of spindle assembly: functions of Ran and its target TPX2. J Cell Biol. 2004;166(7):949–955. | ||
Brunet S, Dumont J, Lee KW, et al. Meiotic regulation of TPX2 protein levels governs cell cycle progression in mouse oocytes. PLoS One. 2008;3(10):e3338. | ||
Tanaka K, Hirota T. Chromosomal instability: A common feature and a therapeutic target of cancer. Biochim Biophys Acta. 2016;1866(1):64–75. | ||
Hanahan D, Weinberg RA. Hallmarks of cancer: the next generation. Cell. 2011;144(5):646–674. | ||
Weaver BA, Cleveland DW. Does aneuploidy cause cancer? Curr Opin Cell Biol. 2006;18(6):658–667. | ||
Tanaka K, Hirota T. Chromosome segregation machinery and cancer. Cancer Sci. 2009;100(7):1158–1165. | ||
Duijf PH, Benezra R. The cancer biology of whole-chromosome instability. Oncogene. 2013;32(40):4727–4736. | ||
Janssen A, Medema RH. Genetic instability: tipping the balance. Oncogene. 2013;32(38):4459–4470. | ||
McGranahan N, Burrell RA, Endesfelder D, Novelli MR, Swanton C. Cancer chromosomal instability: therapeutic and diagnostic challenges. EMBO Rep. 2012;13(6):528–538. | ||
Silk AD, Zasadil LM, Holland AJ, Vitre B, Cleveland DW, Weaver BA. Chromosome missegregation rate predicts whether aneuploidy will promote or suppress tumors. Proc Natl Acad Sci U S A. 2013;110(44):E4134–E4141. | ||
Janssen A, Kops GJ, Medema RH. Elevating the frequency of chromosome mis-segregation as a strategy to kill tumor cells. Proc Natl Acad Sci U S A. 2009;106(45):19108–19113. | ||
Schimmer AD, Thomas MP, Hurren R, et al. Identification of small molecules that sensitize resistant tumor cells to tumor necrosis factor-family death receptors. Cancer Res. 2006;66(4):2367–2375. | ||
Wilkie-Grantham RP, Matsuzawa S, Reed JC. Novel phosphorylation and ubiquitination sites regulate reactive oxygen species-dependent degradation of anti-apoptotic c-FLIP protein. J Biol Chem. 2013;288(18):12777–12790. | ||
Pan HW, Ou YH, Peng SY, et al. Overexpression of osteopontin is associated with intrahepatic metastasis, early recurrence, and poorer prognosis of surgically resected hepatocellular carcinoma. Cancer. 2003;98(1):119–127. | ||
Pan HW, Chou HY, Liu SH, Peng SY, Liu CL, Hsu HC. Role of L2DTL, cell cycle-regulated nuclear and centrosome protein, in aggressive hepatocellular carcinoma. Cell Cycle. 2006;5(22):2676–2687. | ||
Lee YC, Pan HW, Peng SY, et al. Overexpression of tumour-associated trypsin inhibitor (TATI) enhances tumour growth and is associated with portal vein invasion, early recurrence and a stage-independent prognostic factor of hepatocellular carcinoma. Eur J Cancer. 2007;43(4):736–744. | ||
Lin SY, Pan HW, Liu SH, et al. ASPM is a novel marker for vascular invasion, early recurrence, and poor prognosis of hepatocellular carcinoma. Clin Cancer Res. 2008;14(15):4814–4820. | ||
Lee AJ, Endesfelder D, Rowan AJ, et al. Chromosomal instability confers intrinsic multidrug resistance. Cancer Res. 2011;71(5):1858–1870. | ||
Galimberti F, Thompson SL, Ravi S, Compton DA, Dmitrovsky E. Anaphase catastrophe is a target for cancer therapy. Clin Cancer Res. 2011;17(6):1218–1222. | ||
Holland AJ, Cleveland DW. Losing balance: the origin and impact of aneuploidy in cancer. EMBO Rep. 2012;13(6):501–514. | ||
Norppa H, Falck GC. What do human micronuclei contain? Mutagenesis. 2003;18(3):221–233. | ||
Huang X, Hatcher R, York JP, Zhang P. Securin and separase phosphorylation act redundantly to maintain sister chromatid cohesion in mammalian cells. Mol Biol Cell. 2005;16(10):4725–4732. | ||
Lara-Gonzalez P, Westhorpe FG, Taylor SS. The spindle assembly checkpoint. Curr Biol. 2012;22(22):R966–R980. | ||
Shindo N, Kumada K, Hirota T. Separase sensor reveals dual roles for separase coordinating cohesin cleavage and cdk1 inhibition. Dev Cell. 2012;23(1):112–123. | ||
Meadows JC, Millar JB. Sharpening the anaphase switch. Biochem Soc Trans. 2015;43(1):19–22. | ||
Kumari G, Ulrich T, Krause M, Finkernagel F, Gaubatz S. Induction of p21CIP1 protein and cell cycle arrest after inhibition of Aurora B kinase is attributed to aneuploidy and reactive oxygen species. J Biol Chem. 2014;289(23):16072–16084. | ||
Ramakrishna M, Williams LH, Boyle SE, et al. Identification of candidate growth promoting genes in ovarian cancer through integrated copy number and expression analysis. PLoS One. 2010;5(4):e9983. | ||
Satow R, Shitashige M, Kanai Y, et al. Combined functional genome survey of therapeutic targets for hepatocellular carcinoma. Clin Cancer Res. 2010;16(9):2518–2528. | ||
Warner SL, Stephens BJ, Nwokenkwo S, et al. Validation of TPX2 as a potential therapeutic target in pancreatic cancer cells. Clin Cancer Res. 2009;15(21):6519–6528. | ||
Hsu CW, Chen YC, Su HH, et al. Targeting TPX2 suppresses the tumorigenesis of hepatocellular carcinoma cells resulting in arrested mitotic phase progression and increased genomic instability. J Cancer. 2017;8(8):1378–1394. |
 © 2017 The Author(s). This work is published and licensed by Dove Medical Press Limited. The
full terms of this license are available at https://www.dovepress.com/terms
and incorporate the Creative Commons Attribution
- Non Commercial (unported, 3.0) License.
By accessing the work you hereby accept the Terms. Non-commercial uses of the work are permitted
without any further permission from Dove Medical Press Limited, provided the work is properly
attributed. For permission for commercial use of this work, please see paragraphs 4.2 and 5 of our Terms.
© 2017 The Author(s). This work is published and licensed by Dove Medical Press Limited. The
full terms of this license are available at https://www.dovepress.com/terms
and incorporate the Creative Commons Attribution
- Non Commercial (unported, 3.0) License.
By accessing the work you hereby accept the Terms. Non-commercial uses of the work are permitted
without any further permission from Dove Medical Press Limited, provided the work is properly
attributed. For permission for commercial use of this work, please see paragraphs 4.2 and 5 of our Terms.