")
Back to Journals » Neuropsychiatric Disease and Treatment » Volume 17
Clinically Significant Changes in the 17- and 6-Item Hamilton Rating Scales for Depression: A STAR*D Report
Authors Rush AJ , South C, Jain S, Agha R, Zhang M, Shrestha S, Khan Z, Hassan M, Trivedi MH
Received 4 February 2021
Accepted for publication 30 April 2021
Published 14 July 2021 Volume 2021:17 Pages 2333—2345
DOI https://doi.org/10.2147/NDT.S305331
Checked for plagiarism Yes
Review by Single anonymous peer review
Peer reviewer comments 2
Editor who approved publication: Dr Roger Pinder
Augustus John Rush, 1– 3 Charles South, 4 Shailesh Jain, 1 Raafae Agha, 1 Mingxu Zhang, 1 Shristi Shrestha, 1 Zershana Khan, 1 Mudasar Hassan, 1 Madhukar H Trivedi 5
1Department of Psychiatry, Texas Tech University Health Science Center, Midland, TX, USA; 2Department of Psychiatry and Behavioral Sciences, Duke University School of Medicine, Durham, NC, USA; 3Professor Emeritus, Duke-National University of Singapore, Singapore; 4Department of Statistical Science, Southern Methodist University, Dallas, TX, USA; 5Department of Psychiatry, University of Texas Southwestern Medical Center, Dallas, TX, USA
Correspondence: Madhukar H Trivedi
Department of Psychiatry, University of Texas Southwestern Medical Center, 5323 Harry Hines Blvd, Dallas, TX, 75390-9119, USA
Tel +1 214-648-0188
Fax +1 214-648-0167
Email [email protected]
Objective: To develop clinically meaningful improvement thresholds in both the 17-item and the 6-item Hamilton Rating Scale for Depression (HRSD) total scores in depressed outpatients.
Methods: The post-hoc analysis included all adult outpatients with non-psychotic major depressive disorder in the STAR*D trial who entered and exited the first treatment step (up to 14 weeks of citalopram) with a complete set of study measures at baseline and exit and at least one post-baseline measure. Within-patient change and linear regression anchor-based analyses were conducted to define meaningful and substantial changes in the HRSD 17 and HRSD 6 using three patient-reported outcomes [Work and Social Adjustment Scale (WSAS), Quality of Life Enjoyment and Satisfaction-Short Form (Q-LES-Q-SF); Mini-Q-LES-Q] obtained at baseline and exit from the first treatment step in STAR*D.
Results: Linear regression analyses identified a meaningful change threshold for the HRSD 17 as 3.9 [3.7– 4.1] [lower, upper 95% CI] and a substantial change as 7.8 [7.4– 8.3] with the WSAS. Analogous thresholds based on the Q-LES-Q-SF were 5.8 [5.5– 6.1] and 11.6 [11.0– 12.2], respectively, and 4.9 [4.7– 5.2] and 9.9 [9.3– 10.4] for the Mini-QLES-Q, respectively. For the HRSD 6, linear regression analyses with the WSAS identified a meaningful change as 2.2 [2.1– 2.4], while a substantial change was 4.5 [4.2– 4.7]. Analogous figures based on the Q-LES-Q-SF were 3.2 [3.0– 3.4] and 6.4 [6.1– 6.8]. Similarly, based on the Mini-QLESQ, results were 2.8 [2.6– 2.9] and 5.6 [5.3– 5.9]. For both the HRSD 17 and the HRSD 6, within-patient analyses produced less precise estimates of the same change thresholds with substantial overlap between groups. Based on the WSAS, a clinically meaningful change in the HRSD 17 total score was 9.6 (SD = 6.5), while a substantial change was 15.0 (SD = 6.7). Analogous change thresholds based on the Q-LESQ-SF were 12.9 (SD = 6.2) and 16.8 (SD = 6.4), respectively. For the Mini-Q-LES-Q, thresholds were 10.9 (SD = 6.5) and 16.1 (SD = 6.2).
Conclusion: A 4– 6 point change in the HRSD 17 is clinically meaningful; a 7– 12 point change is clinically substantial. For the HRSD 6, analogous estimates were 2– 3 and 4– 7 point changes, respectively.
Keywords: depression ratings, patient-reported outcomes, meaningful change
Plain Language Summary
Both researchers and a growing number of clinicians who are using measurement-based care employ standardized symptom rating scales to determine whether treatments for depression and other conditions are working effectively. The degree of symptom improvement that is meaningful to patients remains unclear. This information affects the likelihood that clinicians might consider modifying the dose, augmenting, or switching to another treatment. Researchers, care system managers, and regulatory agencies also want to know what proportion of patients have benefited at all or substantially in terms that matter to patients and their families.
This report used a secondary data analysis of a large representative sample of depressed outpatients treated in primary care and psychiatric outpatient settings. Based on a patient self-report of work and social adjustment and on two measures of quality of life, analyses estimated the degree of improvement in each of two commonly used Hamilton Rating Scales for Depression [the standard 17-item version (HRSD17) and the briefer 6-item version (HRSD6)]. A clinically meaningful improvement consisted of reducing 4–6 points in the HRSD17 total score or a 2–3 point reduction in the HRSD6 total score. A clinically substantial improvement was reducing 7–12 points on the HRSD17 total score or reducing 4–7 points in the HRSD6 total score. Of note, the 6-item HRSD6 performed as well as the longer 17-item version.
This report helps stakeholders (clinicians, researchers, administrators, regulators, and family members) understand the clinical relevance and meaning of various degrees of depressive symptom improvement on two widely used depression symptom rating scales.
Introduction
Major Depressive Disorder (MDD), a significant cause of disability1 and suicide worldwide,2 affects about 17% of the US population at least once in their lifetime3,4 costing the US economy $210.5 billion annually.5 Treatment for MDD aims to reduce depressive and associated symptoms and to restore function and quality of life. However, the degree of depressive symptom change during treatment, that is clinically meaningful to patients, is not well established for most depressive symptom measures.
Traditionally, clinical judgment has suggested several commonly accepted categories of degrees of benefit based entirely on clinician rated symptoms6 and informal consensus amongst clinical researchers. For example, at least a 75% reduction is typically regarded as “very much improved” or remission; 50% to 75% as “much improved” (or at least a response), and 35–49% as a partial response. These categories seem to have some validity because, for instance, response without remission, remission, and nonresponse are associated with statistically significant differences in patient self-reported psychosocial benefit7 or differential risk of symptomatic relapse.8,9
This report addressed this knowledge gap for two commonly used depressive symptom rating scales – the 17-item10 Hamilton Rating Scale for Depression (HRSD17) and the 6-item11–14 rating (HRSD6) – derived from the HRSD17 using quality of life measures to reflect depressed patients’ perspectives during acute phase antidepressant medication treatment. The HRSD17 and three patient-reported quality of life anchors including the 5-item Work and Social Adjustment Scale15 (WSAS); the 16-item Quality of Life Enjoyment and Satisfaction-Short Form16 (Q-LES-Q-SF) and the 7-item Mini-QLES-Q17 (derived from the Q-LES-Q-SF) and were provided by a sample of convenience-namely, the NIMH-funded Sequenced Treatment Alternatives to Relieve Depression (STAR*D) trial.18–20 While patient-reported outcomes do reflect patients’ perceptions of the disorder’s effect or its treatment on their lives,21–23 they can and do change over time and are likely affected by the negative thinking common in depression which covaries with overall depressive symptom severity.
Based on the literature,15,16,24–27 clinical experience with each rating scale and an examination of the ordinal response options for items on each scale, we came to an informal consensus apriori as to what would be regarded as meaningful and substantial degrees of change for each measure. Within-patient change and linear regression anchor-based analyses were conducted.
While distribution and anchor-based methods have been used to estimate meaningful change28 they have limitations.28 Anchor-based estimates are affected by the relationship between the anchor and the outcome of interest,28 the baseline severity of the condition (in this case depression), the duration and type of treatment, and population-specific features such as depression chronicity and comorbidity.28–30 Distribution and anchor-based methods often yield different results, even in the same sample.28 Finally, in this study, thresholds of meaningful and substantial change for each measure entailed clinician input – which risks losing the patient’s perspective as noted by Copay et al (2007).28 These limitations should be kept in mind as the results, even if found to be consistent across the anchors, are simply estimates from a single sample.
Methods
The secondary analysis used data from the Sequenced Treatment Alternatives to Relieve Depression (STAR*D) trial treatment first step with citalopram. The multi-site STAR*D trial enrolled outpatients with non-psychotic major depressive disorder in a multi-step, outcome rater-masked treatment trial.18,19,31,32
The STAR*D protocol was approved and monitored by the institutional review boards at the national coordinating center, the data coordinating center, 14 regional centers, relevant clinical sites, and the NIMH data safety and monitoring board (www.ClinicalTrials.gov, identifier number NCT00021528). This study was conducted in accordance with the Declaration of Helsinki. All participants signed written informed consent. The data used in this study report are available from Charles South at [email protected] until June 2022. The following highlights study elements that are germane to this report.
Participants
Representative, treatment-seeking, depressed outpatients, whom the clinicians felt were appropriately treated with antidepressant medication, were recruited from psychiatric and primary care practice settings in both the public and private sectors (July 2001-August 2004) across the United States.18,20 Advertising and symptomatic volunteers were proscribed. Participants were 18–75 years of age with non-psychotic single or recurrent MDD,18 based on DSM-IV, whose HRSD17 ≥14 (as obtained by a trained off-site rater). Few exclusion criteria were used. Specifically, persons who had failed to respond or could not tolerate any of the study medications were excluded. All other medication treatments for any condition were allowed except for stimulants, anticonvulsants, antipsychotic agents, mood stabilizers, and other potential antidepressant augmenting agents.
Protocol Treatment
To mimic clinical practice, enhance safety, personally tailor dosing, and maximize generalizability, all participants and treating clinicians were aware of the treatments and doses used. Flexible clinic visits were at baseline and weeks 2, 4, 6, 9, 12, and 14.
Measurement-based care (MBC) entailed the regular measurement of depressive symptoms and medication side effects at clinic visits accompanied by a pre-established dosing plan.18,20,32–35 MBC procedures were used to improve dosing and outcomes.36–41
This report used only data at entry into and exit from the first treatment step during which participants could receive up to 60mg/d of citalopram for up to 14 weeks. A description of the 4–5 treatment steps is available elsewhere.19 All other medications were allowed except for stimulants, anticonvulsants, antipsychotic agents, mood stabilizers, and other potential antidepressant augmenting agents.
Clinicians managed the patients based on their clinical experience, informed by the regular collection at each visit of the Quick Inventory of Depressive Symptoms or QIDS-C.35 Patients could exit this first-step treatment at any time. Those achieving symptomatic remission (defined a priori as ≤ 5 on QIDS-C) could enter the 1-year naturalistic follow up. Patients without a response (at least a 50% reduction in baseline QIDS-C) and those with a response that was short of remission were encouraged to enter the second treatment step, which could entail either a switch in treatment42 or an augmentation of the initial treatment.32 All participant treatment and management decisions were made independent of, and blind to, the collection of the baseline and exit HRSD17 and all self-reported quality of life ratings.
Measurements
The baseline and exit HRSD17 ratings in the first treatment step with citalopram were obtained by masked, off-site, trained raters.18 The 6-item HRSD6 was derived from the HRSD17 by scoring the following 6 items from the HRSD17: item 1-depressed mood; item 2-guilt; item 7-work and interest; item 8-psychomotor retardation; item 10-psychic anxiety; and item 13-somatic symptoms, general.13
Two health-related quality of life patient-reported outcomes, the WSAS and Q-LES-Q-SF, were also obtained at baseline and at the exit from this first treatment step by a telephone-based Interactive Voice Response (IVR) system.43 This system used a telephone-based automated voice recording to pose the questions to the patient. The patient responded to each question by pushing the designated touch tone button to answer yes or no. Questions with more than 2 answers were posed in 2–3 steps- each of which could be answered as a yes no response (Mundt JC, Perrine MW, Searle JS et al; an application of interactive Voice response (IVR) Technology two longitudinal studies of daily behavior. Behavior research methods, instruments, and computers: 27351 open 357, 1995). This system has been used to measure depressive symptom severity with accuracy that is comparable to clinical interview or self-report paper and pencil testing.44 We derived the 7-item Mini-Q-LES-Q self-report from the Q-LES-Q-SF with the aim of providing a sensitive measure of the change in life quality that was easier to use.17
The 5-item WSAS15 self-report asks respondents to estimate the degree of impairment that they attribute to their health problems in the following five domains: work, home management, social leisure activities, private leisure activities, and close relationships. Each domain is rated from 0 (not at all) to 8 (very severely) on a Likert scale. In STAR*D, the last week was rated. WSAS total scores can range from 0 to 40, with higher scores indicating worse function. WSAS score above 20 suggests moderately severe impairment. In contrast, scores from 10 to 20 signify less severe impairment based on two treatment outcome studies involving over 500 patients with depression or OCD.15 Cronbach’s alpha (internal consistency) ranged from 0.70 to 0.94.15
The Q-LES-Q-SF16 is a self-report assessment tool that includes 16 items of which 14 are scored to estimate total quality of life. The two unscored items #15 and # 16 rate medication satisfaction and overall satisfaction. The 14 scored items rate various domains such as work, leisure activities, family relationships, and physical health among others. The total score summarizes each respondent’s degree of satisfaction for each domain. Ratings can vary from 1 – very poor to 5 – very good) over the previous 7 days in 14 domains. Scores range from 14–70, with higher scores indicating greater life satisfaction/enjoyment. Test-retest reliability (0.86) and internal consistency (Cronbach’s alpha) (0.86 to 0.90) are acceptable.45,46
The Q-LES-Q-SF domains shown to be most sensitive to symptom change comprise the 7-item, unidimensional, Mini-Q-LES-Q self-report. Thus, the MINI-Q-LES-Q excludes vision, physical mobility, economic status, and living/housing.17 The Mini-Q-LES-Q rates satisfaction over the past seven days with work, household activities, social relationships, family relationships, leisure time activities, ability to function in daily life, and overall sense of wellbeing. Scores range from 7–35, with higher scores indicating greater satisfaction and enjoyment. Cronbach’s alpha was 0.84. Correlations between the Mini-Q-LES-Q with the Q-LES-Q-SF total scores were 0.91–0.97, suggesting minimal loss of information in the 7-item version.17
Statistical Analysis
The analytic sample included only those STAR*D participants who received citalopram in the first treatment step for whom baseline and exit HRSD17, WSAS, and Q-LES-Q-SF scales were all available. Additionally, to ensure that comparable time periods were being rated, patients for whom more than seven days elapsed between the collection of the HRSD17 (by remote masked raters) and the WSAS and Q-LES-Q-SF (collected by the telephone interactive voice response system) were excluded.
Two anchor-based approaches - a within-patient change approach and a multiple linear regression approach - were used to identify modest but clinically meaningful and clinically substantial changes in HRSD17 and HRSD6 total scores.
Selection of Quality of Life Change Thresholds
Following the examination of the response choices for each item on each anchor (WSAS, Q-LES-Q-SF, MINI-Q-LES-Q), and relevant publications, we used clinical consensus to arrive at two thresholds of change that we considered modest but meaningful and substantial for each anchor.
The WSAS respondents designate the degree of impairment they experience in each domain due to current problems where 0 designates no impairment and 8 designates severe impairment. Responses of “slightly”, “definitely” and “markedly” are rated as 2, 4, and 6, respectively. Thus, we judged that a 2-point change on any item would represent a minimal but meaningful change in impairment in that particular domain. Our clinical judgment was that a meaningful but modest change would be just a bit under 10 points and settled on an 8-point threshold. We felt that twice that degree of change would be substantial.
For the Q-LES-Q-SF, we examined the report47 of an 8 week, double-blind, randomized controlled trial of patients in the depressed phase of bipolar I or II disorder treated with either quetiapine or placebo. Quetiapine-treated patients had a Q-LES-Q-SF change of 8–12 points more significant than the placebo-treated group’s analogous changes depending on the quetiapine dose (300 vs 600mg/d), though both changes were statistically significant. These data, our previous work with this measure in a treatment-resistant population,48 and our experience with this rating led us to select a 12-point change as modest but clinically meaningful and a change of twice that value as clinically substantial.
For the 7-item Mini-Q-LES-Q, we halved the totals chosen apriori for the 14-item Q-LES-Q. Thus, a threshold of 6 defined a “modest” and a “substantial” change by 12 (Table 1).
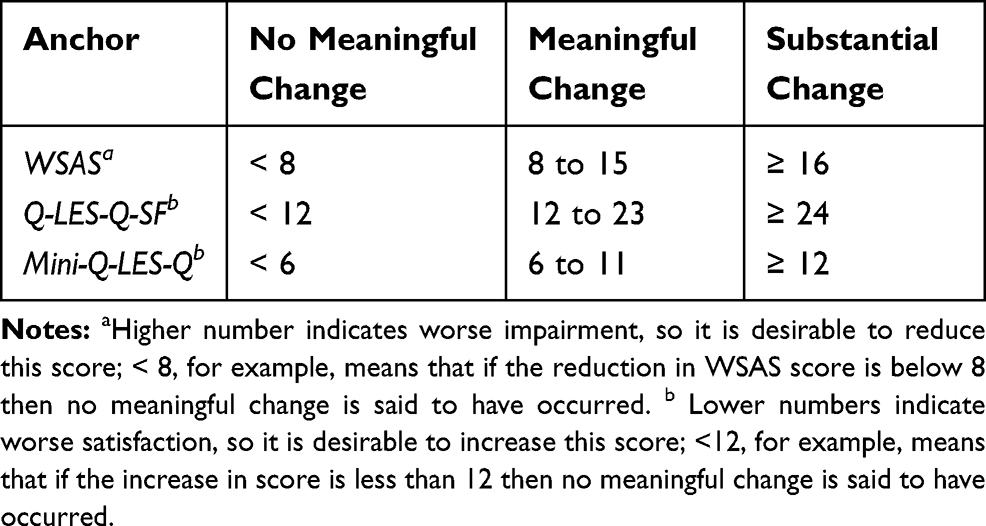 |
Table 1 Change Thresholds for Each Anchor |
Analytic Approaches
Within-Patient Change
For this approach, based on the baseline to exit change in each total anchor score, patients are classified into one of the three groups: no meaningful change (NMC), modest but meaningful change (MC), and substantial change (SC). Then, the distribution of these three degrees of change for the HRSD17 and the HRSD6 were analyzed to determine whether the mean HRSD17 or HRSD6 total score changes were different between the three groups and to estimate the mean change between each pair of groups. A one-way analysis of variance was used to compare the means, and post-hoc comparisons were derived using the Tukey–Kramer method (separately for each anchor). All analyses were conducted using R Statistical Software49 (https://www.r-project.org/).
Multiple Linear Regression
The regression approach examined the expected change in the HRSD17 or HRSD6 given a modest (or substantial) change in the corresponding anchor. To do this, multiple linear regression models were fit with the change in HRSD17 (or HRSD6) as the outcome and change in the anchor as the primary covariate, with baseline HRSD17 (or HRSD6) score, baseline anchor score, and length of time in level 1 (in weeks) as additional covariates. The structure of the model was thus

where  is the estimated change in HRSD for a given patient,
 is the observed change in the anchor for a given patient,
  is the observed baseline HRSD score for a given patient,
  is the observed baseline anchor score for a given patient, and
  is the number of weeks of treatment received in Level 1. The slope parameter
  , then, represents the expected change in HRSD for a one-unit increase in the change in the anchor. This value can be multiplied by the minimal or substantial change values identified in Table 1 to give an estimate of the clinically significant differences being sought (and confidence intervals can also be generated).
Pairwise scatter plots were used to explore the reasonableness of the linearity assumption, and pairwise correlations were also calculated. For model validation, 30% of the available data was randomly held out of the model-fitting process and the performance was subsequently evaluated on this hold-out set. The adjusted R2, root mean squared error (RMSE) on the test data, and the percentage of predicted values in the test set within five points of the truth were calculated to gain a sense of model efficacy. Note that the RMSE can be (roughly) thought of as a normalized distance between the observed and predicted values, where smaller values indicate a better model fit (though the magnitude is dependent on the magnitude of the outcome).
Results
Table 2 summarizes the clinical and demographic features of the analytic sample.
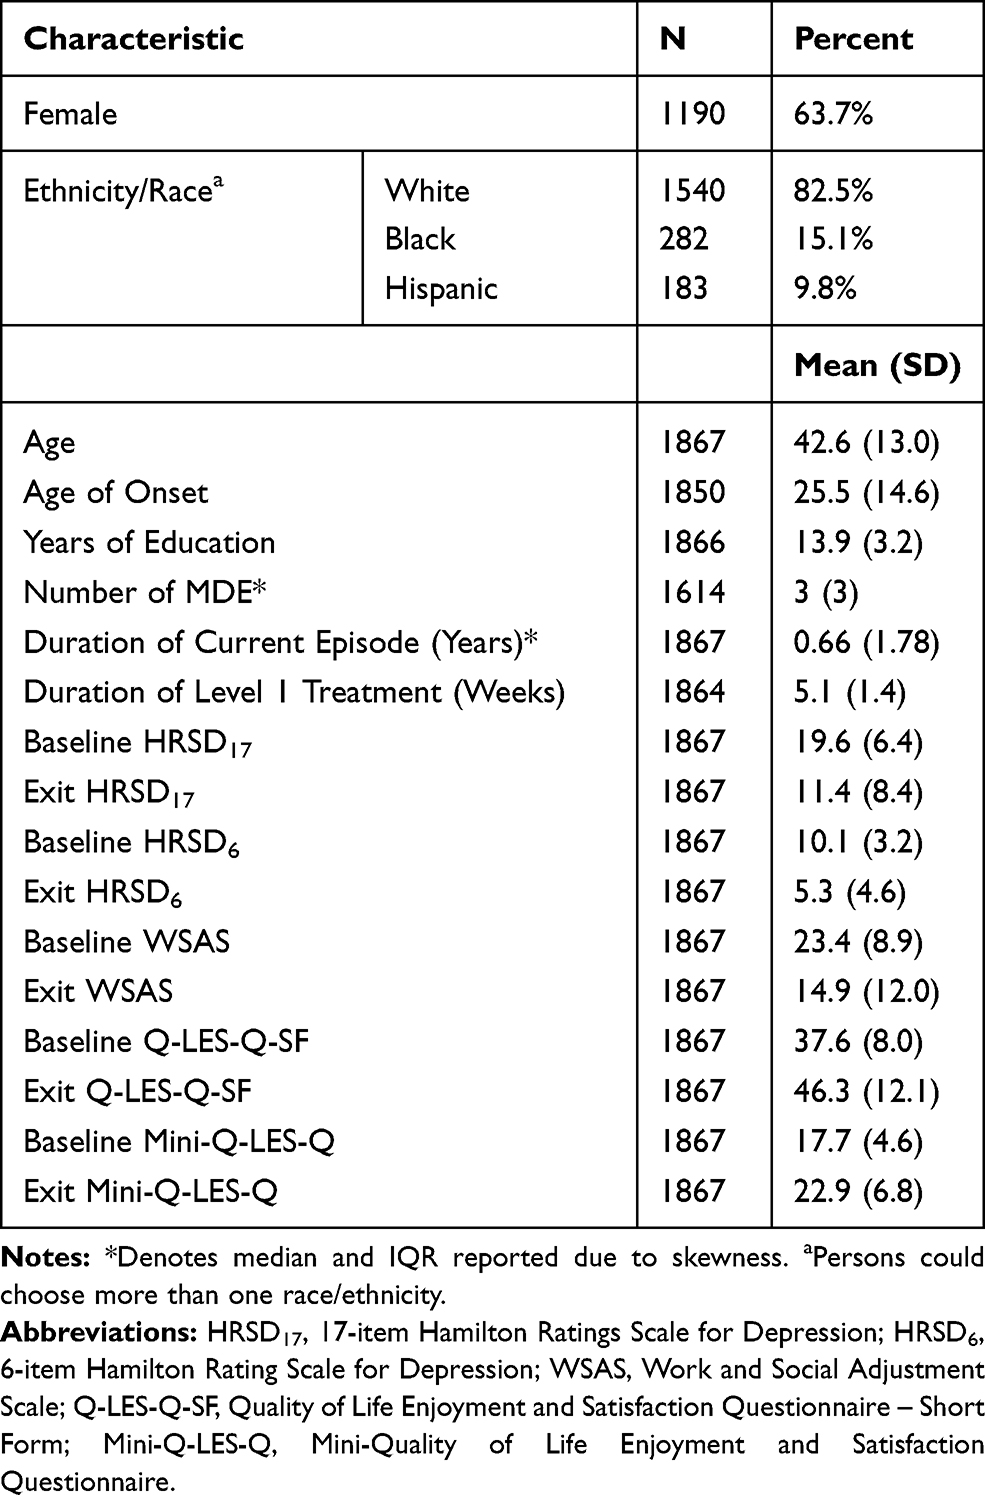 |
Table 2 Clinical and Demographic Features of the Sample (n=1867) |
Within-Patient Change HRSD17
There was strong evidence that the mean HRSD17 change differed for at least two of the groups for each anchor ( for the WSAS, Q-LES-Q-SF, and Mini-Q-LES-Q, respectively, with p < 0.0001 in all three cases). Post-hoc comparisons revealed that each pair of means differed for each anchor. Table 3 summarizes the means for each group in each anchor; for those patients in the modest but meaningful change group (as defined a priori in Table 1), the corresponding average change in HRSD17 was 9.6 based on the WSAS, 12.9 with the Q-LES-Q-SF, and 10.9 for the Mini-Q-LES-Q.
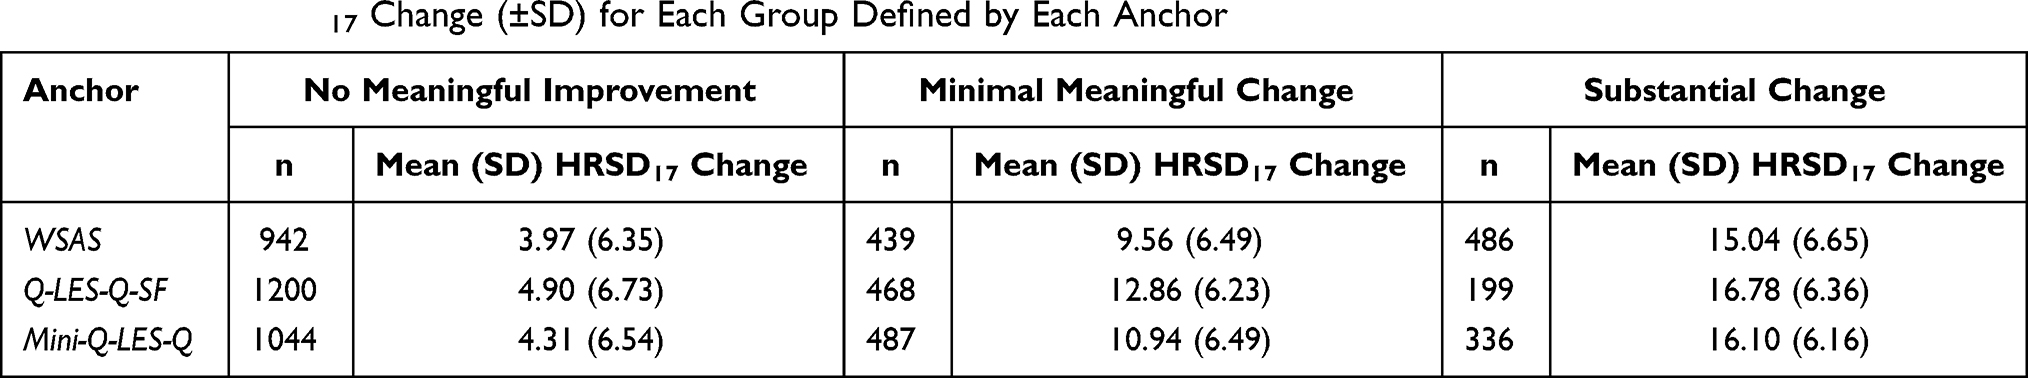 |
Table 3 Mean HRSD17 Change (±SD) for Each Group Defined by Each Anchor |
Based on the thresholds chosen for each health-related quality of life anchor (see Table 1), we created three categories of beneficiaries (no meaningful change-NMC; modest but meaningful change-MC; substantial change-SC). Figure 1 shows the distributions of the baseline to exit HRSD17 changes found in each category of benefit defined by these anchor-based groupings.
Despite the statistically significant distinctions between means for each of the three groups for each anchor (Table 3), there is substantial overlap in the distributions of baseline to exit changes in the HRSD17 in each category for each anchor. As expected, overall, the NMC group always had the smallest center (slightly above 0 for all anchors) followed by the meaningful change (MC) and substantial change (SC) groups. The distributions show that an HRSD17 change of 10 was reasonably likely in all anchors (keeping in mind that the height of the distribution at any given point corresponds to the likelihood of that value occurring).
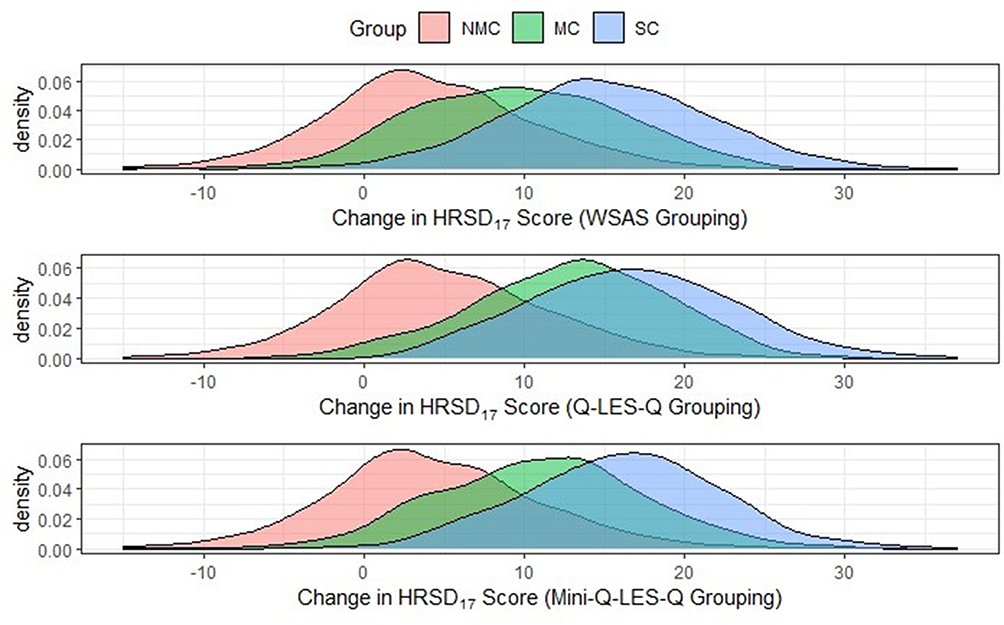 |
Figure 1 The distributions of the change in HRSD17 for each anchor group. Abbreviations: HRSD17, 17-item Hamilton Rating Scale for Depression; WSAS, Work and Social Adjustment Scale; Q-LES-Q-SF, Quality of Life Enjoyment and Satisfaction Questionnaire – Short Form; Mini-Q-LES-Q, Mini-Quality of Life Enjoyment and Satisfaction Questionnaire; NMC, No Meaningful Change in the anchor; MC, modest but meaningful change in the anchor; SC, Substantial change on the anchor. Note: Density refers to the probability of getting a particular change in HRSD17 score between a range of scores (higher density means more frequently occurring). |
Multiple Linear Regression-HRSD17
Each anchor generated separate regression models. In each anchor, the model was initially built on 1307 patients, with the remaining 560 held out for subsequent testing. In all three models (for the WSAS, Q-LES-Q-SF, and the Mini-Q-LES-Q), all four predictors (which include baseline HRSD17, baseline anchor scores, the change in anchor score, and the length of time in treatment) were statistically significant. That is, each of these four elements was predictive of the change in HRSD17. Therefore, they need to be controlled to establish the relationship between the change in each anchor and the baseline to exit change in the HRSD17.
Figure 2 shows pairwise scatter plots and correlations between baseline changes to exit HRSD17, Q-LES-Q-SF, and the Mini-Q-LES-Q. These figures and corresponding correlations reveal strong evidence that the change in HRSD17 score is linearly associated with changes in each of the three anchors, with values that range from 0.605 to 0.955 in magnitude.
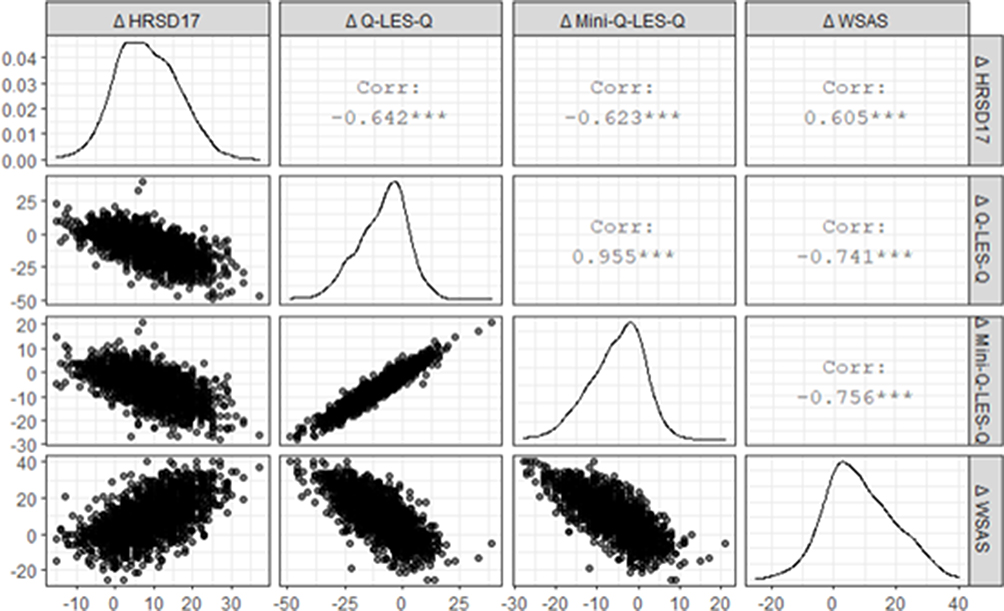 |
Figure 2 Pairwise Scatter Plots. Abbreviations: HRSD17, 17-item Hamilton Rating Scale for Depression; WSAS, Work and Social Adjustment Scale; Q-LES-Q-SF, Quality of Life Enjoyment and Satisfaction Questionnaire – Short Form; Mini-Q-LES-Q, Mini-Quality of Life Enjoyment and Satisfaction Questionnaire. Notes: The x-axis shows the change score values corresponding to the measure designated in each column; on the diagonal are density plots of the distribution of change scores, meaning the y-axis shows density (similar to Figure 1); for all other plots, the y-axis shows change score values corresponding to row names. |
Table 4 summarizes each model’s pertinent information, including model fit statistics and the estimated modest but meaningful and substantial change values in the HRSD17 as defined in Table 1. For example, with the WSAS as the anchor, after controlling for a patient’s baseline depression severity, baseline WSAS score, and length of time in treatment, an 8-unit increase in the WSAS score (which was chosen apriori) corresponds to a 3.92 unit change in HRSD17 (95% CI [3.70, 4.13]). Further, the outcome variable (change in HRSD17) was predicted to within 5 units of the truth in 69% or more of all subjects in the test set – indicating that the model is robust and generalizable to the population of subjects included in the study.
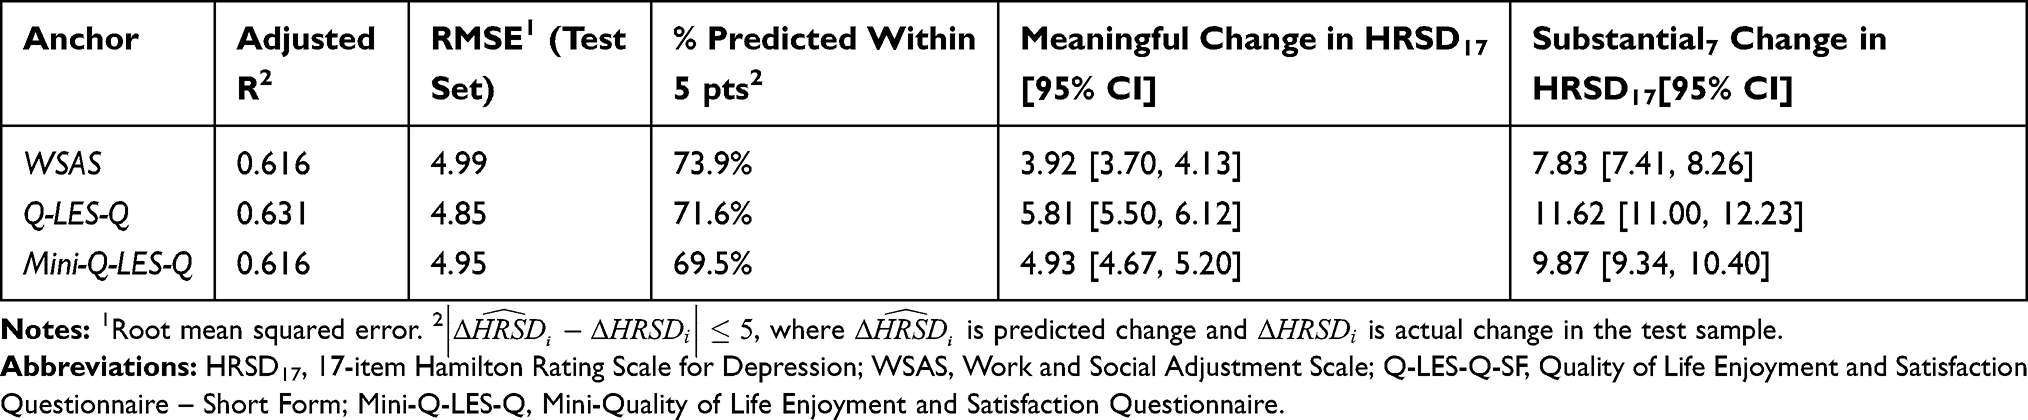 |
Table 4 Multiple Linear Regression Results |
Analyses for the HRSD6
Within-Patient Change Approach HRSD6
There was strong evidence that the mean HRSD6 change differed for at least two of the groups for each anchor ( for the WSAS, Q-LES-Q-SF, and Mini-Q-LES-Q, respectively, with p < 0.0001 in all three cases). Post-hoc comparisons found that each pair of means differed for each anchor. Table 5 summarizes the means for each group in each anchor; for those patients in the modest but meaningful change group (as defined a priori in Table 1), the corresponding average change in HRSD6 was 5.7 for the WSAS, 7.6 for the Q-LES-Q-SF, and 6.5 for the Mini-Q-LES-Q.
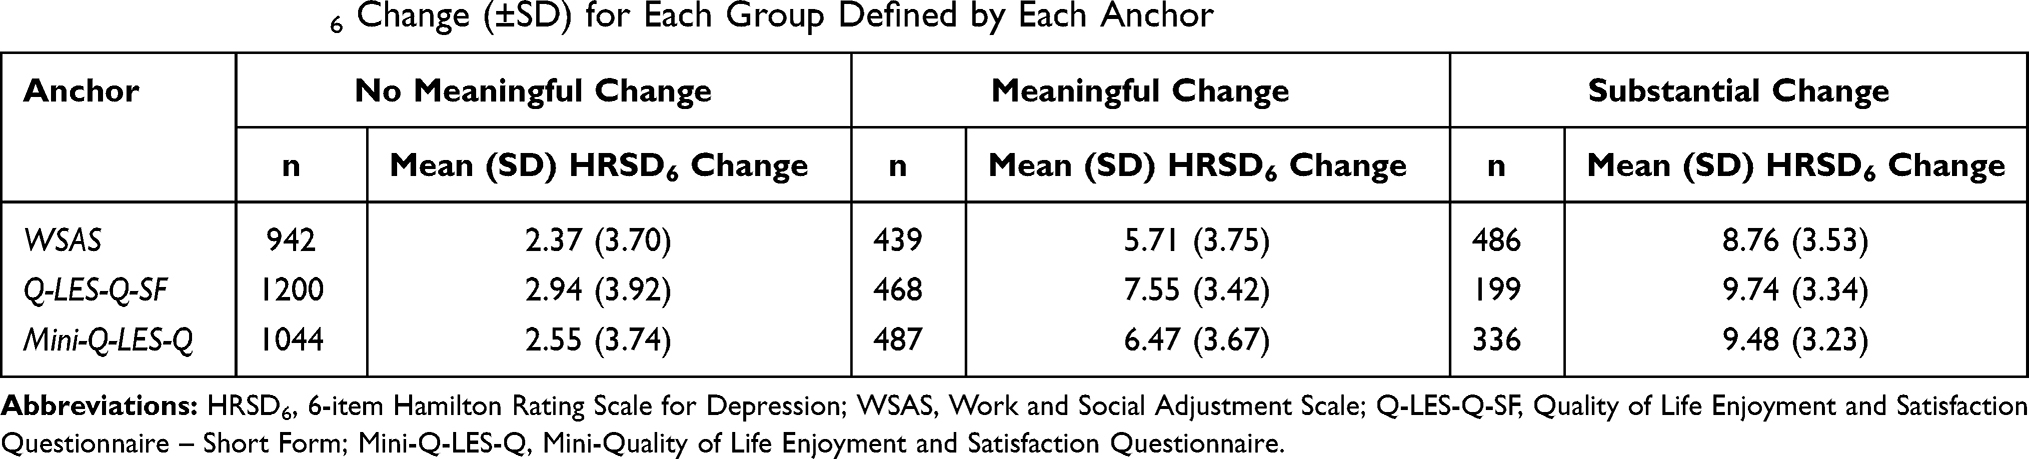 |
Table 5 Mean HRSD6 Change (±SD) for Each Group Defined by Each Anchor |
Figure 3 shows the baseline distributions to exit HRSD6 changes found in each category of benefit defined by these anchor-based groupings. Similar to the HRSD17 analysis, despite the statistically significant distinctions between means for each of the three groups for each anchor, there was substantial overlap in the distributions of baseline to exit HRSD6 changes found in each category for each anchor, with the order (NMC, MC, SC) as expected.
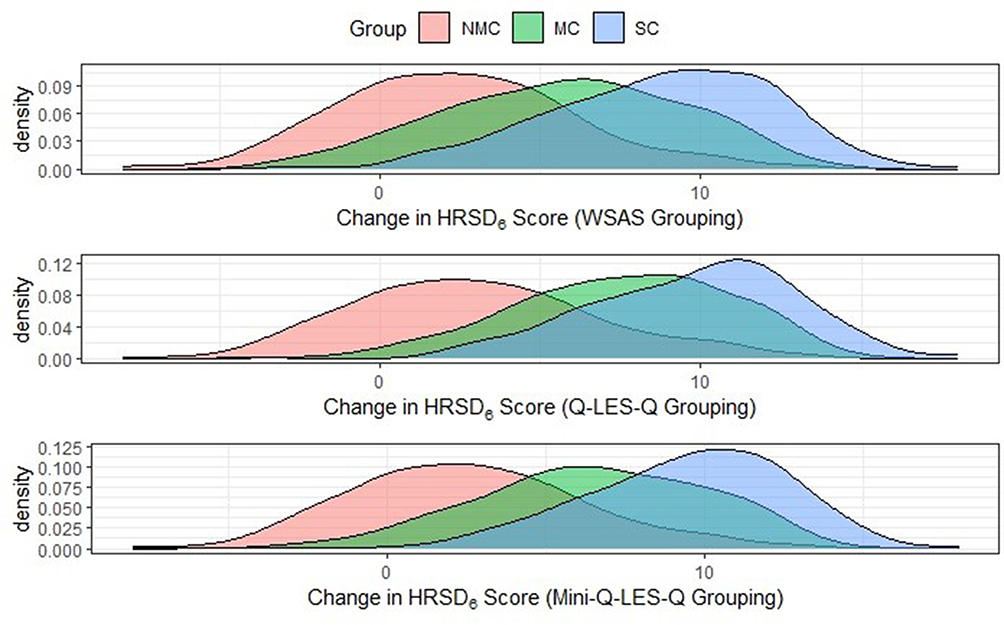 |
Figure 3 The distributions of the change in HRSD6 for each anchor group. Abbreviations: HRSD6, 6-item Hamilton Rating Scale for Depression; WSAS, Work and Social Adjustment Scale; Q-LES-Q-SF, Quality of Life Enjoyment and Satisfaction Questionnaire – Short Form; Mini-Q-LES-Q, Mini-Quality of Life Enjoyment and Satisfaction Questionnaire; NMC, No Meaningful Change in the anchor; MC, modest but meaningful change in the anchor; SC, Substantial change on the anchor. Note: Density refers to the probability of getting a particular change in HRSD6 score between a range of scores (higher density means more frequently occurring). |
Regression Analysis - HRSD6
Table 6 summarizes the results for the HRSD6 regression analysis. As an example, with the WSAS as the anchor, after controlling for a patient’s baseline depression severity, baseline WSAS score, and length of time in treatment, an 8-unit increase in the WSAS score (which was chosen a priori) corresponds to a 2.23 unit change in HRSD6 (95% CI [2.11, 2.35]). Further, the outcome variable (change in HRSD6) was predicted to within 2 units of the truth in 56% or more of all subjects in the test set – less accuracy than was seen in the HRSD17 analysis, though this is to be expected when trying to detect a more subtle change (2 units rather than 5 units).
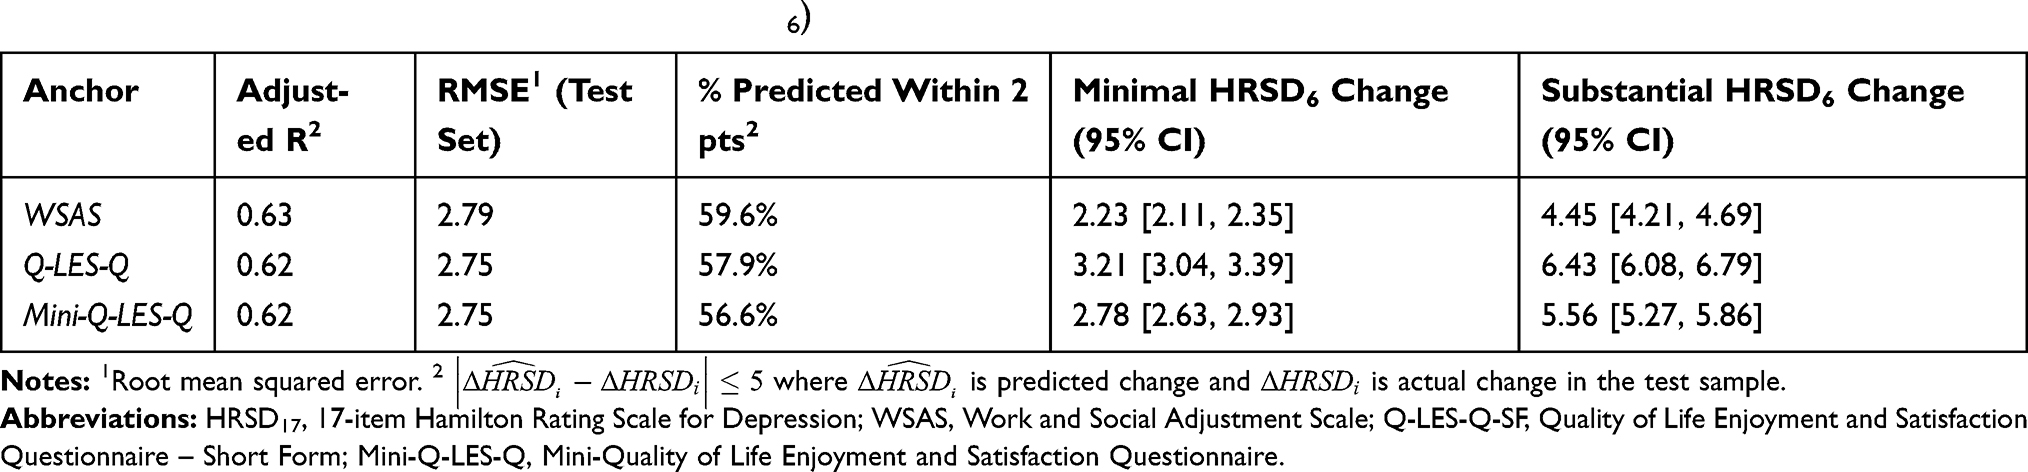 |
Table 6 Multiple Linear Regression Results (HRSD6) |
Discussion
This secondary analysis of a large, representative, treatment-seeking sample of depressed outpatients from the first treatment step of STAR*D used within-patient change and linear regression anchor-based analyses with three patient-reported outcomes (WSAS; Q-LES-Q-SF; Mini-Q-LES-Q) as anchors. Thresholds for meaningful and substantial changes were informed by clinical judgment and each anchor’s characteristics.
Using the within-patient approach, a clinically meaningful change in the HRSD17 was an 8–15 point (inclusive) increase in WSAS total score (improvement) which was associated with approximately a 10-point reduction in the HRSD17 total score. With the Q-LES-Q-SF as the anchor, a 12–23 point (inclusive) decrease in the total score (improvement) was associated with a 13-point HRSD17 change. For the Mini-Q-LES-Q, a 6–11 point (inclusive) change was associated with an 11-point change in the HRSD17 total score. Analogously, the same within-patient approach found that a clinically substantial change in HRSD17 would correspond to the reported averages of 15 with the WSAS, 17 (Q-LES-Q), and 16 for the Mini-Q-LES-Q.
This within-patient method, however, has significant limitations. Changes in the anchor are grouped so that a patient with an 8-point increase in WSAS is treated similarly to a patient with a 13-point increase, which leads to large standard deviations (ie, low precision in defining the real relationship between the anchor and the outcome). In addition, the wide distributions of symptom ratings found at each threshold logically reduce the specificity of choosing any particular value for designating the state of the patient, which impacts clinical utility. These wide overlapping distributions are likely attributable to a failure to account for other important factors (eg, baseline depression severity, baseline anchor score, and time in treatment) that, as noted in the introduction,28 are likely to affect the relationship between the changes in the anchor and changes in the HRSD17.
Therefore, we conducted anchor-based linear regression analyses to reveal the following: a modest but clinically meaningful difference on the HRSD17 would be 3.9 points with the WSAS as an anchor (95% CI [3.70, 4.13]), 5.8 with the Q-LES-Q-SF (95% CI [5.5, 6.12]), and 4.9 with the Mini-Q-LES-Q) (95% CI [4.67, 5.20]). Substantial changes in HRSD17 total scores were: 7.8 (95% CI [7.41, 8.26]), 11.6 (95% CI [11.00, 12.23]), and 9.9 (95% CI [9.34, 10.40]) for the respective anchors.
The linear regression approach arrived at more precise values as expected - likely because it controlled for treatment duration, baseline HRSD17 severity and other factors that would impact the degree of change in HRSD17 total score. Taking these findings collectively, we propose that a 4–6-point change in the HRSD17 is a reasonable estimate of a modest but clinically meaningful change. In contrast, a 7–12-point change on the HRSD17 represents a clinically substantial change.
Our within-patient change analyses with the HRSD17 were comparable to Furukawa et al who used different analytic methods with a large data set from 7 different acute-phase registration trials (n=1927 adult outpatients with MDD).50 These patients were treated with a range of antidepressant medications (imipramine, amitriptyline, trazodone, fluoxetine, paroxetine, fluvoxamine, or placebo). They used an anchor-based approach relying on either the CGI-S or the CGI-I to identify meaningful change thresholds on the HRSD17. The study concluded that an absolute reduction by 4 to 10 points was not clinically meaningful, so a reduction of at least 11 points was proposed as the minimally significant difference for the HRSD17. On the other hand, our regression analyses for the HRSD17 differed from Furukawa et al,50 likely because their analyses did not take into account duration of treatment and other factors used in our analysis.
We repeated the above analyses to identify thresholds of change for the HRSD6. The more robust anchor-based linear regression analyses suggested that a modest but clinically meaningful difference would be 2.2 points on the HRSD6 based on the WSAS anchor (95% CI [2.11, 2.35]); 3.2 with the Q-LES-Q-SF (95% CI [3.04, 3.39]), and 2.8 with the Mini-Q-LES-Q as anchors (95% CI [2.63, 2.93]). For substantial changes, the values were 4.5 (95% CI [4.21, 4.69]), 6.4 (95% CI [6.08, 6.79]), and 5.6 (95% CI [5.27, 5.86]) for the respective anchors. To our knowledge, no other studies have identified a clinically important or substantial thresholds of change.
The present results indicate that baseline depression symptom severity, treatment duration, baseline anchor scores, and anchor score changes across the treatment affect the estimations of clinically meaningful and clinically substantial changes revealed by an anchor-based approach. We also found that, as might be expected, a linear regression approach is more precise than the within-patient approach.
However, even this analysis of a sizeable, reasonably representative patient population may still not adequately address variations in these estimates because these estimates are also affected by the type of treatment, the population under study (eg, in- vs outpatient), and even the duration of the illness/episode as previously noted. Common sense and clinical experience suggest that, for example, a modest reduction in depressive symptom severity for a very severely depressed patient might be experienced as more meaningful than the same degree of symptom change for a more mildly depressed patient.
From a clinical perspective, results suggest that the HRSD6 could be of great clinical value. There was a striking difference between meaningful but modest (2–3 points) and substantial (4–7 points) clinical improvement with this brief scale as was found in the longer parent HRSD17. These results are also consistent with the notion that the HRSD6 is especially sensitive to change as it includes those items most likely accounting for the majority of the change in the 17-item version.51
Table 7 summarizes and compares how the present results would characterize the study sample using the derived HRSD 6 and HRSD17 thresholds derived by the multiple linear regression analyses. The two rating scales are in reasonable agreement as to the proportions of persons reaching the two thresholds and the proportions of the sample reaching these thresholds and is informative and largely consistent with expectations.
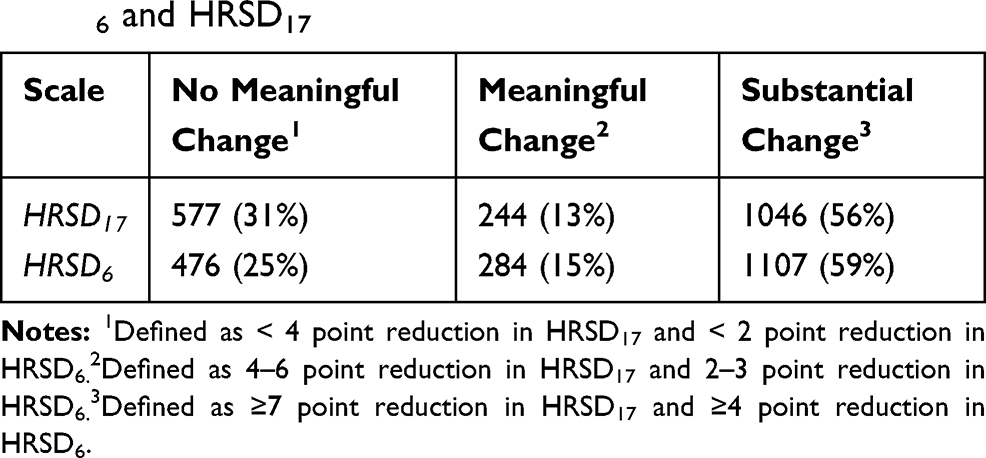 |
Table 7 Multiple Linear Regression Analyses Using the Derived HRSD6 and HRSD17 |
This study has several limitations. Most importantly, even though the thresholds were chosen a priori, they were chosen by clinical consensus based on the anchors’ nature and our experience with them, which raises questions as to their validity in representing the patient voice alone.28 Further, the method to designate “substantial” thresholds by simply doubling the change required for a meaning for threshold is somewhat arbitrary. Consequently, the specification of meaningful and substantial thresholds can be incorrect. Certainly, other thresholds likely would reveal different results. Results in the above calculations as to how these thresholds actually worked in this sample is somewhat reassuring, however, as they approximate the expected proportions of patients in each category based on the classic symptom-based groupings (e.g. no benefit, partial response, and response).
Secondly, these results are of limited generalizability because they apply only to adult outpatients with major depressive disorder. The present results may not be precisely applicable to depressed patient participants who enter regulatory registration trials. Only 20–25% of this analytic sample would have been eligible for these trials.52 Thirdly, in this study, citalopram could be used up to a maximum dose that is now not recommended by the FDA (the current maximum citalopram doses are 40 mg/day for adults and 20 mg/day for those over age 60). Several paradigms (expert opinion, anchor-based, and distribution-based) can be used to estimate these thresholds, and they do not all agree. For example, we explored only two anchor-based approaches, though literature proposes two others.53
Further limitations, those of the scales themselves, and the risk that depressive symptom severity is likely to affect at least somewhat the patients self-evaluation (more severely depressed have greater negative self-appraisal). Further, the terms designating the psychosocial domains being assessed, scale properties, and other features could affect a depressed patient’s ability to understand and respond appropriately.
In summary, estimates of a meaningful change in HRSD17 total score is 4–6 points, while a change of 7–12 points is substantial. For the HRSD6, a change in the total score of 2–3 points and 4–7 points may be considered as meaningful and substantial, respectively.
Funding
The STAR*D trial was supported by the National Institute of Mental Health (NIMH), which funded the STAR*D trial (grant no. N01 MH-90003) and by medications provided by Bristol-Myers Squibb, Forest Pharmaceuticals, GlaxoSmithKline, King Pharmaceuticals, Organon, Pfizer, and Wyeth-Ayerst Laboratories at no cost to the trial. These supporters had no role in the design, conduct, data analysis, interpretation, drafting of the manuscript, or publication of the study results.
Disclosure
A. John Rush has received consulting fees from Compass Inc., Curbstone Consultant LLC, Emmes Corp., Evecxia Therapeutics, Inc., Holmusk, Johnson and Johnson (Janssen), Liva-Nova, Neurocrine Biosciences Inc., Otsuka-US, Sunovion; speaking fees from Liva-Nova, Johnson and Johnson (Janssen); and royalties from Guilford Press and the University of Texas Southwestern Medical Center, Dallas, TX (for the Inventory of Depressive Symptoms and its derivatives). He is also named co-inventor on two patents: US Patent No. 7795033: Methods to Predict the Outcome of Treatment with Antidepressant Medication, Inventors: McMahon FJ, Laje G, Manji H, Rush AJ, Paddock S, Wilson AS; and US Patent No. 7906283: Methods to Identify Patients at Risk of Developing Adverse Events During Treatment with Antidepressant Medication, Inventors: McMahon FJ, Laje G, Manji H, Rush AJ, Paddock S.
Charles South received payment from TTUHSC for his contribution to this report. Mudasar Hassan, Shristi Shrestha, Raafae Agha, Zershana Khan, Mingxu Zhang, Shailesh Jain have no disclosures to report. Madhukar H Trivedi has received research support from NIMH, NIDA, J&J, Janssen Research and Development LLC; has served as a consultant for Alkermes Inc., Allergan, Arcadia Pharmaceuticals Inc., AstraZeneca, Lundbeck, Medscape, MSI Methylation Sciences Inc., Merck, Otsuka America Pharmaceuticals Inc., and Takeda Pharmaceuticals Inc. The authors report no other conflicts of interest in this work.
References
1. Vos T, Barber RM, Bell B, et al. Global, regional, and national incidence, prevalence, and years lived with disability for 301 acute and chronic diseases and injuries in 188 countries, 1990–2013: a systematic analysis for the Global Burden of Disease Study 2013. Lancet. 2015;386(9995):743–800.
2. Kious BM, Kondo DG, Renshaw PF. Living high and feeling low: altitude, suicide, and depression. Harv Rev Psychiatry. 2018;26(2):43–56. doi:10.1097/HRP.0000000000000158
3. Ferrari AJ, Somerville AJ, Baxter AJ, et al. Global variation in the prevalence and incidence of major depressive disorder: a systematic review of the epidemiological literature. Psychol Med. 2013;43(3):471–481. doi:10.1017/S0033291712001511
4. Kessler RC, Petukhova M, Sampson NA, Zaslavsky AM, Wittchen H-U. Twelve-month and lifetime prevalence and lifetime morbid risk of anxiety and mood disorders in the United States. Int J Methods Psychiatr Res. 2012;21(3):169–184. doi:10.1002/mpr.1359
5. Greenberg PE, Fournier AA, Sisitsky T, Pike CT, Kessler RC. The economic burden of adults with major depressive disorder in the the United States (2005 and 2010). J Clin Psychiatry. 2015;76(2):155–162. doi:10.4088/JCP.14m09298
6. Rush AJ, Kraemer HC, Sackeim HA, et al. Report by the ACNP Task Force on response and remission in major depressive disorder. Neuropsychopharmacology. 2006;31:1841–1853. doi:10.1038/sj.npp.1301131
7. Miller IW, Keitner GI, Schatzberg AF, et al. The treatment of chronic depression, Part 3: psychosocial functioning before and after treatment with sertraline or imipramine. J Clin Psychiatry. 1998;59(11):608–619. doi:10.4088/JCP.v59n1108
8. Paykel ES, Ramana R, Cooper Z, Hayhurst H, Kerr J, Barocka A. Residual symptoms after partial remission: an important outcome in depression. Psychol Med. 1995;25(6):1171–1180. doi:10.1017/S0033291700033146
9. Judd LL, Akiskal HS, Maser JD, et al. Major depressive disorder: a prospective study of residual subthreshold depressive symptoms as predictor of rapid relapse. J Affect Disord. 1998;50(2):97–108. doi:10.1016/S0165-0327(98)00138-4
10. Hamilton M. A rating scale for depression. J Neurol Neurosurg Psychiatry. 1960;23(1):56–62. doi:10.1136/jnnp.23.1.56
11. Bech P, Gram LF, Dein E, Jacobsen O, Vitger J, Bolwig TG. Quantitative Rating of Depressive States: correlation between clinical assessment, Beck’s Self‐Rating Scale and Hamilton’s Objective Rating Scale. Acta Psychiatr Scand. 1975;51(3):161–170. doi:10.1111/j.1600-0447.1975.tb00002.x
12. Bech P, Bolwig TG, Kramp P, Rafaelsen OJ. The Bech‐Rafaelsen Mania Scale and the Hamilton Depression Scale. Acta Psychiatr Scand. 1979;59(4):420–430. doi:10.1111/j.1600-0447.1979.tb04484.x
13. Bech P, Allerup P, Gram LF, et al. The Hamilton Depression Scale: evaluation of objectivity using logistic models. Acta Psychiatr Scand. 1981;63(3):290–299. doi:10.1111/j.1600-0447.1981.tb00676.x
14. Bech P. Rating Scales. Acta Psychiatr Scand. 1981;64(s295):11–101.
15. Mundt JC, Marks IM, Shear MK, Greist JH. The Work and Social Adjustment Scale: a simple measure of impairment in functioning. Br J Psychiatry. 2002;180:461–464. doi:10.1192/bjp.180.5.461
16. Endicott J, Nee J, Harrison W, Blumenthal R. Quality of Life Enjoyment and Satisfaction Questionnaire: a new measure. Psychopharmacol Bull. 1993;29(2):321.
17. Rush AJ, South CC, Jha MK, Grannemann BD, Trivedi MH. Toward a very brief quality of life enjoyment and Satisfaction Questionnaire. J Affect Disord. 2019;242:87–95. doi:10.1016/j.jad.2018.08.052
18. Rush AJ, Fava M, Wisniewski SR, et al. Sequenced treatment alternatives to relieve depression (STAR*D): rationale and design. Control Clin Trials. 2004;25(1):119–142. doi:10.1016/s0197-2456(03)00112-0
19. Rush AJ, Trivedi MH, Wisniewski SR, et al. Acute and longer-term outcomes in depressed outpatients requiring one or several treatment steps: a STAR* D report. Am J Psychiatr. 2006;163(11):1905–1917. doi:10.1176/ajp.2006.163.11.1905
20. Trivedi MH, Rush AJ, Wisniewski SR, et al. Evaluation of outcomes with citalopram for depression using measurement-based care in STAR*D: implications for clinical practice. Am J Psychiatr. 2006;163(1):28–40. doi:10.1176/appi.ajp.163.1.28
21. Clancy CM, Eisenberg JM. Outcomes Research: measuring the End Results of Health Care. Science. 1998;282(5387):245–246. doi:10.1126/science.282.5387.245
22. Wiklund I. Assessment of patient‐reported outcomes in clinical trials: the example of health‐related quality of life. Fundam Clin Pharmacol. 2004;18(3):351–363. doi:10.1111/j.1472-8206.2004.00234.x
23. Willke RJ, Burke LB, Erickson P. Measuring treatment impact: a review of patient-reported outcomes and other efficacy endpoints in approved product labels. Control Clin Trials. 2004;25(6):535–552. doi:10.1016/j.cct.2004.09.003
24. Pedersen G, Kvarstein EH, The Work WT. Social Adjustment Scale: psychometric properties and validity among males and females, and outpatients with and without personality disorders: the work and social adjustment scale: psychometric properties and validity among males and females. Personal Ment Health. 2017;11(4):215–228. doi:10.1002/pmh.1382
25. Zahra D, Qureshi A, Henley W, et al. The work and social adjustment scale: reliability, sensitivity and value. Int J Psychiatry Clin Pract. 2014;18(2):131–138. doi:10.3109/13651501.2014.894072
26. Pitkänen A, Välimäki M, Endicott J, et al. Assessing quality of life in patients with schizophrenia in an acute psychiatric setting: reliability, validity and feasibility of the EQ-5D and the Q-LES-Q. Nord J Psychiatry. 2012;66(1):19–25. doi:10.3109/08039488.2011.593099
27. Ritsner M, Kurs R, Gibel A, Ratner Y, Endicott J. Validity of an Abbreviated Quality of Life Enjoyment and Satisfaction Questionnaire (Q-LES-Q-18) for Schizophrenia, Schizoaffective, and Mood Disorder Patients. Qual Life Res. 2005;14(7):1693–1703. doi:10.1007/s11136-005-2816-9
28. King MT. A point of minimal important difference (MID): a critique of terminology and methods. Expert Rev Pharmacoecon Outcomes Res. 2011;11(2):171–184. doi:10.1586/erp.11.9
29. Guyatt G, Walter S, Norman G. Measuring change over time: assessing the usefulness of evaluative instruments. J Chronic Dis. 1987;40(2):171–178. doi:10.1016/0021-9681(87)90069-5
30. Turkoz I, Alphs L, Singh J, et al. Clinically meaningful changes on depressive symptom measures and patient-reported outcomes in patients with treatment-resistant depression. Acta Psychiatr Scand. 2020. doi:10.1111/acps.13260
31. Rush AJ, Jain SB. Clinical implications of the STAR*D trial. In: Macaluso M, Preskorn SH, editors. Antidepressants. Handbook of Experimental Pharmacology. Cham, Switzerland: Springer; 2018:51–99. doi:10.1007/164_2018_153
32. Trivedi MH, Fava M, Wisniewski SR, et al. Medication augmentation after the failure of SSRIs for depression. N Engl J Med. 2006;354(12):1243–1252. doi:10.1056/NEJMoa052964
33. Rush AJ, Crismon ML, Toprac MG, et al. Implementing Guidelines and Systems of Care: experiences with the Texas Medication Algorithm Project (TMAP). J Psychiatr Pract. 1999;5(2):75–86. doi:10.1097/00131746-199903000-00002
34. Trivedi MH, Rush AJ, Gaynes BN, et al. Maximizing the adequacy of medication treatment in controlled trials and clinical practice: STAR* D measurement-based care. Neuropsychopharmacology. 2007;32(12):2479–2489. doi:10.1038/sj.npp.1301390
35. Rush AJ, Trivedi MH, Ibrahim HM, et al. The 16-Item Quick Inventory of Depressive Symptomatology (QIDS), clinician rating (QIDS-C), and self-report (QIDS-SR): a psychometric evaluation in patients with chronic major depression. Biol Psychiatry. 2003;54(5):573–583. doi:10.1016/S0006-3223(02)01866-8
36. Guo T, Xiang YT, Xiao L, et al. Measurement-Based Care Versus Standard Care for Major Depression: a Randomized Controlled Trial with Blind Raters. Am J Psychiatr. 2015;172(10):1004–1013. doi:10.1176/appi.ajp.2015.14050652
37. Bauer M, Rush AJ, Ricken R, Pilhatsch M, Adli M. Algorithms for treatment of major depressive disorder: efficacy and cost-effectiveness. Pharmacopsychiatry. 2019;52(03):117–125. doi:10.1055/a-0643-4830
38. Scott K, Lewis CC. Using Measurement-Based Care to Enhance Any Treatment. Cogn Behav Pract. 2015;22(1):49–59. doi:10.1016/j.cbpra.2014.01.010
39. Aboraya A, Nasrallah HA, Elswick DE, et al. Measurement-based Care in Psychiatry-Past, Present, and Future. Innov Clin Neurosci. 2018;15(11–12):13–26.
40. Fortney JC, Unützer J, Wrenn G, et al. A Tipping Point for Measurement-Based Care. Psychiatric Services. 2017;68(2):179–188. doi:10.1176/appi.ps.201500439
41. Lewis CC, Boyd M, Puspitasari A, et al. Implementing Measurement-Based Care in Behavioral Health: a Review. JAMA Psychiatry. 2019;76(3):324–335. doi:10.1001/jamapsychiatry.2018.3329
42. Rush AJ, Trivedi MH, Wisniewski SR, et al. Bupropion-SR, Sertraline, or Venlafaxine-XR after Failure of SSRIs for Depression. N Engl J Med. 2006;354(12):1231–1242. doi:10.1056/NEJMoa052963
43. Mundt JC. Interactive voice response systems in clinical research and treatment. Psychiatr Serv. 1997;48(5):611–612. doi:10.1176/ps.48.5.611
44. Bernstein IH, Rush AJ, Carmody TJ, Woo A, Trivedi MH. Clinical vs. J Psychiatric Res. 2007;41(3–4):239–246.
45. Rapaport MH, Clary C, Fayyad R, Quality-of-Life EJ. Impairment in Depressive and Anxiety Disorders. Am J Psychiatry. 2005;162(6):1171–1178. doi:10.1176/appi.ajp.162.6.1171
46. Wyrwich K, Harnam N, Revicki DA, Locklear JC, Svedsäter H, Endicott J. Assessing health-related quality of life in generalized anxiety disorder using the Quality Of Life Enjoyment and Satisfaction Questionnaire. Int Clin Psychopharmacol. 2009;24(6):289–295. doi:10.1097/YIC.0b013e32832d6bf4
47. Endicott J, Rajagopalan K, Minkwitz M, Macfadden W. A randomized, double-blind, placebo-controlled study of quetiapine in the treatment of bipolar I and II depression: improvements in quality of life. Int Clin Psychopharmacol. 2007;22(1):29–37. doi:10.1097/01.yic.0000224797.74771.be
48. Conway CR, Kumar A, Xiong W, Bunker M, Aaronson ST, Rush AJ. Chronic vagus nerve stimulation significantly improves quality of life in treatment-resistant major depression. J Clin Psychiatry. 2018;79(5):52–59. doi:10.4088/JCP.18m12178
49. R Core Team (2020). R: a language and environment for statistical computing. R Foundation for Statistical Computing, Vienna, Austria. https://www.R-project.org/.
50. Furukawa TA, Akechi T, Azuma H, Okuyama T, Higuchi T. Evidence-based guidelines for interpretation of the Hamilton rating scale for depression [14]. J Clin Psychopharmacol. 2007;27(5):531–534. doi:10.1097/JCP.0b013e31814f30b1
51. Hooper CL, Bakish D. An examination of the sensitivity of the six-item Hamilton Rating Scale for Depression in a sample of patients suffering from major depressive disorder. J Psychiatry Neurosci. 2000;25(2):178–184.
52. Wisniewski SR, Rush AJ, Nierenberg AA, et al. Can Phase III trial results of antidepressant medications be generalized to clinical practice? A STAR*D report. Am J Psychiatry. 2009;166(5):599–607. doi:10.1176/appi.ajp.2008.08071027
53. Copay AG, Subach BR, Glassman SD, Polly DW, Schuler TC. Understanding the minimum clinically important difference: a review of concepts and methods. Spine J. 2007;7(5):541–546. doi:10.1016/j.spinee.2007.01.008
 © 2021 The Author(s). This work is published and licensed by Dove Medical Press Limited. The full terms of this license are available at https://www.dovepress.com/terms.php and incorporate the Creative Commons Attribution - Non Commercial (unported, v3.0) License.
By accessing the work you hereby accept the Terms. Non-commercial uses of the work are permitted without any further permission from Dove Medical Press Limited, provided the work is properly attributed. For permission for commercial use of this work, please see paragraphs 4.2 and 5 of our Terms.
© 2021 The Author(s). This work is published and licensed by Dove Medical Press Limited. The full terms of this license are available at https://www.dovepress.com/terms.php and incorporate the Creative Commons Attribution - Non Commercial (unported, v3.0) License.
By accessing the work you hereby accept the Terms. Non-commercial uses of the work are permitted without any further permission from Dove Medical Press Limited, provided the work is properly attributed. For permission for commercial use of this work, please see paragraphs 4.2 and 5 of our Terms.