Back to Journals » International Journal of Nanomedicine » Volume 16
Taqman-MGB nanoPCR for Highly Specific Detection of Single-Base Mutations
Authors Xue Z, You M ![]() , Peng P, Tong H, He W, Li A, Mao P, Xu T, Xu F, Yao C
, Peng P, Tong H, He W, Li A, Mao P, Xu T, Xu F, Yao C
Received 9 March 2021
Accepted for publication 11 May 2021
Published 28 May 2021 Volume 2021:16 Pages 3695—3705
DOI https://doi.org/10.2147/IJN.S310254
Checked for plagiarism Yes
Review by Single anonymous peer review
Peer reviewer comments 2
Editor who approved publication: Professor Lei Yang
Zhenrui Xue,1– 3,* Minli You,2,3,* Ping Peng,1– 3,* Haoyang Tong,2,3 Wanghong He,2– 4 Ang Li,4 Ping Mao,1– 3 Ting Xu,1 Feng Xu,2,3 Chunyan Yao1
1Department of Transfusion Medicine, Southwest Hospital, Third Military Medical University, Army Medical University, Chongqing, 400038, People’s Republic of China; 2The Key Laboratory of Biomedical Information Engineering of Ministry of Education, School of Life Science and Technology, Xi’an Jiaotong University, Xi’an, 710049, People’s Republic of China; 3Bioinspired Engineering and Biomechanics Center (BEBC), Xi’an Jiaotong University, Xi’an, 710049, People’s Republic of China; 4Key Laboratory of Shaanxi Province for Craniofacial Precision Medicine Research, College of Stomatology, Xi’an Jiaotong University, Xi’an, 710049, People’s Republic of China
*These authors contributed equally to this work
Correspondence: Chunyan Yao; Feng Xu
Department of Transfusion Medicine, Southwest Hospital, Third Military Medical University, Army Medical University, Chongqing, 400038, People’s Republic of China
Tel +64 389 619 2922
Email [email protected]; [email protected]
Purpose: Detection of single-base mutations is important for real-time monitoring of tumor progression, therapeutic effects, and drug resistance. However, the specific detection of single-base mutations from excessive wild-type background sequences with routine PCR technology remains challenging. Our objective is to develop a simple and highly specific qPCR-based single-base mutation detection method.
Methods: Using EGRF T790M as a model, gold nanoparticles at different concentrations were separately added into the Taqman-MGB qPCR system to test specificity improvement, leading to the development of the optimal Taqman-MGB nanoPCR system. Then, these optimal conditions were used to test the range of improvement in the specificity of mutant-type and wild-type templates and the detection limit of mutation abundances in a spiked sample.
Results: The Taqman-MGB nanoPCR was established based on the traditional qPCR, with significantly suppressed background noise and improved specificity for single-base mutation detection. With EGFR T790M as a template, we demonstrated that our Taqman-MGB nanoPCR system could improve specificity across a wide concentration range from 10− 9 μM to 10 μM and detect as low as 0.95% mutation abundance in spiked samples, which is lower than what the traditional Taqman-MGB qPCR and existing PCR methods can detect. Moreover, we also proposed an experimentally validated barrier hypothesis for the mechanism of improved specificity.
Conclusion: The developed Taqman-MGB nanoPCR system could be a powerful tool for clinical single-base mutation detection.
Keywords: nanoparticle-assisted PCR, point mutation, gold nanoparticle, specificity
Introduction
Single-base mutations in the gene sequence are reportedly associated with the occurrence, development, and prognosis of many major diseases (eg, tumors or hereditary disease).1–4 Lots of domestic and international guidelines emphasize that single-base mutation detection is necessary for disease diagnosis and therapy prognosis.5–7 Single-base mutation detection with a low cost, simple operation, and fast turnaround time is preferred in clinical diagnosis. The currently available methods for single-base mutation detection mainly include sequencing, digital polymerase chain reaction (PCR), and quantitative real-time PCR. The emerging second-generation sequencing (NGS) platform accurately detects single or multiple mutations in multiple genes. However, its high cost and complex data analysis limit its wide applications.8–10 Digital PCR enables absolute quantification of the mutation site in a clinical sample. However, it is limited by its complex operation and high cost of the equipment.11,12 In comparison, qPCR is the commonly used technology in the clinical setting; however, it is rarely used for mutation detection, especially single-base mutations, due to its low specificity.13 Therefore, it is important to develop a simple and highly specific qPCR-based method for single-base mutation detection.
Two kinds of qPCR methods have been used for the detection of single-base mutations by designing mismatched primers or probes, ie amplification refractory mutation system (ARMS) qPCR and Taqman-MGB qPCR.14,15 These two methods are similar in principle and specificity. Furthermore, they also have the same limitations. For instance, the optimization of primers or probes is time-consuming and labor-intensive and needs to be repeated for sequences with different target mutation sites. In contrast to ARMS qPCR, Taqman-MGB qPCR is suitable for most mutations and even for genes with GC content that is too high or too low,16 due to the strong embedding of the minor groove binder (MGB) into the double helix structure of templates and probes. However, the MGB also enhances non-specific pairing of probes and templates, leading to non-specific amplification and decreased discrimination ability of Taqman-MGB qPCR. Therefore, there is still an unmet need for a generally suitable and highly specific Taqman-MGB qPCR method for point mutation detection.
Due to the good physicochemical properties of nanoparticles, nanoparticle-assisted PCR (nanoPCR) could improve PCR amplification efficiency, yield, and specificity.17–20 For instance, gold nanoparticles (AuNPs) were added to multiple rounds of amplification in a PCR system, which resulted in improved specificity of the amplified products.21 AuNPs were also used to improve the amplification efficiency of quantitative fluorescence PCR22 and to improve loop-mediated isothermal amplification with significantly reduced false-positive rate of rotavirus detection.23 The NP-assisted helicase-dependent amplification (HDA) method was used to genotype the KRAS gene in genomic DNA samples from colorectal cancer patients with ultra-high specificity.24 The potential mechanism of nanoPCR with improved specificity has been put forward by several previous studies.21,25,26 It is suggested that the non-specific absorption of NPs to a single-strand sequence largely minimizes mispairing between primers and templates during DNA replication. However, the above hypothesis lacks direct convincing evidence and it is still not clear whether nanoPCR is able to detect single-base mutations.
Here, we developed a highly specific AuNP-mediated Taqman-MGB qPCR (referred to as Taqman-MGB nanoPCR) method for single-base mutation detection. We used the T790M site in EGFR as a template gene and achieved a limit of detection (LOD) for mutation abundance as low as 0.95%. The results showed that AuNPs significantly suppress >85% of non-specific amplification of the wild-type (WT) site, while maintaining the amplification of the mutation-type (MT) site. Moreover, we experimentally verified the non-specific absorption of AuNPs in various components of the PCR system, based on which we proposed a barrier hypothesis to explain the suppression of AuNPs with the mismatch pairing between templates and probes in our Taqman-MGB nanoPCR. We believe that the developed Taqman-MGB nanoPCR holds great potential in clinical applications for single-base mutation detection.
Materials and Methods
Materials
All oligonucleotides and the 445-bp gene fragment were synthesized and modified by Sangon Biotech Co., Ltd (Shanghai, China). The wild-type genomic DNA was obtained from Diyinan Biotech Co., Ltd (Suzhou, China). The primers and probes based on target sequence were designed using Universal Invader™ software. Two specific probes with FAM and VIC fluorescent dyes were designed for the WT sequence and MT sequence, respectively. The sequences are shown in Table S1. The PCR Master mix was purchased from Qiagen (Hilden, Germany). SYBR Green I was purchased from Beijing Solarbio Science & Technology Co., Ltd (Beijing, China). Ultrapure DNase/RNase-Free distilled water was purchased from Thermo Fisher Scientific (Waltham, MA, USA). The 8-Strip PCR tubes were purchased from Axygen (NY, USA). The whole blood genomic DNA extraction reagent was purchased from Bioer Technology Co., Ltd (Hangzhou, China). The corresponding experiments were approved by the ethics committee/institutional review board of Xi’an Jiaotong University in accordance with the Declaration of Helsinki, and written informed consent was obtained from all patients. (NO.2021–1334)
AuNP Synthesis
AuNPs were synthesized using the Turkevich method, a single-step thermal reduction of chloroauric acid (HAuCl4) in the presence of citrate. Briefly, 100 mL of ultrapure water was added into a 250 mL three-port flask that had been thoroughly cleaned with aqua regia. Then, the three-port flask was boiled in an oil bath before adding 4.5 mL of 1% sodium citrate. Five minutes later, 1.16 mL of pre-configured chloroauric acid solution (mass fraction of 0.863%) was added. When the solution color changed from purple to burgundy, the three-port flask was moved from the oil bath and cooled to 25°C
AuNP Quantification
After the prepared AuNPs were dissolved in aqua regia, the color of the solution changed from burgundy to colorless. The solution was further diluted with concentrated nitric acid in different multiples (4, 40, and 400) and then quantified by inductively coupled plasma mass spectrometry (PerkinElmer, USA). The obtained results were recorded as C0, and the exact concentration of AuNP solution can be calculated by C0 using the following equation:
CAuNP= C0/(ρAu×VAuNP×NA)
Quantitative Real-Time PCR
Real-time PCR amplification was performed using a 7500 fast real-time PCR (Applied Biosystems). To setup a 1×qPCR reaction (10 µL), 5 µL of 2×PCR Master mix, 1 µL of DNA template, 0.5 µL of forward and reverse primer (20 µM), 1 µL of probe (10 µM) and 2.5 µL of dH2O or AuNP solution were pipetted in a 0.1 mL 8-Strip PCR tube. After adding all reagents, the solution was sealed with 5 µL of mineral oil to prevent cross-contamination during amplification. The real-time PCR reaction mixture was briefly vortexed, followed by 10 s of centrifugation at 1,500 ×g. Thermocycling was initiated by 3 min of denaturation, followed by 45 thermal cycles at 95 °C for 10 s (denaturation) and 60 °C for 30 s (annealing and extension).
The Taqman-MGB nanoPCR reaction system for detection of mutation abundance consisted of 5 µL of 2×PCR Master mix, 0.5 µL of 2500 copies wild gDNA extracted from peripheral blood according to the manufacturer’s instructions and 0.5 µL of different copies of mutant plasmids, 1 µL of primers (10 µM), 0.5 µL of VIC probe (10 µM), 0.5 µL of FAM probe (10 µM) were pipetted in a 0.1 mL 8-Strip PCR tube. Either AuNPs in the appropriate concentrations or deionized water were added to the system to reach a final volume of 10 µL. Temperature was gradually increased up to 95 °C for 3 min for the initial denaturation step and then maintained at 95 °C for 10 s (step 1), and to 60 °C for 45 s for annealing and extending (step 2). The two steps were repeated in 45 cycles.
Characterization
A FEI Talos F200C transmission electron microscope (Thermo Fisher Scientific; USA) was used for the TEM images of the synthesized AuNPs. All the UV-Vis spectroscopies were recorded with a Lambda 35 UV–vis spectrophotometer (PerkinElmer, USA) for spectral changes in the AuNPs subjected to qPCR. The zeta potential and dynamic light scattering (DLS) of 10 nM AuNP suspensions diluted with 1×qPCR buffer or water were performed with a Malvern ZS90-2027 Zetasizer Nano system (Malvern, UK). Accurate quantification of the prepared AuNPs was measured by inductively coupled plasma mass spectrometry. All the measurements were performed at room temperature.
Results and Discussion
Design of the Taqman-MGB nanoPCR
To test the AuNP improvement of Taqman-MGB qPCR detection specificity, a Taqman-MGB detection probe was designed to detect MT sequences (Figure 1). The designed Taqman-MGB detection probe could perfectly pair with mutation sequence, but it involved a single-base mismatch with WT sequence. If no AuNP was added in the PCR system, both WT and MT sequences could be amplified with obvious fluorescence increase (gray dash line in Figure 1). In comparison, if the proper concentration of AuNP was introduced into the PCR system, the non-specific amplification of WT sequence would be significantly suppressed, with only a slight negative effect of AuNP for the MT sequence (red solid line in Figure 1). In clinical samples, the number of WT sequences was much larger than the mutation number, and the non-specific amplification signal might mask the signal of MT amplification in a real-world situation. Although two Taqman-MGB probes with different fluorescent groups were designed to distinguish the WT and MT in classical Taqman-MGB qPCR, the non-specific amplification was still ineluctable, especially when only single-base mutations occur in the mutation sequence. Therefore, developing Taqman-MGB nanoPCR with enhanced specificity was quite significant for the clinical diagnosis of single-base mutation. To this end, we prepared citric acid-modified AuNP to perform the Taqman-MGB nanoPCR. The DLS of the prepared AuNPs revealed they possess a uniform size of 14.33±0.04 nm (Figure S1A). The zeta potential of AuNPs was −45.9±1.66 mV, confirming their great solubility (Figure S1B). The TEM results showed that the diameters of the prepared AuNP particles were 11.1±1.2 nm (Figure S2), which was consistent with the DLS results.
 |
Figure 1 Schematic of the AuNP-mediated Taqman-MGB nanoPCR for single-base mutation detection. When amplification of mutant-type and wild-type templates is mediated by the mutant-type probes, the AuNP particles inhibit the mismatch pairing of wild-type template with the probe and the corresponding amplification fluorescence signal is significantly suppressed. While the fluorescence signal generated from the amplification of mutant template is almost unaffected. |
Optimization of AuNP Concentration for Taqman-MGB nanoPCR
To establish a stable and optimized Taqman-MGB nanoPCR, a series of AuNPs with gradient concentrations were added into the PCR system with a single detection probe for MT sequences. The effect of AuNPs at different concentrations on the amplification of WT and MT sequences is shown in Figure 2A. As we all know, high concentrations of nanoparticles would inhibit the PCR reaction.27,28 AuNP in excessive concentrations (eg, 250 nM and 125 nM) revealed significant suppression for both WT and MT amplifications. However, when the AuNP concentration decreased to 50 nM, MT suppression sharply became weak, and WT suppression was still strong, with 85% of non-specific signals effectively suppressed, leading to a significantly increased signal-to-noise ratio (SNR) (Figure 2B and C). With the continuous decrease in AuNP concentration, the MT amplification signal was improved, which also occurred in the WT group. To compare the SNR of AuNPs in different concentrations, the fluorescence ratios of MT and WT at 45 cycles were quantified (Figure 2C). The maximal SNR appeared at 50 nM AuNP, where the fluorescence ratio of MT/WT reached about 6.6 and was more than 2.5-fold higher than that of the control group (ie 2.64 fluorescence ratio). However, the SNR was lower than that of the control group for all other AuNP concentrations. These results confirmed that the concentration of AuNP has an obvious effect on the specificity improvement of Taqman-MGB nanoPCR. Excessive AuNP concentration suppressed all nucleic acid amplifications significantly, which was consistent with a previous report.29 However, AuNP in low concentrations could be an enhancer for all PCR samples. Only AuNPs in a proper concentration could improve the specificity of PCR. Here, the optimized concentration of AuNP was 50 nM, which obviously improved the specificity of single-base detection and was therefore used in the following experiments. Importantly, this optimization process is only needed when developing the nanoPCR system. Once the optimal concentration of AuNPs is determined, the users could directly perform nanoPCR with the optimal nanoPCR system.
 |
Figure 2 Effect of different AuNP concentrations on amplification signals. (A) The amplification curves of Taqman-MGB qPCR and nanoPCR with different AuNPs concentrations. The hollow square represents the amplification curve of wild-type templates, and the solid circle represents the amplification curve of mutant templates. (B) Comparison of the amplification single of WT and MT templates when different AuNPs concentrations are doped in Taqman-MGB nanoPCR. Mean fluorescence intensity and standard deviation are obtained at 45 cycle number with three replicate experiments. (C) Quantification of signal-to-noise of Taqman-MGB nanoPCR with different AuNP concentrations by calculating the amplification signal ratio of MT and WT templates. |
Mechanism of AuNP-Enhanced Specificity of Taqman-MGB nanoPCR
Based on previous reports, the AuNP specificity enhancement of PCR might be caused by the nonspecific adsorption of AuNPs of single-strand DNA.30,31 To assess this nonspecific absorption, the UV-Vis spectra of AuNPs and AuNPs mixed with NA sequences (including primers, probes, and single-strand templates) were measured (Figure S3). A discernable redshift (~11 nm) in the surface plasmon resonance (SPR) peak of AuNPs was observed after mixing with these single-strand sequences (pink line in Figure S3). The redshift demonstrated that the single-strand sequences have been absorbed on the AuNP surface, resulting in reduced surface electron density. When the PCR mix (including polymerase, divalent magnesium ion, and dNTP) was added into the AuNP solution, a redshift as large as ~100 nm occurred, which illustrated that the AuNP surface was tightly covered by the components of the PCR mix (green line in Figure S3). To confirm this, we measured the DLS and zeta potential of AuNPs before and after adding the PCR mix (Figure S1). The obtained results revealed that the AuNP hydrodynamic size increased from 14.33±0.04 nm to 68.6±0.37 nm after adding the PCR mix, further increasing to 90.5±0.19 nm after the amplification cycle. The zeta potential was also inhibited from −45.9±1.66 mV to −8.84±0.49 mV (before amplification) and −8.73±0.55 mV (after amplification). Further addition of NA sequences induced a slight further redshift, indicating that the NA sequence could still be absorbed even after pre-absorption of the PCR mix components (blue line in Figure S3). Meanwhile, the DLS results also prove no obvious aggregation of AuNPs before and after the PCR reaction. The above results remained consistent with previous studies, confirming that the nanoparticle surface could non-specifically adsorb the PCR components and interact with them to affect the amplification results.26,32
Next, to understand the mechanism, by which AuNPs improve detection specificity, we proposed a barrier hypothesis based on the non-specific absorbance of single-strand sequences by AuNPs. In other words, the successful pairing between probes and templates needed to stride over a barrier and the adjustment of this barrier by the added AuNPs (Figure 3A). The non-specific absorption of AuNPs elevated the energy that was needed for the complementary pairing between probes and templates, where more added AuNPs would induce a greater barrier. In summary, the above results verified that the proposed barrier hypothesis could properly explain the effect of AuNPs on different pairing between MT or WT templates and probes, which theoretically supported the specificity improvement of Taqman-MGB nanoPCR. Based on this hypothesis, it was possible to find a proper AuNP concentration, which could block the mismatch pairing of WT templates and probes but permit the perfect pairing of MT templates and probes (Figure 3A). In order to verify this hypothesis, different AuNP concentrations and unmodified MT probe sequences were incubated with MT and WT templates for 30 minutes at 60 °C. (Figure 3B). When the duplex structure formed between probes and templates, SYBR Green I was able to bind to the minor groove of the duplex structure and exhibit significantly enhanced fluorescence. The measured fluorescence intensity depended linearly on the length and amount of formed duplex structures. When the AuNPs were absent in the solution, the quantified fluorescence intensity of the MT group was nearly twice as high as the WT group intensity (Figure 3B and C). When 250 nM of AuNPs were added into the system, no obvious fluorescence was observed in either group, indicating that the addition of abundant AuNPs significantly elevated the barrier and blocked probe pairing, leading to rare formation of duplex structures. When 50 nM of AuNPs were added, the elevated barrier also blocked the pairing of MT and WT with probes, inducing a decrease in fluorescence intensity for the WT and MT groups. Furthermore, the inhibition by 50 nM AuNPs was more obvious for the WT group compared to the MT group, and a larger intensity ratio for both groups was obtained. That was because the weak pairing between the WT template and probe hardly strode over the elevated barrier, but the strong pairing between the MT template and the probe did. When the added AuNP concentration decreased to 5 nM, no inhibition was observed in the MT group and the inhibition in the WT group was also very small. The results indicated that the barrier elevation by 5 nM AuNPs was small, and the effect on the pairing between templates and probes was weak. In summary, the above results verified that the proposed barrier hypothesis could properly explain the effect of AuNPs on different pairing between MT or WT templates and probes, which theoretically supported the specificity improvement of Taqman-MGB nanoPCR.
 |
Figure 3 Mechanism of AuNPs for improving the specificity of Taqman-MGB nanoPCR. (A) The schematic of energy barrier hypothesis to explain the effect of AuNPs on the perfectly and mismatch complement pairing between templates and probes. (B) Hybridization of two single-stranded template sequences (wild-type and mutation-type) with MT probe at different AuNP particle concentrations. The fluorescent signal is derived from the double-stranded product with binding of SYBR Green I. (C) Average fluorescence intensities of WT templates and MT templates when the fluorescence signals reach steady state after hybridization. |
Specificity Improvement of Taqman-MGB nanoPCR for Various Target Concentrations
To investigate the specificity improvement of Taqman-MGB nanoPCR for various template concentrations, a serial concentration of T790M DNA templates (ie, 10, 1, 10−2, 10−3, 10−5, 10−6, 10−8, and 10−9 μM for both MT and WT templates) were diluted to perform the Taqman-MGB PCR. Тhe traditional Taqman-MGB qPCR exhibited poor discrimination at high and low template concentrations, ie, 10−9 μM and 10 μM (Figure 4A). Maximal discrimination occurred at a template concentration of 10−5 μM. In the Taqman-MGB nanoPCR, great discrimination was achieved cross a wide template concentration: from 10−9 μM to 10 μM (Figure 4B). To quantify the discrimination (or specificity) of Taqman-MGB PCR between WT and MT templates, we defined Rdis as an indicator by dividing the difference in WT and MT fluorescence intensities by WT fluorescence intensity. The quantification results exhibited that the overall specificity of Taqman-MGB nanoPCR was much better than that of Taqman-MGB qPCR (Figure 4C). The discriminations of Taqman-MGB qPCR ranging from 10−9 μM to 10 μM were all below 0.6 Rdis, while all discriminations of Taqman-MGB nanoPCR were higher than 0.6 Rdis from 10−9 μM to 10 μM. To further reveal the specificity improvement of Taqman-MGB nanoPCR, the Rdis ratio of Taqman-MGB nanoPCR and qPCR was quantified as the change in template concentrations (Figure 4D). The results indicated that the specificity improvement of Taqman-MGB nanoPCR was more obvious at high and low template concentrations, namely 10−9 μM, 10−8 μM, and 10 μM, which could be ascribed to the good specificity of Taqman-MGB qPCR in moderate template concentrations.
 |
Figure 4 Specificity comparison of Taqman-MGB qPCR and nanoPCR at different target concentrations. The average fluorescence intensities of (A) Taqman-MGB qPCR and (B) nanoPCR at different target concentrations. The fluorescent intensity is extracted from the value at 45 amplification cycle number. (C) Discrimination comparison of Taqman-MGB qPCR and nanoPCR by Rdis with different target concentrations. (D) The specificity improvement of Taqman-MGB nanoPCR varied with different target concentrations. |
Quantification of Mutation Abundance by Taqman-MGB nanoPCR
In clinical diagnosis of the T790M mutation site, the positive patient sample normally contained both WT and MT sequences. To pick out the patients with T790M mutations, the trace amount of MT sequence needed to be efficiently detected from the abundant WT sequences. To verify the potential clinical applications of Taqman-MGB nanoPCR, various mutation abundances (0%, 0.5%, 1%, 2.5%, 5%, and 10%) were detected and compared with traditional Taqman-MGB qPCR (Figure 5). Here, following the clinical rules of Taqman-MGB qPCR, two kinds of Taqman-MGB probes separately paired perfectly with the WT and MT sequences were used in both the Taqman-MGB qPCR and nanoPCR. The FAM and VIC signals were related to the amplification of WT and MT sequences, respectively. The FAM signal obtained by conventional Taqman-MGB qPCR showed significant enhancement with increasing mutation abundance, while the FAM signal of Taqman-MGB nanoPCR just increased slightly (Figure 5A). Theoretically, since the concentration of the WT template was constant, the FAM signal related to its amplification should remain unchanged, no matter if the concentration of MT template increases or decreases. Actually, the FAM signal was increased by the non-specific amplification of MT templates. In comparison, the Taqman-MGB nanoPCR exhibited weaker FAM enhancement, confirming the suppressing effect of AuNPs on non-specific amplification. In Figure 5B, the VIC signal of Taqman-MGB nanoPCR showed a gradual increasing trend with increasing mutation abundance, which was not observed for Taqman-MGB qPCR, indicating that the latter was not sensitive to the increase in mutation abundance. Finally, the standard curves between Taqman-MGB qPCR/nanoPCR and mutation abundance were quantified using the ratio of VIC to FAM (Figure 5C). Both Taqman-MGB qPCR and nanoPCR exhibited great linear correlation between fluorescence ratio and mutation abundance. The fitting linear equation for Taqman-MGB nanoPCR was y=0.02115+0.04724x, where R2 was 0.999. The fitting exponential equation for Taqman-MGB qPCR was y=0.02894+0.01659x, where R2 was 0.966. For the detection of 0.5% mutation abundance, the discrimination by both Taqman-MGB qPCR and nanoPCR was poor. However, when the mutation abundance increased to 1%, the specificity improvement of Taqman-MGB nanoPCR began to stand out, and the ratio difference increased with further increase in mutation abundance. The calculated detection limit of Taqman-MGB qPCR and nanoPCR for mutation abundance was 1.38% and 0.95%, respectively. The above results exhibited that the developed Taqman-MGB nanoPCR enabled a lower LOD than the traditional Taqman-MGB qPCR and possessed better specificity for T790M. Additionally, since the WT templates used here were extracted from human peripheral blood, the detection results could thus partly confirm its potential in clinical applications. To ensure a satisfactory performance, it is suggested to use purified gDNA to test the Taqman-MGB nanoPCR. Based on previous reports, the median abundance of the T790M mutation in patients was ~6.5%,33 which meant that the developed Taqman-MGB nanoPCR was able to identify the most T790M mutations. There have been several studies on T790M mutation detection using qPCR.34–38 Compared with currently available qPCR methods for T790M mutation detection, the method developed in this study was simple in design, and it exhibited a satisfying LOD for T790M mutation detection (Table 1). Since the AuNPs could absorb all single-strand nucleic acid sequences, the developed Taqman-MGB nanoPCR could potentially be used for the detection of multiple site mutations. Actually, nanoPCR has been reported to perform multiplex detection of three viruses.39 Therefore, we believed the developed Taqman-MGB nanoPCR would be a powerful tool for the clinical diagnosis of single-base mutation.
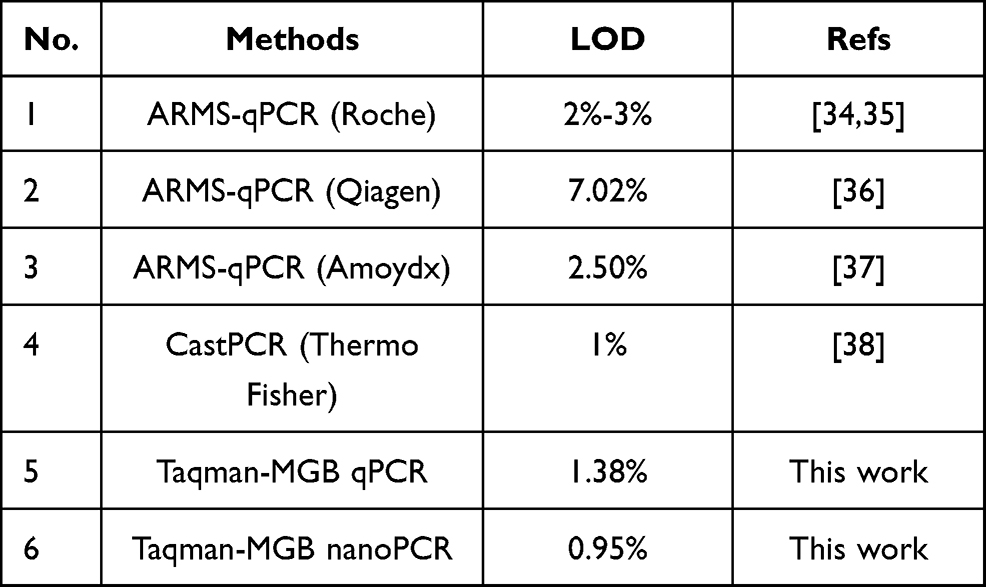 |
Table 1 LOD Comparison of Currently Reported qPCR Methods for T790M Mutation Abundance |
 |
Figure 5 Detection ability comparison of Taqman-MGB qPCR and nanoPCR varied different mutation abundance. (A) The amplification signal of WT templates (ie, FAM fluorescence) varied with different mutation abundance. (B) The amplification signal of MT templates (ie, VIC fluorescence) varied with different mutation abundance. (C) Quantification of different mutation abundance by ratio of VIC and FAM signals in Taqman-MGB qPCR and nanoPCR. The fluorescence intensity is normalized to that of 0% mutation abundance group in figure A and B. Note: The WT templates are extracted from human peripheral blood. |
Conclusion
In summary, we demonstrated the utilization of AuNPs for suppression of the mismatch between templates and probes to achieve highly specific single-base variant analysis using Taqman-MGB nanoPCR. The developed Taqman-MGB nanoPCR enabled a significant specificity improvement across a wide range of concentrations from 10−9 μM to 10 μM, compared to the traditional Taqman-MGB qPCR. Furthermore, it was able to detect mutation abundance as low as 0.95% in spiked samples. Since only minute amounts of AuNPs are required for these analyses and AuNPs were cost-effective and readily available, the current laboratory instrumentation and analytical protocols can easily adapt the proposed system for routine clinical diagnosis of single-base mutations. The method is easily scalable and outperforms traditional MGB probe-based qPCR in terms of specificity and sensitivity. We envision that the developed Taqman-MGB nanoPCR system would be a powerful tool for the diagnosis of various diseases induced by gene mutations.
Credit Authorship Contribution Statement
Zhenrui Xue: Investigation, Validation and Writing. Minli You: Methodology, Investigation, Validation and Writing. Ping Peng: Investigation, Validation and Writing. Haoyang Tong: Validation. Wanghong He: Validation. Ping Mao: Validation. Ting Xu: Investigation. Chunyan Yao: Supervision and Funding acquisition. Feng Xu: Supervision, Review & Editing and Funding acquisition. All authors made substantial contributions to conception and design, acquisition of data, or analysis and interpretation of data; took part in drafting the article or revising it critically for important intellectual content; agreed to submit to the current journal; gave final approval of the version to be published; and agree to be accountable for all aspects of the work.
Acknowledgments
This research was financially supported by the National Key Research and Development Program of China (2018YFC1707702), the National Natural Science Foundation of China (81672108), the Fundamental Research Funds for the Central Universities (xzy012020033), the Key Program for Science and Technology Innovative Research Team in Shaanxi Province of China (2017KCT-22) and the General Financial Grant from the China Postdoctoral Science Foundation (2019M663741).
Disclosure
The authors report no conflicts of interest in this work.
References
1. Hart JR, Zhang Y, Liao L, et al. The butterfly effect in cancer: a single base mutation can remodel the cell. Proc Natl Acad Sci U S A. 2015;112(4):1131. doi:10.1073/pnas.1424012112
2. Riva L, Pandiri AR, Li YR, et al. The mutational signature profile of known and suspected human carcinogens in mice. Nat Genet. 2020;52(11):1189–1197. doi:10.1038/s41588-020-0692-4
3. Doudna JA. The promise and challenge of therapeutic genome editing. Nature. 2020;578(7794):229–236. doi:10.1038/s41586-020-1978-5
4. Chen P, Pan D, Fan C, et al. Gold nanoparticles for high-throughput genotyping of long-range haplotypes. Nat Nanotechnol. 2011;6(10):639–644. doi:10.1038/nnano.2011.141
5. Oxnard GR, Hu Y, Mileham KF, et al. Assessment of resistance mechanisms and clinical implications in patients with EGFR T790M-positive lung cancer and acquired resistance to osimertinib. JAMA Oncol. 2018;4(11):1527–1534. doi:10.1001/jamaoncol.2018.2969
6. Planchard D, Popat S, Kerr K, et al. Correction to: “Metastatic non-small cell lung cancer: ESMO clinical practice guidelines for diagnosis, treatment and follow-up”. Ann Oncol. 2019;30(5):863–870. doi:10.1093/annonc/mdy474
7. Eide I, Å H, Ekman S, et al. Osimertinib in T790M-positive and -negative patients with EGFR-mutated advanced non-small cell lung cancer (the TREM-study). Lung Cancer. 2020;143:27–35. doi:10.1016/j.lungcan.2020.03.009
8. Vollbrecht C, Lehmann A, Lenze D, Hummel M. Validation and comparison of two NGS assays for the detection of EGFR T790M resistance mutation in liquid biopsies of NSCLC patients. Oncotarget. 2018;9(26):18529–18539. doi:10.18632/oncotarget.24908
9. Aravanis AM, Lee M, Klausner RD. Next-generation sequencing of circulating tumor DNA for early cancer detection. Cell. 2017;168(4):571–574. doi:10.1016/j.cell.2017.01.030
10. Van Amerongen RA, Retèl VP, Coupé VM, Nederlof PM, Vogel MJ, Van Harten WH. Next-generation sequencing in NSCLC and melanoma patients: a cost and budget impact analysis. Ecancermedicalscience. 2016;10. doi:10.3332/ecancer.2016.684
11. Brychta N, Krahn T, von Ahsen O. Detection of KRAS mutations in circulating tumor DNA by digital PCR in early stages of pancreatic cancer. Clin Chem. 2016;62(11):1482–1491. doi:10.1373/clinchem.2016.257469
12. Xiang Z, Wan R, Zou B, et al. Highly sensitive and specific real-time PCR by employing serial invasive reaction as a sequence identifier for quantifying EGFR mutation abundance in cfDNA. Anal Bioanal Chem. 2018;410(26):6751–6759. doi:10.1007/s00216-018-1316-z
13. Salipante SJ, Jerome KR. Digital PCR-an emerging technology with broad applications in microbiology. Clin Chem. 2020;66(1):117–123. doi:10.1373/clinchem.2019.304048
14. Newton CR, Graham A, Heptinstall LE, et al. Analysis of any point mutation in DNA. The amplification refractory mutation system (ARMS). Nucleic Acids Res. 1989;17(7):2503–2516. doi:10.1093/nar/17.7.2503
15. Xue B, Li Y, Wang X, et al. TaqMan-MGB probe quantitative PCR assays to genotype and quantify three mtDNA mutations of Leber hereditary optic neuropathy. Sci Rep. 2020;10(1):12264. doi:10.1038/s41598-020-69220-7
16. Belousov YS, Welch RA, Sanders S, Mills A. Single nucleotide polymorphism genotyping by two colour melting curve analysis using the MGB eclipse probe system in challenging sequence environment. Hum Genomics. 2004;1(3):1–9. doi:10.1186/1479-7364-1-3-209
17. Park JY, Back SH, Chang SJ, Lee SJ, Lee KG, Park TJ. Dopamine-assisted synthesis of carbon-coated silica for PCR enhancement. ACS Appl Mater Interfaces. 2015;7(28):15633–15640. doi:10.1021/acsami.5b04404
18. Tong W, Cao X, Wen S, et al. Enhancing the specificity and efficiency of polymerase chain reaction using polyethyleneimine-based derivatives and hybrid nanocomposites. Int J Nanomedicine. 2012;7:1069–1078. doi:10.2147/IJN.S28947
19. Sun C, Cheng Y, Pan Y, Yang J, Wang X, Xia F. Efficient polymerase chain reaction assisted by metal–organic frameworks. Chem Sci. 2020;11(3):797–802. doi:10.1039/C9SC03202A
20. Chen F, Zhao Y, Fan C, Zhao Y. Mismatch extension of DNA polymerases and high-accuracy single nucleotide polymorphism diagnostics by gold nanoparticle-improved isothermal amplification. Anal Chem. 2015;87(17):8718–8723. doi:10.1021/acs.analchem.5b01545
21. Li H, Huang J, Lv J, et al. Nanoparticle PCR: nanogold-assisted PCR with enhanced specificity. Angew Chem Int Ed Engl. 2005;44(32):5100–5103. doi:10.1002/anie.200500403
22. Li M, Lin YC, Wu CC, Liu HS. Enhancing the efficiency of a PCR using gold nanoparticles. Nucleic Acids Res. 2005;33(21):e184. doi:10.1093/nar/gni183
23. Ye X, Fang X, Li X, Kong J. Gold nanoparticle-mediated nucleic acid isothermal amplification with enhanced specificity. Anal Chim Acta. 2018;1043:150–157. doi:10.1016/j.aca.2018.09.016
24. Sedighi A, Oberc C, Whitehall V, Li PCH. NanoHDA: a nanoparticle-assisted isothermal amplification technique for genotyping assays. Nano Res. 2016.
25. Kim HR, Baek A, Lee IJ, Kim D. Facilitation of polymerase chain reaction with poly(ethylene glycol)-engrafted graphene oxide analogous to a single-stranded-DNA binding protein. Acs Appl Mater Inter. 2016;8(49):33521–33528. doi:10.1021/acsami.6b13223
26. Lou X, Zhang Y. Mechanism studies on nanoPCR and applications of gold nanoparticles in genetic analysis. Appl Mater Interfaces. 2013;5(13):6276–6284. doi:10.1021/am4013209
27. Cui D, Tian F, Kong Y, Titushikin I, Gao H. Effects of single-walled carbon nanotubes on the polymerase chain reaction. Nanotechnology. 2004;15(1):154–157. doi:10.1088/0957-4484/15/1/030
28. Li A, Zhou B, Alves C, et al. Mechanistic studies of enhanced PCR using PEGylated PEI-entrapped gold nanoparticles. Acs Appl Mater Interfaces. 2016;8(39):25808–25817. doi:10.1021/acsami.6b09310
29. Pan D, Mi L, Huang Q, Hu J, Fan C. Genetic analysis with nanoPCR. Integr Biol-Uk. 2012;4(10):1155–1163. doi:10.1039/c2ib20076g
30. Pan D, Wen Y, Mi L, Fan C, Hu J. Nanomaterials-based polymerase chain reactions for DNA detection. Curr Org Chem. 2011;15(4):486–497. doi:10.2174/138527211794474447
31. Bai Y, Cui Y, Paoli GC, Shi C, Shi X. Nanoparticles affect PCR primarily via surface interactions with PCR components: using amino-modified silica-coated magnetic nanoparticles as a main model. Acs Appl Mater Inter. 2015;7(24):13142–13153. doi:10.1021/am508842v
32. Cao X, Shi X, Yang W, Zhang X, Fan C, Hu J. Enhanced specificity and efficiency of polymerase chain reactions using poly(amidoamine) dendrimers and derivatives. Analyst. 2008;134:87–92. doi:10.1039/B812176A
33. Li X, Cai W, Yang G, et al. Comprehensive analysis of EGFR-mutant abundance and its effect on efficacy of EGFR TKIs in advanced NSCLC with EGFR mutations. J Thorac Oncol. 2017;12(9):1388–1397. doi:10.1016/j.jtho.2017.06.006
34. Malapelle U, Sirera R, Jantus-Lewintre E, et al. Profile of the Roche cobas® EGFR mutation test v2 for non-small cell lung cancer. Expert Rev Mol Diagn. 2017;17(3):209–215. doi:10.1080/14737159.2017.1288568
35. Wu S, Chiang C, Liu C, et al. An observational study of acquired EGFR T790M-dependent resistance to EGFR-TKI treatment in lung adenocarcinoma patients in Taiwan. Front Oncol. 2020;10.
36. Vallée A, Le Loupp A, Denis MG. Efficiency of the Therascreen® RGQ PCR kit for the detection of EGFR mutations in non-small cell lung carcinomas. Clin Chim Acta. 2014;429:8–11. doi:10.1016/j.cca.2013.11.014
37. Feng Q, Gai F, Sang Y, et al. A comparison of QuantStudio™ 3D Digital PCR and ARMS-PCR for measuring plasma EGFR T790M mutations of NSCLC patients. Cancer Manag Res. 2018;10:115–121. doi:10.2147/CMAR.S148134
38. Yang Y, Meng Y, Zhang H, et al. Detection of EGFR and BRAF mutations by competitive allele-specific TaqMan polymerase chain reaction in lung adenocarcinoma. Oncol Lett. 2018;15(3):3295–3304. doi:10.3892/ol.2017.7652
39. Wang M, Yan Y, Wang R, et al. Simultaneous detection of bovine rotavirus, bovine parvovirus, and bovine viral diarrhea virus using a gold nanoparticle-assisted PCR assay with a dual-priming oligonucleotide system. Front Microbiol. 2019;10:2884. doi:10.3389/fmicb.2019.02884
 © 2021 The Author(s). This work is published and licensed by Dove Medical Press Limited. The
full terms of this license are available at https://www.dovepress.com/terms
and incorporate the Creative Commons Attribution
- Non Commercial (unported, 3.0) License.
By accessing the work you hereby accept the Terms. Non-commercial uses of the work are permitted
without any further permission from Dove Medical Press Limited, provided the work is properly
attributed. For permission for commercial use of this work, please see paragraphs 4.2 and 5 of our Terms.
© 2021 The Author(s). This work is published and licensed by Dove Medical Press Limited. The
full terms of this license are available at https://www.dovepress.com/terms
and incorporate the Creative Commons Attribution
- Non Commercial (unported, 3.0) License.
By accessing the work you hereby accept the Terms. Non-commercial uses of the work are permitted
without any further permission from Dove Medical Press Limited, provided the work is properly
attributed. For permission for commercial use of this work, please see paragraphs 4.2 and 5 of our Terms.