Back to Journals » Journal of Inflammation Research » Volume 14
Systematic Metabolic Profiling of Mice with Dextran Sulfate Sodium-Induced Colitis
Authors Xie D, Li F ![]() , Pang D, Zhao S, Zhang M, Ren Z, Geng C, Wang C, Wei N, Jiang P
, Pang D, Zhao S, Zhang M, Ren Z, Geng C, Wang C, Wei N, Jiang P
Received 31 March 2021
Accepted for publication 22 June 2021
Published 2 July 2021 Volume 2021:14 Pages 2941—2953
DOI https://doi.org/10.2147/JIR.S313374
Checked for plagiarism Yes
Review by Single anonymous peer review
Peer reviewer comments 2
Editor who approved publication: Professor Ning Quan
Dadi Xie,1,* Fengfeng Li,1,* Deshui Pang,1 Shiyuan Zhao,2 Meihua Zhang,1 Zhongfa Ren,1 Chunmei Geng,2 Changshui Wang,3 Ning Wei,4 Pei Jiang2
1Tengzhou Central People’s Hospital, Tengzhou, 277500, People’s Republic of China; 2Jining First People’s Hospital, Jining Medical University, Jining, 272000, People’s Republic of China; 3Affiliated Hospital of Jining Medical University, Jining Medical University, Jining, 272000, People’s Republic of China; 4Shanting District People’s Hospital, Zaozhuang, 277200, People’s Republic of China
*These authors contributed equally to this work
Correspondence: Meihua Zhang
Tengzhou Central People’s Hospital, Xingtan Road, Tenzhou, 277500, People’s Republic of China
Tel/Fax +86 0632-5512227
Email [email protected]
Pei Jiang
Jining First People’s Hospital, Jning Medical University, Jiankang Road, Jining, 272000, People’s Republic of China
Tel/Fax + 86 0537-2106208
Email [email protected]
Purpose: Inflammatory bowel diseases (IBD) are a chronic inflammatory disease, which affects almost all tissues in the body. Previous studies mainly focused on breathing, fecal, and urine samples of patients with IBD. However, there is no comprehensive metabolomic analysis of the serum, colon, heart, liver, kidney, cortex, hippocampus, and brown fat tissues. Therefore, the aim of our study is to evaluate the utility metabolomic analysis of target tissues in the pathogenesis of IBD in exploring new biomarkers for early diagnosis and treatment.
Methods: Male Sprague–Dawley rats were randomly allocated to control and DSS-treated groups (n = 7). Dextran sulfate sodium (DSS) was orally administered for 6 weeks. Gas chromatography-mass spectrometry (GC-MS) was used for metabolite determination, multivariate statistical analysis was used to identify metabolites that were differentially expressed in two groups.
Results: Our results showed that 3, 11, 12, 6, 5, 13, 13, and 11 metabolites were differentially expressed between the DSS treatment group and the control group in the serum, colon, heart, liver, kidney, cortex, hippocampus, and brown fat tissues, respectively. The most significant change of metabolites in the study was amino acid (L-alanine, L-glutamic acid, L-phenylalanine, L-proline, L-lysine, L-isoleucine, L-tryptophan, L-norleucine, L-valine, glycine, serine, L-threonine), organic acid (citric acid, 3-hydroxybutyric acid, propanoic acid), glucide (D-arabinose, D-fructose) and purine (9H-purin-6-ol, D-ribose) profiles. Several pathways were affected according to the integrated pathway analysis. These pathways ranged from amino acid metabolism (such as alanine, aspartate, and glutamate metabolism, glutathione metabolism) to purine metabolism (aminoacyl-tRNA biosynthesis).
Conclusion: Using GC-MS-based profiling of metabolite changes, these results may provide a more comprehensive view for IBD and IBD-related diseases and improve the understanding of IBD pathogenesis.
Keywords: inflammatory bowel disease, metabolite, GC-MS, dextran sodium sulfate, biomarker
Introduction
Inflammatory bowel diseases (IBD) are a group of digestive tract inflammatory conditions. The two major forms of IBDs are ulcerative colitis (UC) and Crohn’s disease (CD), both of which involve symptoms of fatigue, abdominal pain, diarrhea, and weight loss. However, IBD should be regarded as a systemic disorder because some patients with IBD have extraintestinal symptoms not limited to the gastrointestinal tract, including skin lesions, arthritis, hepatic dysfunction, even affects lungs, heart and vascular system.1 The exact pathogenesis of IBD is still not fully understood, but it is widely accepted to have multifactorial etiology, including an inappropriate immune response to gut microbiota, genetic predisposition, and environmental and lifestyle factors.2 Currently, there are no specific biological marker to aid in IBD diagnosis, and the diagnosis of IBD is mainly based on detailed history, physical examination and endoscopic.3
Metabolomics is a powerful tool that can be used for biomarker discovery and for illuminating the pathophysiology of diseases, disease subtyping, and developing specific treatment strategies.4 Mass spectrometry-based metabolomics techniques are sensitive approaches for the simultaneous analysis of a large number of compounds, involving surface enhanced laser desorption ionization time-of-flight mass spectrometry (SELDI-TOFMS), matrix-assisted laser desorption/ionization time-of-flight mass spectrometry (MALDI-TOF-MS), gas chromatography-mass spectrometry (GC-MS), and liquid chromatography-mass spectrometry (LC-MS). In this study, GC-MS was used to evaluate the DSS-induced colitis model, which can provide detailed information about the patterns of metabolite change in metabolic networks.
Recently, many studies have examined human metabolites in patients with IBD, using breath,5 fecal,6 and urine7 samples. Colitis affects other tissues and organs in addition to the digestive system, highlighting the need for metabolomic research to validate metabolites in other biological samples. To the best of our knowledge, this is the first report providing a systematic overview of the identification and quantification of small molecules in the biological systems of a DSS-induced colitis rat model to identify potential disease biomarkers. Our results may provide a valuable alternative to IBD diagnosis and for improvements in metabolic performance.
Materials and Methods
Animals
The study protocol was approved by the Medical Ethics Committee of the Jining First People’s Hospital, Jining Medical University (No. JNMC-2019-DW-RM-002). Animal procedures were conducted in accordance with the National Institutes of Health guide for the care and use of Laboratory animals.
Eight-week-old male Sprague-Dawley (SD) rats (200–230 g) were randomly divided into two groups: the control group (n = 7) and the dextran sulfate sodium (DSS) group (n=7). Each rat in the DSS group was orally administered 5% DSS for 5 days and pure water for 2 days for 6 consecutive weeks. Control group rats were administered the same volume of normal saline. Body weights, stool consistency and the presence of occult blood were measured daily.
Clinical Disease Score
Disease activity index (DAI) of the rats was estimated by the score of body weight loss (no weight loss: 0; 5–10% weight loss: 1; 11–15% weight loss: 2; 16–20% weight loss: 3; 20% weight loss: 4), stool consistency (formed: 0; mild soft: 1; very soft: 2; watery stool: 3) and the degree of stool occult blood (normal color stool: 0; brown color stool: 1; reddish color stool: 2; bloody stool: 3).8 The DAI was tested at the last day of the experiment to assess the overall disease severity.
Reagents
DSS was purchased from MP Biomedicals (Beijing, China). N, O-bis(trimethylsilyl)trifluoroacetamide (with 1% trimethylchlorosilane; v/v; lot no. B-023), and heptadecanoic acid (as an internal standard, IS, purity ≥ 98%; lot no.H3500) were purchased from Sigma-Aldrich (Saint Louis, USA). O-methylhydroxylamine hydrochloride (purity: 98.0%; lot no. 542171) was purchased from J&K Scientific Ltd. (Beijing, China). Pyridine (lot no. C10486013) was obtained from Macklin Biochemical (Shanghai, China). Chromatographic-grade methanol was purchased from Thermo Fisher Scientific (Waltham, USA). Pure water was obtained from Wahaha Company (Hangzhou, China).
Sample Preparation
All rats were euthanized with 1% sodium pentobarbital (50 mg/kg) via intraperitoneal injection. Blood was collected and centrifuged (4500 × g, 5 min) to obtain the serum. Rats were placed on an ice surface, and quickly dissected to obtain colon, heart, liver, kidney, cortex, hippocampus samples, and brown fat. All samples were washed with phosphate-buffered saline (PBS, pH = 7.2), and were rapidly frozen at −80°C until required for use.
Serum samples (100 μL) were mixed with 350 μL methanol (containing 100 μg/mL heptadecanoic acid), centrifuged at 20,913 × g, at 4°C for 10min. Supernatants were transferred to 15 mL tubes and dried at t 37°C under nitrogen gas. Then, the extracts were mixed with 80 μL O-methylhydroxylamine hydrochloride (dissolved in pyridine at 15 mg/mL) and incubated at 70°C for 90 min. Subsequently, 100 μL N, O-bis(trimethylsilyl)trifluoroacetamide (containing 1% trimethylchlorosilane) was added to the extracts and incubated at 70°C for 1 h. The solution was then vortexed and centrifuged at 20,913 × g, at 4°C for 2 min, and filtered for GC-MS analysis using a filter membrane with 0.22 μm pores.
Tissue samples (50 mg; colon, heart, liver, kidney, cortex, hippocampus samples, and brown fat) were homogenized with 1 mL methanol (containing 1 mg/mL heptadecanoic acid), and centrifuged at 20,913 × g, at 4°C for 10 min. The remaining steps of tissue preparation were the same as those for the serum samples.
Histopathological Staining
The colons were fixed by 10% phosphate buffered paraformaldehyde for 48 h and then embedded in paraffin wax. 5 μm thick sections were cut by sledge microtome and stained with hematoxylin-eosin (H&E) for histopathological evaluation.
Real-Time PCR Analysis
According to the manufacturer’s instructions, RNA was extracted by using Trizol reagent (Invitrogen, USA) from the colon. Quantitative PCR was performed on Bio-rad Cx96 Detection System (Bio-rad, USA) using SYBR green PCR kit (Applied Biosystems, USA) and gene-specific primers (IL-1β: forward,5ʹ-AGGTCGTCATCATCCCACGAG-3ʹ, reverse, 5ʹ-GCTGTGGCAGCTACCTATGTCTTG-3ʹ; IL-6: forward, 5ʹ-CACAAGTCCGGAGAGGAGAC-3ʹ, reverse, 5ʹ-ACAGTGCATCATCGCTGTTC-3ʹ; TNF-α: forward, 5ʹ-GAGAGATTGGCTGCTGGAAC-3ʹ, reverse, 5ʹ-GAGAGATTGGCTGCTGGAAC-3ʹ). Each cDNA was tested in triplicate. Thermoprofile conditions were: 50°C for 2 min, 95°C for 10 min and 40 cycles of amplification at 95°C for 15 s and 60°C for 1 min. Relative quantitation for PCR product was normalized to β-actin as an internal standard.9
GC-MS Analysis
The retention time (RT) of the internal standard was used to evaluate the stability of RT. The main analysis instrument used was the 7890B GC system/7000C mass spectrometer (Agilent Technologies, USA). Samples were separated on an HP-5MS fused-silica capillary column. Using helium as the carrier gas, a 1 μL aliquot of the derivatized solution was run in split mode (50:1). The front inlet purge flow rate was 3 mL/min and the gas flow rate was 1 mL/min. The transfer line, injection, and ion source temperatures were 250, 280, and 230°C, respectively. The GC temperature program began at 60°C for 1 min, increased 8°C/min, and held at 300°C for 5 min. Electrospray ionization (ESI) in full-scan mode was conducted for MS detection, and the range of mass/charge (m/z) values was 50–800.
Multivariate Statistical Analysis
GC-MS data were preprocessed using the Unknowns Analysis and Agilent MassHunter Quantitative Analysis software (Agilent Technologies, USA). SIMCA 14.0 (Umetrics, Sweden) was used for statistical analysis. Unsupervised principal component analysis (PCA), and orthogonal projections to latent structures discriminant analysis (OPLS-DA) were used to distinguish the DSS-treated and control groups. The permutation test (200 permutations) was used to further verify the model validation. SPSS 19.0 was used to perform t-tests. Variable importance in projection (VIP) value > 1.0 and p-value < 0.05 were considered statistically significant. MetaboAnalyst 5.0 (http://www.metaboanalyst.ca) and the KEGG (Kyoto Encyclopedia of Genes and Genomes; http://www.kegg.jp) were used for pathway analysis, Raw p < 0.05 and impact > 0 were considered significant.
Results
Evaluation of Colitis in DSS-Induced Rats
DAI is combined with the score of body weight loss, stool consistency and the degree of stool occult blood. As shown in Figure 1A, the DAI of DSS-treated group was significantly higher than that in the control group.
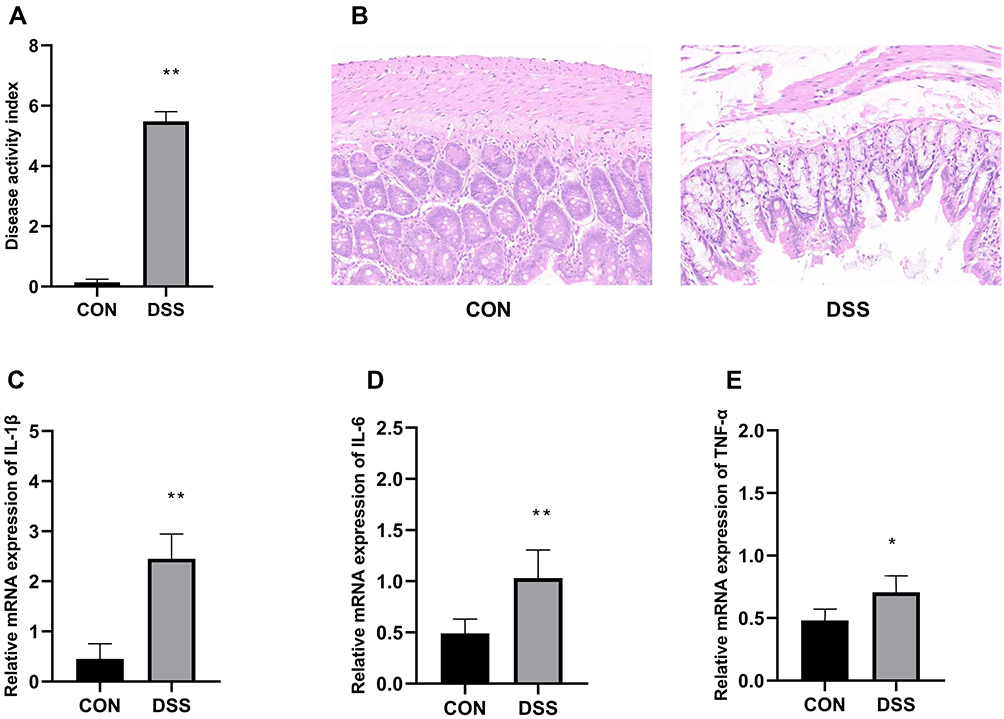 |
Figure 1 Assessment of disease activity index (A). Histopathological analysis of the colon of the control and DSS groups colitis (B), colon tissues were stained with H&E (200×magnification). mRNA expression of the proinflammatory cytokines IL-1β (C), IL-6 (D), TNF-α (E). Data are means±SD (n=7), *p<0.05, **p<0.01 compared to the control group. |
The histopathological results in Figure 1B showed the representative H&E-stained images of the colons for rats treated with 5% DSS and the untreated rats. Colons of the untreated rats had intact mucosa, whereas inflammatory cell infiltration, the thickness of the mucosa and submucosa and erosion of the epithelium were found in the colons of the rats in DSS-treated group. Moreover, pro-inflammatory cytokine IL-1β (Figure 1C), IL-6 (Figure 1D) and TNF-α (Figure 1E) in DSS-treated group were greatly higher than that in control group.
GC-MS Total Ion Chromatograms (TIC) of Tissues Samples
The representative GC-MS TIC of quality control (QC) of tissue samples (a mixture of control and DSS-treated groups) is shown in Figure 2. All samples showed strong signals and good RT reproducibility.
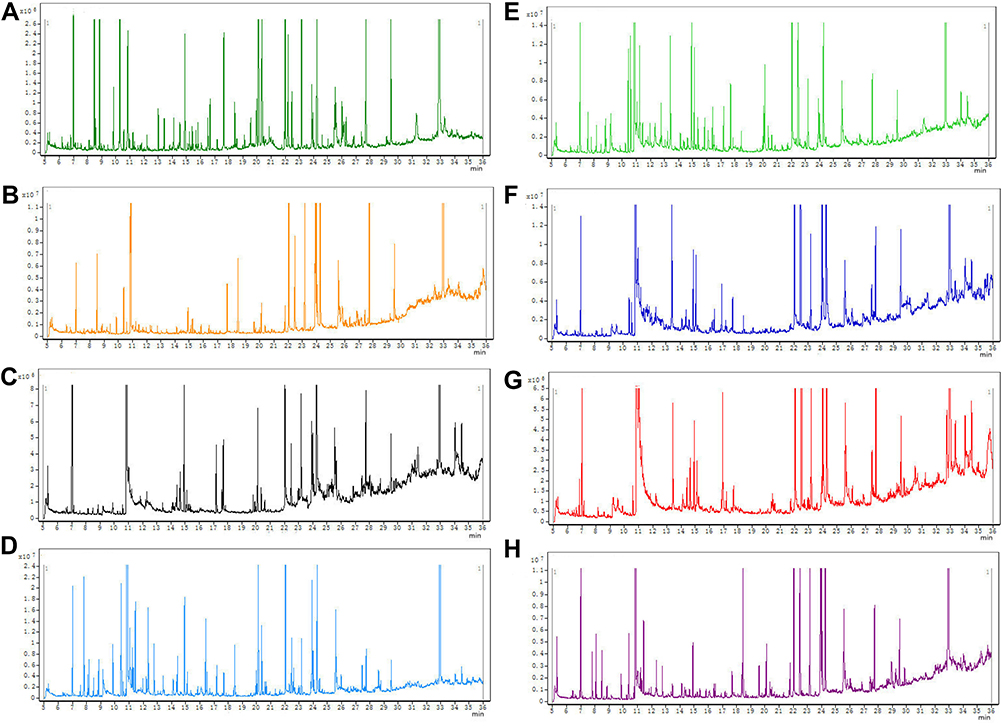 |
Figure 2 Representative GC-MS total ion current (TIC) chromatograms of the serum (A), colon (B), heart (C), liver (D), kidney (E), cortex (F), hippocampus (G), and brown fat (H) samples from a mixture of DSS and control groups. |
Multivariate Statistics Analysis
OPLS-DA and SPSS analyses were performed to evaluate the model using GC-MS data. There were 3, 11, 12, 6, 5, 13, 13, and 11 differentially low molecular metabolites in the serum, colon, heart, liver, kidney, cortex, hippocampus, and brown fat samples, respectively, when the DSS group and control group were compared (VIP > 1, p < 0.05, Table 1). The parameters (serum: R2X = 0.735, R2Y = 0.992, Q2 = 0.386; colon: R2X = 0.538, R2Y = 0.977, Q2 = 0.792; heart: R2X = 0.76, R2Y = 0.992, Q2 = 0.966; liver: R2X = 0.819, R2Y = 1, Q2 = 0.935; kidney: R2X = 0.89, R2Y = 1, Q2 = 0.944; cortex: R2X = 0.87, R2Y = 0.999, Q2 = 0.963; hippocampus: R2X = 0.718, R2Y = 0.988, Q2 = 0.961; brown fat: R2X = 0.86, R2Y = 1, Q2 = 0.951) showed that the model was effective, and could clearly distinguish DSS and control groups. Each parameter value was close to 1.0, representing a stable model that is reliably predictive. Permutation tests verified the model validation and the intersection of the blue regression lines (the Q2-points) and the vertical axis (on the left) are all below zero (Figure 3).
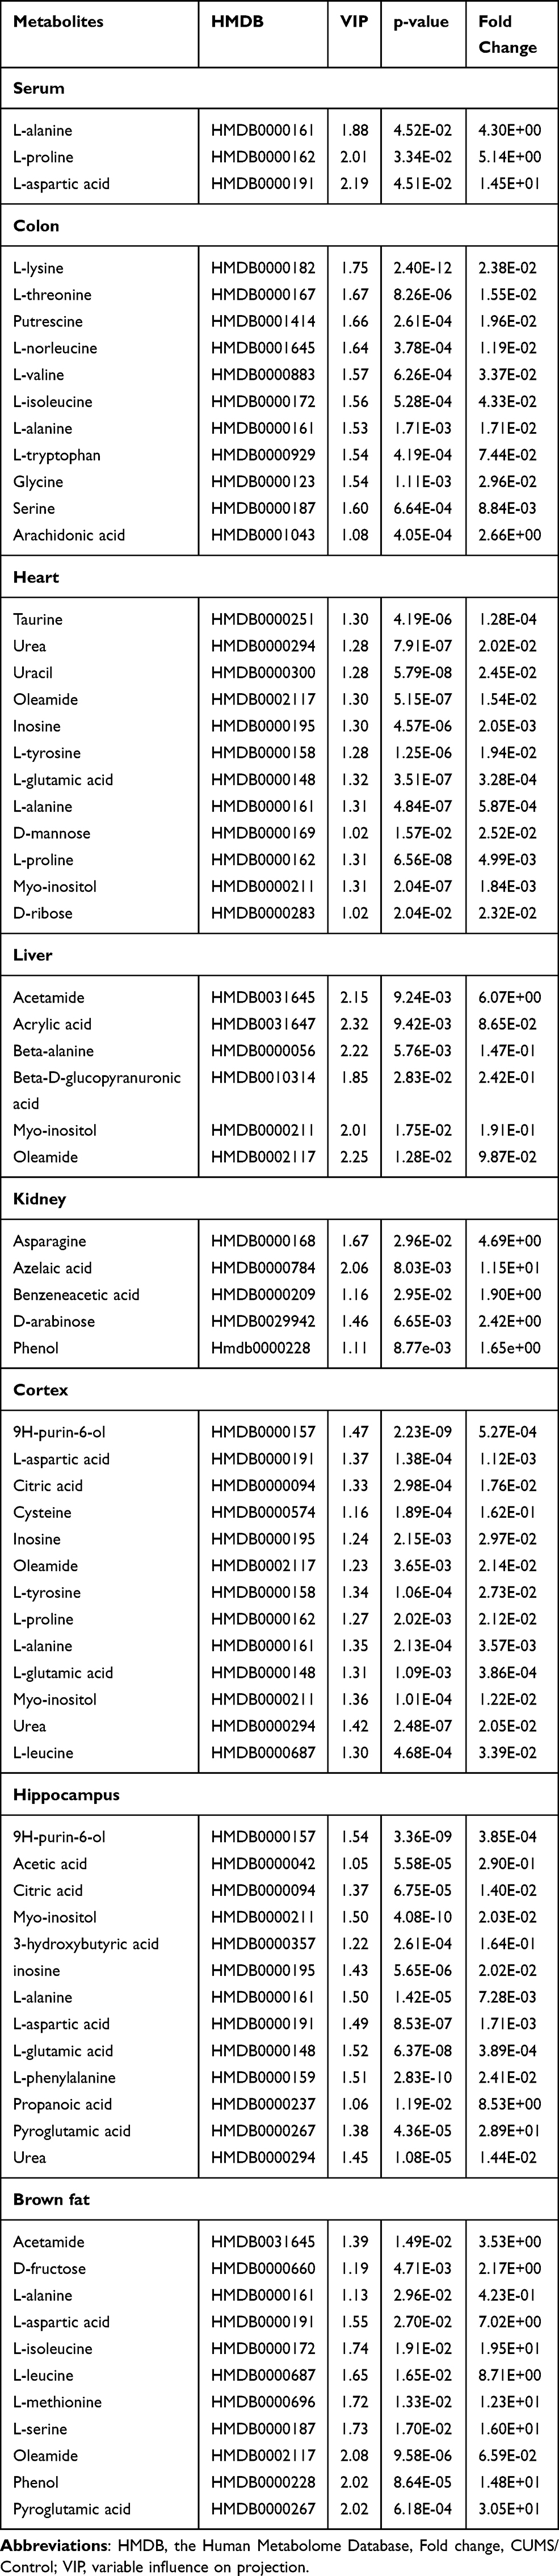 |
Table 1 List of Assigned Statistically Significant Metabolites of the Serum, Colon, Heart, Liver, Kidney, Cortex, Hippocampus, and Brown Fat with Differential Levels in the DSS and Control Groups |
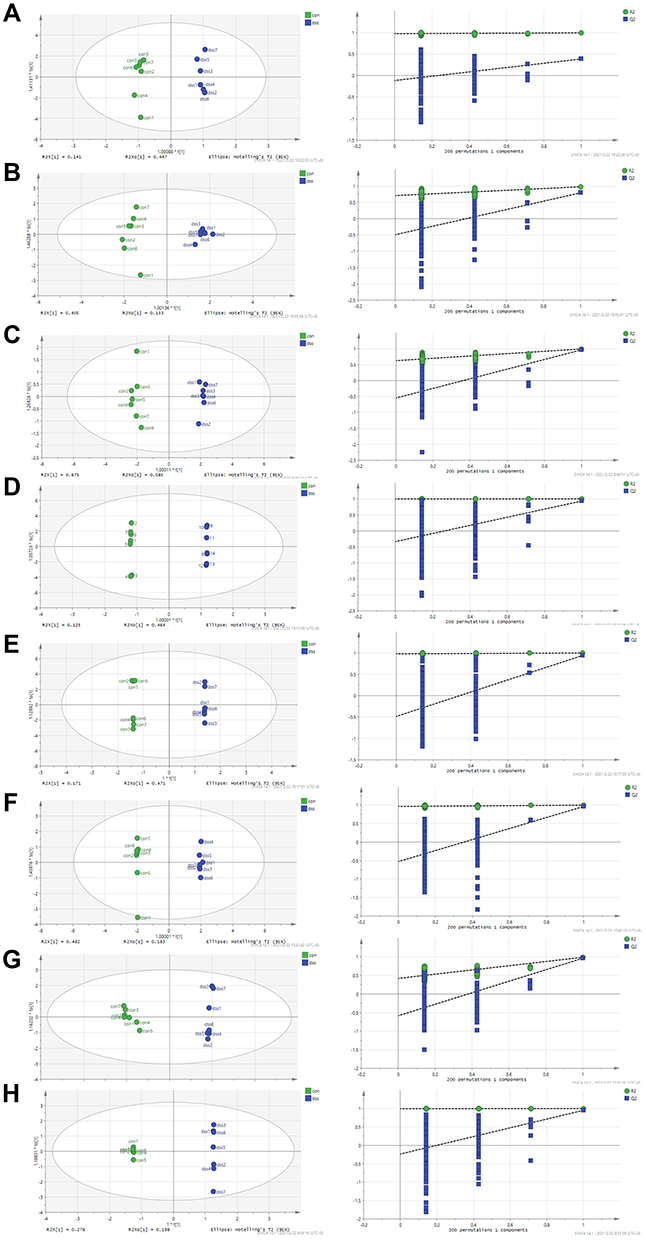 |
Figure 3 Orthogonal projections to latent structures (OPLS) scores and 200 permutation tests for the OPLS-discriminant analysis models: serum (A), colon (B), heart (C), liver (D), kidney (E), cortex (F), hippocampus (G), and brown fat (H). |
We used MetaboAnalyst 5.0 to investigate metabolic differences between the two groups. Cluster analysis of the expression of metabolites in tissues revealed that most samples were grouped into two differentiated clusters with only a small part of the sample cluster overlapping (Figure 4). These results agree with those of the OPLS analysis.
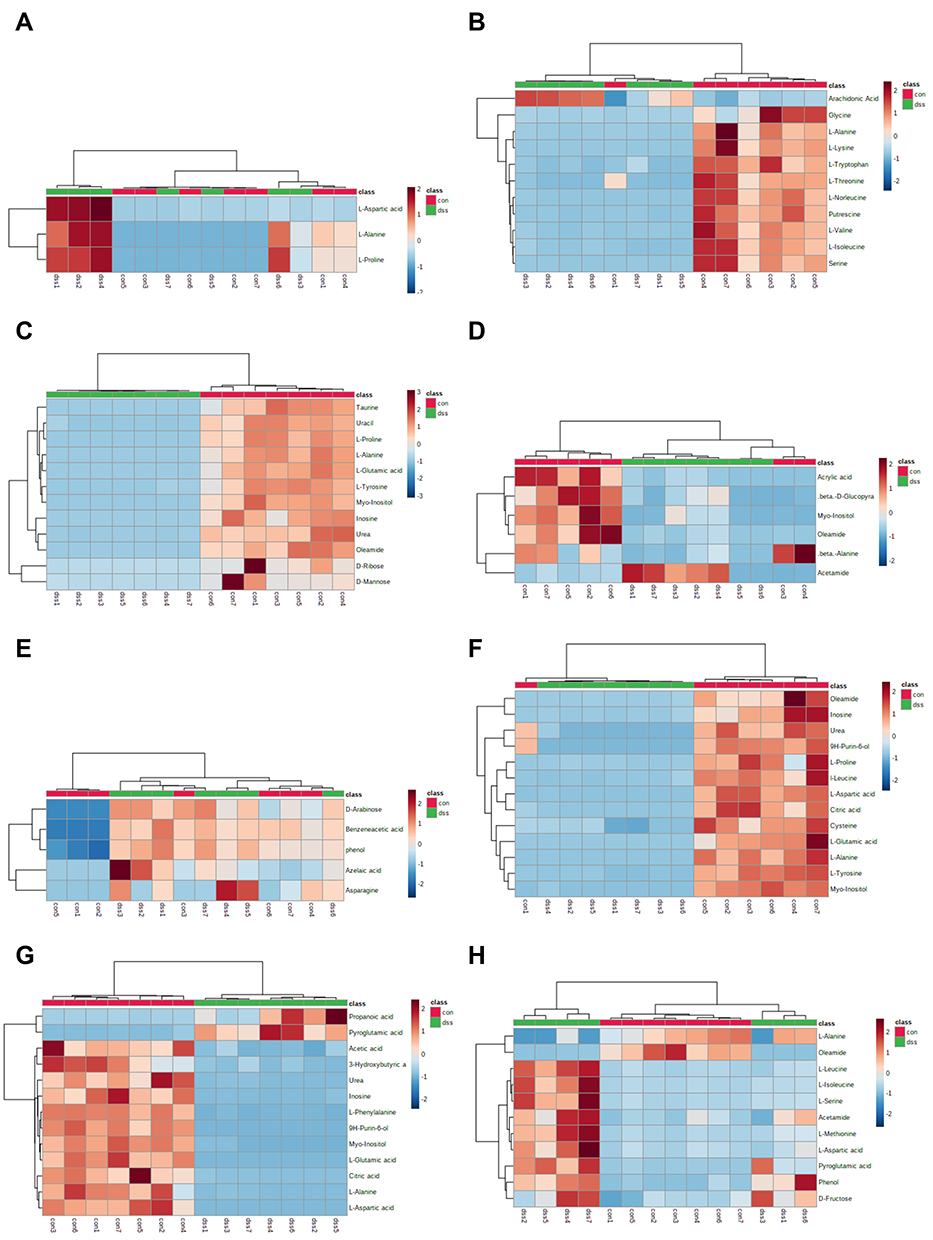 |
Figure 4 Heatmap of differentially expressed metabolites in the serum (A), colon (B), heart (C), liver (D), kidney (E), cortex (F), hippocampus (G), and brown fat (H) samples in dextran sulfate sodium and control groups. The color of each section is proportional to the significance of the change in metabolites (red, up-regulated; blue, down-regulated). Rows correspond to the samples, columns correspond to the metabolites. |
Analysis of Metabolic Pathways
MetaboAnalyst 5.0 was used to analyze the pathways associated with the differential metabolites identified by comparing the control and the DSS groups. We identified 11 significant metabolic pathways (raw p < 0.05, impact > 0). In the serum, these pathways included alanine, aspartate, and glutamate metabolism. In the colon, these pathways included aminoacyl-tRNA biosynthesis, glycine, serine, and threonine metabolism, glyoxylate and dicarboxylate metabolism, and GSH metabolism. In the heart, these pathways included alanine, aspartate, and glutamate metabolism, arginine biosynthesis, arginine and proline metabolism, D-glutamine and D-glutamate metabolism, and phenylalanine, tyrosine, and tryptophan biosynthesis. In the cortex, these pathways included arginine biosynthesis, alanine, aspartate, and glutamate metabolism, arginine and proline metabolism, GSH metabolism, glyoxylate and dicarboxylate metabolism, purine metabolism, and phenylalanine, tyrosine, and tryptophan biosynthesis; In the hippocampus, these pathways included arginine biosynthesis, alanine, aspartate, and glutamate metabolism, glyoxylate and dicarboxylate metabolism, purine metabolism, and GSH metabolism, phenylalanine, tyrosine, and tryptophan biosynthesis. In the brown fat, these pathways included aminoacyl-tRNA biosynthesis, alanine, aspartate, and glutamate metabolism, and cysteine and methionine metabolism. The pathway analysis details are shown in Table 2 and Figure 5, and a summary is shown in Figure 6.
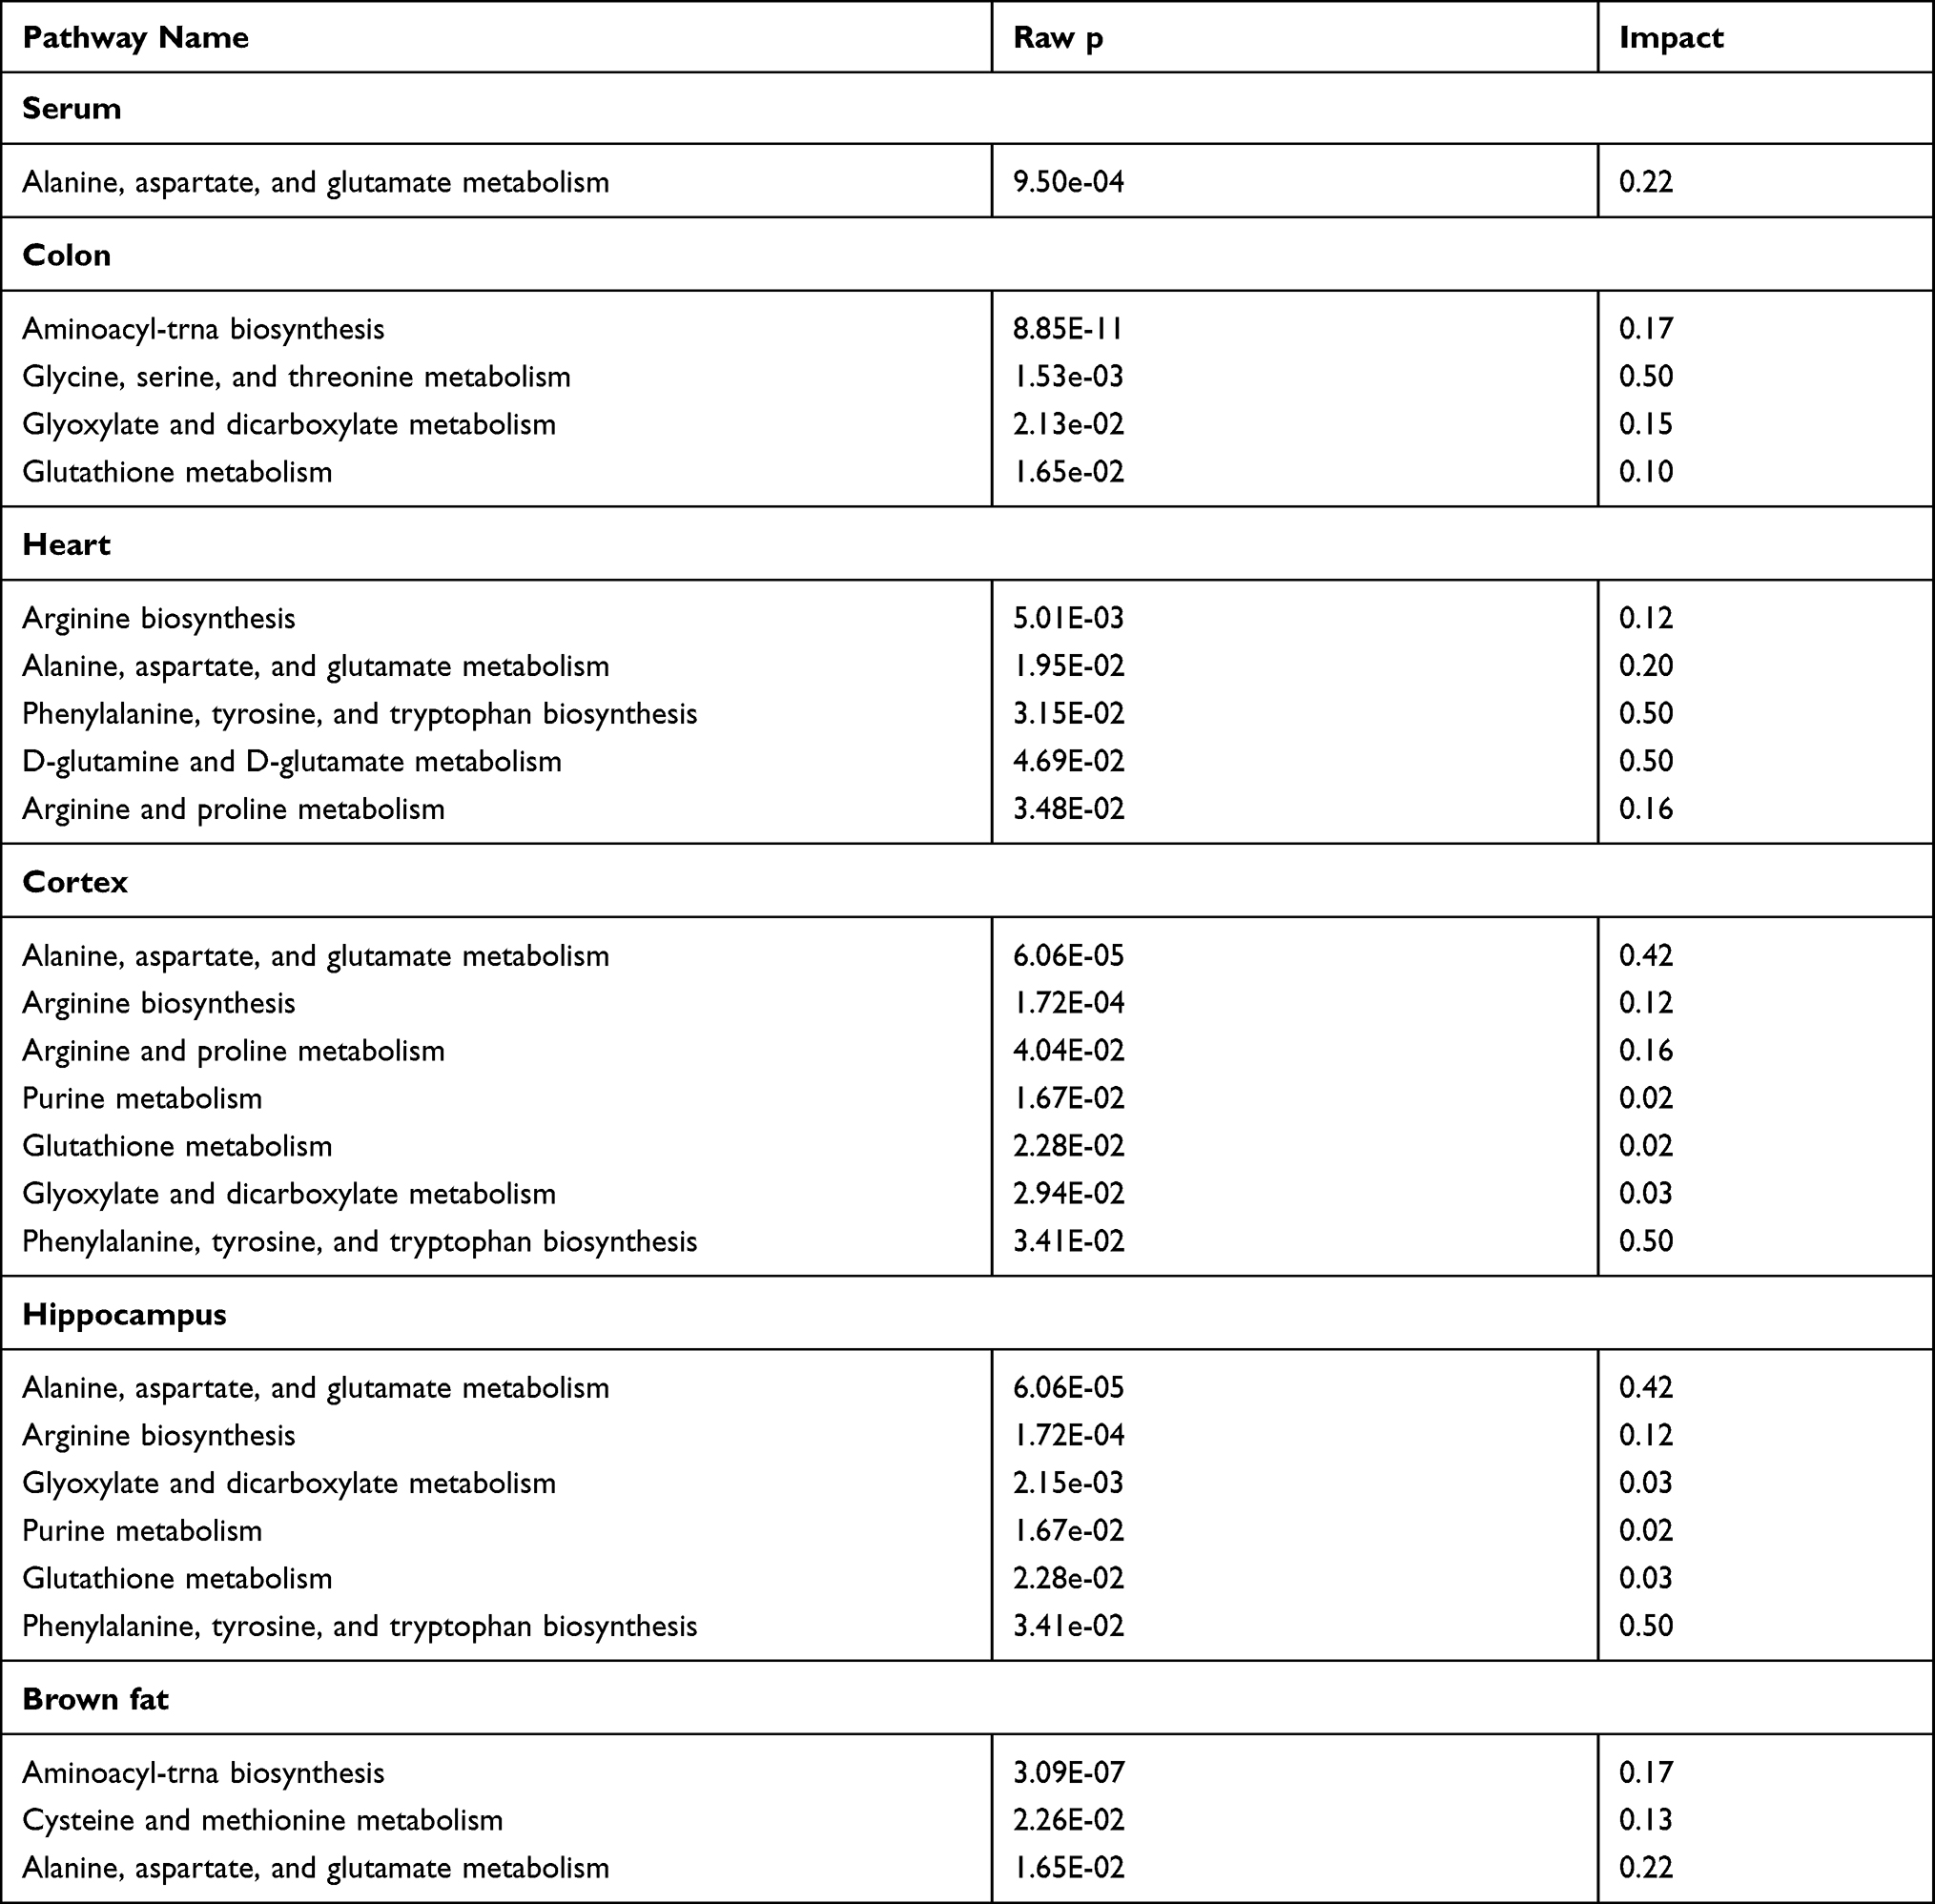 |
Table 2 Pathway Analysis Results Produced Using MetaboAnalyst 5.0 |
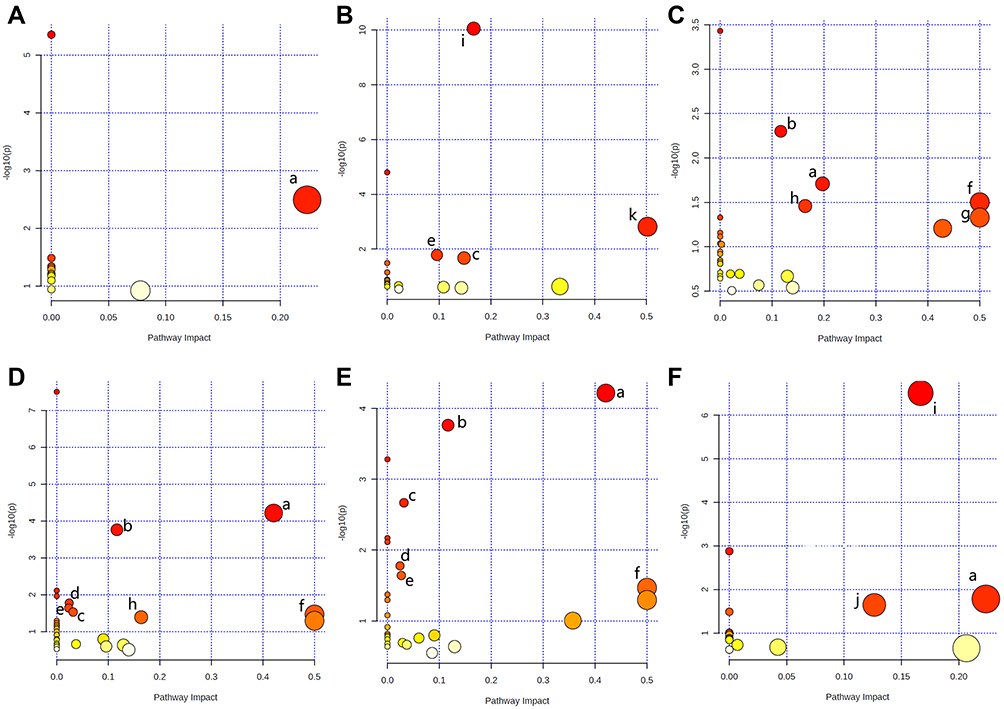 |
Figure 5 Summary of pathway analysis using MetaboAnalyst 5.0. Serum (A), colon (B), heart (C), cortex (D), hippocampus (E), and brown fat (F). (a) Alanine, aspartate, and glutamate metabolism, (b) arginine biosynthesis, (c) glyoxylate and dicarboxylate metabolism, (d) purine metabolism, (e) glutathione metabolism, (f) phenylalanine, tyrosine, and tryptophan biosynthesis, (g) D-glutamine and D-glutamate metabolism, (h) arginine and proline metabolism, (i) aminoacyl-tRNA biosynthesis, (j) cysteine and methionine metabolism, and (k) glycine, serine, and threonine metabolism. |
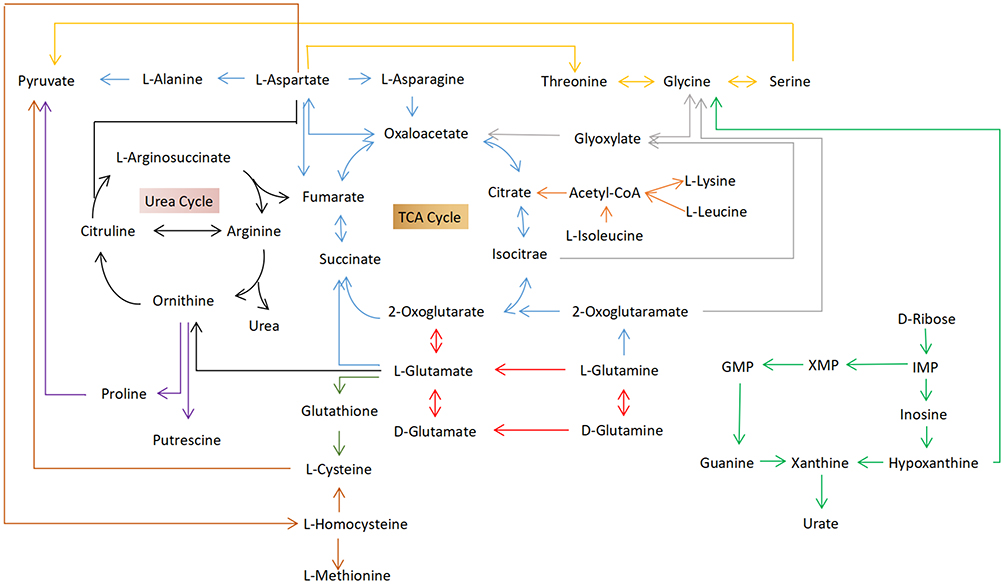 |
Figure 6 Schematic diagram of the metabolites and metabolic pathways in the target tissues of the Dextran sulfate sodium-treated group compared to the control group (black arrows: arginine biosynthesis; red arrows: D-glutamine and D-glutamate metabolism; blue arrows: alanine, aspartate, and glutamate metabolism; light green arrows: purine metabolism; orange arrows: glycine, serine, and threonine metabolism; purple arrows: arginine and proline metabolism; gray arrows: cysteine and methionine metabolism; green arrows: glutathione metabolism; and silvery arrows: glyoxylate and dicarboxylate metabolism). |
Discussion
IBD is a disorder of chronic intestinal inflammation. The current leading hypothesis suggests that IBD is an aggressive inflammatory response to gastrointestinal microflora.10 Additionally, host genetics, intestinal microflora, and immune responses play important roles in IBD pathogenesis. Metabolomics is useful for investigating the mechanism of pathogenesis and diagnostic metabolites in disease, through the application of comprehensive information on precursors of proteins and carbohydrates, energy metabolism, gene expression regulation, and signaling molecules.11–13 Currently, there are no IBD-related metabolic biomarkers suitable for diagnostic use. The identification of symptoms, differential diagnosis, and colonoscopy are the main diagnostic basis of IBD.14 Therefore, the development of non-invasive metabolic biomarkers is necessary to provide an effective screening method for IBD diagnosis.
In this study, the disease rats were identified by evaluation of DAI, histopathological analysis and increased proinflammation cytokine (Figure 1). DSS was able to induce significant colon injury, with inflammatory cell infiltration and epithelial barrier disruption in the colon of rats, which is pathologically similar with patients with UC. All these data showed that the rats model of colitis was successfully established.
We identified the systemic alterations in the main target tissues (serum, colon, heart, liver, kidney, cortex, hippocampus and brown fat) for the first time using metabolomic profiling. There were 3, 11, 12, 6, 5, 13, 13, and 11 metabolites differentially expressed in the serum, colon, heart, liver, kidney, cortex, hippocampus and brown fat tissues of control and DSS groups (Table 1). These metabolites are closely associated with each other (Figure 4), and are involved in 11 significant pathways related to amino acid, nucleotide, and energy metabolism (Figure 5). The identified metabolites and corresponding pathway analysis provide us with a deeper understanding of metabolome alterations in IBD. These metabolites have the potential to be used as biomarkers for IBD diagnosis, as well as providing a comprehensive understanding of disease pathogenesis.
This analysis revealed notable changes in amino acid metabolism. Amino acids are important regulators and substrates of most metabolic pathways. In our study, amino acid metabolites significantly differed between the DSS-treated and control groups, including L-alanine, L-aspartic acid, L-isoleucine, L-leucine, L-methionine, L-serine, L-phenylalanine, L-tyrosine, L-proline, L-leucine, taurine, L-lysine, L-threonine, L-norleucine, L-valine, L-isoleucine, and glycine (Table 1). Moreover, associated pathways were involved in arginine biosynthesis, arginine and proline metabolism, alanine, aspartate, and glutamate metabolism, cysteine and methionine metabolism, D-glutamine and D-glutamate metabolism, GSH metabolism, glycine, serine, and threonine metabolism, and phenylalanine, tyrosine, and tryptophan biosynthesis (Table 2).
Proline is critical for protein synthesis and cell growth, it also has roles in osmoregulation, protein stability, cellular bioenergetics, and antibacterial or antifungal properties.15 Proline levels changed in serum, colon, heart, and cortex tissues indicating that proline may help reduce osmotic stress and resist bacteria to maintain intestinal homeostasis. Proline is thought to serve as an important energy source for some bacteria, potentially explaining why proline levels were decreased in serum samples. Glycine is the simplest amino acid, and is involved in energy release and DNA production and which could be used to protect chemical-induced colitis by inhibiting inflammatory cytokines and chemokines.16 The previous study have observed that the level of glycine increased in patients of the active phase of IBD.17 Compared with the control group, the level of glycine in the colon of DSS-treated group is increased, which possibly indicating glycine is protective against colitis and ameliorates inflammation in the colonic mucosa. Branched-chain amino acids, including L-valine, L-leucine, and L-isoleucine, are involved in inflammation, stress, muscle metabolism, and energy generation.18,19 The changing L-valine, L-isoleucine, and L-leucine levels observed in this study suggest that these amino acids are related to inflammation in DSS-induced colitis. In our study, the changes in amino acid levels observed in the target tissues of the DSS-treatment group may help us determine the pathological mechanism of intestinal inflammation.
The intestine of patients with IBD is a complex pathological environment, including oxidative stress, osmotic stress, DNA damage, and abnormal immune response.20,21 Lih-Brody found increased oxidative stress in colonic mucosal biopsies of patients with IBD.22 L-glutamic acid, is an essential amino acid for protein synthesis and plays a key role in cellular metabolism, protecting cells from oxidative stress.23 L-glutamic acid also supports the immune and digestive systems and aids in energy production in the body. In our study, L-glutamic acid levels were significantly increased in DSS-treated rats, suggesting that L-glutamic acid can prevent DSS-induced oxidative stress. Moreover, glutamate combined with glycine and cysteine are involved in the synthesis of glutathione (GSH). GSH metabolism is associated with many cellular reactions, such as cellular antioxidant defense, drug detoxification, and cell signaling.24 High GSH levels increase cellular antioxidant capacity and resistance to oxidative stress, while low GSH levels decrease antioxidant capacity.25 Some researches showed that a significant increase of GSH in inflamed mucosa of UC patients.26,27 Therefore, regulation of GSH metabolism is critical for the development of effective strategies to treat colitis.
Aspartic acid is related to the chronic visceral pain and hypersensitivity that is experienced by individuals with colonic inflammation.28 The RGD (arginine-glycine-aspartic acid) peptide motif displays intestinal anti-inflammatory properties and protects intestinal wall integrity by increasing the expression of certain genes including trefoil factor-3 and mucins.29 Therefore, aspartic acid could function as an indicator of IBD severity. Tryptophan as a precursor of serotonin is widely expressed metabolite in the gut.30 However, serotonin is associated with pathogenesis of colitis.31 In our study, it was found that the level of tryptophan increased significantly in colon tissue, which implied that tryptophan could contribute to colitis as a pathogenic mediator.
We also found the levels of hypoxanthine, inosine and uracil, which are linked with nucleotide synthesis and act against inflammation and DNA damage, were changed in our study. The expression of ILC3 and Th17 genes related to purine metabolism were altered in colons of patients with IBD compared with individuals without IBD.32 Thus, hypoxanthine, inosine and uracil may be the potential metabolic biomarkers. The TCA cycle is the major source of energy by oxidizing glucose in organisms. Ketone bodies are used as alternative energy when glucose is insufficient. The increase concentration of 3-hydroxybutyric acid and citric acid was observed in DSS-treated rats, indicating a high demand for energy in DSS-induced UC. Likewise, clinical studies also found the level of TCA cycle-related molecules is changed significantly in the UC patients, indicating that these molecules might be potential diagnostic biomarkers for UC.33
To obtain insight into the pathophysiological mechanisms of IBD, future studies should focus on metabolic, gene expression, and protein data. There were several limitations in our study. Only a single metabolomic method, the GC-MS method, was used. Therefore, multi-omics or other technologies, like LC-MS, are needed to confirm these findings. Additionally, metabolomics data of small intestine tissue was not included in this analysis. Although UC usually occurs at colon, it’s meaningful to compare the metabolite differences in different part of the whole intestine tissue. Future studies need to explore the different part of the whole intestine to achieve a complete understanding of IBD mechanisms.
Conclusion
We identified several specific metabolites in key DSS-treated rat model target tissues using GC-MS based profiling. The amino acid metabolic profile of DSS-treated groups differed from that in control groups, suggesting that there might be a relationship between amino acid composition and pathogenesis of DSS-induced colitis. Some amino acids may be suitable as potential biomarkers for patients with IBD. These studies will help to determine the role of these amino acids in the pathogenesis of IBD and identify future novel treatments. Additionally, some of these metabolites are likely to be microbial metabolites, indicating that the intestinal microflora may be a future therapeutic target. Further investigation should pay attention to the relationship between metabolic changes, intestinal flora alteration, and IBD activity.
Data Sharing Statement
The datasets used and analyzed during the current study are available from the corresponding author on reasonable request.
Ethics Approval and Informed Consent
Our study was approved by the medical ethics committee of the Jining First People’s Hospital, Jining Medical University (No. JNMC-2019-DW-RM-002).
Funding
This work was supported by the Key Research and Development Program of Jining Science and Technology (2019SMNS012); Taishan Scholar Project of Shandong Province (tsqn201812159); National Natural Science Foundation of China (81602846).
Disclosure
The authors report no conflicts of interest in this work.
References
1. Vavricka SR, Schoepfer A, Scharl M, Lakatos PL, Navarini A, Rogler G. Extraintestinal manifestations of inflammatory bowel disease. Inflamm Bowel Dis. 2015;21(8):1982–1992. doi:10.1097/MIB.0000000000000392
2. Kaser A, Zeissig S, Blumberg RS. Inflammatory bowel disease. Annu Rev Immunol. 2010;28:573–621. doi:10.1146/annurev-immunol-030409-101225
3. Flynn S, Eisenstein S. Inflammatory bowel disease presentation and diagnosis. Surg Clin North Am. 2019;99(6):1051–1062. doi:10.1016/j.suc.2019.08.001
4. De Preter V, Verbeke K. Metabolomics as a diagnostic tool in gastroenterology. World J Gastrointest Pharmacol Ther. 2013;4(4):97–107. doi:10.4292/wjgpt.v4.i4.97
5. Baranska A, Mujagic Z, Smolinska A, et al. Volatile organic compounds in breath as markers for irritable bowel syndrome: a metabolomic approach. Aliment Pharmacol Ther. 2016;44(1):45–56. doi:10.1111/apt.13654
6. Shankar V, Reo NV, Paliy O. Simultaneous fecal microbial and metabolite profiling enables accurate classification of pediatric irritable bowel syndrome. Microbiome. 2015;3:73. doi:10.1186/s40168-015-0139-9
7. Keshteli AH, Madsen KL, Mandal R, et al. Comparison of the metabolomic profiles of irritable bowel syndrome patients with ulcerative colitis patients and healthy controls: new insights into pathophysiology and potential biomarkers. Aliment Pharmacol Ther. 2019;49(6):723–732. doi:10.1111/apt.15141
8. Liao Z, Zhang S, Liu W, et al. LC-MS-based metabolomics analysis of Berberine treatment in ulcerative colitis rats. J Chromatogr B Analyt Technol Biomed Life Sci. 2019;1133:121848. doi:10.1016/j.jchromb.2019.121848
9. Jiang P, Guo Y, Dang R, et al. Salvianolic acid B protects against lipopolysaccharide-induced behavioral deficits and neuroinflammatory response: involvement of autophagy and NLRP3 inflammasome. J Neuroinflammation. 2017;14(1):239. doi:10.1186/s12974-017-1013-4
10. Abraham C, Cho JH. Inflammatory bowel disease. N Engl J Med. 2009;361(21):2066–2078. doi:10.1056/NEJMra0804647
11. Davis VW, Bathe OF, Schiller DE, et al. Metabolomics and surgical oncology: potential role for small molecule biomarkers. J Surg Oncol. 2011;103(5):451–459. doi:10.1002/jso.21831
12. Manna SK, Tanaka N, Krausz KW, et al. Biomarkers of coordinate metabolic reprogramming in colorectal tumors in mice and humans. Gastroenterology. 2014;146(5):1313–1324. doi:10.1053/j.gastro.2014.01.017
13. Nishiumi S, Izumi Y, Yoshida M. Alterations in docosahexaenoic acid-related lipid cascades in inflammatory bowel disease model mice. Dig Dis Sci. 2018;63(6):1485–1496. doi:10.1007/s10620-018-5025-4
14. Chey WD, Kurlander J, Eswaran S. Irritable bowel syndrome: a clinical review. JAMA. 2015;313(9):949–958. doi:10.1001/jama.2015.0954
15. Christgen SL, Becker DF. Role of proline in pathogen and host interactions. Antioxid Redox Signal. 2019;30(4):683–709. doi:10.1089/ars.2017.7335
16. Tsune I, Ikejima K, Hirose M, et al. Dietary glycine prevents chemical-induced experimental colitis in the rat. Gastroenterology. 2003;125(3):775–785. doi:10.1016/S0016-5085(03)01067-9
17. Dawiskiba T, Deja S, Mulak A, et al. Serum and urine metabolomic fingerprinting in diagnostics of inflammatory bowel diseases. World J Gastroenterol. 2014;20(1):163–174. doi:10.3748/wjg.v20.i1.163
18. Sperringer JE, Addington A, Hutson SM. Branched-chain amino acids and brain metabolism. Neurochem Res. 2017;42(6):1697–1709. doi:10.1007/s11064-017-2261-5
19. White PJ, Newgard CB. Branched-chain amino acids in disease. Science. 2019;363(6427):582–583. doi:10.1126/science.aav0558
20. Brocker C, Thompson DC, Vasiliou V. The role of hyperosmotic stress in inflammation and disease. Biomol Concepts. 2012;3(4):345–364. doi:10.1515/bmc-2012-0001
21. Morgenstern I, Raijmakers MTM, Peters WHM, et al. Homocysteine, cysteine, and glutathione in human colonic mucosa elevated levels of homocysteine in patients with inflammatory bowel disease. Dig Dis Sci. 2003;48(10):2083–2090. doi:10.1023/A:1026338812708
22. Lih-Brody L, Powell SR, Collier KP, et al. Increased oxidative stress and decreased antioxidant defences in mucosa of inflammatory bowel disease. Dig Dis Sci. 1996;41:2078–2086. doi:10.1007/BF02093613
23. Geng C, Guo Y, Wang C, et al. Comprehensive evaluation of lipopolysaccharide-induced changes in rats based on metabolomics. J Inflamm Res. 2020;13:477–486. doi:10.2147/JIR.S266012
24. Franco R, Schoneveld OJ, Pappa A, Panayiotidis MI. The central role of glutathione in the pathophysiology of human diseases. Arch Physiol Biochem. 2007;113(4–5):234–258. doi:10.1080/13813450701661198
25. Ballatori N, Krance SM, Notenboom S, et al. Glutathione dysregulation and the etiology and progression of human diseases. Biol Chem. 2009;390(3):191–214. doi:10.1515/BC.2009.033
26. Sturniolo GC, Mestriner C, Lecis PE, et al. Altered plasma and mucosal concentrations of trace elements and antioxidants in active ulcerative colitis. Scan J Gastroenterol. 1998;33:644–649. doi:10.1080/00365529850171936
27. Tüzün A, Erdil A, Inal V, et al. Oxidative stress and antioxidant capacity in patients with inflammatory bowel disease. Clin Biochem. 2002;35(7):569–572. doi:10.1016/S0009-9120(02)00361-2
28. Zhou Q, Verne GN. NMDA receptors and colitis: basic science and clinical implications. Rev Analg. 2008;10(1):33–43. doi:10.3727/154296108783994013
29. Rodriguez-Nogales A, Algieri F, De Matteis L, et al. Intestinal anti-inflammatory effects of RGD-functionalized silk fibroin nanoparticles in trinitrobenzenesulfonic acid-induced experimental colitis in rats. Int J Nanomed. 2016;11:5945–5958. doi:10.2147/IJN.S116479
30. Schicho R, Nazyrova A, Shaykhutdinov R, et al. Quantitative metabolomic profiling of serum and urine in DSS-induced ulcerative colitis of mice by 1H NMR spectroscopy. J Proteome Res. 2010;9(12):6265–6273. doi:10.1021/pr100547y
31. Ghia JE, Li N, Wang H, et al. Serotonin has a key role in pathogenesis of experimental colitis. Gastroenterology. 2009;137(5):1649–1660. doi:10.1053/j.gastro.2009.08.041
32. Crittenden S, Cheyne A, Adams A, et al. Purine metabolism controls innate lymphoid cell function and protects against intestinal injury. Immunol Cell Biol. 2018;96(10):1049–1059. doi:10.1111/imcb.12167
33. Ooi M, Nishiumi S, Yoshie T, et al. GC/MS-based profiling of amino acids and TCA cycle-related molecules in ulcerative colitis. Inflamm Res. 2011;60(9):831–840. doi:10.1007/s00011-011-0340-7
 © 2021 The Author(s). This work is published and licensed by Dove Medical Press Limited. The
full terms of this license are available at https://www.dovepress.com/terms
and incorporate the Creative Commons Attribution
- Non Commercial (unported, 3.0) License.
By accessing the work you hereby accept the Terms. Non-commercial uses of the work are permitted
without any further permission from Dove Medical Press Limited, provided the work is properly
attributed. For permission for commercial use of this work, please see paragraphs 4.2 and 5 of our Terms.
© 2021 The Author(s). This work is published and licensed by Dove Medical Press Limited. The
full terms of this license are available at https://www.dovepress.com/terms
and incorporate the Creative Commons Attribution
- Non Commercial (unported, 3.0) License.
By accessing the work you hereby accept the Terms. Non-commercial uses of the work are permitted
without any further permission from Dove Medical Press Limited, provided the work is properly
attributed. For permission for commercial use of this work, please see paragraphs 4.2 and 5 of our Terms.