")
Back to Journals » International Journal of Nanomedicine » Volume 19
Synergistic Effects of Nanoscale CaO2 Combined with PD-1 Inhibitors in the Treatment of Hepatocellular Carcinoma: A Promising Combination
Authors Wang Y, Ju S, Zhou H, Bai Y, Zhou C, Liu J , Dong X, Zheng C
Received 15 September 2023
Accepted for publication 19 December 2023
Published 5 January 2024 Volume 2024:19 Pages 137—154
DOI https://doi.org/10.2147/IJN.S440387
Checked for plagiarism Yes
Review by Single anonymous peer review
Peer reviewer comments 3
Editor who approved publication: Professor Jie Huang
Yingliang Wang,1,2,* Shuguang Ju,1,2,* Huimin Zhou,3,* Yaowei Bai,1,2 Chen Zhou,1,2 Jiacheng Liu,1,2 Xiangjun Dong,1,2 Chuansheng Zheng1,2
1Department of Radiology, Union Hospital, Tongji Medical College, Huazhong University of Science and Technology, Wuhan, 430022, People’s Republic of China; 2Hubei Key Laboratory of Molecular Imaging, Wuhan, 430022, People’s Republic of China; 3Department of Nuclear Medicine, Tongji Hospital, Tongji Medical College, Huazhong University of Science and Technology, Wuhan, 430030, People’s Republic of China
*These authors contributed equally to this work
Correspondence: Xiangjun Dong; Chuansheng Zheng, Department of Radiology, Union Hospital, Tongji Medical College, Huazhong University of Science and Technology, Wuhan, 430022, People’s Republic of China, Email [email protected]; [email protected]
Purpose: To explore the effect of calcium peroxide nanoparticles (CaO2 NPs) combined with programmed cell death protein 1 (PD-1) inhibitors in the treatment of liver cancer and its related mechanism.
Methods: Hepa1-6 cells were cultured to construct the Hepa1-6 mouse liver cancer model. In vivo mechanism study, a unilateral tumor model was established. Eighteen tumor-bearing mice were randomly divided into the control group (intra-tumoral injection of PBS solution) and the experimental group (intra-tumoral injection of CaO2 NPs). A hypoxic probe, pH probe, and micro-CT were used to evaluate the effect of CaO2 NPs on improving hypoxia, neutralizing acidity, and inducing calcium overload within the tumor. To study the effect of CaO2 NPs combined with PD-1 inhibitors on proximal and distal tumors, the bilateral tumor model was established. Forty tumor-bearing mice were randomly divided into the control group (intra-tumoral/intra-peritoneal injection of PBS solution), CaO2 NPs group (intra-tumoral injection of CaO2 NPs), PD-1 group (intra-peritoneal injection of PD-1 inhibitor), and the combination group (intra-tumoral injection of CaO2 NPs and intra-peritoneal injection of PD-1 inhibitors). The administered side was recorded as the proximal tumor. Tumor volume and body weight were measured every 2 days after treatment. On day 8, serum and tumor samples were collected. The immune factors in serum (Interferon-γ (IFN-γ), Tumour necrosis factor-α (TNF-α), Interleukin-2 (IL-2), and Interleukin-10 (IL-10)) and tumor tissue (IFN-γ and TNF-α) were detected by ELISA. H&E staining was used to detect tumor necrosis. Immunohistochemical staining was used to detect the amount of CD4+ and CD8+ T cells within the tumor. By analyzing the tumor volume, pathological indexes, and immune-related indexes, the effects of CaO2 NPs combined with PD-1 inhibitors on proximal and distal tumors were evaluated, and they mediated immunomodulatory effects (including local and systemic immunity), and their effects on tumor burden were studied. In addition, a unilateral tumor model was established to study the effect of CaO2 NPs combined with PD-1 inhibitors on survival time.
Results: The results of in vivo mechanism study showed that CaO2 NPs can improve hypoxia, neutralize acidity, and induce calcium overload within tumors. The results of the study on the effect of CaO2 NPs combined with PD-1 inhibitor on proximal and distal tumors showed that, compared with the other three groups, the bilateral tumor burden of the combination group was significantly reduced, the intra-tumoral infiltration of CD8+ and CD4+ T cells were significantly increased, the secretion of anti-tumor immune factors in tumor and serum was increased, and the secretion of pro-tumor immune factors was decreased. Mice in the combination group showed the longest survival compared with the other groups.
Conclusion: CaO2 NPs can improve hypoxia, neutralize acidity, and induce calcium overload within tumors, so as to reduce tumor burden and realize an immunosuppressive tumor transformation to a hot tumor, and play a synergistic role with PD-1 inhibitors in anti-liver cancer.
Keywords: calcium peroxide nanoparticles, programmed cell death protein 1 inhibitor, Hepa1-6 model, tumor microenvironment, liver cancer
Introduction
Liver cancer is a serious disease threatening human health worldwide. It is reported to be the sixth most common malignancy and the third most common cause of cancer-related death.1 Despite the continuous development of diagnostic methods for liver cancer, a large number of patients are still in the middle and late stages when diagnosed and do not have the chance for radical treatment.2,3 For the treatment of advanced liver cancer, both Western and Eastern guidelines recommend systemic therapy as the first-line treatment.4,5 Tyrosine kinase inhibitors, such as sorafenib and Lenvatinib, are among the first systematic therapeutic agents to be developed and have shown good survival benefits in many studies.6,7 In recent years, with the emergence of tumor immunotherapy and immune checkpoint inhibitors (ICIs), revolutionary changes have taken place in the field of tumor therapy, which regards host immune response as the target of anti-tumor therapy as the most promising therapeutic means. Relevant clinical studies have been rising and reported satisfactory curative effects, including good tolerance and improved objective response rate.8,9
Currently, ICIs are commonly used in immunotherapy, mainly including agents targeting cytotoxic T lymphocyte-associated protein-4 (CTLA-4), programmed cell death protein-1 (PD-1), and its ligand (PD-L1).9 Although some studies have shown that ICIs can benefit patients with liver cancer, they only work in a limited number of people, and a considerable proportion of patients do not respond to them.10,11 A large number of studies have found that the prerequisite for the efficacy of ICIs is the preexisting immunity at the tumor site, that is, the presence of T lymphocytes in the tumor, mainly CD8+ T lymphocytes.12 According to the number and location of cytotoxic T lymphocytes in the tumor, researchers classified the tumor immunity into the following types: cold tumor, immune-exclusive tumor, immune-suppressive tumor, and hot tumor.13 Hot tumor presented a large number of CD8+ T lymphocytes infiltrated within the tumor, and responded the best to ICIs; Cold tumors showed no CD8+ T lymphocytes infiltrated in and around the tumor, and were ineffective against ICIs; Immune-exclusive tumor means that CD8+ T lymphocytes exist only around the tumor, and there is no infiltrated inside the tumor; Immune-suppressive tumor refers to a small amount of CD8+ T lymphocyte infiltrated inside the tumor. And immune-exclusive and immune-suppressive tumors also showed limited response to ICIs.14 Most advanced solid tumors, including liver cancer, are mostly immune-suppressive, so promoting the shift of immune typing to hot tumors is an effective strategy to improve the efficacy of ICIs.8,15,16
The tumor microenvironment (TME) is the ecological environment for tumor survival and plays a key role in the process of tumor initiation, metastasis, drug resistance, etc. The acquisition and maintenance of tumor characteristics depend on the role of TME to varying degrees.17 Hypoxia and high acid are typical features of TME in solid tumors, both of which play an important role in immune escape.18 On the one hand, they inhibit the activity of anti-tumor immune cells, including inhibiting the recruitment of cytotoxic T lymphocytes and reducing the secretion of cytokines; On the other hand, they can enhance the activity of tumor-promoting immune cells, such as increasing the aggregation of inhibitory T lymphocytes and the transformation of macrophages to M2 phenotype.19–21 At present, many studies have shown that increasing the oxygen content or neutralizing the acidic microenvironment within the tumor can reverse the immunosuppressive effect, increase the infiltration of cytotoxic T lymphocytes in the tumor, and enhance the efficacy of anti-tumor therapy. Drugs that provide oxygen or neutralize the acidic microenvironment within the tumor in combination with ICIs can play a role in sensitizing immunotherapy.19,22–24 Therefore, the hypoxic and acidic environments in tumors are promising targets for tumor immunotherapy.
Calcium peroxide (CaO2), a common hydrogen peroxide and oxygen supply material, has been widely used in recent years in tumor therapy.25 For example, chemodynamic therapy (CDT) is an important anti-tumor therapy that utilizes iron-mediated Fenton reaction to induce intracellular oxidative stress by converting less reactive H2O2 into hydroxyl radical (•OH), which is the most harmful ROS.26 Owing to its biodegradability and H2O2-generating ability, CaO2 has already been widely used to supply H2O2 for CDT.27,28 In addition, CaO2 has been attempted in recent years to enhance the efficacy of chemotherapy, radiotherapy, photodynamic therapy, and other therapies by improving the oxygen content within the tumor.25 In the previous study, to enhance the stability and biocompatibility of calcium peroxide, our team synthesized the polyvinyl Pyrrolidone (PVP) coated calcium peroxide nanoparticles (CaO2 NPs). After injection into the tumor, CaO2 NPs would react with water to produce abundant oxygen, hydroxyl ions (OH−), and Ca2+, thus alleviating tumor hypoxia, neutralizing the acidic environment, and providing anti-tumor effects mediated by calcium overload.29 In theory, regulation of the hypoxic and acidic TME can improve the immunosuppressive state of the tumor. The antitumor effect mediated by calcium overload can cause tumor cell death to expose tumor-associated antigens, thus playing a role in immune activation. Therefore, the combination of CaO2 NPs and ICIs is expected to play a synergistic anti-tumor effect.
Herein, we applied the previously synthesized CaO2 nanoparticles (CaO2 NPs) as a synergistic agent to improve the antitumor efficacy of PD-1 inhibitors. The local and distant anti-tumor effects of CaO2 NPs combined with PD-1 inhibitors and systemic immune response were evaluated by establishing unilateral and bilateral mouse liver cancer models and analyzing the changes in tumor load, the contents of immune cells and immune factors in tumor and serum of tumor-bearing mice before and after treatment. To the best of our knowledge, this is the first study to explore CaO2 NPs which could comprehensively regulate the TME as a synergistic agent to improve the antitumor efficacy of PD-1 inhibitors in a mouse liver cancer model.
Materials and Methods
Materials
All chemical reagents were obtained commercially and used directly without further purification. Fetal bovine serum (FBS) and Dulbecco’s Modified Eagle’s Medium (DMEM) were purchased from Gibco Co. (Grand Island, NY, USA). 4′,6-diamidino-2-phenylindole (DAPI) was obtained from Servicebio Biotechnology Co. Ltd. (Wuhan, China). The pH-sensitive fluorescent probe, 2,7 bis (2 carboxyethyl) 5 (and 6) carboxyfluorescein (BCECF), was purchased from ZFdows Bio Co., Ltd (Nanjing, China). The HP6 Hypoxyprobe Green Kit was purchased from Maokang Biotechnology Co. Ltd. (Shanghai, China). The PD-1 inhibitor was obtained from Junshi Biosciences Co., Ltd. (Shanghai, China).
Male C57BL/6 mice (6–8 weeks, weight 20–25 g) were purchased from the Experimental Animal Center of Tongji Medical College, Huazhong University of Science and Technology. All procedures were in accordance with the National Institutes of Health Guide for the Care and Use of Laboratory Animals and were approved by the Ethics Committee of the institute.
Cell Line and Culture
The hepatocellular carcinoma cell line (Hepa1-6) was obtained from Procell Life Science & Technology Co., Ltd. (Wuhan, China). The cells were cultured in DMEM with 10% FBS and 1% penicillin–streptomycin and cells were grown in the conditions of 37 °C, 5% CO2, and 21% O2.
Preparation and Characterization of CaO2 NPs
The methods of preparation and characterization of CaO2 NPs were stated in our previous report.29 In brief, CaO2 NPs were prepared by the reaction of H2O2 and ammonia (NH3•H2O) and calcium chloride (CaCl2) in an ethanol solution containing PVP (room temperature, 30 min) followed by centrifugation (12,000 rpm, 10 min). The product was collected by centrifugation (13,000 rpm), washed with ethanol, and redispersed in 5 mL of ethanol. The ethanol was removed by vacuum drying before administration. The morphology of CaO2 NPs was observed using field emission transmission electron microscopy (FTEM). The X-ray photoelectron spectroscopy (XPS) patterns and the powder X-ray diffraction (XRD) pattern were used for qualitative analysis. Dynamic light scattering (DLS) was used to measure the hydrodynamic size of CaO2 NPs.
Animal Model
The Hepa1-6 cells at the logarithmic growth phase were digested by trypsin, centrifuged (1000 rpm, 5 min), and the supernatant was discarded, and the appropriate amount of fresh medium without serum was added to suspend the digestion. The cells were stored on ice for future use. The hair on the back of the mice was shaved with an electric razor and after being wiped with an alcohol cotton ball, 100μL of the above cell suspension (1×10⁶ cells) was absorbed with a 1mL insulin needle and inoculated into the subcutaneous back of the mice. The tumor-bearing mice were kept in suitable conditions. The density of mice in each cage is appropriate (about 6 mice/cage), and the bedding material is changed regularly. The tumor size was measured with an electronic vernier caliper every day, and the experimental intervention was performed when the tumor volume was about 150 mm3.
The Regulation Ability of TME by CaO2 NPs
The HP6 Hypoxyprobe Green Kit was used to detect the oxygen level within the tumor. Six tumor-bearing mice were selected and randomized divided into two groups: the control group (n = 3) and the experimental group (n = 3). The control group was treated with intra-tumoral injection of PBS solution (50 μL/mouse) and the experimental group was treated with intra-tumoral injection of CaO2 NPs (240 μg/mouse, 50 μL). Then the six mice were intra-peritoneally injected with Hypoxyprobe™-1 (60 mg/kg) 2 h after the above intervention. After 1 h of hypoxic probe injection, the tumors of the two groups were completely removed and preserved in a formalin solution. By immunofluorescence method, FITCMAb1 was added to present the hypoxic area of the tumor. By comparing the hypoxic area of tumors in the two groups, the improvement ability of CaO2 NPs on tumor hypoxia was reflected.
The pH of the tumor was indicated by a pH-sensitive fluorescent probe (BCECF). Six tumor-bearing mice were selected and randomized divided into two groups: the control group (n = 3) and the experimental group (n = 3). The control group was treated with intra-tumoral injection of PBS solution (50 μL/mouse) and the experimental group was treated with intra-tumoral injection of CaO2 NPs (240 μg/mouse, 50 μL). The tumor tissues were immediately harvested and the tumors in each group were injected with BCECF fluorescent probe (0.5 mM). After 0.5 h of the probe injection, all the tumors were harvested. Then the captured tumor tissues were immediately moved to a Lago X in vivo optical imaging system (Spectral Instruments Imaging, Inc., Tucson, AZ, USA), where the tumors were imaged under the excitation light with wavelengths of 430 mm and 465 mm. By comparing the imaging of the tumors in the two groups, the ability of CaO2 NPs to regulate the tumor pH was reflected.
Intra-tumoral calcium overload can cause calcium deposition and tissue mineralization within the tumor tissue. Therefore, the CT imaging of the tumor tissues can be manifested as an increase in CT value. Six tumor-bearing mice were selected and randomized divided into two groups: the control group (n = 3) and the experimental group (n = 3). The control group was treated with intra-tumoral injection of PBS solution (50 μL/mouse) and the experimental group was treated with intra-tumoral injection of CaO2 NPs (240 μg/mouse, 50 μL). Twenty-four hours after the above interventions, the mice were anesthetized with pentobarbital sodium (40 mg/kg). The anesthetized mice were imaged on micro-CT. After imaging, the images were reconstructed, and the CT values of each tumor were measured. By comparing the CT values of the tumors in each group, the ability of CaO2 NPs to mediate intra-tumoral calcium overload was reflected.
Study Design
To evaluate the effect of CaO2 NPs on tumors, the unilateral tumor model was established. Twenty tumor-bearing mice were selected and randomly divided into two groups: the control group (n = 10) and the experimental group (n = 10). The control group was treated with intra-tumoral injection of PBS solution (50 μL), while the experimental group was treated with intra-tumoral injection of CaO2 NPs (240 μg/ mouse, 50 uL, once every 3 days, 3 times in total). Starting from the first intervention (day 0), the volume and body weight of mice were measured every 2 days. On day 8, the serum and tumor samples were collected. With 5 mice in each group as the first batch (n = 5), the levels of immune factors in serum (Interferon-γ (IFN-γ), Tumour necrosis factor-α (TNF-α), Interleukin-2 (IL-2), and Interleukin-10 (IL-10)) and tumor (IFN-γ and TNF-α) were detected by enzyme-linked immunosorbent assay (ELISA). The remaining 5 mice in each group were assigned as the second batch to detect the tumor necrosis by hematoxylin-eosin staining (H&E staining) and the levels of CD4+ and CD8+ T cells in the tumor were measured by immunohistochemistry. The immunomodulatory effects of CaO2 NPs (local and systemic immunity) and their effect on tumor burden were evaluated by measuring the tumor size, and pathological and immune-related parameters.
To study the effect of CaO2 NPs combined with PD-1 inhibitors on proximal and distal tumors, a bilateral tumor model was established. Forty tumor-bearing mice were selected and randomly divided into four groups: the control group (n = 10, intra-tumoral (50 μL)/intra-peritoneal (100 μL) injection of PBS solution); the CaO2 NPs group (n = 10, intratumoral injection of CaO2 NPs, 240 μ/ mouse, 50 μL, once every 3 days, 3 times in total); the PD-1 group (n = 10, intra-peritoneal injection of PD-1 inhibitor, 200 μg/ mouse, once every 3 days, 3 times in total), and the combination group (n = 10, intra-tumoral injection of CaO2 NPs and intra-peritoneal injection of PD-1 inhibitor, the injection time and dose were the same as the above single drug injection). The tumor injected with drugs was denoted as the proximal tumor. The tumor volume and body weight of the mice were measured and recorded every 2 days after injection. On day 8, serum and tumor samples were collected. The levels of immune factors in serum (IFN-γ, TNF-α, IL-2, and IL-10) and bilateral tumor (IFN-γ and TNF-α) were detected by ELISA. The H&E staining was used to detect tumor necrosis. The levels of CD4+ and CD8+ T cells in bilateral tumors were detected by immunohistochemical staining. The effects of CaO2 NPs combined with PD-1 inhibitors on proximal and distal tumors, including immunomodulatory effects (local and systemic immunity) and tumor burden, were evaluated by measuring the tumor size, and pathological and immune-related parameters.
To study the effect of CaO2 NPs combined with PD-1 inhibitors on survival, a unilateral tumor model was established. Twenty-four tumor-bearing mice were selected and randomly divided into four groups: the control group (n = 6), the CaO2 NPs group (n = 6), the PD-1 group (n = 6), and the combination group (n = 6). The injection time and dose were the same as the above usage in the bilateral tumor model. After injection, the survival of mice was observed every day. The survival of tumor-bearing mice in each group was observed to evaluate the long-term anti-tumor efficacy of CaO2 NPs combined with PD-1 inhibitors.
Measurement of Tumor Volume and Weight of Mice
From day 0, the size of tumors, including the long diameter (L) and short diameter (S), were measured automatically with an electronic vernier caliper every 2 days. According to relevant literature reports,30 the tumor volume (V) can be calculated by the following formula: V= (L×S2)/2. The weight of the mice was measured using a precision electronic scale. The tumor volume and body weight of mice were measured after anesthesia with pentobarbital sodium. The same experiment was measured by the same person, and the measurement was performed three times consecutively and recorded as the average value.
H&E Staining, Immunohistochemistry, and Elisa Assay
All tissues were fixed in 10% formalin solution, embedded in paraffin, and cut into sections. The sections were dewaxed in xylene, hydrated using graded ethanol, and stained with hematoxylin and eosin (H&E) to measure the tumor necrosis rate (TNR). The levels of immune factors in serum (IFN-γ, TNF-α, IL-2, and IL-10) and bilateral tumor (IFN-γ and TNF-α) were detected by ELISA kit according to the manufacturer’s introduction.
For immunohistochemistry, the sections were immersed in a citrate buffer (0.01 mmol/L, pH = 6.0) and heated three times using a microwave oven (15 min). Endogenous peroxidase was blocked with methanol containing 3% hydrogen peroxide for 25 min. The sections were then washed and incubated with mouse anti-CD4 and CD8 antibody (1:200), and FITC-MAb1 (1:100) overnight at 4°C. The sections were then washed with PBS and incubated with a goat anti-rabbit secondary antibody (1:50) for 50 min with fluorescein isothiocyanate (FITC) fluorescent secondary antibody (1:200) for 60 min at 37°C (only immunofluorescent examination). The sections were then stained with DAB or DAPI. A confocal laser scanning microscopy (CLSM; FV1000; Olympus) was used to examine the expression of CD4, CD8, and the hypoxic area.
Image J (NIH Image, Bethesda, MD, USA) was used to assess the expression of different parameters based on the staining intensity and density of five tissue image regions (magnification: 200×). The average number of CD8+ and CD4+ T cells was counted at high magnification of five tissue image regions.30 The TNR was calculated according to H&E staining as follows: TNR = (area of necrotic region / area of tumor sample) × 100%.31 The hypoxic area was evaluated according to the immunofluorescent staining as follows: Hypoxic area = (area of hypoxic region within tumor/tumor tissue area) ×100%.32
Statistical Analysis
All data are expressed as the mean ± standard deviation. One-way ANOVA and two-tailed Student’s t-test were used to analyze the differences using GraphPad Prism 9.0 software (GraphPad Software, San Diego, CA, USA).
Results
The Characterization of CaO2 NPs
The results has been reported in our previous article.29 Namely, the FTEM shows that the size of the CaO2 NPs was approximately 100 nm and that they had irregular morphology. The DLS indicated that the hydrodynamic size of CaO2 NPs was 141.7±3.6 nm, which was larger than the results obtained by FTEM. The XRD indicated that CaO2 NPs represented specific peaks (2θ = 30.1°, 35.6°, and 47.3°), demonstrating the synthesis of CaO2 NPs. XPS was applied to determine the chemical state of CaO2 NPs, which demonstrated deconvoluted spectra for the O1s orbital showed peaks of 532 and 531.2 eV, representing O− of CaO2 and confirming successful preparation of CaO2 NPs. And the synthesized CaO2 NPs could react with water to generate abundant O2 as well as Ca (OH)2, which reacted with H+ to increase the pH level in solution. The mass ratio of CaO2 and PVP in CaO2 NPs is 1:1.
The Regulation Ability of TME by CaO2 NPs
The HP6 Hypoxyprobe Green Kit was used to detect the oxygen level within the tumor, the hypoxic area in the tumor was displayed by immunofluorescence method, and the size of the hypoxic area in the tumor tissue of the two groups was quantitatively compared by Image J software. As shown in Figure 1A and B, the hypoxic area within the tumor in the experimental group (CaO2 NPs) was 12.7 ± 3.7%, and that in the control group was 33.3 ± 3.9%, among which had a statistical significance (t=5.480, p = 0.0054). Therefore, the above results confirmed the effect of CaO2 NPs on the improvement of intra-tumoral hypoxia.
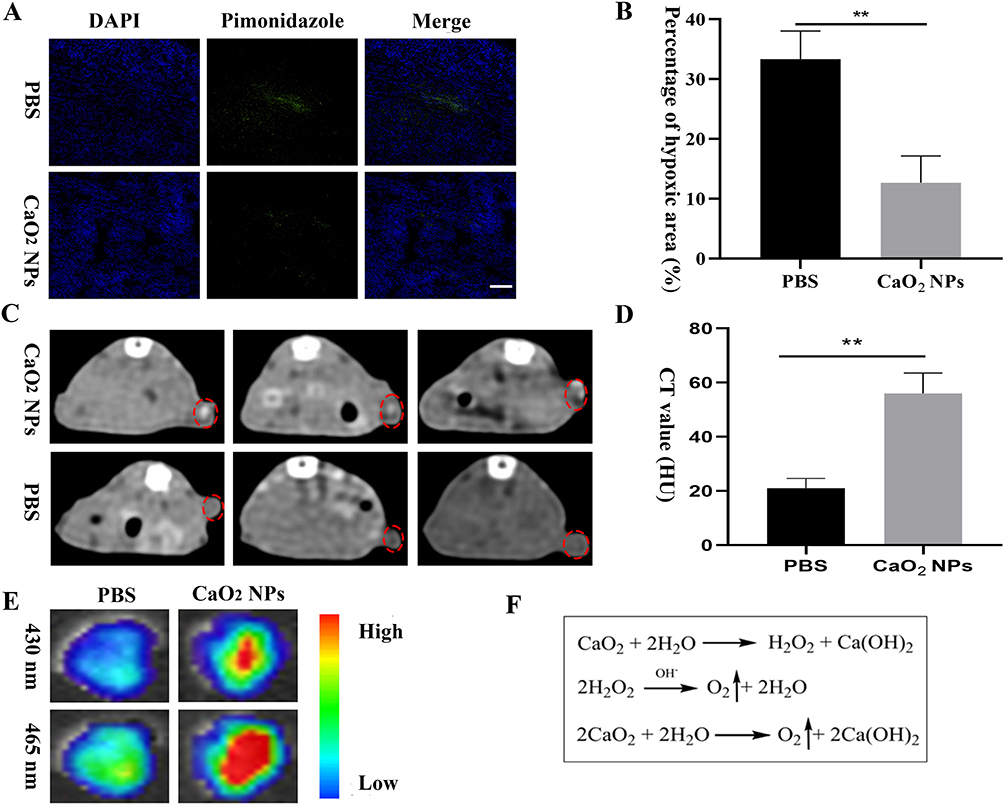 |
Figure 1 The regulation ability of TME by CaO2 NPs. (A) Immunofluorescence staining of the hypoxic area within the tumor in PBS-injected mice and CaO2 NPs-injected mice by the HP6 Hypoxyprobe Green Kit (n=3). Scale bar: 100 µm. (B) Comparing the hypoxic area of tumors in the two groups. (C) CT images of tumors in PBS-injected mice and CaO2 NPs-injected mice (n = 3). (D) Quantitatively compare the Hounsfield unit (HU) values of the tumors in the two groups (E). Multispectral fluorescence imaging of intratumoral pH in PBS-injected mice and CaO2 NPs-injected mice using a pH-sensitive fluorescent probe. (F) Chemical equation for the reaction of calcium peroxide nanoparticles with water. **p<0.01. |
Intra-tumoral calcium overload can cause calcium deposition and tissue mineralization within the tumor tissue, which can be manifested as an increase in CT value. Herein, micro-CT was used to image the tumor, and CT values of each tumor were measured. As shown in Figure 1C and D, the CT value of the tumor in the experimental group was 56.0 ± 6.2 HU, and that in the control group was 21.0 ± 2.9 HU, among which had a statistical significance (t=7.246, p = 0.0019). Therefore, the above results confirmed the ability of CaO2 NPs to mediate intra-tumor calcium overload.
The pH of the tumor was indicated by a pH-sensitive fluorescent probe (BCECF). The captured tumor tissues were moved to a Lago X in vivo optical imaging system (Spectral Instruments Imaging, Inc., Tucson, AZ, USA), where the tumors were imaged.
On the imaging image, different acid-base areas in the tumor showed different colors. The acid-base situation of tumors in the two groups was qualitatively compared with the reference chromatography provided by the software. As shown in Figure 1E, compared with the control group, the acidity of the experimental group (CaO2 NPs) was significantly reduced. Therefore, the above results confirmed the effect of CaO2 NPs on the improvement of intra-tumoral acidity.
In summary, after injection, the CaO2 NPs would react with intra-tumoral water to produce abundant oxygen, hydroxyl ions (OH−), and Ca2+ (Figure 1F) thus alleviating tumor hypoxia, neutralizing the acidic environment, and inducing intra-tumoral calcium overload.
The Antitumor Effect of CaO2 NPs
The tumor therapeutic process is shown in Figure 2A. From day 0, the tumor volume was calculated and recorded every 2 days. As shown in Figure 2B, compared with the control group, the tumor volume in the experimental group (CaO2 NPs) increased slowly; By the end of the experiment on the 8th day, the tumor volume in the experimental group was 282.1 ± 18.9 mm3 and that in the control group was 498.9 ± 62.9 mm3, which showed a statistical significance between the two groups (t=8.335, P = 0.0011) (Figure 2C). The weight change curve (Figure 2D) showed that the weight of mice in the two groups did not fluctuate significantly, which indirectly reflects the biosafety of CaO2 NPs. In addition, the H&E staining results showed that compared with the control group, large tumor necrosis areas were visible in the experimental group (10.8 ± 0.6% vs 36.3 ± 5.0%, t=8.136, P = 0.0148) (Figure 2E and F). Therefore, the above results confirmed that CaO2 NPs could effectively inhibit tumor growth and increase intra-tumor necrosis, that is, it has a significant effect on reducing tumor burden.
 |
Figure 2 The antitumor effect of CaO2 NPs. (A) Schematic illustration shows the tumor therapeutic process via intra-tumor injection of CaO2 NPs. (B) Tumor growth curves in PBS-injected mice and CaO2 NPs-injected mice (n = 5). (C) Comparing the tumor volumes at day 8 in the two groups. (D) Weight change curves of the mice in the two groups. (E) H&E staining of tumor in the two groups. Scale bar: 100 µm. (F) Quantitatively compare the intra-tumoral necrosis rate in the two groups. *p<0.05; **p<0.01. |
As shown in Figure 3A, the relative levels of CD8+ T lymphocytes in the experimental group was 177.0 ± 10.9 / field, while that in the control group was 38.8 ± 2.7 / field, showing a significant statistical difference between the two groups (t=28.25, P < 0.001). Similar to the results of CD8+ T lymphocytes, the relative levels of tumor CD4+ T lymphocytes in the experimental group was 57.6 ± 4.1 cells/field, and that in the control group was 30.2 ± 3.1 cells/field, showing a significant statistical difference (t=11.42, P=0.0003) (Figure 3B). Also, the experimental group had a higher secretion of IFN-γ (185.1 ± 9.9pg /mL vs 89.5 ± 4.1pg /mL, t=22.12, P < 0.001) and TNF-α (90.6 ± 4.4pg /mL vs 51.0 ± 6.0pg /mL, t=16.29, P < 0.001) than the control group (Figure 3C and D). The above results showed the ability of CaO2 NPs in recruiting immune cells and immune factors, which induce the transformation of immune-suppressive tumors into hot tumors.
 |
Figure 3 The immune response induced by CaO2 NPs. (A) Immunohistochemical staining and its quantitative results of CD8+ T cells in PBS-injected mice and CaO2 NPs-injected mice (n = 5). Scale bar: 50 µm. (B) Immunohistochemical staining and its quantitative results of CD4+ T cells in PBS-injected mice and CaO2 NPs-injected mice. Scale bar: 50 µm. (C and D) The levels of TNF-α and IFN-γ with the tumor in PBS-injected mice and CaO2 NPs-injected mice. (E–H) The levels of TNF-α, IFN-γ, IL-2, and IL-10 in serum in PBS-injected mice and CaO2 NPs-injected mice. **p<0.01; ***p<0.001. |
As shown in Figure 3E–H, compared with the control group, the experimental group had a higher level of IFN-γ (170.9 ± 6.3 pg/mL vs 58.5 ± 7.3 pg/mL, t=24.46, P < 0.001), TNF-α (79.2 ± 5.9 pg/mL vs 38.1 ± 1.7 pg/mL, t=15.51, P=0.0001) and IL-2 (39.8 ± 4.0 pg/mL vs 24.2 ± 3.9 pg/mL, t=5.124, P = 0.0069), and a lower level of IL-10 (28.8 ± 2.7 pg/mL vs 49.4 ± 4.1 pg/mL, t=8.298, P = 0.0012) in the serum. Therefore, the above results confirmed that the CaO2 NPs could increase the secretion of systemic anti-tumor immune factors and decrease the secretion of pro-tumor immune factors, that is, it could effectively regulate the systemic immune response.
The Antitumor Effect of CaO2 NPs Combined with PD-1 Inhibitors
The tumor therapeutic process is shown in Figure 4A. From day 0, the tumor volume of mice was measured every 2 days. As shown in Figure 4B, compared with the other three groups, the proximal tumor volume in the combined group grew the slowest, and the difference was statistically significant. By the end of the experiment, the proximal tumor volume of the control group, the PD-1 inhibitor group, the CaO2 NPs group, and the combined group were 527.7 ± 60.2 mm3, 374.3 ± 28.8 mm3, 285.1 ± 19.5 mm3, and 153.9 ± 6.0 mm3, respectively (Figure 4C). The weight change curve (Figure 4D) showed that the weight of the mice in the four groups did not fluctuate significantly, which indirectly reflected the safety of the combination of CaO2 NPs and PD-1 inhibitors. In addition, the H&E staining results in the four groups showed that the intra-tumor necrosis rates within the proximal tumor in the control group, PD-1 inhibitor group, CaO2 NPs group, and combination group were 10.2 ± 0.7%, 28.4 ± 1.1%, 37.3 ± 2.2%, and 67.5 ± 1.6%, respectively (Figure 4E and F). Compared with the other three groups, the proximal tumor in the combination group presented the largest tumor necrosis rate and the difference was statistically significant. Therefore, the above results confirmed that the CaO2 NPs combined with PD-1 inhibitors could play a synergistic role in proximal tumor inhibition and tumor necrosis, and have a significant effect on reducing proximal tumor burden.
 |
Figure 4 The proximal antitumor effect of CaO2 NPs in combination with PD-1 inhibitors. (A) Schematic illustration shows the tumor therapeutic process via intra-tumor injection of CaO2 NPs and/or intraperitoneal injection of PD-1 inhibitors. (B) Tumor growth curves of proximal tumors in PBS-injected mice, PD-1 inhibitors-injected mice, CaO2 NPs-injected mice, and PD-1 inhibitors combined with CaO2 NPs-injected mice (n = 5). (C) Comparing the tumor volumes of proximal tumors at day 8 in the four groups. (D) Weight change curves of the mice in the two groups. (E) H&E staining of proximal tumors in the four groups. Scale bar: 100 µm. (F) Quantitative comparison of the intra-tumoral necrosis of proximal tumors rates in the four groups. *p<0.05; **p<0.01; ***p<0.001. |
As shown in Figure 5, the levels of CD8+ T lymphocytes, CD4+ T lymphocytes, IFN-γ, and TNF-α within the proximal tumor were greatest in the combination group and the differences were statistically significant. The relative levels of CD8+ T lymphocytes within the proximal tumor in the control group, PD-1 inhibitor group, CaO2 NPs group, and combination group were 39.4 ± 3.6 / field, 123.8 ± 11.3 / field, 182.8 ± 11.3 / field and 260.8 ± 14.7 / field, respectively. And the relative levels of CD4+ T lymphocytes were 31.0 ± 2.6 cells/field, 58.4 ± 4.9 cells/field, 61.0 ± 5.1 cells/field, and 165.2 ± 9.6 cells/field, respectively. Also, the levels of IFN-γ within the proximal tumor in the control group, PD-1 inhibitor group, CaO2 NPs group, and combination group were 86.3 ± 4.1 pg/mL, 126.9 ± 17.5 pg/mL, 188.5 ± 6.4 pg/mL and 244.1 ± 19.0 pg/mL, respectively. The levels of TNF-α within the proximal tumor in the control group, PD-1 inhibitor group, CaO2 NPs group, and combination group were 48.7 ± 2.9 pg/mL, 68.7 ± 4.6 pg/mL, 92.8 ± 5.8 pg/mL and 142.1 ± 13.1 pg/mL, respectively.
 |
Figure 5 The proximal immune response induced by CaO2 NPs in combination with PD-1 inhibitors. (A) Immunohistochemical staining of CD8+ and CD4+ T cells of proximal tumors in PBS-injected mice, PD-1 inhibitors-injected mice, CaO2 NPs-injected mice, and PD-1 inhibitors combined with CaO2 NPs-injected mice (n = 5). Scale bar: 50 µm. (B and C) Immunohistochemical staining results of CD8+ and CD4+ T cells in the four groups. (D and E) The levels of TNF-α and IFN-γ with the tumor in the four groups. **p<0.01; ***p<0.001. |
From day 0, the tumor volume of mice was measured every 2 days. As shown in Figure 6A–C, compared with the other three groups, the distal tumor volume in the combined group grew the slowest, and the difference was statistically significant. By the end of the experiment, the distal tumor volume of the control group, the PD-1 inhibitor group, the CaO2 NPs group, and the combination group were 560.8 ± 54.4 mm3, 395.3 ± 24.1 mm3, 305.1 ± 16.9 mm3, and 175.2 ± 16.4 mm, respectively. The H&E staining results in the four groups showed that the intra-tumor necrosis rates within the distal tumor in the control group, PD-1 inhibitor group, CaO2 NPs group, and combination group were 10.0 ± 0.4, 27.3 ± 1.1%, 35.1 ± 1.4%, and 65.9 ± 0.7%, respectively (Figure 6D and E). Compared with the other three groups, the distal tumor in the combination group presented the largest tumor necrosis rate and the difference was statistically significant. Therefore, the above results confirmed that the CaO2 NPs combined with PD-1 inhibitors could play a synergistic role in distal tumor inhibition and tumor necrosis, and have a significant effect on reducing distal tumor burden.
 |
Figure 6 The distal antitumor effect of CaO2 NPs in combination with PD-1 inhibitors. (A) Tumor growth curves of distal tumors in PBS-injected mice, PD-1 inhibitors-injected mice, CaO2 NPs-injected mice, and PD-1 inhibitors combined with CaO2 NPs-injected mice (n = 5). (B) Comparing the tumor volumes of distal tumors at day 8 in the four groups. (C) The gross tumor specimen of distal tumors in the four groups. (D) H&E staining of distal tumors in the four groups. Scale bar: 50 µm. (E) Quantitative comparison of the intra-tumoral necrosis of distal tumors rates in the four groups. **p<0.01; ***p<0.001. |
As shown in Figure 7, the levels of CD8+ T lymphocytes, CD4+ T lymphocytes, IFN-γ, and TNF-α within the distal tumor were greatest in the combination group and the differences were statistically significant. The relative levels of CD8+ T lymphocytes within the distal tumor in the control group, PD-1 inhibitor group, CaO2 NPs group, and combination group were 38.0 ± 2.9/ field, 119.8 ± 9.7/ field, 177.0 ± 11.7/ field, and 258.4 ± 10.8/ field, respectively. And the relative levels of CD4+ T lymphocytes were 30.4 ± 2.7/ field, 61.0 ± 3.2/ field, 61.6 ± 2.7/ field, and 160.6 ± 9.0/ field, respectively. Also, the levels of INF-γ within the distal tumor in the control group, PD-1 inhibitor group, CaO2 NPs group, and combination group were 89.0 ± 4.0 pg/mL, 129.3 ± 13.3 pg/mL, 173.7 ± 14.2 pg/mL, and 229.0 ± 12.8 pg/mL, respectively. The levels of TNF-α within the distal tumor in the control group, PD-1 inhibitor group, CaO2 NPs group, and combination group were 50.3 ± 3.7 pg/mL, 67.8 ± 5.4 pg/mL, 88.0 ± 4.3 pg/mL, and 123.2 ± 14.1 pg/mL, respectively.
 |
Figure 7 The distal immune response induced by CaO2 NPs in combination with PD-1 inhibitors. (A) Immunohistochemical staining of CD8+ and CD4+ T cells of distal tumors in PBS-injected mice, PD-1 inhibitors-injected mice, CaO2 NPs-injected mice, and PD-1 inhibitors combined with CaO2 NPs-injected mice (n = 5). Scale bar: 50 µm. (B and C) Immunohistochemical staining results of CD8+ and CD4+ T cells in the four groups. (D and E) The levels of TNF-α and IFN-γ with the tumor in the four groups. *p<0.05; **p<0.01; ***p<0.001. |
As shown in Figure 8, the levels of serum TNF-α were 36.7 ± 1.9 pg/mL, 59.6 ± 3.8 pg/mL, 79.3±6.3 pg/mL, and 119.4 ± 10.4 pg/mL, respectively; The levels of serum IFN-γ in the control group, PD-1 inhibitor group, CaO2 NPs group, and combination group were 64.6 ± 4.8 pg/mL, 139.0 ± 5.9 pg/mL, 170.8 ± 7.0 pg/mL and 206.5 ± 8.4 pg/mL, respectively; The levels of serum IL-2 were 23.1 ± 1.7 pg/mL, 27.7 ± 1.3 pg/mL, 37.8 ± 2.1 pg/mL, and 55.2 ± 5.3 pg/mL, respectively; The levels of serum IL-10 were 47.9 ± 6.9 pg/mL, 37.5 ± 2.1 pg/mL, 28.2 ± 3.9 pg/mL, and 18.6 ± 3.39 pg/mL, respectively. Compared with the other three groups, the anti-tumor immune factors INF-γ, TNF-α, and IL-2 were significantly increased in the combination group, while the pro-tumor immune factor IL-10 was significantly decreased.
 |
Figure 8 The systematic immune response induced by CaO2 NPs in combination with PD-1 inhibitors. (A–D) The levels of TNF-α, IFN-γ, IL-2, and IL-10 in serum in PBS-injected mice, PD-1 inhibitors-injected mice, CaO2 NPs-injected mice, and PD-1 inhibitors combined with CaO2 NPs-injected mice (n = 5). *p<0.05; **p<0.01; ***p<0.001. |
The above results confirmed that the CaO2 NPs in combination with PD-1 inhibitors could not only inhibit the proximal tumor but also inhibit the distal tumor, and play an important in promoting systemic immunity.
The Survival Benefit of CaO2 NPs Combined with PD-1 Inhibitors
At the end of the study, all mice in the control group, PD-1 inhibitor group, and CaO2 NPs group died, and 3 mice in the combination group were still alive. The median survival of the control group, PD-1 inhibitor group, CaO2 NPs group, and combination group was 21 days, 23 days, 26 days, and 52 days, respectively. Compared with the other three groups, the survival time of the combination group was the longest, and the difference was statistically significant (P < 0.001) (Figure 9).
 |
Figure 9 The survival benefit of CaO2 NPs in combination with PD-1 inhibitors. (A) Schematic illustration shows the tumor therapeutic process via intra-tumor injection of CaO2 NPs and/or intraperitoneal injection of PD-1 inhibitors. (B) The survival curve of tumor-bearing mice in different groups (n=6). |
Discussion
PD-1 is highly expressed on the surface of activated T lymphocytes and binds to a ligand (PD-L1/2) located on the surface of tumor cells to inhibit the activity of T lymphocytes during the response period, resulting in the immune escape of tumor cells.33 At present, various PD-1 inhibitors on the market are constantly emergent, but only a limited number of patients can benefit from them clinically.11 A large number of studies have shown that the effectiveness of PD-1 inhibitors is related to pre-existing immunity. Hot tumors, ie, the presence of a large number of infiltrating CD8+ T lymphocytes within the tumor, are associated with a good prognosis after treatment with PD-1 inhibitors.14 Therefore, promoting the transformation of treated tumors into hot tumors is an effective strategy to improve the efficacy of PD-1 inhibitors. Hypoxia and high acid are typical features of TME in solid tumors, and both of them play an important role in the formation of immunosuppressive TME, including inhibiting the infiltration of CD8+ T lymphocytes.20,34 Some studies have shown that increasing the oxygen content or neutralizing the acidic microenvironment within the tumor could reverse the immunosuppressive state, increase the infiltration of CD8+ T lymphocytes in the tumor, and realize the transformation of the immunosuppressive tumor into a hot tumor, thus becoming an ideal therapeutic targeted tumor for PD-1 inhibitors.23,35 Therefore, the CaO2 NPs that we synthesized which could target the hypoxic and high-acid environment in the tumor are expected to play a synergistic anti-tumor role with PD-1 inhibitors. In order to reduce the CaO2 reacting with water in vitro, the synthesized CaO2 NPs were stored in ethanol, and the ethanol was removed by vacuum drying before administration. In addition, the PVP is located at the periphery of CaO2, which protects CaO2 from reacting with water to some extent in vitro (when injection), that’s why we chose the CaO2 NPs other than CaO2.
In theory, when CaO2 NPs are injected into the tumor, it would react with water to produce abundant oxygen, hydroxyl ions (OH−), and Ca2+. The improvement of a hypoxic and acidic environment can reverse tumor immunosuppressive microenvironment to some extent. The anti-tumor effect mediated by calcium overload can kill tumor cells and expose tumor-associated antigens, thus playing a role in immune activation.36 To verify whether the synthesized CaO2 NPs can regulate the TME in vivo, we investigated it by using the hypoxic probe, pH-sensitive fluorescent probe, and small animal CT respectively. The results showed that the CaO2 NPs could effectively improve oxygen deficiency, neutralize acidic environment, and realize calcium overload in tumors of tumor-bearing mice after intratumoral injection. The immunohistochemical staining results showed that the CaO2 NPs group presented a larger number of CD8+ T lymphocytes infiltrated within the tumor, and more IFN-γ and TNF-α were secreted within the tumor; In contrast, the control group only had scattered CD8+ T lymphatic infiltration in the tumor, and the secretion of IFN-γ and TNF-α were less in the tumor. The above results showed that the immunity type of tumor in Hepa1-6 tumor-bearing mice was immunosuppressive (which is the same as the immunity type in most advanced liver cancer),8,16 and the CaO2 NPs could realize the transformation of immunosuppressive tumor into hot tumor. In terms of tumor inhibition, compared with the control group, the CaO2 NPs group significantly delayed the growth of tumor volume, significantly increased tumor necrosis rate, and significantly reduced the tumor burden. It has been reported that the effectiveness of PD-1 inhibitors is positively correlated with the number of CD8+ T lymphocytes/tumor load.12 Therefore, in this study, CaO2 NPs, which can increase the infiltration of CD8+ T lymphocytes within the tumor and effectively reduce the tumor burden, are bound to play a synergistic anti-tumor immunotherapy role with PD-1 inhibitors. In addition, the serum levels of anti-tumor immune factors in CaO2 NPs groups, including TNF-α, IFN-γ, and IL-2, were significantly increased, while the level of pro-tumor immune factor, IL-10, was significantly decreased, suggesting that the CaO2 NPs could enhance the systemic anti-tumor immune response.
In order to verify the synergistic anti-tumor efficacy of CaO2 NPs and PD-1 inhibitors and whether the combination of the two can enhance systemic anti-tumor immunity, we established a bilateral tumor-bearing model in mice. The results showed that: For the proximal tumors (treated side), compared with the other three groups, the combined group presented the slowest tumor growth, the most intra-tumoral necrosis, the most intra-tumoral immune cell infiltration (CD4+ and CD8+ T lymphocytes), and the most intratumoral anti-tumor immune factors (IFN-γ and TNF-α) secretion, which confirmed our previous hypothesis. That is, the CaO2 NPs can play a synergistic anti-tumor role with PD-1 inhibitors. For the distal tumor (untreated side), compared with the other three groups, the combined group showed the slowest tumor growth, the most intra-tumoral immune cell invasion (CD4+ and CD8+ T lymphocytes), and the most intratumoral anti-tumor immune factors (IFN-γ and TNF-α) secretion. In addition, the secreted serum anti-tumor immune factors (TNF-α, IFN-γ, and IL-2) were the most, and the pro-tumor immune factors (IL-10) were the least. The results of the distal tumor and the changes of immune factors in serum indicated that the CaO2 NPs can synergistically work with PD-1 inhibitors to enhance the systemic anti-tumor immune response.
In the above studies, we have confirmed that the CaO2 NPs can play a synergistic anti-tumor role with PD-1 inhibitors, but the impact of this combination on long-term survival still needs to be further studied. Therefore, we established a unilateral tumor model and randomly divided the tumor-bearing mice into the control group, PD-1 inhibitor group, CaO2 NPs group, and a combined group (PD-1 inhibitor+ CaO2 NPs). The results showed that the combined group presented a significantly extended survival time compared to the other three groups. Therefore, the combination of CaO2 NPs and PD-1 inhibitors is also beneficial for improving long-term survival.
Conclusion
In the present study, we explored the efficacy of CaO2 NPs combined with PD-1 inhibitors in the treatment of liver cancer and confirmed that the CaO2 NPs can effectively improve the adverse TME (hypoxia and acidity) and induce calcium overload in tumors (exposure to tumor antigens), realize the transformation of immune-suppressive tumors into hot tumors, and enhance the anti-liver cancer efficacy of PD-1 inhibitors. The synthesis of CaO2 NPs is simple and economic, and the antitumor effect of this combination is great, suggesting that it has a broad clinical application prospect. (Scheme 1).
 |
Scheme 1 The mechanism of antitumor responses induced by CaO2 NPS in combination with PD-1 inhibitors. After injection into the tumor, CaO2 NPs would react with water to produce abundant oxygen, hydroxyl ions (OH−), and Ca2+, thus alleviating tumor hypoxia, neutralizing the acidic environment, and inducing intra-tumoral calcium overload, realizing the transformation of immune-suppressive tumors into hot tumors, and enhance the anti-tumor efficacy of PD-1 inhibitors. |
Data Sharing Statement
The data that support the findings of this study are available from the corresponding author on reasonable request.
Ethics Approval and Consent to Participate
All procedures were in accordance with the National Institutes of Health Guide for the Care and Use of Laboratory Animals and were approved by the Ethics Committee of Tongji Medical College, Huazhong University of Science and Technology.
Funding
This work was supported by the National Natural Science Foundation of China (No. 82102168).
Disclosure
All other authors declare no competing interests.
References
1. Sung H, Ferlay J, Siegel RL, et al. Global cancer statistics 2020: GLOBOCAN estimates of incidence and mortality worldwide for 36 cancers in 185 countries. CA Cancer J Clinicians. 2021;71(3):209–249. doi:10.3322/caac.21660
2. Yu SJ. A concise review of updated guidelines regarding the management of hepatocellular carcinoma around the world: 2010–2016. Clin Mol Hepatol. 2016;22(1):7–17. doi:10.3350/cmh.2016.22.1.7
3. Park JW, Chen M, Colombo M, et al. Global patterns of hepatocellular carcinoma management from diagnosis to death: the BRIDGE Study. Liver Int. 2015;35(9):2155–2166. doi:10.1111/liv.12818
4. Xie DY, Ren ZG, Zhou J, et al. 2019 Chinese clinical guidelines for the management of hepatocellular carcinoma: updates and insights. Hepatobiliary Surg Nutr. 2020;9(4):452–463. doi:10.21037/hbsn-20-480
5. Vogel A, Cervantes A, Chau I, et al. Hepatocellular carcinoma: ESMO clinical practice guidelines for diagnosis, treatment and follow-up. Ann Oncol. 2018;29:v238–v255. doi:10.1093/annonc/mdy308
6. Lim H, Ramjeesingh R, Liu D, et al. Optimizing survival and the changing landscape of targeted therapy for intermediate and advanced hepatocellular carcinoma: a systematic review. JNCI. 2021;113(2):123–136. doi:10.1093/jnci/djaa119
7. Sonbol MB, Riaz IB, Naqvi SAA, et al. Systemic therapy and sequencing options in advanced hepatocellular carcinoma. JAMA Oncol. 2020;6(12):e204930. doi:10.1001/jamaoncol.2020.4930
8. Sperandio RC, Pestana RC, Miyamura BV, et al. Hepatocellular carcinoma immunotherapy. Ann Rev Med. 2022;73(1):267–278. doi:10.1146/annurev-med-042220-021121
9. van Doorn DJ, Takkenberg RB, Klümpen H. Immune checkpoint inhibitors in hepatocellular carcinoma: an overview. Pharmaceuticals. 2021;14(1):3. doi:10.3390/ph14010003
10. Park Y, Kuen D, Chung Y. Future prospects of immune checkpoint blockade in cancer: from response prediction to overcoming resistance. Exp Mol Med. 2018;50(8):1–13.
11. Weinmann A, Galle PR. Role of immunotherapy in the management of hepatocellular carcinoma: current standards and future directions. Current Oncol. 2020;27(S3):152–164. doi:10.3747/co.27.7315
12. Huang AC, Postow MA, Orlowski RJ, et al. T-cell invigoration to tumour burden ratio associated with anti-PD-1 response. Nature. 2017;545(7652):60–65. doi:10.1038/nature22079
13. Pagès F, Mlecnik B, Marliot F, et al. International validation of the consensus Immunoscore for the classification of colon cancer: a prognostic and accuracy study. Lancet. 2018;391(10135):2128–2139. doi:10.1016/S0140-6736(18)30789-X
14. Galon J, Bruni D. Approaches to treat immune hot, altered and cold tumours with combination immunotherapies. Nat Rev Drug Discov. 2019;18(3):197–218. doi:10.1038/s41573-018-0007-y
15. Demaria S, Coleman CN, Formenti SC. Radiotherapy: changing the game in immunotherapy. Trends Cancer. 2016;2(6):286–294. doi:10.1016/j.trecan.2016.05.002
16. Kalasekar SM, Garrido Laguna I, Evason KJ. Immune checkpoint inhibitors in combinations for hepatocellular carcinoma. Hepatology. 2021;73(6):2591–2593. doi:10.1002/hep.31706
17. Joyce JA. Therapeutic targeting of the tumor microenvironment. Cancer Cell. 2005;7(6):513–520. doi:10.1016/j.ccr.2005.05.024
18. Jin M, Jin W. The updated landscape of tumor microenvironment and drug repurposing. Sig Transd Target Ther. 2020;5(1):166. doi:10.1038/s41392-020-00280-x
19. Wang JX, Choi SYC, Niu X, et al. Lactic acid and an acidic tumor microenvironment suppress anticancer immunity. Int J Mol Sci. 2020;21(21):8363. doi:10.3390/ijms21218363
20. Heintzman DR, Fisher EL, Rathmell JC. Microenvironmental influences on T cell immunity in cancer and inflammation. Cell Mol Immunol. 2022;19(3):316–326. doi:10.1038/s41423-021-00833-2
21. Vito A, El-Sayes N, Mossman K. Hypoxia-driven immune escape in the tumor microenvironment. Cells. 2020;9(4):992. doi:10.3390/cells9040992
22. Damgaci S, Ibrahim-Hashim A, Enriquez-Navas PM, et al. Hypoxia and acidosis: immune suppressors and therapeutic targets. Immunology. 2018;154(3):354–362. doi:10.1111/imm.12917
23. Hatfield SM, Kjaergaard J, Lukashev D, et al. Immunological mechanisms of the antitumor effects of supplemental oxygenation. Sci Trans Med. 2015;7(277). doi:10.1126/scitranslmed.aaa1260
24. Zhang Y, Zhao Y, Shen J, et al. Nanoenabled modulation of acidic tumor microenvironment reverses anergy of infiltrating T cells and potentiates Anti-PD-1 therapy. Nano Lett. 2019;19(5):2774–2783. doi:10.1021/acs.nanolett.8b04296
25. He J, Fu L, Qi C, et al. Metal peroxides for cancer treatment. Bioact Mater. 2021;6(9):2698–2710. doi:10.1016/j.bioactmat.2021.01.026
26. Tang Z, Liu Y, He M, et al. Chemodynamic therapy: tumour microenvironment-mediated Fenton and Fenton-like reactions. Angew Chem Int Ed Engl. 2019;58(4):946–956. doi:10.1002/anie.201805664
27. Kong H, Chu Q, Fang C, et al. Cu–ferrocene‐functionalized CaO2Cu–ferrocene-functionalized CaO 2 nanoparticles to enable tumor‐specific synergistic therapy with GSH depletion and calcium overload. Adv Sci. 2021;8(14):e2100241. doi:10.1002/advs.202100241
28. Wang X, Li C, Jin H, et al. Mutual promotion of oxidative stress amplification and calcium overload by degradable spatially selective self-cascade catalyst for synergistic tumor therapy. Chem Eng J. 2022;432:134438. doi:10.1016/j.cej.2021.134438
29. Wang Y, He X, Zhou C, et al. Nanoscale CaO2 materials for synergistic transarterial chemoembolization in a VX2 orthotopic rabbit liver cancer model. Acta Biomater. 2022;154:536–548. doi:10.1016/j.actbio.2022.09.074
30. Huang S, Li T, Chen Y, et al. Microwave ablation combined with anti-PD-1 therapy enhances systemic antitumor immunity in a multitumor murine model of Hepa1-6. Int J Hyperthermia. 2022;39(1):278–286. doi:10.1080/02656736.2022.2032406
31. Li L, Liu Y, Li H, et al. Rational design of temperature-sensitive blood-vessel-embolic nanogels for improving hypoxic tumor microenvironment after transcatheter arterial embolization. Theranostics. 2018;8(22):6291–6306. doi:10.7150/thno.28845
32. Bao X, Shen N, Lou Y, et al. Enhanced anti-PD-1 therapy in hepatocellular carcinoma by tumor vascular disruption and normalization dependent on combretastatin A4 nanoparticles and DC101. Theranostics. 2021;11(12):5955–5969. doi:10.7150/thno.58164
33. Han Y, Liu D, Li L. PD-1/PD-L1 pathway: current researches in cancer. Am J Cancer Res. 2020;10(3):727–742.
34. Singleton DC, Macann A, Wilson WR. Therapeutic targeting of the hypoxic tumour microenvironment. Nat Rev Clin Oncol. 2021;18(12):751–772. doi:10.1038/s41571-021-00539-4
35. Gong F, Xu J, Liu B, et al. Nanoscale CaH2 materials for synergistic hydrogen-immune cancer therapy. Chem. 2022;8(1):268–286. doi:10.1016/j.chempr.2021.11.020
36. Zhang M, Song R, Liu Y, et al. Calcium-overload-mediated tumor therapy by calcium peroxide nanoparticles. Chem. 2019;5(8):2171–2182. doi:10.1016/j.chempr.2019.06.003
 © 2024 The Author(s). This work is published and licensed by Dove Medical Press Limited. The full terms of this license are available at https://www.dovepress.com/terms.php and incorporate the Creative Commons Attribution - Non Commercial (unported, v3.0) License.
By accessing the work you hereby accept the Terms. Non-commercial uses of the work are permitted without any further permission from Dove Medical Press Limited, provided the work is properly attributed. For permission for commercial use of this work, please see paragraphs 4.2 and 5 of our Terms.
© 2024 The Author(s). This work is published and licensed by Dove Medical Press Limited. The full terms of this license are available at https://www.dovepress.com/terms.php and incorporate the Creative Commons Attribution - Non Commercial (unported, v3.0) License.
By accessing the work you hereby accept the Terms. Non-commercial uses of the work are permitted without any further permission from Dove Medical Press Limited, provided the work is properly attributed. For permission for commercial use of this work, please see paragraphs 4.2 and 5 of our Terms.