Back to Journals » Journal of Inflammation Research » Volume 18
Syndrome Differentiation and Treatment of Psoriasis by Traditional Chinese Medicines: An Integrating Study of Multi-Omics Analysis and Experimental Validation
Authors Li C ![]() , Chen K
, Chen K ![]() , Qiao Y, Wu P, Chen C
, Qiao Y, Wu P, Chen C ![]() , Zhou L, Yang Y
, Zhou L, Yang Y ![]() , Zhang J
, Zhang J ![]() , Liu N
, Liu N ![]() , Shen C, Zhang G, Wang D, Gu J
, Shen C, Zhang G, Wang D, Gu J
Received 16 July 2025
Accepted for publication 6 November 2025
Published 26 November 2025 Volume 2025:18 Pages 16449—16472
DOI https://doi.org/10.2147/JIR.S554324
Checked for plagiarism Yes
Review by Single anonymous peer review
Peer reviewer comments 4
Editor who approved publication: Dr Anish R. Maskey
Canzhe Li,1,* Kaihao Chen,2,* Yuanyuan Qiao,1 Peilin Wu,1 Chupeng Chen,1 Lvzhou Zhou,3 Yibing Yang,1 Jin Zhang,1 Na Liu,1 Chuanjun Shen,1 Guangxian Zhang,1 Dongmei Wang,2 Jiangyong Gu1
1Research Centre of Basic Integrative Medicine, School of Basic Medical Sciences, Guangzhou University of Chinese Medicine, Guangzhou, Guangdong, 510006, People’s Republic of China; 2Dermatology Hospital, Southern Medical University, Guangzhou, Guangdong, 510091, People’s Republic of China; 3The Second Clinical Medical College of Guangzhou University of Chinese Medicine, the Second Affiliated Hospital of Guangzhou University of Chinese Medicine, Guangzhou, Guangdong, 510006, People’s Republic of China
*These authors contributed equally to this work
Correspondence: Dongmei Wang, Dermatology Hospital, Southern Medical University, Guangzhou, Guangdong, People’s Republic of China, Email [email protected] Jiangyong Gu, Research Centre of Basic Integrative Medicine, School of Basic Medical Sciences, Guangzhou University of Chinese Medicine, Guangzhou, Guangdong, People’s Republic of China, Email [email protected]
Purpose: The molecular basis underlying the clinical differentiation in treating psoriasis with syndromes of blood-heat or blood-stasis in traditional Chinese medicine remains unclear. This study employs an integrated multi-omics approach to explore the similarities and differences in the pathogenic mechanisms of these two syndromes, and to elucidate the molecular foundations of Compound Qingdai Capsule and Yinxiekang Pian, which are representative formulas for syndrome-specific treatment, thereby providing insights into the scientific connotation of syndrome differentiation and treatment.
Methods: Multi-omics data were integrated with machine learning to identify genes differentiating the two syndromes of psoriasis. The therapeutic mechanisms were explored through network pharmacology and molecular docking. Finally, in vivo experiments involved constructing composite psoriasis models in SD rats by combining traditional Chinese medicine syndromes with imiquimod induction, and analyzing skin lesion tissues via qPCR and ELISA.
Results: After constructing the psoriasis pathway network and successfully establishing rat models, the research identified the characteristic genes of blood-heat syndrome psoriasis as GSK3B, MTOR and CDK4, and those of blood-stasis syndrome psoriasis as AKT1, TNF and STAT3. STAT1 was found to be a common characteristic gene of both syndromes, while LTBP1, PROS1, and ALDH16A1 were the differential genes for distinguishing the two syndromes. Finally, Compound Qingdai Capsule and Yinxiekang Pian were shown to reduce the mRNA and protein expressions of GSK3B, AKT1 and STAT1 to varying degrees.
Conclusion: GSK3B and AKT1 are differentially expressed in blood-heat syndrome and blood-stasis syndrome psoriasis respectively, while STAT1 is a common inflammatory mediator for both. Compound Qingdai Capsule and Yinxiekang Pian respectively provide a theoretical basis for traditional Chinese medicine syndrome differentiation and treatment of psoriasis by intervening in the same or different inflammatory targets and signaling pathways.
Keywords: blood-heat syndrome, blood-stasis syndrome, multi-omics analysis, psoriasis, syndrome differentiation and treatment
Introduction
Psoriasis is an immune-mediated chronic inflammatory skin disease that affects more than 60 million people worldwide, presenting with different clinical phenotypes, but the most frequent of which is psoriasis vulgaris (PV).1 Inflammation in psoriasis is not limited to psoriatic skin and has been shown to affect different organ systems. It can be comorbid with various diseases, including diabetes,2 cardiovascular diseases,3 and metabolic syndrome.4 Thus, it has been postulated that psoriasis is a systemic entity rather than a solely dermatological disease.5
Clinically, PV is characterized by epidermal hyperplasia and sustained inflammation.6 Although the pathogenesis of psoriasis is complex and not fully elucidated, it is thought to result from a combination of immunologic, genetic, and environmental factors. Upregulation and activation of immune pathways play a crucial role in the immunologic mechanisms underlying psoriasis. The IL-23 and T helper 17 cells (Th17) mediated activation of IL-17 is recognized as the dominant pathway.7 With the development and application of biologics targeting specific molecules in the pathogenesis of psoriasis, the therapeutic effect has made great progress. However, problems such as adverse reactions and recurrence of disease after treatment need to be solved.8
Traditional Chinese medicine (TCM) has definite therapeutic effect in clinic because of its personalized treatment strategies.9 These personalized approaches are rooted in the core principle of “syndrome differentiation and treatment”, which dictates that therapeutic strategies should be adjusted according to the specific TCM syndrome presented by individual patients. The syndrome in TCM is a comprehensive pattern of physical signs and symptoms, which reflects the potential imbalance of the entire body rather than merely focusing on localized skin lesions. According to the current Guideline for the diagnosis and treatment of psoriasis in China (2023 edition), the clinical staging of PV is mainly divided into progressive, quiescent, and degenerative stages based on the development process of the lesion. The clinical syndrome types are divided into blood-heat syndrome (BHS), blood-stasis syndrome (BSS), and blood-dryness syndrome based on the main symptoms, concurrent symptoms, and tongue and pulse signs. Specifically, BHS typically occurs in the progressive stage, characterized by new bright red papules with abundant, easily detachable silvery scales, accompanied by pruritus, dry mouth, irritability, constipation, a red tongue, and yellow urine. BSS usually presents in the quiescent stage, with dark red or purple, thickened plaques and thick scales, along with a purple or dark red tongue with ecchymosis or petechiae. Although the progressive stage of PV is often analogous to BHS in TCM, and the quiescent stage to the BSS in TCM, it is important to note that TCM syndrome differentiation is a holistic diagnostic system, not merely a parallel to clinical staging.10 Different syndrome types of psoriasis have different symptoms and require targeted treatment plans.
Compound Qingdai Capsule (CQC), a formulation derived from traditional local prescriptions in Shaanxi and subsequently improved, has the effects of clearing heat, detoxifying, dispelling wind, and relieving itching, making it suitable for treating progressive psoriasis. As a marketed drug, it has been used in clinic for more than 30 years. Studies have shown that CQC can reduce the levels of psoriasis-related inflammatory factors such as IL-2, IL-8, IL-18, and IFN-γ.11 PSORI-CM01 was developed based on an inter-hospital preparation, Yinxiekang Pian, which was originally formulated by Xuan Guowei, a nationally famous dermatologist in Guangdong Provincial Hospital of Traditional Chinese Medicine.12 PSORI-CM01 has the effect of promoting blood circulation and removing blood stasis, which is clinically suitable for the treatment of patients with psoriasis in the quiescent stage. It was found that PSORI-CM01 can inhibit the phosphorylation of PI3K/Akt/mTOR pathway,13 and significantly inhibit the expression of cytokines such as IL-6 and IL-12 at both mRNA and protein levels.14 However, the molecular mechanisms of the two TCM formulas in treating psoriasis with BHS and BSS remain unclear.
Our study is distinct from previous research, which has often focused on the general efficacy of single formulas. Instead, we conduct a comparative analysis of two syndrome-specific formulas, CQC and PSORI-CM01, aiming to directly link the characteristic molecular features and underlying mechanisms to the TCM principle of syndrome differentiation and treatment in psoriasis.
Research has shown that integrating multi-dimensional genomic information into tissue-specific network models can improve our understanding of human diseases.15 With the help of bioinformatics, the multi-omics analysis approach will hasten the discovery of the role of TCM in the treatment of complex disease.16 Machine learning (ML), as a branch of artificial intelligence, can recognize a large amount of potential and useful information from complex data through various algorithms.17 Many researchers have applied classification algorithms in ML to disease subtype identification, biomarker discovery, and pathway analysis.18 The combination of multi-omics data analysis and ML classification algorithm provides a new research idea and method for exploring the pathogenesis of psoriasis.
Therefore, this study aims to clarify the mechanism of action of two formulas, CQC for BHS psoriasis and PSORI-CM01 for BSS psoriasis, by systematically analyzing the molecular basis of TCM syndrome differentiation and treatment of psoriasis. To achieve this goal, a comprehensive approach integrating multi-omics and machine learning was employed to identify the distinct and shared genes and pathogenic pathways underlying the two syndromes. This analysis was followed by the construction of a syndrome-based psoriasis pathway network and the prediction of core therapeutic targets through network pharmacology and molecular docking. Crucially, these computational predictions have been experimentally verified in the rat models of psoriasis based on syndromes.
Materials and Methods
Multi-Omics Study
Data Download and Processing
Gene expression profile and DNA methylation expression profile of psoriasis patients with different syndromes were obtained from the datasets GSE19286719 and GSE183608.20 All data were accessed on 2023–02-21 via the GEO database (https://www.ncbi.nlm.nih.gov/geo/). In detail, the GSE192867 dataset was based on the platform GPL23126 (Affymetrix Human Clariom D microarray (transcript/gene version)) and included 10 healthy control samples, 16 BHS psoriasis samples and 23 BSS psoriasis samples. To eliminate systematic biases, the data were normalized with the normalizeBetweenArrays function. Subsequently, principal component analysis (PCA) was employed for quality control and outlier identification. The GSE183608 dataset was generated by the platform GPL23976 (Illumina Infinium HumanMethylation850 BeadChip) and contained 6 healthy controls, 13 BHS psoriasis samples and 13 BSS psoriasis samples. Similarly, normalization was applied using the champ.norm function, and PCA was used to detect any outlier samples. The microRNA expression data21 and serum metabolic profile data22 of psoriasis with different TCM syndromes were obtained from the original literature. The data from above four omics studies were analyzed using the R-project (version 4.3.1).
Differential Expression And functional Enrichment Analysis
Differential expression analysis of the GSE192867 dataset was performed in R using the “limma” package (version 3.56.2). In the comparison between two groups of psoriasis and healthy group, we selected the differentially expressed genes (DEGs) by applying selection thresholds of “P-value < 0.05 and | Log2FC | > 3”. Between the psoriasis groups, we used “P-value < 0.05 and | Log2FC | >1” as the criteria to filter DEGs. The original data of GSE183608 was preprocessed using the “minfi” package (version 1.46.0), and subsequently, the “ChAMP” package (version 2.30.0) was used to screen for differences in methylation sites and methylation regions between the different groups.23 To assess the differential methylation probes (CpGs) between groups, we used the screening criteria of “P-value < 0.05 and | deltaBeta | > 0.14”. We analyzed the miRNA expression of BHS and BSS psoriasis compared to the healthy control group under the condition of “P-value < 0.05 and | Log2FC | > 2” based on the original literature, and correlated the differentially expressed miRNAs and genes using miRWalk database (http://mirwalk.umm.uni-heidelberg.de/). For the serum metabolic characteristics of patients with different TCM syndromes of psoriasis, we further analyzed the data from original materials of the article using the MetaboAnalyst 6.024 (https://www.metaboanalyst.ca/), with “P-value < 0.05 and | Log2FC | > 1” as the standard. R packages “clusterProfiler” (version 4.8.3) and “org.Hs.eg.db” (version 3.17.0) were used to perform enrichment analysis of Kyoto Encyclopedia of Genes and Genomes (KEGG) terms. The calculated results adopted the P-value after Bonferroni correction less than 0.05 as the threshold value, and the “ggplot2” package (version 3.4.3) was used for image plotting.25
Protein-Protein Interaction (PPI) Data Selection and Psoriasis Network Pathway Mapping
The DEGs from each omics analysis were entered into the STRING database (https://cn.string-db.org/) as confirmed targets, with “Homo Sapiens” specified as species, to acquire PPI data. Cytoscape (version 3.9.1) was employed for construction of PPI networks and data analysis. Finally, we integrated the results of multi-omics analysis and KEGG database to map the pathogenic network pathway of psoriasis based on TCM syndrome types.
Characteristic Biomarkers Identification by ML Classification Algorithm and Validation
The expression matrices of the genes and methylated genes of the candidate targets for BHS and BSS psoriasis were extracted respectively from the GSE192867 and GSE183608 datasets. Support Vector Machine (SVM), Least Absolute Shrinkage and Selection Operator (Lasso) and Random Forest (RF) classification algorithms were used to evaluate and cross-validate the variables selected by the model.26–28 Among them, Lasso Regression algorithm extends the concept of linear regression by incorporating a regularization term into the standard regression equation, uses cross-validation to determine the optimal lambda (regularization parameter) values to improve the accuracy of prediction. SVM is particularly suitable for classification tasks because it focuses on finding the maximum-margin hyperplane in different categories of target features. RF is an ensemble learning model based on the aggregation of multiple decision trees to form a strong classifier. In R, we used the “glmnet”, “caret”, and “randomForest” packages to identify the feature genes for the above three models.29–31 The optimal parameter selection for each model is shown in Table 1. Finally, the area under the curve (AUC) value in receiver operating characteristic curve (ROC) analysis was used to evaluate the accuracy of the feature genes screened by the models.
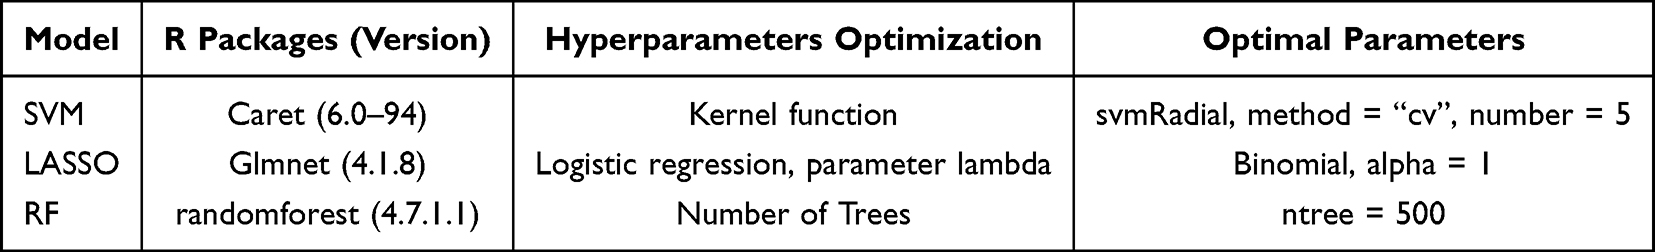 |
Table 1 Hyperparameters Optimization for ML and Parameters Selection |
Identification of the Chemical Constitution of CQC and PSORI-CM01
The main chemical components of CQC were identified using the UltiMate 3000 Ultra-high performance liquid chromatography (UPLC) system, with chemical composition compared using Compound Discoverer software (V 3.2, Thermo Fisher Scientific). After eliminating the intermediate compounds, the chemical components with peak area percentages greater than 0.1% were selected as the main ingredients of CQC.32
The previous research employing Ultra-high liquid chromatography coupled with linear trap quadrupole and high-resolution mass analyzer-orbitrap (UHPLC-LTQ/Orbitrap) was developed for the analysis of chemical constituents of PSORI-CM01, and a total of 108 compounds were identified.33 Our research group identified the chemical fingerprints of the main components in PSORI-CM01 by UPLC, and screened the potentially active components by MTT assay.34
Network Pharmacology Research
The 29 main components of CQC (Supplementary Table S1) and the 26 main active components of PSORI-CM01 (Supplementary Table S2) were summarized and imported into the SwissTargetPrediction database (http://www.swisstargetprediction.ch/) to identify the corresponding target proteins. The screening criterion used was “probability > 0.1”. The UniProt database (https://www.uniprot.org/) was used to query the gene names corresponding to the target proteins. Psoriasis-related targets were collected from the DISGENET databases (https://disgenet.com/) using the keyword “psoriasis”. To identify therapeutic targets for CQC and PSORI-CM01 in the treatment of psoriasis, the overlapping targets of the main components of CQC and PSORI-CM01 with psoriasis-related targets were analyzed using the “venn” package (version 1.11) in R. The intersection genes were enriched in KEGG pathways using the DAVID database (https://davidbioinformatics.nih.gov/).
Molecular Docking
Based on the analysis of network pharmacology studies, a total of eight core targets of the psoriasis pathway network affected by CQC and PSORI-CM01 were imported into the RCSB PDB database (https://www.rcsb.org/), and the 3D structure PDB files of the target proteins were downloaded. The main components of CQC and PSORI-CM01 were entered into the PubChem database (https://pubchem.ncbi.nlm.nih.gov/) to download the SDF files of the chemical structures. These SDF files were converted to mol2 files using OpenBabel35 (version 3.1.1, https://openbabel.org/), and the water molecules and ligands on the target protein receptors were removed using PyMOL (version 2.6). AutoDock software (version 4.2.6) was used to optimize small molecules and calculate binding energies between molecular ligands and target protein receptors. The molecular docking results were visualized using PyMOL. In order to screen active ingredient targets, a binding energy threshold of ≤ −7.0 kcal·mol−1 was used as the standard for bioinformatics analysis and prediction reliability evaluation.36
Animal Experiment
Reagents and Instruments
The following instruments were used: small animal anesthesia machine (Shenzhen Reward Biotechnology Co., Ltd., R500), premium digital thermometer with flexible tip (K-jump Health Co., Ltd., Cat. No. 291128), automatic blood analyzer (Sysmex Co., Ltd., XN-1000), automatic hemorheometer (Shenzhen Mindray Bio-Medical Electronics Co., Ltd., LBY-N7500B), automatic dehydrator (DIAPATH, Donatello), tissue embedding machine (Wuhan Junjie Electronics Co., Ltd., JB-P5), otary wheel slicer (Leica, RM2016), digital tissue section scanner (3DHISTECH, Pannoramic MIDI/250FLASH/DESK), digital slice browsing software (3DHISTECH, CaseViewer2.4), fluorescent quantitative PCR instrument (Thermo Fisher Scientific Inc., Applied Biosystems QuantStudio5), and multimode microplate reader (Agilent, Synergy Neo2).
The following reagents were used: imiquimod cream (Sichuan Med-Shine Pharmaceutical Co., Ltd., H20030129), white vaselin (Qingdao Jinqi Biotechnology Co., Ltd., 6,971,769,050,077), 0.9% sodium chloride injection (Sichuan Kelun Baijian-an technology Co., Ltd., Veterinary Drug 221531460), pure hair removal cream (Reckitt Benckiser (China) Co., Ltd., G20161330), isoflurane (Shenzhen Reward Biotechnology Co., Ltd., R510), general tissue fixative (Servicebio, G1101), Hematoxylin-Eosin/HE Staining Kit (Servicebio, G1076), neutral balsam (Sinopharm Chemical Reagent Co.,Ltd., 10,004,160), total RNA Extraction Kit (Beijing Solarbio Science & Technology Co., Ltd., R1200), Evo M-MLV RT Mix Kit with gDNA Clean for qPCR (Accurate Biotechnology (Hunan) Co., Ltd., AG11728), SYBR Green Premix Pro Taq HS qPCR Kit (Accurate Biotechnology (Hunan) Co., Ltd, AG11701), phosphate buffered saline (Servicebio, G4202), enhanced BCA Protein Assay Kit (Beyotime, P0010S), rat glycogen synthase kinase 3β (GSK3B) ELISA Kit (Bioswamp, RA20968), rat Protein B Alpha (PKBα) ELISA Kit (Bioswamp, RA20830),and rat Signal Transducer And Activator Of Transcription 1 (STAT1) ELISA Kit (Bioswamp, RA20591).
Preparation of CQC and PSORI-CM01
In this study, we used CQC, which contains fourteen kinds of herbs, namely Qing Dai (Baphicacanthus cusia (Nees) Bremek)., Bai Zhi (Angelica dahurica (Hoffm). Benth. and Hook.f. ex Franch. and Sav)., Ma Chi Xian (Portulaca oleracea L)., Tu Fu Ling (Smilax glabra Roxb)., Zi Cao (Arnebia euchroma (Royle ex Benth). I.M.Johnst)., Guan Zhong (Cyrtomium fortunei J.Sm)., Pu Gong Ying (Taraxacum mongolicum Hand.-Mazz)., Dan Shen (Salvia miltiorrhiza Bunge), Fen Bi Xie (Dioscorea hypoglauca Palib)., Bai Xian Pi (Dictamnus dasycarpus Turcz)., Wu Mei (Prunus mume (Siebold) Siebold & Zucc)., Wu Wei Zi (Schisandra chinensis (Turcz). Baill)., Shan Zha (Crataegus pinnatifida Bunge), and Jian Qu (Massa Medicata Fermentata). It was obtained from Shanxi Pharmaceutical Holdings Tianning Pharmaceutical Co., Ltd. with the national medicine permission number Z20010157. For in vivo experiments, the concentration of CQC suspension was 0.054 g/mL based on a daily dose of 6 g for an adult weighing 70 kg. Each rat in the CQC group was treated with a daily dose of 1 mL/100 g per day for 7 consecutive days.
We also used PSORI-CM01, which was provided and authenticated by Guangdong Provincial Hospital of Traditional Chinese Medicine (Yinxiekang Pian, [ZCGD] Z20080123) contains ten kinds of herbs, including Di Huang (Rehmannia glutinosa (Gaertn). Libosch. ex DC)., Dang Gui (Angelica sinensis (Oliv). Diels), Chuan Xiong (Ligusticum chuanxiong Hort.), E Zhu (Curcuma phaeocaulis Valeton), Tu Fu Ling (Smilax glabra Roxb)., Chi Shao (Paeonia lactiflora Pall)., Wu Mei (Prunus mume (Siebold) Siebold & Zucc)., Zhong Jie Feng (Sarcandra glabra (Thunb). Nakai), Zi Cao (Arnebia euchroma (Royle ex Benth). I.M.Johnst)., and Gan Cao (Glycyrrhiza uralensis Fisch. ex DC). For in vivo experiments, the concentration of PSORI-CM01 was 0.0675 g/mL which was administered to rats via daily gavage for 7 days, based on a daily dose of 7.5 g for an adult.
Preparation of BHS and BSS Psoriasis Model Rats
Animal studies were conducted in accordance with the guidelines approved by the Ethical Committee of Guangzhou University of Chinese Medicine (Registration number: 20240326003; Approval date: March 27, 2024). The prior sample size was calculated according to the ARRIVE 2.0 guideline. The parameters were set to 10 groups, the effect size f was 0.25, the significance level was 0.05, the statistical power was 0.8, the total sample size was 60, and each group consisted of 6 rats, which also adhered to the 3Rs principle. A total of 66 SPF-grade male SD rats (aged 4–5 weeks, weighing 120 g to 150 g) were purchased from the Laboratory Animal Center of Southern Medical University (Guangzhou, China), with license number SCXK(Yue)2021–0041 and animal quality certificate number 44002100038032. The rats were housed in the barrier environment of Animal Experiment Center, Guangzhou University of Chinese Medicine, under license number SYXK(Yue)2023–0342. They were kept under controlled conditions (24–26 °C, 40–60% humidity, 12-hour light-dark cycle) and had free access to food and water.
Our research group has successfully constructed rat models of psoriasis with BHS and BSS, and summarized the model evaluation methods. The model of BHS psoriasis was induced by compound heat potion decoction (Ganjiang Rougui Decoction, GJRGD) combined with imiquimod (IMQ). Psoriasis with BSS was modeled by multi-factor stimulation (hunger, cold and dampness) combined with IMQ induction.37–41 The experiment was divided into the modeling stage and the treatment stage. After one week of adaptive feeding, the rats entered the modeling stage. They were randomly divided into four groups, 12 rats in each blood heat control (BHC) group and blood stasis control (BSC) group, and 21 rats in each blood heat model (BHM) group and blood stasis model (BSM) group.
The rats in the BHC group received daily oral gavage of 0.9% sodium chloride injection, while those in the BHM group received oral gavage of GJRGD at a dosage of 0.1 mL/10 g daily for 14 days. The GJRGD is composed of the Chinese herbs Gan Jiang (Zingiber officinale Roscoe) and Rou Gui (Cinnamomum cassia (L). J.Presl). All the Chinese medicinal materials were identified by Professor Xiong Li, the Second Affiliated Hospital of Guangzhou University of Chinese Medicine. Voucher specimens were deposited in the School of Basic Medical Sciences of Guangzhou University of Chinese Medicine. The specific production process of GJRGD is as follows: These two herbal decoctions were combined in a ratio of 1:1. Then, 800 mL of distilled water was added to the mixture, which had a total weight of 100 g, and the mixture was boiled for one hour. This procedure was repeated once, and the supernatants from both rounds were combined. Subsequently, the supernatants were concentrated to 735 mL in water bath, divided into centrifugal tubes, and stored in a refrigerator at 4 °C. The final crude concentration of GJRGD was 0.135 g/mL.
The rats in the BSC group were provided with normal food and water and were allowed to eat and drink ad libitum without any special treatment. The rats in the BSM group were subjected to multiple factors, including hunger, cold, and dampness, to induce modeling. The details were as follows: Each rat was fed 50 g/kg per day, and they were placed in 20 °C cold water to swim in batches for 30 minutes daily, and then removed to dry naturally for 14 days.
On the 6th day of modeling, the hair in a 4 cm × 3 cm area above the tail root of the rats in all four groups was removed. From the 7th to the 14th day, 100 mg of Vaseline was applied daily to the hairless area on the back of each rat in the two control groups, and 100 mg of 0.5% IMQ was applied daily to each rat in the two model groups. The Psoriasis Area and Severity Index (PASI) score was assessed daily. After the modeling was completed, 6 rats from each group were selected for sampling, and the remaining rats proceeded to the treatment stage. 7 rats from BHM group and BSM group were randomly selected to form CQC group and PSORI-CM01 group respectively, and the rest continued as the model groups. The rats in BHC group, BHM group, BSC group, and BSM group received oral gavage of 0.9% sodium chloride injection, while the rats in CQC group and PSORI-CM01 group received oral gavage of CQC solution and PSORI-CM01 solution, respectively, once a day for a treatment stage of 7 days. At the end of the treatment period, the rats were euthanized, and their blood and diseased skin tissues were extracted for subsequent experiments. In addition, during the 21-day experiment, skin lesions were photographed and recorded, rectal temperature was measured in BHS rats, and the tongue surface and sublingual veins were photographed in BSS rats every 3 days under isoflurane anesthesia.
Detection of Blood Viscosity and Platelet Count in Rats
Before sampling, the rats were fasted for 12 hours without restriction of water intake. After anesthesia induced by inhalation of isoflurane, blood was collected from abdominal aorta. About 1 mL of blood was collected by EDTA anticoagulant tube, and approximately 5 mL of blood was collected by heparin anticoagulant tube, which were gently mixed and placed on ice for timely detection of whole blood viscosity and platelet count (PLT). Then, the diseased skin tissue of the rats was stripped, part of which was used for pathological section analysis, and the other part was stored in the refrigerator at −80 °C.
HE Staining and Baker Score
The skin tissue of the rats was dehydrated and embedded in paraffin. After dewaxing, dehydration and drying, hematoxylin-eosin staining (HE) was performed, and the sections were dehydrated and sealed. The morphological changes of the skin were observed under optical microscope and scored using the histopathological score of inflammation severity (Baker Score),42 as shown in Table 2.
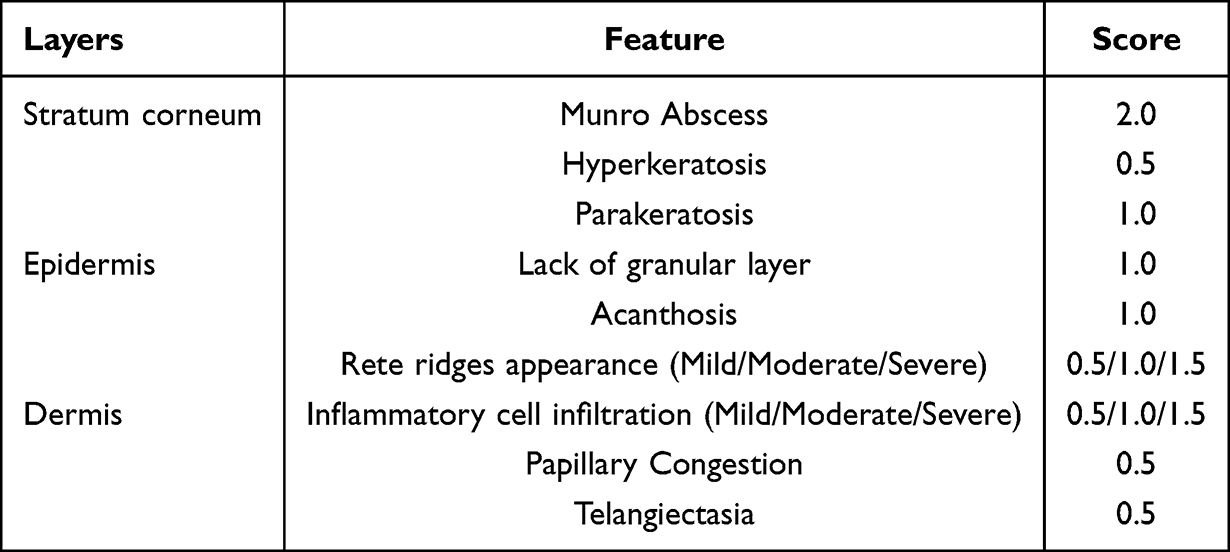 |
Table 2 Baker Scoring System |
RT-qPCR
Total RNA was extracted from 30 mg of skin tissue from each rat according to the instructions of the RNA extraction kit, and the total RNA of 1000 ng was reverse transcribed into cDNA using the gDNA clean reaction mix kit. According to the SYBR Green Premix kit, RT-qPCR was performed on cDNA using the following two-step method: 95 °C for 30 seconds of polymerase activation, 40 cycles of 95 °C for 5 seconds and 60 °C for 30 seconds. The relative gene expression was quantitatively evaluated by 2−ΔΔCt. Gapdh served as the internal reference gene. The primer sequences are shown in Table 3.
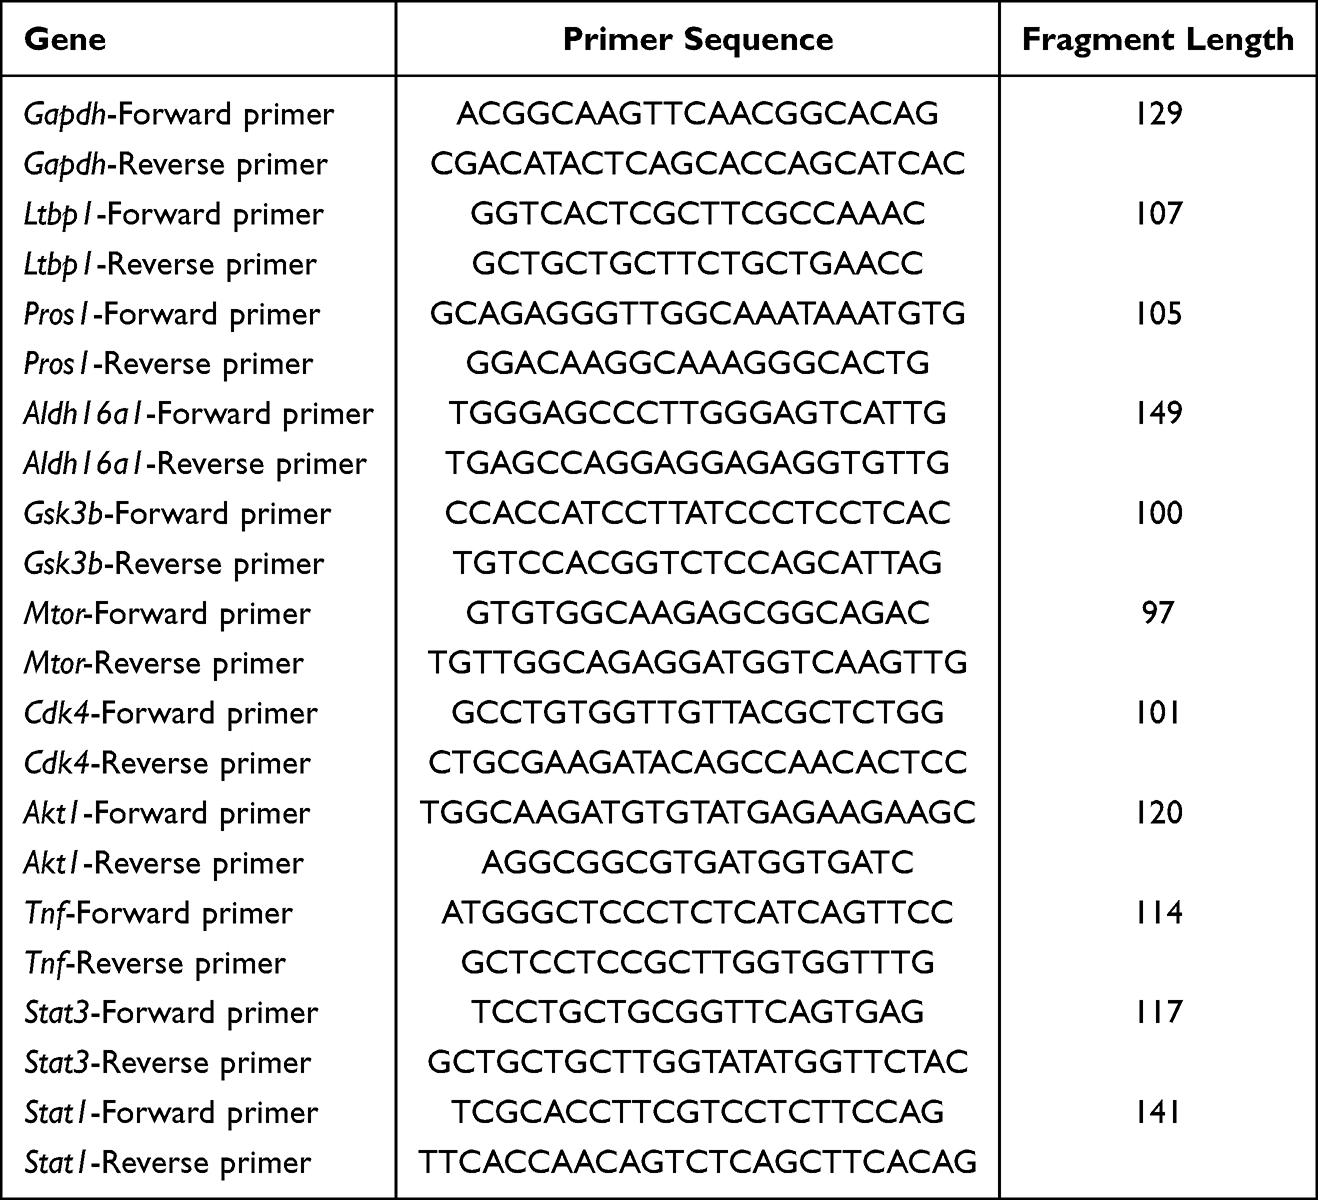 |
Table 3 RT-qPCR Primer Design |
Enzyme Linked Immunosorbent Assay (ELISA)
Phosphate buffered saline was added into each rat skin tissue at a ratio of 1:9, and then homogenized at 4 °C and 12000 rpm for 15 minutes after adding grinding ball. Then, the total protein levels in the samples were measured using the BCA method, and the protein expression levels of GSK3B, AKT1 and STAT1 in the samples were determined using ELISA kits. Finally, the ratio of target protein to total protein was calculated.
Statistical Analysis
Shapiro–Wilk test was used to test the normal distribution of statistical data, and the results were expressed as mean ± standard deviation. One-way analysis of variance (ANOVA) was used for comparisons among multiple groups, and the least significant difference (LSD)-t-test was used for comparisons between two groups. When the data did not conform to normal distribution, the Mann–Whitney U-test and Kruskal–Wallis H-test were used to conduct non-parametric tests for two or more groups, respectively. Differences were considered statistically significant when P-value was less than 0.05.
Results
Analysis of DEGs Between BHS and BSS Psoriasis to Construct the Pathogenic Pathway Network of Psoriasis Based on Syndromes
In the peripheral blood mononuclear cell gene expression data of psoriasis patients, it was found by PCA that sample GSM5767755 of the healthy control group was an outlier (Supplementary Figure S1). Compared with the healthy control group, there were 1023 up-regulated genes and 414 down-regulated genes in the BHS group, while the BSS group had 1083 up-regulated genes and 415 down-regulated genes. Among them, there were 1404 common differential genes, 34 characteristic differential genes in the BHS group, and 94 characteristic differential genes in the BSS group. When comparing the BHS group with the BSS group, there were 34 different protein-coding genes. The three main pathways in the BHS group and BSS group were Th17 cell differentiation, Th1 and Th2 cell differentiation, and Adherens junction. In addition, GSK3B and TNF were involved in the enrichment of eight signaling pathways (Supplementary Figure S2), respectively. STAT1 was the common differential hub gene of the two groups, and the two main pathways between the BHS group and the BSS group were Platelet activation and Complement and coagulation cascades (Figure 1).
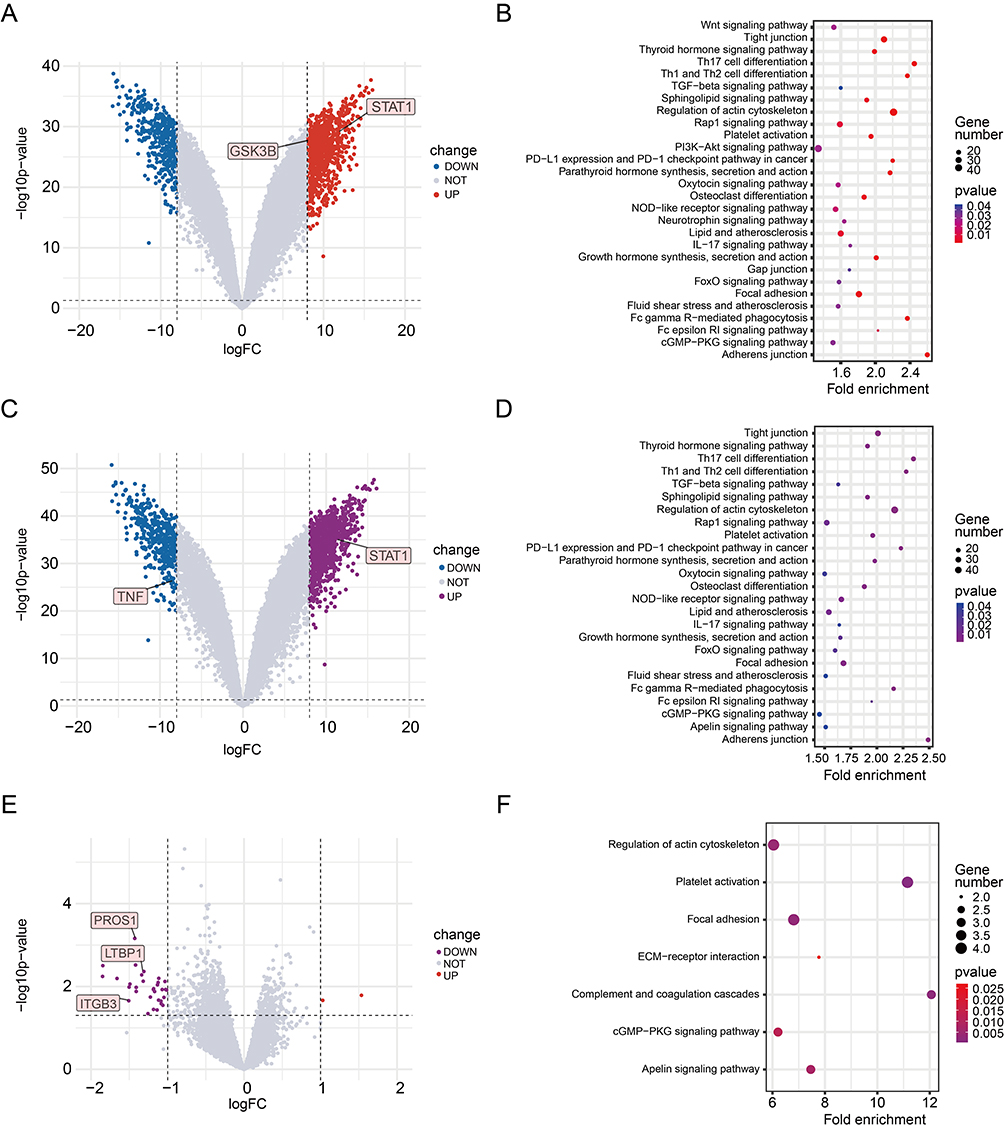 |
Figure 1 Volcanic plot and KEGG enrichment analysis of gene expression profiles. (A) Volcanic plot of differential genes in BHS psoriasis and healthy control group. (B) KEGG enrichment analysis of differential genes in BHS psoriasis and healthy control group. (C) Volcanic plot of differential genes in BSS psoriasis and healthy control group. (D) KEGG enrichment analysis of differential genes in BSS psoriasis and healthy control group. (E) Volcanic plot of differential genes in psoriasis with BHS and BSS. (F) KEGG enrichment analysis of differential genes in psoriasis with BHS and BSS. |
According to the original literature description, PCA and cluster analysis were performed on the original data. In the DNA methylation profile data of peripheral blood mononuclear cells of patients with psoriasis, GSM5563340, GSM5563346 in the BHS group, GSM5563348, GSM5563351, GSM5563356, GSM5563357, GSM5563358 in the BSS group, and GSM5563364 in the healthy control group were outlier samples (Supplementary Figure S3). By analyzing differential CpG sites, compared with the healthy control group, 149 hypermethylated genes and 8 hypomethylated genes were found in the BHS group, while 587 hypermethylated genes and 280 hypomethylated genes were found in the BSS group. Through PPI analysis, MTOR was the core gene in the BHS group, and STAT3, ESR1 and IFNG were the core genes in the BSS group. There were 56 hypermethylated genes and 10 hypomethylated genes in the BHS group compared with the BSS group, and GRB2 was the differential hub gene between the two groups. In the KEGG enrichment analysis, the number and the extent of gene enrichment were analyzed comprehensively. The main enrichment pathways of differentially methylated genes in the BHS group were PI3K-Akt signaling pathway and HIF-1 signaling pathway. The main enrichment pathways in the BSS group were PI3K-Akt signaling pathway and Parathyroid hormone synthesis, secretion and action. Compared with the BSS group, the JAK-STAT signaling pathway was the main enrichment pathway in the BHS group (Figure 2).
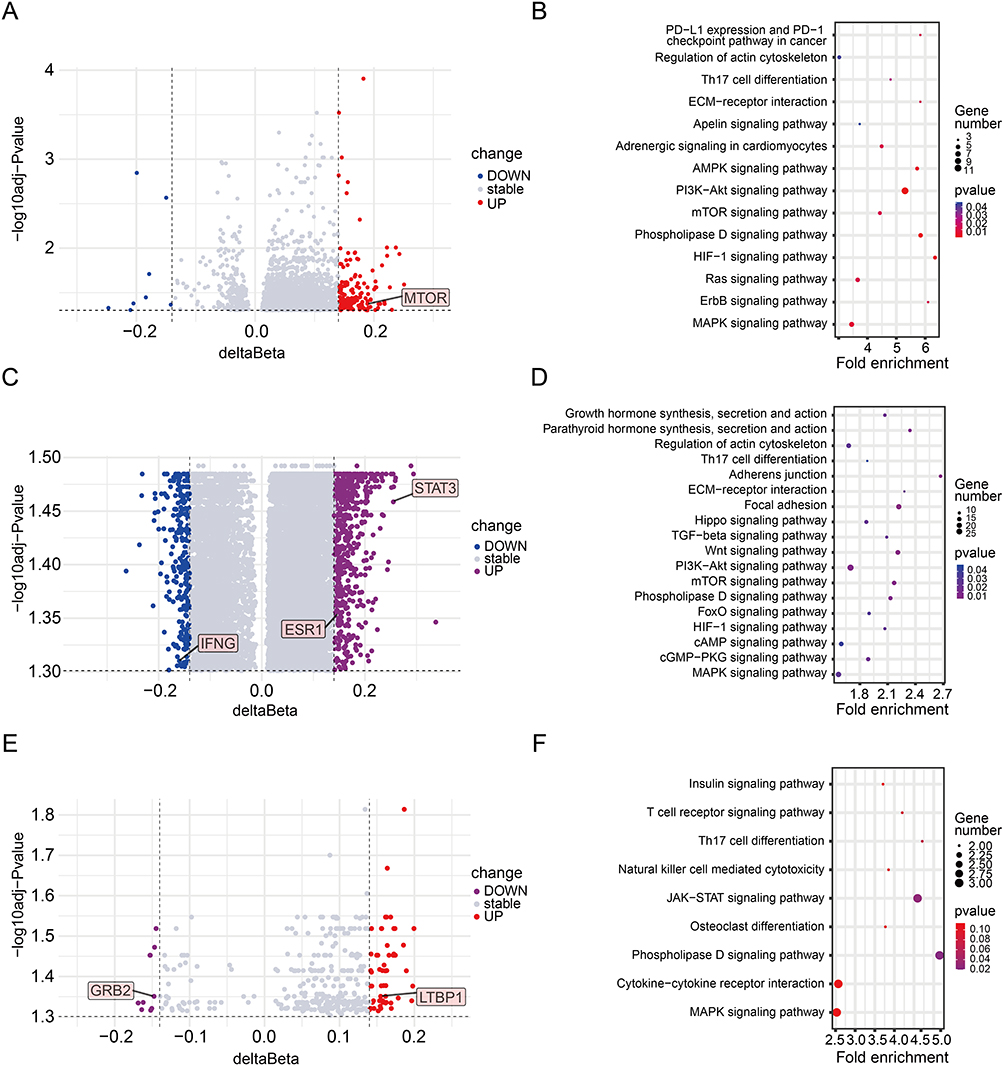 |
Figure 2 Volcanic plot and KEGG enrichment analysis of DNA methylation expression profile. (A) Volcanic plot of differential methylation genes in BHS psoriasis and healthy control group. (B) KEGG enrichment analysis of differential methylation genes in BHS psoriasis and healthy control group (C) Volcanic plot of differential methylation genes in BSS psoriasis and healthy control group. (D) KEGG enrichment analysis of differential methylation genes in BSS psoriasis and healthy control group. (E) Volcanic plot of differential methylation genes in psoriasis with BHS and BSS. (F) KEGG enrichment analysis of differential methylation genes in psoriasis with BHS and BSS. |
Among the differential genes of the BHS and BSS groups, LTBP1 was significant in both gene expression profile and DNA methylation expression profile.
The microRNA microarray results of peripheral blood monocytes of 17 PV patients (including 9 BHS patients and 8 BSS patients) and 9 healthy controls were analyzed. Compared with the healthy control group, there were 43 different miRNA target genes in the BHS group and 130 different miRNA target genes in the BSS group, and the differential genes were analyzed using PPI (Supplementary Figure S4). The core genes of the BHS group were CDK4, JUND and FOXO1, and the main enrichment pathway was Insulin signaling pathway. In the BSS group, the core genes were AKT1, FOS, and CALM3, and the main enrichment pathway was Platelet activation (Figure 3).
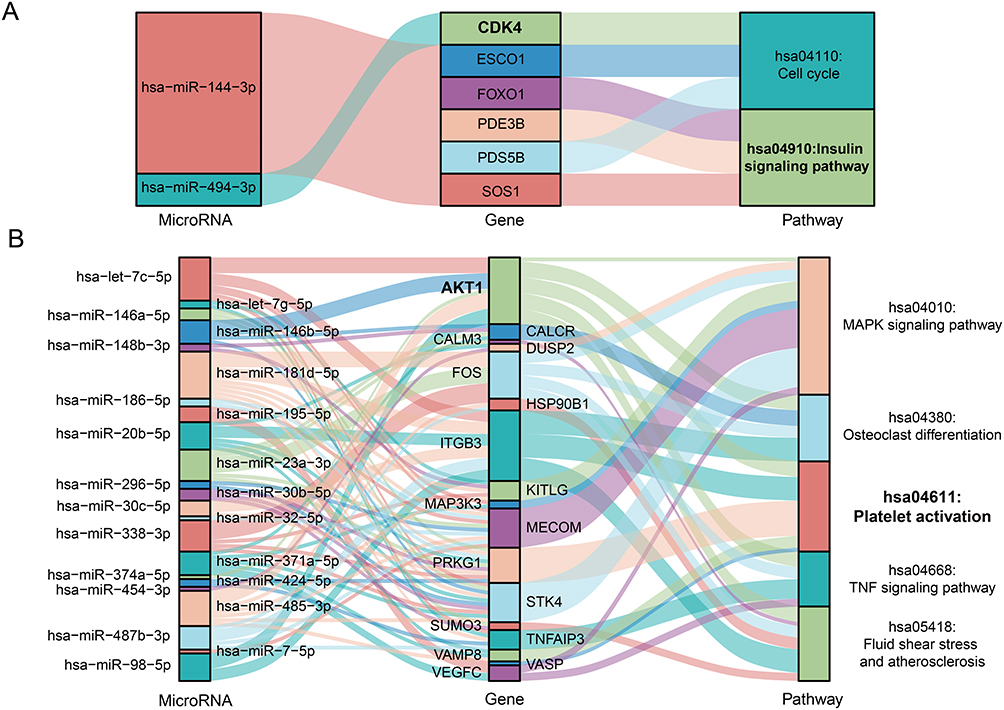 |
Figure 3 Sankey diagram of differential miRNAs, genes and enrichment pathways in psoriasis. (A) Differences in miRNA, genes and enrichment pathways between BHS psoriasis and healthy controls. (B) Differences in miRNA, genes and enrichment pathways between BSS psoriasis and healthy controls. The bold font in the figure indicates the main targeted genes and enriched signaling pathways. |
The serum metabolic profiles of 45 healthy controls and 80 PV patients (30 in the BHS group and 50 in the BSS group) were analyzed. Compared with the healthy control group, the PV groups exhibited abnormal lipid metabolism. Among the 8 major metabolites (Supplementary Table S3), the main manifestations were up-regulated Lysophosphatidylcholine (LPC) level and down-regulated phosphatidylcholine (PC) level. PC (O-16:0/2:0) (known as platelet activating factor, PAF) was the main differential metabolite between the BHS and BSS groups, involving Glycerophospholipid Metabolism pathway.
Through the analysis of multi-omics data, we identified 16 core differentially expressed genes, 1 metabolite, and 21 major pathogenic pathways. Based on these findings, a psoriasis pathway network diagram was constructed according to TCM syndrome types (Figure 4). There were 7 characteristic genes in two syndromes of psoriasis, namely GSK3B, MTOR, and CDK4 in the BHS group, TNF, STAT3, and AKT1 in the BSS group, and LTBP1 both in the two groups. The BHS group was characterized by Insulin signaling pathway while the BSS group was characterized by Platelet activation.
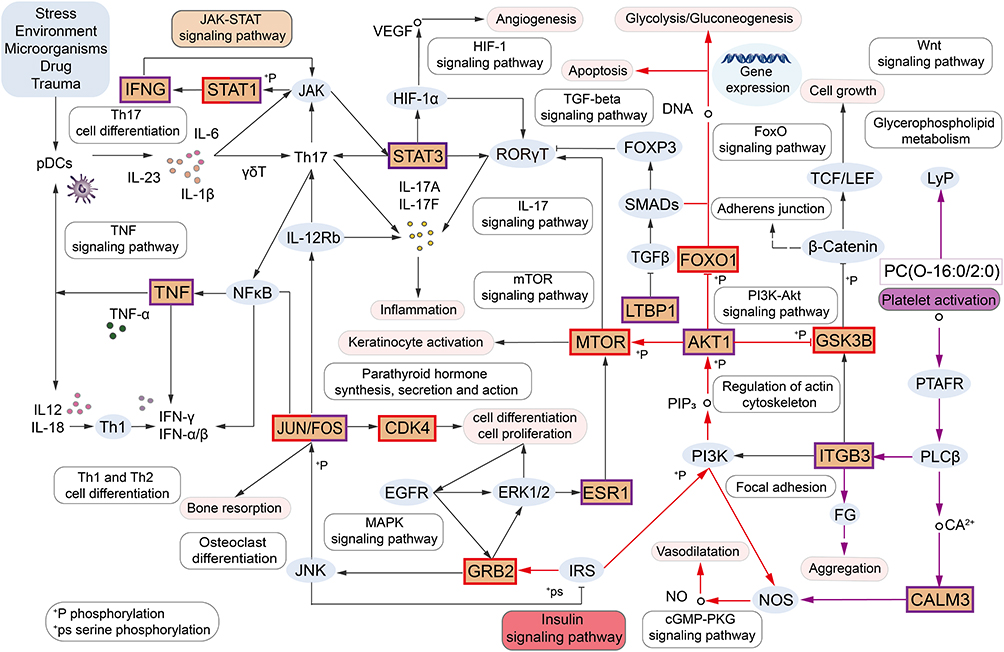 |
Figure 4 Psoriasis pathway network diagram based on TCM syndromes. In the figure, the Orange part shows 16 core targets, the red and purple boxes and the black lines are the common targets and pathways of BHS and BSS psoriasis, the red boxes and lines are the characteristic targets and pathways of BHS psoriasis, and the purple boxes and lines are the characteristic targets and pathways of BSS psoriasis. |
Identification of Core Targets to Distinguish the BHS Psoriasis From BSS Psoriasis by ML Classification Algorithm
70% of the differential gene sequencing data from the BHS and BSS groups were divided into the training set and 30% into the test set. The average AUC values on the test set of Lasso, RF and SVM were 0.813, 0.753, and 0.763, based on 50 cycles of testing. LASSO demonstrated superior and more consistent predictive accuracy. Therefore, Lasso was selected as the classification algorithm to screen important variables. When lambda.min was selected for fitting, EGR1, PROS1, and RBMY1E were screened. The ROC curves were drawn and the AUC values were calculated, among which PROS1 performed the best, with an AUC value of 0.793 (Figure 5A–F).
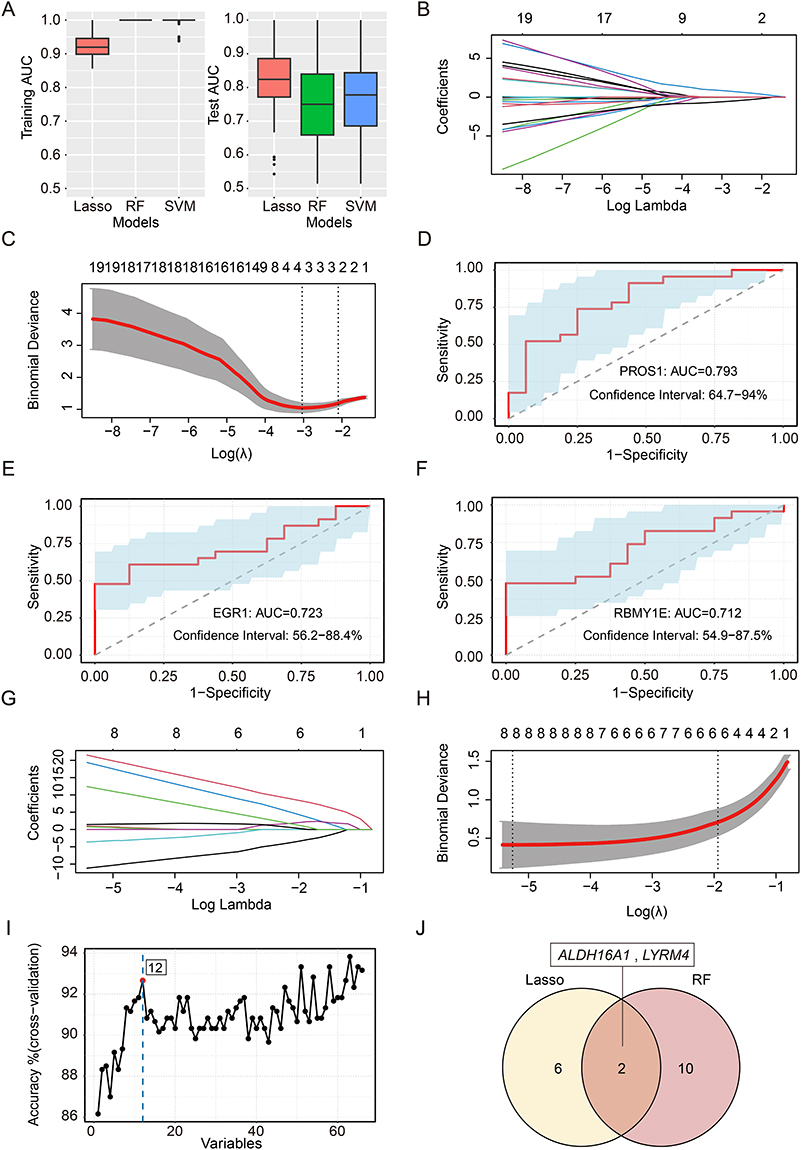 |
Figure 5 LASSO, RF and SVM classification models were used to screen the characteristic differential genes of BHS and BSS psoriasis. (A-F) Screening for important characteristic variables in the gene expression profile section. (G-J) Screening for important characteristic variables in the DNA methylation sequencing profile section. (A) AUC values for LASSO, RF, and SVM on the training set and test set, respectively. (B and G) Lasso model regression coefficient path plot: The upper X-axis shows the number of independent variables, the lower X-axis shows Log (λ), each line represents a target gene, and the Y-axis shows the regression coefficients corresponding to the target genes. (C and H) The trend chart of variable filtering numbers corresponding to Log (λ) in the cross-validation model: The upper X-axis represents the number of independent variables, the lower X-axis represents the Log (λ) value corresponding to the Lambda value, and the Y-axis represents the mean square error. (D) ROC curve and AUC value of PROS1, the optimal element selected by Lasso model. (E) ROC curve and AUC value of EGR1, the optimal element selected by Lasso model. (F) ROC curve and AUC value of RBMY1E, the optimal element selected by Lasso model. (I) Trend plot of variables screened number against sample prediction accuracy in the optimal RF model: The X-axis shows the number of feature variables, the Y-axis shows the sample prediction accuracy corresponding to that number of samples, and the red dot represents the results of the optimal RF model. (J) The Venn diagrams of differentially methylated genes between BHS and BSS psoriasis were screened by Lasso regression and RF. |
By analyzing the DNA methylation differential site target gene sequencing data of the BHS group and BSS group, the three algorithms can accurately distinguish the two groups of data in the test set. Among them, when SVM screened the important variables, an overfitting phenomenon occurred and was thus eliminated. The Lasso and RF algorithms were then applied, which identified 8 and 12 important variables (Figure 5G–I), and the intersection of the two was taken as ALDH16A1 and LYRM4, among which ALDH16A1 was the most important feature variable (Figure 5J).
Identification of Core Targets of CQC and PSORI-CM01 by Network Pharmacology
There were 1308 disease targets for psoriasis, 472 targets for the 29 main components of CQC, 141 targets intersecting with psoriasis, and 46 enriched KEGG signaling pathways (Supplementary Table S4). The 26 main active components of PSORI-CM01 act on 290 targets, 91 overlapping targets with psoriasis, and 40 enriched KEGG signaling pathways (Supplementary Table S5). Among the 16 core targets of psoriasis signaling pathway, the targets of CQC in the treatment of BHS psoriasis were TNF, STAT3, AKT1, ESR1, CDK4, MTOR, GSK3B, and STAT1 (Supplementary Table S6), while those of PSORI-CM01 in the treatment of BSS psoriasis were AKT1, STAT3, ESR1, CDK4, MTOR, GSK3B, and STAT1 (Supplementary Table S7).
Verification of CQC and PSORI-CM01 Anti-Psoriasis Core Targets by Molecular Docking
The lower the binding energy between ligand and receptor in molecular docking, the more stable the binding is indicating a higher likelihood of interaction. The binding energy criterion of ≤ −7.0 kcal·mol−1 was used to evaluate the affinity between the main components and core targets of the two compounds through molecular docking, and heatmaps were drawn (Supplementary Figure S5). The results showed that 61% of the binding energies in CQC were less than −7.0 kcal·mol−1, and 51% of the binding energies in PSORI-CM01 were less than −7.0 kcal·mol−1, indicating strong binding activity between them, thus confirming the reliability of the predictions in this study. Given the focus of this study on the difference analysis between BHS and BSS, the components with good activity were selected for molecular docking display (Supplementary Figure S6). The binding energies were −12.17 kcal·mol−1 for Taxifolin 7-rhamnoside and GSK3B, and −14.06 kcal·mol−1 for Astilbin and AKT1, respectively. The binding energies of Taxifolin 7-rhamnoside and Isoliquiritin apioside to STAT1 were −10.76 kcal·mol−1 and −12.1 kcal·mol−1, respectively.
Animal Experiment
The Syndrome and Psoriasis Characteristic Changes During the Modeling and Treatment Stages
The specific experiment process is outlined in Figure 6A. Following this protocol, after IMQ modeling, psoriatic dermatosis began to appear on day 2, with the most severe manifestations on day 7, including erythema, infiltration, and desquamation, which gradually improved during the treatment phase. The representative skin appearance changes of rats in each group throughout the process are shown in Figure 6B. In the BHS psoriasis model, as the model was established, the rate of weight gain in the BHM group and the CQC group was slower than that in the BHC group. However, after the CQC intervention, the weight gain in the CQC group was normalized (Figure 6C). Concurrently, the rectal temperature in the BHM group increased gradually during the modeling stage, and the difference was statistically significant compared with the BHC group on the 14th day, and the CQC group gradually recovered to normal level during the treatment stage (Figure 6D). In the BSS psoriasis model, compared with the BSC group, the body weight of rats in the BSM group and the PSORI-CM01 group decreased significantly after modeling. After the intervention of PSORI-CM01 and the adjustment of food intake, the body weight of rats in the PSORI-CM01 group gradually increased and returned to the normal level (Figure 6E). Furthermore, the tongue quality and sublingual vein of the model group were purplish and dark to varying degrees, and the sublingual choroid became longer, which gradually returned to normal state during the treatment stage (Supplementary Figure S7). Compared with the corresponding control group, the PASI scores of the model group gradually increased, while the PASI scores of the CQC group and PSORI-CM01 group gradually decreased (Figure 6F–M).
 |
Figure 6 General physical changes during modeling and treatment in rats. (A) Experiment flow chart. (B) Skin photos of the back of each group of rats during the whole animal experiment. (C) Changes in body weight in each group of BHS psoriasis. (D) Changes of rectal temperature in each group of BHS psoriasis (n=6, 14). ***p < 0.001, *p < 0.05 for the BHM or CQC groups compared to the BHC group; ns, not significant. (E) Changes in body weight in each group of BSS psoriasis. (F-I) Changes in erythema, infiltration, desquamation, and PASI scores in each group of BHS psoriasis (n=6, 14). ***p < 0.001 for the BHM or CQC groups compared to the BHC group; ###p < 0.001, ##p < 0.01, #p < 0.05 for the CQC group compared to the BHM group; ns, not significant. (J-M) Changes of erythema, infiltration, desquamation, and PASI scores in each group of BSS psoriasis (n=6, 14). ***p < 0.001 for the BSM or PSORI-CM01 groups compared to the BSC group; ##p < 0.01, #p < 0.05 for the PSORI-CM01 group compared to the BSM group; ns, not significant. |
Changes of Blood Viscosity and Platelet Count After Modeling and Treatment
During the modeling stage, the BSM group demonstrated increased whole blood viscosity at shear rates of 60s−1 and 150s−1 compared to the BSC group, indicating heightened blood circulation resistance in the model rats (Figure 7A–C). Concurrently, the BHM group exhibited elevated plasma viscosity relative to the BHC group, indicating an increased tendency towards inflammation and hypercoagulability (Figure 7D).
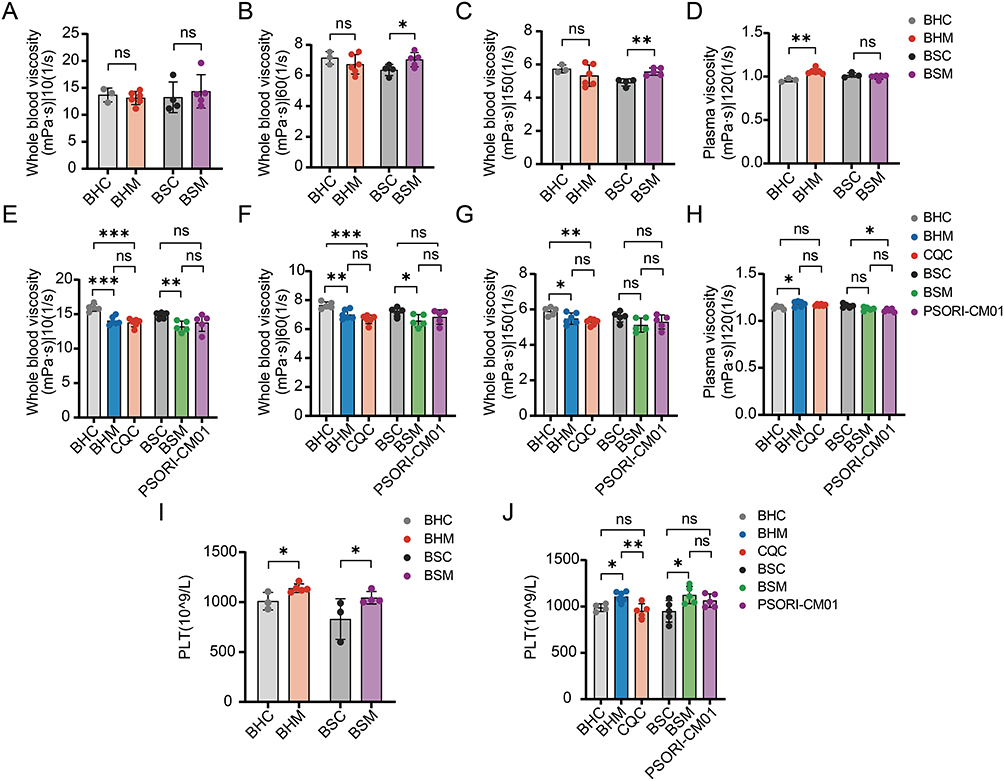 |
Figure 7 The changes of whole blood viscosity and platelet count in each group during modeling and treatment. (A-D) Comparison of whole blood viscosity in each group after modeling. (E-H) Comparison of whole blood viscosity in each group after treatment. (I) Comparison of platelet count changes in each group after modeling. (J) Comparison of platelet count changes in each group after treatment. The data are expressed as the mean ± SD. Significant levels: ***p < 0.001, **p < 0.01, *p < 0.05; ns, not significant. |
During the treatment stage, the BHM group displayed reduced whole blood viscosity versus the BHC group, potentially attributable to the accelerated blood circulation of rats with BHM model. When compared with the BHM group, the whole blood viscosity of the CQC group demonstrated a decreasing trend without statistical significance, and its values were significantly lower than those of the BHC group, indicating a reduction in whole blood viscosity after treatment (Figure 7E–G). The BHC group had lower plasma viscosity than the BHM group. Although plasma viscosity of the CQC group was lower than that of the BHM group, the difference between them was not statistically significant. This suggests that treatment with CQC may bring inflammation back to normal (Figure 7H).
Compared with the BSC group, the blood viscosity of the BSM group was reduced at shear rates of 60s−1 and 150s−1. The reason might be that the blood volume increased with the increase of diet during the treatment stage. Compared to the BSM group, the whole blood viscosity of the PSORI-CM01 group showed an upward trend, but there was no statistically significant difference. When compared to the BSC group, no statistically significant difference was found either, indicating that blood circulation tended to normalize after the treatment of PSORI-CM01 (Figure 7E–G). The plasma viscosity of the PSORI-CM01 group was lower than that of the BSC group. It was also lower than that of the BSM group, but there was no statistically significant difference. This suggests the possible improvement in inflammation in rats after the treatment of PSORI-CM01 (Figure 7H).
The platelet counts of the BHM and BSM groups increased compared with those of the corresponding control groups. In contrast, the platelet counts of the CQC and PSORI-CM01 groups decreased compared with those of the corresponding model groups at the treatment stage, with no statistically significant difference compared to the control groups. This indicates that the platelet count returned to a normal state after treatment (Figure 7I and J).
Pathological Observation and Baker Score of Diseased Skin in Rats
The modified Baker score (range: 0–9.5) was used to evaluate the pathological changes in the skin tissues of rats. Pathological results were shown in Figure 8A and B. In the control group, the epidermis of the skin tissue remained intact, with well-defined structures across all layers. The connective tissue in the dermis was neatly arranged, and no visible necrosis or inflammatory cell infiltration was observed. In contrast, in the model group, significant pathological changes were observed. Hyperkeratosis was present in multiple areas of the stratum corneum, and residual nuclei were detected within the stratum corneum. Necrotic tissue and inflammatory cell infiltration were widespread throughout the skin tissues, and the Baker score was significantly elevated compared to the control group (Figure 8C). In the treatment group, the pathological changes were markedly alleviated compared to the model group. The number of inflammatory cells in the skin tissue was significantly reduced, the structure of each layer was relatively restored, and the Baker score was significantly decreased (Figure 8D).
 |
Figure 8 Skin pathological changes and Baker score of each group after modeling and treatment. (A) HE staining of rat skin after modeling. (B) HE staining of rat skin after treatment. The upper image is a view under low magnification (magnification × 100, scale bar = 100 μm). The lower image is a view under high magnification (magnification × 400, scale bar = 20 μm). The black boxes in the low-magnification image indicate the region magnified in the corresponding high-magnification image below, as connected by the dashed line. (C) Baker score of rat skin after modeling. (D) Baker score of skin after treatment. The data are expressed as the mean ± SD. Significant levels: ***p < 0.001 compared in BHS psoriasis, ###p < 0.001 compared in BSS psoriasis. |
mRNA and Protein Expression Levels of Core Targets in Psoriatic Network
In rat skin samples, we examined the expression levels of core differentially expressed genes identified through multi-omics analysis and ML algorithms using RT-qPCR and ELISA. During the modeling phase, compared to the BHC group, Gsk3b, Mtor, and Cdk4 were upregulated in the BHM group. Similarly, compared to the BSC group, Tnf, Stat3, and Akt1 were upregulated in the BSM group. Furthermore, compared to the BHM group, Ltbp1 and Aldh16a1 were downregulated, while Pros1 was upregulated in the BSM group. Notably, Stat1 exhibited high expression in both the BHM and BSM groups (Figure 9).
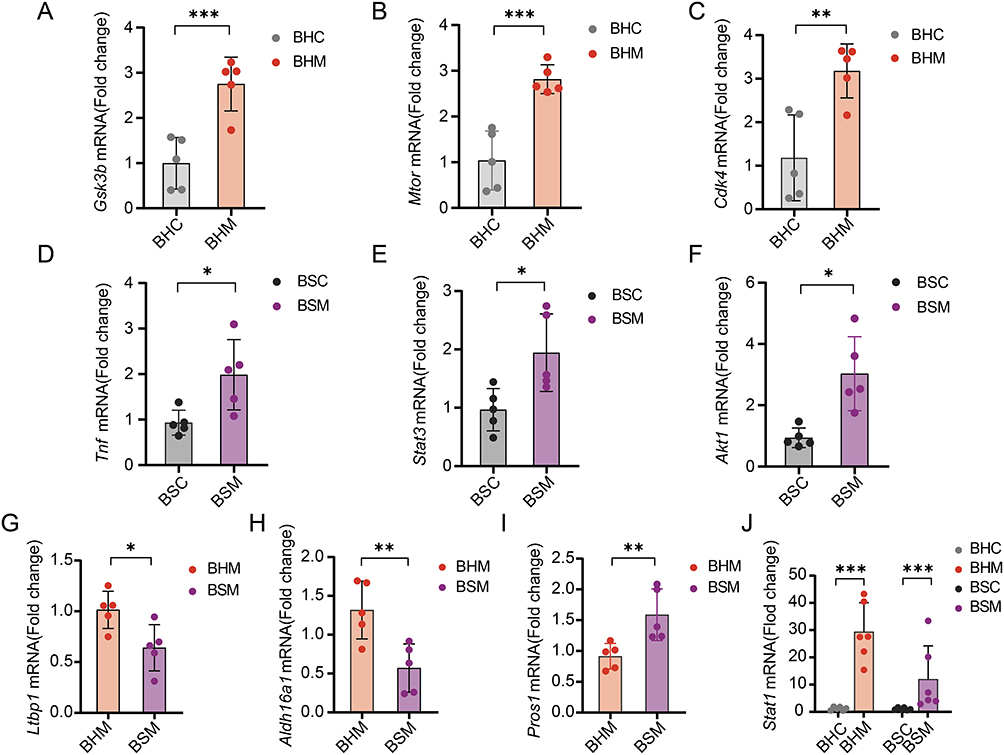 |
Figure 9 mRNA expression of core differential genes in skin of rats in each group after modeling. (A-C) mRNA expression levels of Gsk3b, Mtor, and Cdk4 in BHC and BHM groups. (D-F) mRNA expression levels of Tnf, Stat3, and Akt1 in BSC and BSM groups. (G-I) mRNA expression levels of Ltbp1, Aldh16a1, and Pros1 in BHM and BSM groups. (J) mRNA expression levels of Stat1 in BHC, BHM, BSC and BSM groups. The data are expressed as the mean ± SD. Significant levels: ***p < 0.001, **p < 0.01, *p < 0.05. |
During the treatment phase, the BHS specific differential gene Gsk3b was upregulated in both the BHM and BSM groups but downregulated in the CQC and PSORI-CM01 treatment groups. The BSS specific differential gene Akt1 was downregulated in the BHM group, upregulated in the BSM group, and downregulated in the CQC and PSORI-CM01 treatment groups. The common differential gene Stat1 exhibited high expression in both the BHM and BSM groups but decreased expression in the CQC and PSORI-CM01 treatment groups (Figure 10A–C).
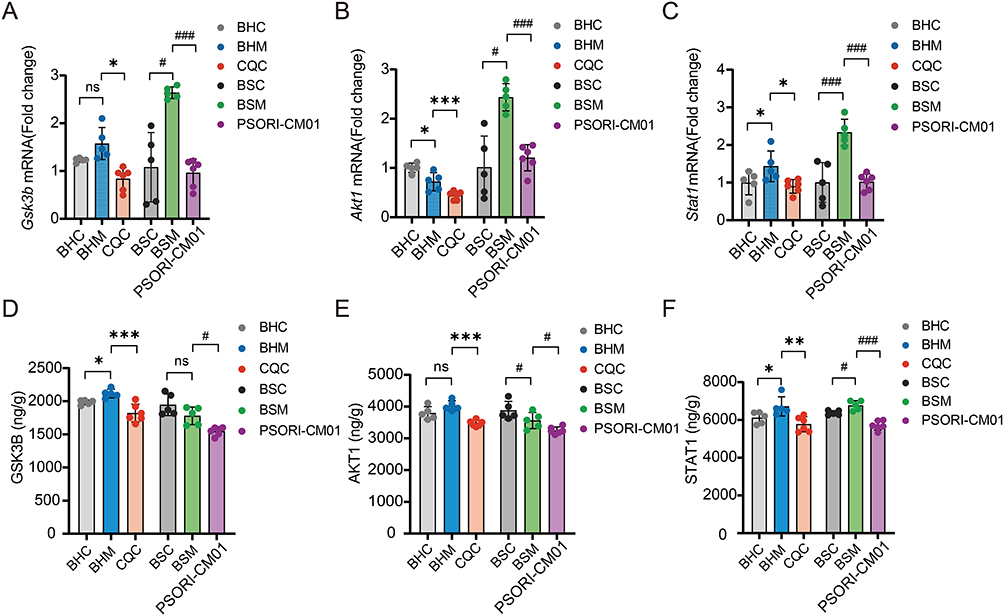 |
Figure 10 Changes in expression of characteristic genes and proteins in the skin of rats after treatment. (A and D) Differences in mRNA (A) and protein expression (D) of GSK3B, a characteristic marker of BHS psoriasis. (B and E) Differences in mRNA (B) and protein expression (E) of AKT1, a characteristic marker of BSS psoriasis. (C and F) Differences in mRNA (C) and protein expression (F) of STAT1, a common characteristic marker of BHS and BSS psoriasis. The data are expressed as the mean ± SD. Significant levels: ***p < 0.001, **p < 0.01, *p < 0.05 compared in BHS psoriasis; ###p < 0.001, #p < 0.05 compared in BSS psoriasis; ns, not significant. |
At the protein expression level, compared to their respective control groups, GSK3B was upregulated in the BHM group, and decreased in the CQC and PSORI-CM01 treatment groups. AKT1 was downregulated in the BSM group, as well as in the CQC and PSORI-CM01 treatment groups. STAT1 exhibited an upregulation trend in the BHM and BSM groups but was downregulated in the CQC and PSORI-CM01 treatment groups (Figure 10D–F).
Discussion
Syndrome differentiation and treatment is the core concept of TCM. This study reveals that although BHS and BSS psoriasis share common inflammatory components, they exhibit distinct molecular profiles and clinical phenotypes. The BHS model is characterized by bright red skin lesions and increased plasma viscosity, while the BSS model presents with dark red erythematous plaques, elevated blood viscosity and platelet count, accompanied by characteristic tongue manifestations.43 In this study, the BHS model exhibited slow weight gain and an increase in rectal temperature, whereas the BSS model showed a purple and dark tongue with longer sublingual veins. These pathological features are consistent with TCM clinical descriptions, providing a physiological basis for syndrome differentiation and treatment.
Our integrated analysis identified the characteristic molecular networks underlying these phenotypic differences. For BHS psoriasis, glycogen synthase kinase-3β (GSK3B) serves as a central regulator linking the Insulin signaling pathway and inflammation. Its inhibition may suppress proinflammatory cytokines and keratinocyte proliferation, which could explain the metabolic disturbances observed in this syndrome. GSK3B can also promote the JAK/STAT pathway by activating STAT1 and STAT3, and regulate the synergistic effect of LPS and IFN-γ to induce IL-6 production.44,45 Additionally, mammalian target of rapamycin (MTOR) and cyclin-dependent kinase 4 (CDK4) were also identified as characteristic genes of BHS, which may contribute to the dysregulation of cell proliferation and inflammatory responses.46,47 As a regulator of glucose metabolism, MTOR has been proven to be a classic downstream target of GSK3B, and is involved in the secretion of pro-inflammatory molecules by keratinocytes, such as CXCL8, IL-6, and VEGF.48 For BSS psoriasis, protein kinase B (AKT1) plays a key role in platelet activation and inflammatory pathways, potentially leading to microcirculatory disorders reflected by hematological abnormalities. The regulation of PI3K-Akt pathway can prevent platelet activation and adhesion to fibrinogen, inhibit platelet aggregation, and promote the formation of clotting factors.49 Furthermore, TNF and STAT3, as key proinflammatory mediators, are highlighted in BSS, enhancing the significance of the specific inflammatory cascade response in this syndrome. STAT3 plays an important role in Th17 cell differentiation and keratinocyte proliferation through the IL-6-induced JAK1/JAK2 or JAK1/TYK2 signaling pathways.50 Signal transducer and activator of transcription 1 (STAT1) acts as a common inflammatory mediator in both syndromes, consistent with their shared inflammatory components. The increase in STAT1 can lead to the production of pro-inflammatory mediators and the activation and maturation of dendritic cells, thereby stimulating Th1 and Th17 cells.51 In addition, machine learning further identified aldehyde dehydrogenase 16 family member A1 (ALDH16A1) and protein S (PROS1) as key discriminative factors, implicating the roles of immune regulation and coagulation pathways in the syndrome differentiation process. There is also growing evidence that ALDH plays a potentially important role in the induction and function of regulatory T cells (Tregs), which are involved in promoting immune tolerance.52 PROS1 is a cofactor of activated protein C, a serine protease that regulates blood clotting, and deficiency of protein S can cause venous thrombosis.53 The inclusion of latent transforming growth factor beta binding protein 1 (LTBP1) among these key differentiation factors further suggests the potential role of TGF-β signaling and vascular remodeling in distinguishing the two syndromes. A latest study shows that LTBP1 is a marker of smooth muscle cell (SMC) as a proxy for atherosclerosis progression.54
Network pharmacology and molecular docking provided mechanistic insights into how specific herbal components target these pathways. In CQC, components such as Astilbin55 and Quercetin56 exhibit strong binding affinity with GSK3B and STAT1, suggesting they may ameliorate BHS psoriasis by regulating glucose metabolism and inflammatory responses. Molecular docking verified the binding affinity of 29 main components in CQC with 8 core targets and 26 active components in PSORI-CM01 with 7 core targets. Among them, multiple components such as Taxifolin 7-rhamnoside, Astilbin, and Isoliquiritin apioside have shown strong binding affinity with the core targets. In PSORI-CM01, multiple components such as Rosmarinic acid57 may target AKT1 and STAT1, potentially improving circulatory dysfunction and inflammatory features of BSS psoriasis. This multi-component, multi-target approach aligns with the holistic nature of TCM formulations and may explain their syndrome-specific therapeutic effects.
Crucially, our in vivo therapeutic experiments validated these computational predictions and delineated a coherent mechanism of action (summarized in Figure 11). CQC treatment not only alleviated skin lesions in BHS psoriasis rats but also significantly downregulated the expression of GSK3B and STAT1, while improving metabolic parameters and plasma viscosity. This suggests that CQC may exert its therapeutic effects by regulating the Insulin signaling pathway and JAK-STAT signaling pathway to inhibit inflammatory responses. Similarly, PSORI-CM01 administration ameliorated skin symptoms and hematological abnormalities in BSS psoriasis rats, which was associated with a significant reduction in AKT1 and STAT1 levels, indicating that it may act by regulating platelet activation and the JAK-STAT signaling pathway. These findings functionally validate the syndrome-specific roles of GSK3B and AKT1, and demonstrate that the therapeutic effects of the two formulations are achieved, at least in part, by regulating these core targets and their associated pathways.
 |
Figure 11 Molecular mechanism diagram of syndrome differentiation and treatment of psoriasis with BHS and BSS using CQC and PSORI-CM01. The red square and arrow represent the characteristic target and signaling pathway of BHS psoriasis, the purple square and arrow represent the characteristic target and signaling pathway of BSS psoriasis, while the yellow square and arrow represent the common target and signaling pathway of psoriasis with BHS and BSS. The innate and adaptive immune systems mutually promote each other, producing multiple cytokines that form a complex network in psoriasis pathogenesis. In BHS psoriasis, GSK3B can regulate mTOR activation to promote keratinocyte proliferation, inhibit CDK4 to induce STAT3 activation, and inhibit glycogen synthesis via GYS modulation, regulating glucose metabolism through the insulin signaling pathway. In BSS psoriasis, TNF and AKT1 mediate NF-κB activation, leading to increased production of inflammatory cytokines. The activation of STAT3 promotes the differentiation of Th17 cells and the release of psoriasis-related cytokines, such as IL-17. Additionally, AKT1 induces blood stasis through the platelet activation pathway and enhances skin inflammation by interacting with neutrophils. In BHS and BSS psoriasis, JAK-mediated STAT1 activation leads to IFN-α/β production. The multiple components of CQC and PSORI-CM01 intervene in the same or different targets through multiple signaling pathways, exerting therapeutic effects on psoriasis with BHS and BSS. |
The relationship between the identified molecular targets and the observed physiological changes requires further investigation. The association between AKT1-mediated platelet activation and elevated blood viscosity in BSS, as well as the potential link between GSK3B-related Insulin signaling and blood viscosity changes in BHS, represent promising directions for future research. These connections may help bridge the gap between the molecular mechanisms of TCM syndrome differentiation and macroscopic clinical manifestations.
While this study provides a molecular framework for understanding TCM syndromes, it has limitations. The use of heterogeneous multi-omics cohorts in rat models and inherent species differences may affect the generalizability of the findings. Additionally, although the sample size was sufficient for initial discovery, larger-scale cohort studies are needed to validate the robustness of these biomarkers and further clarify the precise regulatory mechanisms by which the identified active components influence gene expression and protein function.
Conclusion
Through multi-omics analysis and experimental validation, our study identified that the potential characteristic differential genes for psoriasis with BHS could be GSK3B, MTOR and CDK4; those for psoriasis with BSS could be TNF, STAT3 and AKT1; and the common differential gene for both syndromes could be STAT1. Additionally, the differential genes that could distinguish these two psoriasis syndromes are LTBP1, PROS1 and ALDH16A1. Differential gene expression could lead to distinct physiological and pathological changes in BHS and BSS psoriasis animal models. Furthermore, CQC may interfere with GSK3B to regulate the Insulin signaling pathway, while PSORI-CM01 may interfere with AKT1 to regulate the Platelet activation. Both formulations may exert common effects by targeting STAT1 and modulating the JAK-STAT signaling pathway, thereby improving glucose metabolism and blood circulation in rats, alleviating inflammatory responses, and ultimately exerting syndrome-specific therapeutic effects on BHS and BSS psoriasis. From the perspective of integrating disease and syndrome, this study explores the scientific connotation of TCM syndrome differentiation and treatment. It not only contributes to the potential further development and application of CQC and PSORI-CM01 but also provides preliminary insights for investigating the theoretical basis of TCM.
Abbreviations
AUC, The Area Under the Curve; BHS, Blood-Heat Syndrome; BSS, Blood-Stasis Syndrome; CQC, Compound Qingdai Capsule; DEGs, Differentially Expressed Genes; GJRGD, Ganjiang Rougui Decoction; IMQ, Imiquimod; LASSO, Least Absolute Shrinkage and Selection Operator; ML, Machine Learning; PASI, Psoriasis Area and Severity Index; PCA, Principal Component Analysis; PPI, Protein-Protein Interaction; PSORI-CM01, Yinxiekang Pian; PV, Psoriasis Vulgaris; RF, Random Forest; ROC, Receiver Operating Characteristic; SVM, Support Vector Machine; TCM, Traditional Chinese Medicine.
Data Sharing Statement
The datasets associated with this study can be obtained from the corresponding author, Jiangyong Gu, upon reasonable request.
Ethics Approval
All methods were carried out in accordance with relevant guidelines and regulations. The animal study protocol was approved by the Ethical Committee of Guangzhou University of Chinese Medicine (Registration number: 20240326003; Approval date: March 27, 2024).
GEO belongs to public database. The patients involved in the database have obtained ethical approval. Users can download relevant data for free for research and publish relevant articles. According to item 1 and 2 of Article 32 of the Ethical Review Measures for Life Science and Medical Research Involving Human Subjects (issued on February 18, 2023, in China), ethical review may be waived for studies that: (i) Utilize legally obtained public data, or data generated through observation without interfering with public behavior; (ii) Use anonymized information data for research purposes. Thus, the Dermatology Hospital of Southern Medical University of Medical Ethics Committee reviewing and waiving the need for ethical approval for the study.
Acknowledgments
We are grateful to the Research Centre of Basic Integrative Medicine of Guangzhou University of Chinese Medicine for providing us with experimental instruments and the Animal Experiment Center of Guangzhou University of Chinese Medicine for providing us with animal experimental platform.
Author Contributions
All authors made a significant contribution to the work reported, whether that is in the conception, study design, execution, acquisition of data, analysis and interpretation, or in all these areas; took part in drafting, revising or critically reviewing the article; gave final approval of the version to be published; have agreed on the journal to which the article has been submitted; and agree to be accountable for all aspects of the work.
Funding
This work was supported by the National Natural Science Foundation of China (NSFC, grant number 81904198 and 81804111); Guangdong Basic and Applied Basic Research Foundation (grant number 2022A1515220026).
Disclosure
The authors declare that there is no conflict of interest regarding the publication of this paper.
References
1. Griffiths CEM, Armstrong AW, Gudjonsson JE, Barker J. Psoriasis. Lancet. 2021;397(10281):1301–1315. doi:10.1016/S0140-6736(20)32549-6
2. Abramczyk R, Queller JN, Rachfal AW, Schwartz SS. Diabetes and Psoriasis: different Sides of the Same Prism. Diabetes Metab Syndr Obes. 2020;13:3571–3577. doi:10.2147/DMSO.S273147
3. Cui P, Li D, Shi L, et al. Cardiovascular comorbidities among patients with psoriasis: a national register-based study in China. Sci Rep. 2024;14(1):19683. doi:10.1038/s41598-024-70707-w
4. Bellinato F, Maurelli M, Geat D, Girolomoni G, Gisondi P. Managing the patient with psoriasis and metabolic comorbidities. Am J Clin Dermatol. 2024;25(4):527–540. doi:10.1007/s40257-024-00857-0
5. Rendon A, Schakel K. Psoriasis pathogenesis and treatment. Int J Mol Sci. 2019;20(6):1475. doi:10.3390/ijms20061475
6. Walter K. Psoriasis. JAMA. 2022;327(19):1936. doi:10.1001/jama.2022.5270
7. Mosca M, Hong J, Hadeler E, et al. The Role of IL-17 Cytokines in Psoriasis. Immunotargets Ther. 2021;10:409–418. doi:10.2147/ITT.S240891
8. Guo J, Zhang H, Lin W, et al. Signaling pathways and targeted therapies for psoriasis. Signal Transduct Target Ther. 2023;8(1):437. doi:10.1038/s41392-023-01655-6
9. Dai D, Wu H, He C, et al. Evidence and potential mechanisms of traditional Chinese medicine for the treatment of psoriasis vulgaris: a systematic review and meta-analysis. J Dermatol Treat. 2022;33(2):671–681. doi:10.1080/09546634.2020.1789048
10. Committee on Psoriasis CSoD. Guideline for the diagnosis and treatment of psoriasis in China (2023 edition). Chin J Dermatol. 2023;56(7):573–625. doi:10.35541/cjd.20220839
11. Zheng W, Li G, Liu Q, et al. Effect of compound Qingdai capsule on cytokines secreted by HaCaT cells under micro environment of psoriasis. Chin J Dermatovenerol. 2021;35(03):261–265. doi:10.13735/j.cjdv.1001-7089.202009084
12. Yao DN, Lu CJ, Wen ZH, et al. Comparison of PSORI-CM01 granules and Yinxieling tablets for patients with chronic plaque psoriasis: a pilot study for a randomized, double-blinded, double-dummy, multicentre trial. Ann Pallliat Med. 2021;10(2):2036–2047. doi:10.21037/apm-20-2575
13. Lu C, Liu H, Jin X, et al. Herbal components of a novel formula PSORI-CM02 interdependently suppress allograft rejection and induce CD8+CD122+PD-1+ regulatory T cells. Front Pharmacol. 2018;9:88. doi:10.3389/fphar.2018.00088
14. Han L, Sun J, Lu CJ, et al. Formula PSORI-CM01 inhibits the inflammatory cytokine and chemokine release in keratinocytes via NF-κB expression. Int Immunopharmacol. 2017;44:226–233. doi:10.1016/j.intimp.2017.01.023
15. Zhao Y, Jhamb D, Shu L, et al. Multi-omics integration reveals molecular networks and regulators of psoriasis. BMC Syst Biol. 2019;13(1):8. doi:10.1186/s12918-018-0671-x
16. Lv S, Wang Q, Zhang X, et al. Mechanisms of multi-omics and network pharmacology to explain traditional Chinese medicine for vascular cognitive impairment: a narrative review. Phytomedicine. 2024;123:155231. doi:10.1016/j.phymed.2023.155231
17. Chen H, He Y. Machine learning approaches in traditional Chinese medicine: a systematic review. Am J Chin Med. 2022;50(1):91–131. doi:10.1142/S0192415X22500045
18. Shi YL, Liu JY, Hu XJ, et al. A new method for syndrome classification of non-small-cell lung cancer based on data of tongue and pulse with machine learning. Biomed Res Int. 2021;2021(1):1337558. doi:10.1155/2021/1337558
19. Lu Y, Qi Y, Li L, et al. The gene expression analysis of peripheral blood monocytes from psoriasis vulgaris patients with different traditional Chinese medicine syndromes. Front Pharmacol. 2021;12(1663–9812):759741. doi:10.3389/fphar.2021.759741
20. Xing M, Luo Y, Kuai L, et al. DNA methylation expression profile of blood heat syndrome and blood stasis syndrome in TCM psoriasis. Evid Based Complement Alternat Med. 2022;2022:9343285. doi:10.1155/2022/9343285
21. Lu Y, Qi Y, Yan Y, et al. Analysis of microRNA expression in peripheral blood monocytes of three Traditional Chinese Medicine (TCM) syndrome types in psoriasis patients. Chin Med. 2020;15(1):39. doi:10.1186/s13020-020-00308-y
22. Li L, Yao DN, Lu Y, et al. Metabonomics study on serum characteristic metabolites of psoriasis vulgaris patients with blood-stasis syndrome. Front Pharmacol. 2020;11:558731. doi:10.3389/fphar.2020.558731
23. Tian Y, Morris TJ, Webster AP, et al. ChAMP: updated methylation analysis pipeline for illumina beadchips. Bioinformatics. 2017;33(24):3982–3984. doi:10.1093/bioinformatics/btx513
24. Pang Z, Xu L, Viau C, et al. MetaboAnalystR 4.0: a unified LC-MS workflow for global metabolomics. Nat Commun. 2024;15(1):3675. doi:10.1038/s41467-024-48009-6
25. Wu T, Hu E, Xu S, et al. clusterProfiler 4.0: a universal enrichment tool for interpreting omics data. Innovation. 2021;2(3):100141. doi:10.1016/j.xinn.2021.100141
26. Wang Y, Zhuang H, Jiang XH, et al. Unveiling the key genes, environmental toxins, and drug exposures in modulating the severity of ulcerative colitis: a comprehensive analysis. Front Immunol. 2023;14:1162458. doi:10.3389/fimmu.2023.1162458
27. Yan B, Liao P, Han Z, et al. Association of aging related genes and immune microenvironment with major depressive disorder. J Affect Disord. 2025;369:706–717. doi:10.1016/j.jad.2024.10.053
28. Svecova M, Blahova L, Kostolny J, et al. Enhancing endometrial cancer detection: blood serum intrinsic fluorescence data processing and machine learning application. Talanta. 2025;283:127083. doi:10.1016/j.talanta.2024.127083
29. Liu Y, Yin Z, Wang Y, Chen H. Exploration and validation of key genes associated with early lymph node metastasis in thyroid carcinoma using weighted gene co-expression network analysis and machine learning. Front Endocrinol. 2023;14:1247709. doi:10.3389/fendo.2023.1247709
30. Simon N, Friedman J, Hastie T, Tibshirani R. Regularization paths for cox’s proportional hazards model via coordinate descent. J Stat Softw. 2011;39(5):1–13. doi:10.18637/jss.v039.i05
31. Kuhn M. Building predictive models in R using the caret package. J Stat Softw. 2008;28(5):1–26. doi:10.18637/jss.v028.i05
32. Qiao Y, Li C, Chen C, et al. Multi-target mechanism of compound Qingdai capsule for treatment of psoriasis: multi-omics analysis and experimental verification. Drug Des Devel Ther. 2025;19:5209–5230. doi:10.2147/DDDT.S523836
33. Chen SD, Lu CJ, Zhao RZ. Identification and quantitative characterization of PSORI-CM01, a Chinese medicine formula for psoriasis therapy, by liquid chromatography coupled with an LTQ Orbitrap mass spectrometer. Molecules. 2015;20(1):1594–1609. doi:10.3390/molecules20011594
34. Xie M, Zhang M, Qiao Y, et al. Molecular mechanism of PSORI-CM01 for psoriasis by regulating the inflammatory cytokines network. J Ethnopharmacol. 2024;318(Pt A):116935. doi:10.1016/j.jep.2023.116935
35. O’Boyle NM, Banck M, James CA, et al. Open babel: an open chemical toolbox. J Cheminformatics. 2011;3(1):33. doi:10.1186/1758-2946-3-33
36. Eberhardt J, Santos-Martins D, Tillack AF, Forli S. AutoDock vina 1.2.0: new docking methods, expanded force field, and python bindings. J Chem Inf Model. 2021;61(8):3891–3898. doi:10.1021/acs.jcim.1c00203
37. Yang Y, Qiao Y, Li C, Wang D, Gu J. Establishment and evaluation of psoriasis rat model with blood-heat syndrome and blood-stasis syndrome. World Sci Tech-Chin Med Mater Med. 2025;1–13. doi:10.11842/wst.20240724001
38. Tan H, Yin T, Wang J, et al. Establishment and evaluation on combination of disease and syndrome rat model of cerebral ischemia/reperfusion with qi deficiency blood stasis syndrome. Chin J Integr Med. 2018;38(07):832–837. doi:10.7661/j.cjim.20171201.295
39. Yang D, Jia Y, Zhang J. Discussion on the construction of psoriasis animal model based on blood-heat syndrome. Guiding J Tradit Chin Med Pharm. 2021;27(02):16–18+23. doi:10.13862/j.cnki.cn43-1446/r.2021.02.004
40. Luo Y, Ru Y, Zhao H, et al. Establishment of mouse models of psoriasis with blood stasis syndrome complicated with glucose and lipid metabolism disorders. Evid Based Complement Alternat Med. 2019;2019:6419509. doi:10.1155/2019/6419509
41. Abbas AH, Abbood MS, Ridha-Salman H, et al. Suppressive effect of topical moxifloxacin on imiquimod-induced model of psoriasis in mice. Naunyn-Schmiedeberg’s Arch Pharmacol. 2025. doi:10.1007/s00210-025-04317-2
42. Mohammed SS, Kadhim HM, Al-Sudani IM, Musatafa WW. Study the topical effect of six days use of different lycopene doses on imiquimod-induce psoriasis-like skin inflammation in Mice. Int J Health Sci-IJHS. 2022;171–185. doi:10.53730/ijhs.v6nS3.5241
43. Societies WFoCM. Diagnosis and treatment guidelines of psoriasis vulgaris in integrated chinese and western medicine. World Chin Med. 2024;19(17):2535–2544. doi:10.3969/j.issn.1673-7202.2024.17.00
44. Chen CL, Tseng PC, Satria RD, et al. Role of glycogen synthase kinase-3 in interferon-gamma-mediated immune hepatitis. Int J Mol Sci. 2022;23(9):4669. doi:10.3390/ijms23094669
45. Zhang H, Ni M, Wang H, et al. Gsk3beta regulates the resolution of liver ischemia/reperfusion injury via MerTK. JCI Insight. 2023;8(1):e151819. doi:10.1172/jci.insight.151819
46. Teng Y, Fan Y, Ma J, et al. The PI3K/Akt pathway: emerging roles in skin homeostasis and a group of non-malignant skin disorders. Cells. 2021;10(5):1219. doi:10.3390/cells10051219
47. Muller A, Dickmanns A, Resch C, et al. The CDK4/6-EZH2 pathway is a potential therapeutic target for psoriasis. J Clin Invest. 2020;130(11):5765–5781. doi:10.1172/JCI134217
48. Patel AB, Tsilioni I, Weng Z, Theoharides TC. TNF stimulates IL-6, CXCL8 and VEGF secretion from human keratinocytes via activation of mTOR, inhibited by tetramethoxyluteolin. Exp Dermatol. 2018;27(2):135–143. doi:10.1111/exd.13461
49. Khezri MR, Varzandeh R, Ghasemnejad-Berenji M. The probable role and therapeutic potential of the PI3K/AKT signaling pathway in SARS-CoV-2 induced coagulopathy. Cell Mol Biol Lett. 2022;27(1):6. doi:10.1186/s11658-022-00308-w
50. Loo WJ, Turchin I, Prajapati VH, et al. Clinical implications of targeting the JAK-STAT pathway in psoriatic disease: emphasis on the TYK2 pathway. J Cutan Med Surg. 2023;27(1_suppl):3s–24s. doi:10.1177/12034754221141680
51. Hu X, Li J, Fu M, Zhao X, Wang W. The JAK/STAT signaling pathway: from bench to clinic. Signal Transduct Target Ther. 2021;6(1):402. doi:10.1038/s41392-021-00791-1
52. Bazewicz CG, Dinavahi SS, Schell TD, Robertson GP. Aldehyde dehydrogenase in regulatory T-cell development, immunity and cancer. Immunology. 2019;156(1):47–55. doi:10.1111/imm.13016
53. Maimon A, Levi-Yahid V, Ben-Meir K, et al. Myeloid cell-derived PROS1 inhibits tumor metastasis by regulating inflammatory and immune responses via IL-10. J Clin Invest. 2021;131(10):e126089. doi:10.1172/JCI126089
54. Mosquera JV, Auguste G, Wong D, et al. Integrative single-cell meta-analysis reveals disease-relevant vascular cell states and markers in human atherosclerosis. Cell Rep. 2023;42(11):113380. doi:10.1016/j.celrep.2023.113380
55. Xu X, Zhang H, Chang A, et al. Astilbin alleviates IL-17-induced hyperproliferation and inflammation in HaCaT cells via inhibiting ferroptosis through the cGAS-STING pathway. Int J Mol Sci. 2025;26(11):5057. doi:10.3390/ijms26115075
56. Chen BL, Zhang WM, Dong XW, Liu JY, Bai YP. Quercetin induces keratinocytes apoptosis via triple inhibition of Notch, PI3K/AKT signaling and Glut1 in the treatment of psoriasis. Biochim Biophys Acta Mol Basis Dis. 2025;1871(6):167879. doi:10.1016/j.bbadis.2025.167879
57. Zhang M, Li N, Cai R, et al. Rosmarinic acid protects mice from imiquimod induced psoriasis-like skin lesions by inhibiting the IL-23/Th17 axis via regulating Jak2/Stat3 signaling pathway. Phytother Res. 2021;35(8):4526–4537. doi:10.1002/ptr.7155
 © 2025 The Author(s). This work is published and licensed by Dove Medical Press Limited. The
full terms of this license are available at https://www.dovepress.com/terms
and incorporate the Creative Commons Attribution
- Non Commercial (unported, 4.0) License.
By accessing the work you hereby accept the Terms. Non-commercial uses of the work are permitted
without any further permission from Dove Medical Press Limited, provided the work is properly
attributed. For permission for commercial use of this work, please see paragraphs 4.2 and 5 of our Terms.
© 2025 The Author(s). This work is published and licensed by Dove Medical Press Limited. The
full terms of this license are available at https://www.dovepress.com/terms
and incorporate the Creative Commons Attribution
- Non Commercial (unported, 4.0) License.
By accessing the work you hereby accept the Terms. Non-commercial uses of the work are permitted
without any further permission from Dove Medical Press Limited, provided the work is properly
attributed. For permission for commercial use of this work, please see paragraphs 4.2 and 5 of our Terms.