")
Back to Journals » Neuropsychiatric Disease and Treatment » Volume 20
Synapse-Related Serum and P300 Biomarkers Predict the Occurrence of Mild Cognitive Impairment in Depression
Authors Xue Z, Zhu X, Wu W, Zhu Y, Xu Y, Yu M
Received 5 November 2023
Accepted for publication 25 February 2024
Published 5 March 2024 Volume 2024:20 Pages 493—503
DOI https://doi.org/10.2147/NDT.S448312
Checked for plagiarism Yes
Review by Single anonymous peer review
Peer reviewer comments 2
Editor who approved publication: Dr Roger Pinder
Zongwei Xue,1,* Xiaoyan Zhu,2– 4,* Wenqi Wu,1 Yan Zhu,5 Yuhao Xu,1 Ming Yu1
1Department of Neurology, The Affiliated Hospital of Jiangsu University, Zhenjiang, Jiangsu, 212001, People’s Republic of China; 2Department of Neurology, People’s Hospital of Yangzhong City, Yangzhong, Jiangsu, 212299, People’s Republic of China; 3School of Clinical Medicine, Medical College of Yangzhou University, Yangzhou, Jiangsu, 225000, People’s Republic of China; 4Jiangsu Key Laboratory of Integrated Traditional Chinese and Western Medicine for Prevention and Treatment of Senile Diseases, Yangzhou, Jiangsu, 225000, People’s Republic of China; 5Department of Radiology, The Affiliated Hospital of Jiangsu University, Zhenjiang, Jiangsu, 212001, People’s Republic of China
*These authors contributed equally to this work
Correspondence: Yuhao Xu; Ming Yu, Department of Neurology, The Affiliated Hospital of Jiangsu University, No. 438 Jiefang Road, Zhenjiang, 212001, People’s Republic of China, Tel +86 187 9601 7221, Email [email protected]; [email protected]
Background: Cognitive impairment is one of the common concomitant symptoms of depression. The aims of the present study were to predict the occurrence of mild cognitive impairment (MCI) in patients with depression.
Methods: In this study, 217 patients with depression were recruited. Demographic data, serum indices and ERP indices from all participants were collected in the baseline period. The participants were followed for one year, and data from 200 patients were included in final analysis. Patients with depression were divided into those with MCI group (DWM group; n=145) and those without MCI (DWOM group; n=55). Data from the DWM group and the DWOM group were used to construct a logistic regression model, and a receiver operating characteristic (ROC) curve was drawn. Another 72 patients were used to validate the accuracy of our model.
Results: Compared with DWOM individuals, DWM individuals were more likely to live alone (P< 0.05), had lower baseline serum levels of brain-derived neurotrophic factor (BDNF), fibroblast growth factor 2 (FGF2), and fibroblast growth factor 22 (FGF22) (P< 0.05), and exhibited higher baseline latencies of P300, mismatch negativity (MMN), and N200 (P< 0.05). Baseline serum BDNF and FGF22 levels, along with the P300 latency, were selected to construct the regression model using logistic regression. The regression equation was , and the combination of the 3 indices yielded an area under the ROC curve (AUC) of 0.790 and a predictive accuracy of 0.806.
Conclusion: The logistic regression model and ROC curves based on serum BDNF and FGF22 levels and the P300 latency could provide a more effective means to predict the occurrence of MCI in patients with depression.
Keywords: depression, mild cognitive impairment, brain-derived neurotrophic factor, fibroblast growth factor 22, P300, prediction
Introduction
Depression is a highly prevalent psychological disorder characterized by a persistently depressed mood, and has diverse clinical manifestations dominated by affective and cognitive impairment.1 Cognitive deficits in depression can lead to impaired functioning in four areas, including executive function, attention, memory and information processing speed, which not only hinder the effectiveness and cure rate of antidepressant treatment and increases the risk of recurrence of depression, but also hinder some depressed individuals from returning to normal social functioning.2–4 However, in the clinical diagnosis and treatment of depression, the cognitive impairments are overlooked.
Cognitive deficits are widespread in the course of depression and can occur before the occurrence of depression or during episodes of depression or can persist after the episode of depression has resolved.5,6 Cognitive symptoms are major contributors to dysfunction in people with chronic depression who still participate in the workforce but unable to return to their previous levels of performance after recovery.7 A growing body of research suggests that cognitive symptoms, both subjective (self-reported) and objective (assessed using neuropsychological tests), are independently associated with different forms of functional impairment in patients with depression and that improvement in cognitive symptoms can reduce the degree of disability in patients.8 However, current interventions for cognitive impairment are limited, and available pharmacologic and nonpharmacologic treatments provide little benefit to patients after cognitive impairment has occurred. Therefore, early screening for cognitive impairment in depression is particularly important.
The synapse is the basic unit of brain structure and function and is the basis of neural information processing. Numerous studies in recent years have confirmed that the density and function of synapses are closely related to cognitive ability. Mecca et al9 demonstrated that disruption of synapses is the root cause of cognitive deficits in Alzheimer disease (AD) patients using PET imaging. Xu et al10 detected a significant decrease in synaptic plasticity in the hippocampus of early AD mice. These studies have also highlighted changes in synapse-associated factors in depressive cognitive disorders. Synapse formation and differentiation require the support of numerous neurotrophic factors. Brain-derived neurotrophic factor (BDNF), fibroblast growth factor 2 (FGF2) and fibroblast growth factor 22 (FGF22) induce hippocampal excitatory synapse formation, while fibroblast growth factor 7 (FGF7) induces inhibitory synapse formation.11–13 Measuring levels of these neurotrophic factors is undoubtedly important for assessing synaptic status. In addition, electroencephalography (EEG) is a highly sensitive technique that reflects changes in brain electrophysiology and function. Event-related potentials (ERPs), as transient reflections of excitatory and inhibitory postsynaptic potentials of pyramidal neurons in the cerebral cortex, can reflect the cognitive functions of patients performing specific tasks or processing information.14 Among them, the P300, mismatch negative (MMN) and N200 have been reported to be closely associated with cognitive impairment in different cognitive disorders.15,16
Mild cognitive impairment (MCI) is a highly unstable transitional state between normal cognition and dementia, encompassing multiple potential trajectories.17 MCI is the most common type of cognitive impairment in depression, and the most important node in cognitive disorders. There is an urgent need for a model to predict the occurrence of MCI in depression, thereby improving the intervention for cognitive impairment in depression patients, which is of great value for the progress and prognosis of depression. In this study, we longitudinally assessed the cognitive function of patients with depression over a period of one year. We analyzed serological indices of synapse formation and differentiation (BDNF, FGF2, FGF7, and FGF22) as well as ERP indices (P300, MMN, and N200) in patients with depression during the baseline period. Subsequently, we examined the predictive value of these baseline indices for the occurrence of MCI in patients with depression, in order to guide clinical prevention and treatment strategies for cognitive impairment in depression.
Methods and Materials
Participants
Patients with depression but without cognitive impairment who attended the Psychology Clinic of the Affiliated Hospital of Jiangsu University from January 2020 to December 2021 were included in the study. The inclusion criteria for patients were as follows: (1) diagnosed with depression according to the ICD-10 criteria, (2) had a Hamilton Depression Scale 24 (HAMD-24) score ≥8, (3) had normal cognitive function, with Montreal Cognitive Assessment (MoCA) score ≥26, (4) aged between 18 and 60 years, and (5) no recent upper respiratory tract infections, fever, or history of other infectious diseases within the past 2 weeks. The exclusion criteria were as follows: (1) symptoms of mental disorders caused by drugs or organic diseases; (2) previous or current suffered from other diseases that affect the function and structure of the brain; (3) previous or current suffered from other mental illnesses such as bipolar disorder and schizophrenia; and (4) other unsuitable conditions for enrollment, such as pregnancy, breastfeeding, or inability to cooperate and complete the examination. A total of 217 patients with depression were included. There were 104 males and 113 females; mean age was 42.36±11.24 years; years of education was 12.62±2.97 years; BMI was 23.95±3.88 kg/m2; all were right-handed; HAMD scores were 21.09±5.22 and MoCA scores were 28.00±1.41. Data on demographic characteristic, serum indices and ERP indices from all participants were collected in the baseline period. Referring to MCI diagnostic criteria as defined by the National Institute on Aging-Alzheimer’s Association workgroups,18 all patients received cognitive assessments once a month. The total follow-up period was 1 year. A total of 17 patients were excluded during the follow-up period, of whom 4 became pregnant, 6 had a stroke event, and 7 dropped out. Two hundred patients were ultimately enrolled. Patients with depression who developed MCI within 1 year were included in the depression with MCI (DWM) group, and those who did not develop MCI were included in the depression without MCI (DWOM) group. There were 145 patients in the DWM group and 55 patients in the DWOM group. The same recruitment criteria were used to recruit an independent validation cohort from the People’s Hospital of Yangzhong City, which included a total of 72 patients with depression. Demographic, serological and ERP data were collected. The same cognitive follow-up was performed for 1 year to observe the occurrence of MCI. The Institutional Review Board of the Affiliated Hospital of Jiangsu University approved the research protocol (Approval Number: SWYXLL20210401), and all participants have provided written informed consent.
Collection of Demographic Data
Baseline demographic data including age, sex, history of smoking, history of alcohol consumption, history of living alone, years of education, systolic blood pressure (SBP), diastolic blood pressure (DBP), sleep duration, body mass index (BMI), therapeutic drug uses, HAMD-24 scores and MoCA scores were collected. The MoCA scores at the time of MCI diagnosis were also recorded for each patient.
Examinations of Synapse-Related Serum Indices
All participants fasted overnight after enrollment, and five milliliters of fasting venous blood was collected early in the morning on the following day. The blood samples were kept at room temperature for approximately 30 min before serum separation by centrifugation at 3000 r/min for 10 min at 4°C. Serum samples were preserved at −80°C until further analysis. The baseline serum levels of BDNF (Proteintech, USA, Cat No. KE00096), FGF2 (Proteintech, USA, Cat No. KE00129), FGF7 (Abcam, Britain, Cat No. ab314148) and FGF22 (CUSABIO, China, Cat No. CSB-EL008628HU) in patients were measured using ELISA kits according to the manufacturer’s instructions.
Examinations of ERP
All participants underwent baseline ERP examinations. Electrodes were placed according to the international 10/20 system developed by the International Society for EEG, with the prefrontal electrode (FPz) grounded, the reference electrodes placed bilaterally on the mastoid process, and the recording electrode placed in the central midline (Cz) position. The test procedure was based on the classic oddball paradigm with short tones used as stimuli. The nontarget stimulus was a pure tone at 1000 Hz and 80 dB, with a probability of occurrence of 0.8, and the target stimulus was a pure tone at 2000 Hz and 85 dB, with a probability of occurrence of 0.2. Two rounds of tests were conducted. In round 1, participants were not required to memorize the deviant stimuli, and MMN data were collected. Round 2, participants had to silently memorize the number of deviant stimuli, and data on the P300 and N200 were collected. The recordings were repeated 3 times for each participant, and values were averaged for analysis.
Statistical Analysis
GraphPad Prism 9.0 (GraphPad Software Inc., USA) and SPSS 27.0 (IBM Corporation, Armonk, USA) were used to analyze the assay data and detect significant differences. Student’s t-test or χ2 test was used to compare baseline demographic characteristics, serum indices and ERP indices between groups. Then, the statistically significant baseline indices were selected as covariates, with cognitive outcomes at longitudinal follow-up serving as dependent variables (depression with MCI=1, depression without MCI=0); forward logistic stepwise regression analysis was employed to identify baseline factors influencing the occurrence of MCI in patients with depression. Prediction models were constructed using different combinations of the screened factors. The receiver operating characteristic (ROC) curve was utilized to assess the area under the curve (AUC), sensitivity, and specificity of the prediction model. Pearson correlation analysis was conducted to evaluate correlations between variables. The statistical significance threshold was set at P < 0.05 (two-tailed).
Results
Comparison of Demographic Characteristics Between the DWM Group and the DWOM Group
During the one-year follow-up period, we eventually included 200 patients diagnosed with depression for analysis, among which there were 145 depression patients who developed MCI (DWM group) and 55 depression patients who did not develop MCI (DWOM group). We set the predictive label (depression with MCI=1, depression without MCI=0) for subsequent logistic analysis. As shown in Table 1, there were no significant differences in age, sex, smoking history, drinking history, years of education, systolic blood pressure, diastolic blood pressure, sleep duration, BMI, therapeutic medications, HAMD-24 scores and MoCA scores in the baseline period between the DWM group and the DWOM group (P>0.05). However, the DWM group had a higher likelihood of a history of living alone than the DWOM group (P<0.05).
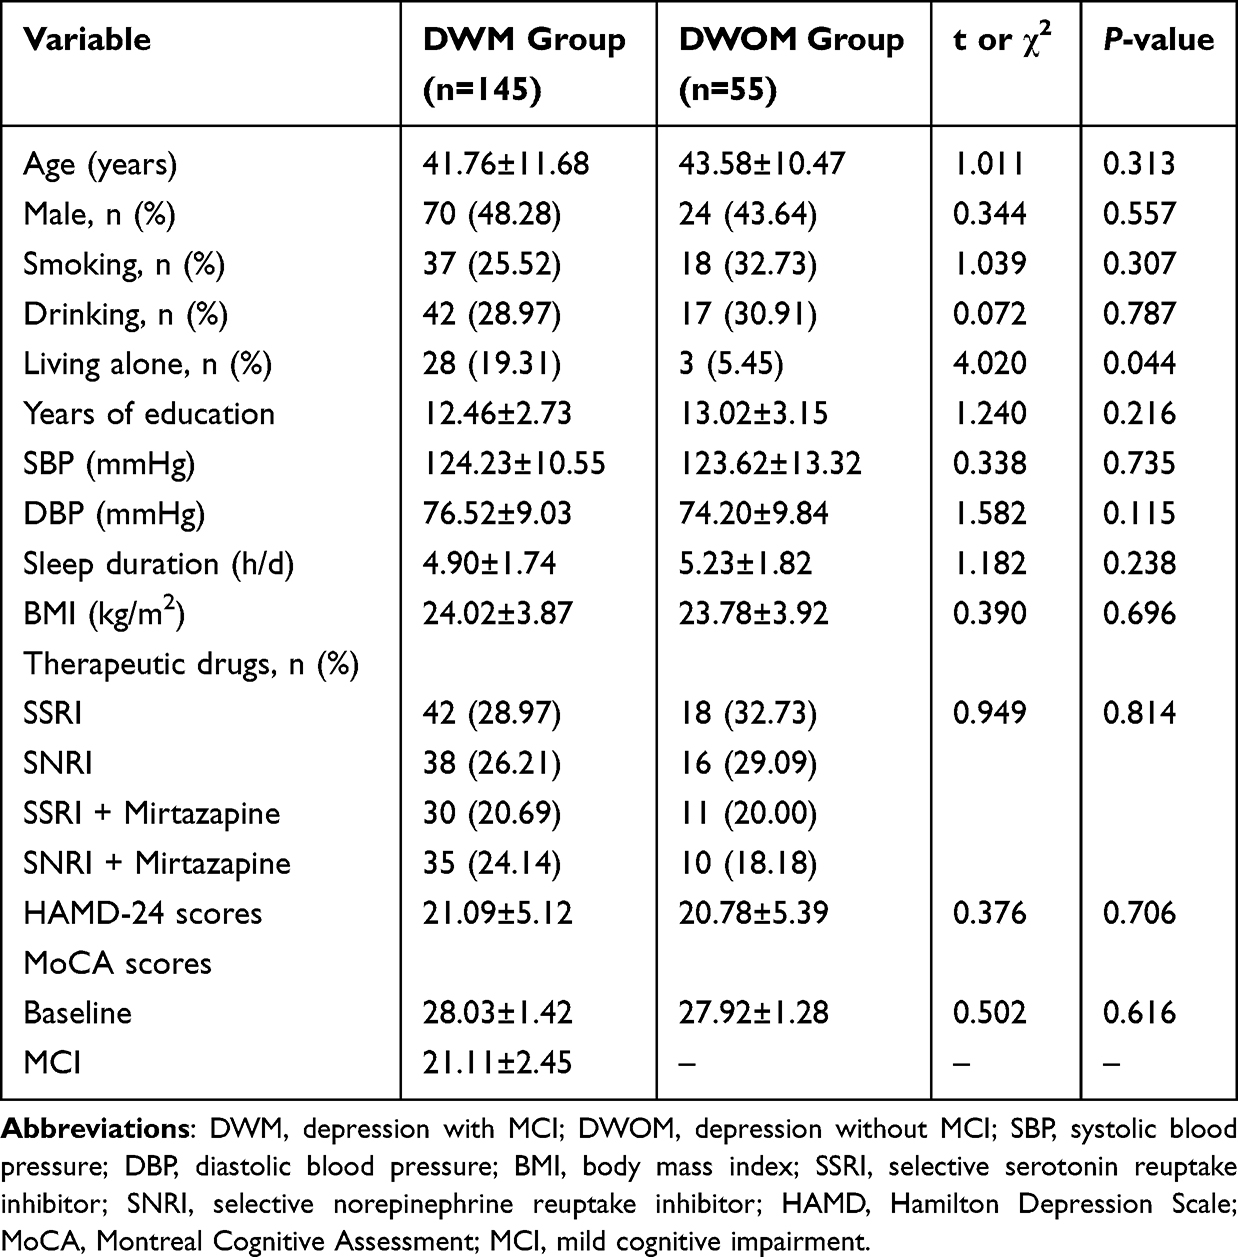 |
Table 1 Comparison of Demographic Characteristics Between the DWM Group and the DWOM Group |
Comparison of Baseline Synapse-Related Serum Indices Between the DWM Group and DWOM Group
As shown in Figure 1, baseline serum levels of BDNF, FGF2, and FGF22 were notably lower in the DWM group compared to the DWOM group (P<0.05). Conversely, serum FGF7 levels showed no significant difference between the DWM and DWOM groups (P>0.05).
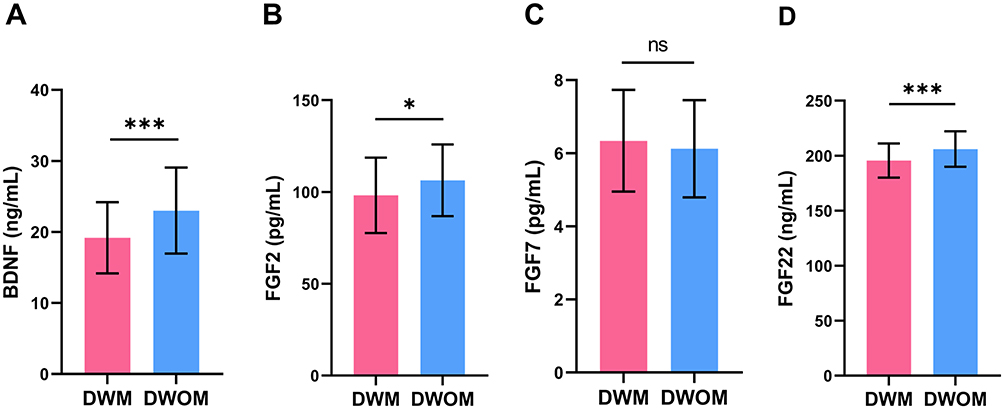 |
Figure 1 Comparison of baseline serum indices between DWM group and DWOM group. (A) The comparison of serum BDNF levels. (B) The comparison of serum FGF2 levels. (C) The comparison of serum FGF7 levels. (D) The comparison of serum FGF22 levels. Abbreviations: DWM, depression with MCI; DWOM, depression without MCI; BDNF, brain-derived neurotrophic factor; FGF2, fibroblast growth factor 2; FGF7, fibroblast growth factor 7; FGF22, fibroblast growth factor 22; ns, non-significant. Notes: *P<0.05, ***P<0.001. |
Comparison of Baseline ERP Indices Between the DWM Group and DWOM Group
As shown in Figure 2, the baseline latencies of P300, MMN, and N200 in the DWM group were significantly higher than those in the DWOM group (P<0.05). However, there was no significant difference in baseline amplitudes of P300, MMN, and N200 between the DWM and DWOM groups (P>0.05).
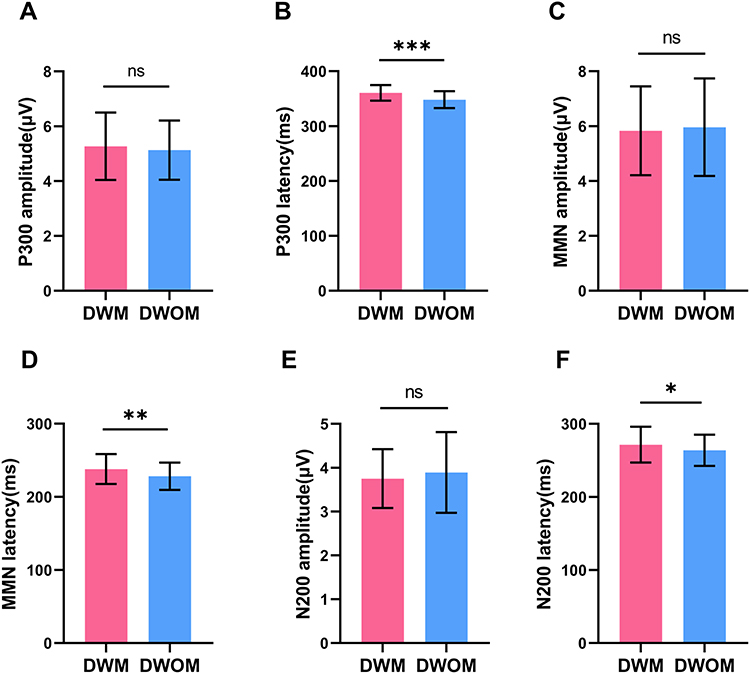 |
Figure 2 Comparison of baseline ERP indices between DWM group and DWOM group. (A) The comparison of P300 amplitude. (B) The comparison of P300 latency. (C) The comparison of MMN amplitude. (D) The comparison of MMN latency. (E) The comparison of N200 amplitude. (F) The comparison of N200 latency. Abbreviations: DWM, depression with MCI; DWOM, depression without MCI; MMN, mismatch negative; ns, non-significant. Notes: *P<0.05, **P<0.01, ***P<0.001. |
Logistic Regression Analysis of Baseline Factors Predicting the Occurrence of MCI
The cognitive outcomes obtained during follow-up were designated as the dependent variables (depression with MCI=1, depression without MCI=0). The 7 baseline indices including history of living alone, serum levels of BDNF, FGF2, and FGF22, as well as the latencies of P300, MMN, and N200, were included as independent variables in the forward logistic stepwise regression analysis. The step probability is set as follows: variables with a significance level of P≤0.05 are selected, while those with a significance level of P>0.10 are eliminated. The classification criterion value is set at 0.5, and the maximum number of iterations is limited to 20. The results are shown in Table 2. Serum BDNF and FGF22 levels protected against the occurrence of MCI. The partial regression coefficients were −0.103 and −0.172, respectively, and their corresponding P values were 0.002 and 0.001. The P300 latency was a risk factor for MCI. The partial regression coefficient was 0.164 and the P value was 0.003. The corresponding regression equation based on these 3 indices was  .
.
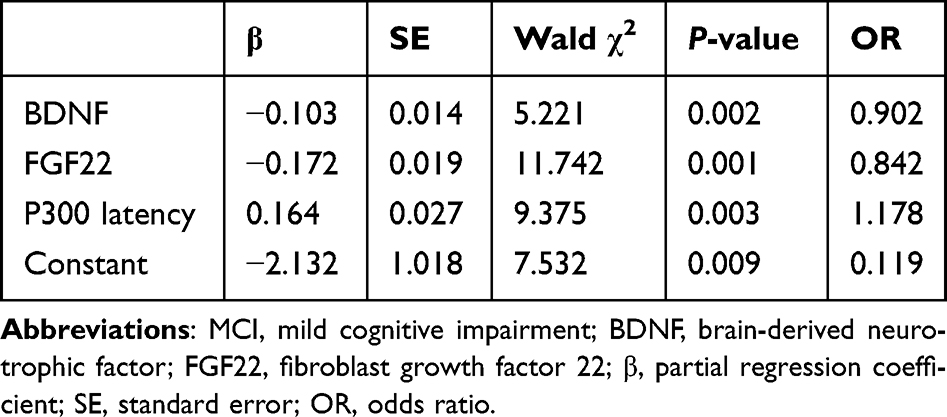 |
Table 2 Logistic Regression Analysis of Baseline Factors Influencing the Occurrence of MCI |
Correlation Analyses of the Relationships of MoCA Scores with Baseline Serum BDNF and FGF22 Levels and the P300 Latency in DWM Group
Pearson correlation analysis showed that the MoCA scores of patients at the time of MCI was positively correlated with baseline serum BDNF levels (r=0.612, P<0.001) (Figure 3A) and serum FGF22 levels (r=0.654, P<0.001) (Figure 3B) and negatively correlated with the baseline P300 latency (r=−0.636, P<0.001) (Figure 3C). The partial correlation coefficients of serum BDNF and FGF22 levels and the P300 latency with MoCA scores were 0.567, 0.608 and −0.587, respectively, after correcting for a history of living alone.
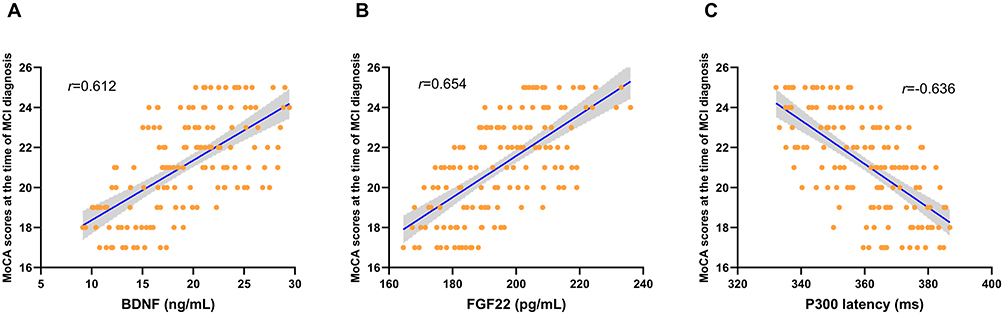 |
Figure 3 Correlation analysis of the relationships of MoCA scores at the time of MCI diagnosis with serum BDNF and FGF22 levels and the P300 latency in DWM group. (A) Scatterplot of the relationship between MoCA scores at the time of MCI diagnosis and serum BDNF levels. (B) Scatterplot of the relationship between MoCA scores at the time of MCI diagnosis and serum FGF22 levels. (C) Scatterplot of the relationship between MoCA scores at the time of MCI diagnosis and the P300 latency. Abbreviations: BDNF, brain-derived neurotrophic factor; FGF22, fibroblast growth factor 22; MoCA, Montreal Cognitive Assessment. |
ROC Curve Analysis
ROC curves of the indices in the logistic regression models were generated (Figure 4). The AUC, specificity, and sensitivity results for the individual and combined indices are shown in Table 3. The AUCs for serum BDNF and FGF22 levels and the P300 latency were 0.670, 0.690, and 0.694, respectively. The AUC for the combination of serum BDNF and FGF22 was 0.707. When combining serum BDNF and P300 latency, the AUC was 0.723, while combining serum FGF22 and P300 latency yielded an AUC of 0.755. The AUC for the combination of serum BDNF, FGF22, and P300 latency was 0.790. As shown in Table 3, the maximum AUC was achieved when combining serum BDNF, FGF22, and P300 latency, with a diagnostic sensitivity and specificity of 0.783 and 0.764, respectively.
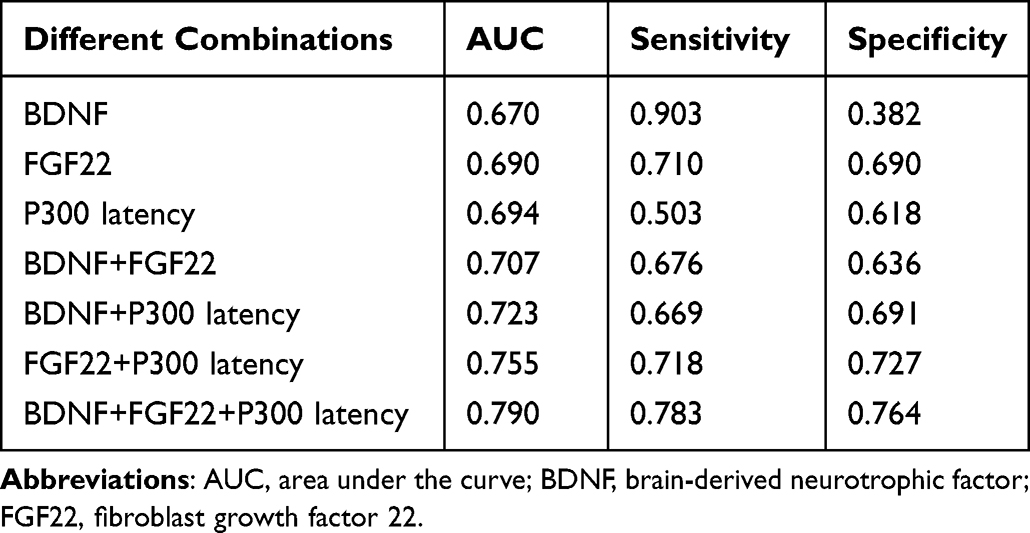 |
Table 3 Comparison of the Sensitivity, Specificity and AUC of Individual Indices and Combinations of Indices |
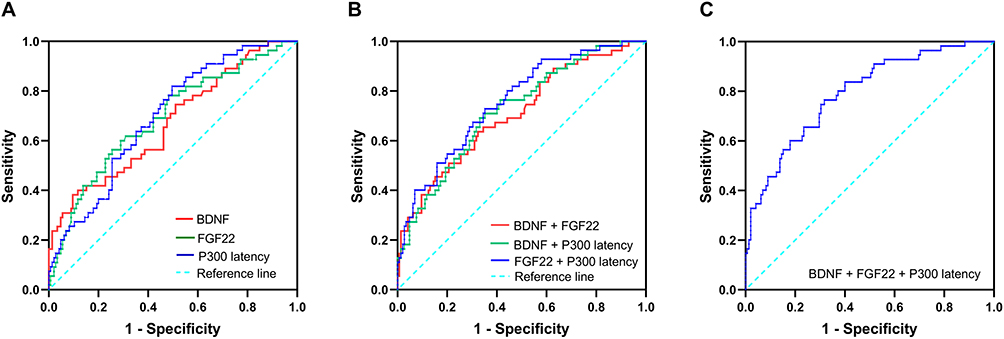 |
Figure 4 ROC curves of the detection power of different combinations of serum BDNF and FGF22 levels and the P300 latency. (A) ROC curves of BDNF, FGF22 and P300 latency. (B) ROC curves of BDNF+FGF22, BDNF+P300 latency and FGF22+P300 latency. (C) ROC curves of BDNF+FGF22+P300 latency. Abbreviations: ROC, receiver operating characteristic; BDNF, brain-derived neurotrophic factor; FGF22, fibroblast growth factor 22; ROC, receiver operating characteristic. |
Evaluation of the Logistic Regression Model
In the independent validation cohort, the incidence of MCI in patients with depression during 1 year of follow-up was 61.11% (44 patients developed MCI and 28 patients did not develop MCI). We conducted analyses to validate the predictive efficacy of the P300 latency, FGF22 + P300 latency, and BDNF + FGF22 + P300 latency. The results are shown in Table 4. Compared to the actual clinical results, the sensitivity, specificity and accuracy of the P300 latency were 0.523, 0.786 and 0.625, respectively. The sensitivity, specificity and accuracy of FGF22 + P300 latency were 0.727, 0.714 and 0.722, respectively. The sensitivity, specificity and accuracy of BDNF + FGF22 + P300 latency were 0.795, 0.821 and 0.806, respectively.
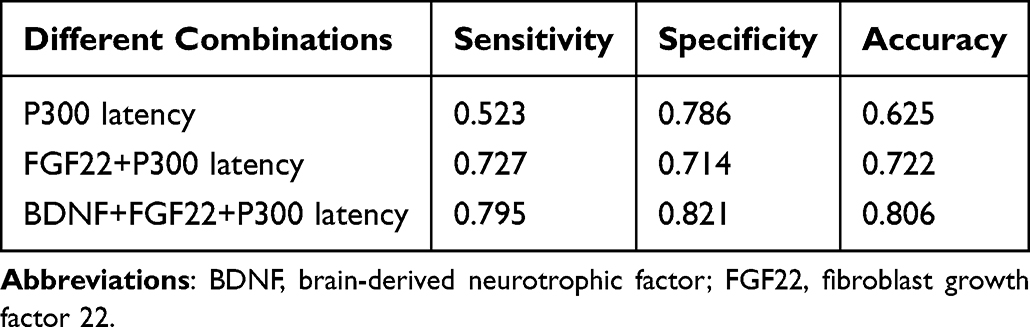 |
Table 4 Predictive Accuracy of Different Combinations of Indices |
Discussion
Regarding symptoms of depression, most clinical attention is devoted to affective symptoms, rather than cognitive symptoms.19 Although the majority of patients with depression report that cognitive symptoms have a significant impact on their daily lives, only a small proportion of these patients were asked about cognitive impairment during medical visits. Difficulty in recovering from cognitive dysfunction is an important constraint on full functional recovery in patients with depression, and antidepressant medication is limited in its ability to improve cognitive function.20 Therefore, the identification of cognitive impairment and early therapeutic intervention in depression patients is particularly important, especially regarding MCI, which has a high risk of conversion to dementia. This study is the first to longitudinally follow changes in cognitive function in patients with depression without cognitive impairment at baseline; we successfully constructed a logistic model based on baseline serum BDNF and FGF22 levels and the P300 latency that predicted the occurrence of MCI in patients with depression.
The results of the study showed that a history of living alone; serum BDNF, FGF2, and FGF22 levels; and latencies of P300, MMN, and N200 differed in the baseline period between the DWM and DWOM groups. Abnormalities in numerous synapse-related indices in the baseline period strongly suggest that synaptic damage occurred before the occurrence of MCI and had a significant impact on the development of MCI in patients with depression. Afterward, we confirmed by logistic regression that serum BDNF and FGF22 levels and the P300 latency in the baseline period independently influenced the occurrence of MCI in patients with depression. BDNF is the most widely expressed neurotrophic factor in the brain, and it has an important role in the maintenance of synaptic plasticity. Research has shown that BDNF promotes NMDA receptor phosphorylation in postsynaptic neurons in the hippocampus through specifically binding to tyrosine kinase receptor B (TrkB) receptors, rapidly increasing synaptic transmission between neurons, regulating synaptic plasticity, and participating in hippocampus-dependent learning and memory processes.21 In addition, FGF22 is a core factor that induces excitatory synapse formation.22 Terauchi et al23 found that excitatory synapses failed to form during hippocampal development in FGF22-knockout mice, which is closely associated with the development of depression. The results of the present study showed that serum BDNF and FGF22 levels in the DWM group were significantly lower than those in the DWOM group, confirming that lower levels of BDNF and FGF22 are closely related to the development of cognitive impairment and suggesting that more severe loss of excitatory synapses may occur in the DWM group in the early stages of depression. The P300 is one of the most studied ERPs, and its latency and amplitude have been utilized to evaluate cognitive processing of information. A meta-analysis by Jiang et al24 found that the P300 latency was more stable and sensitive than the P300 amplitude in cognitive assessment of MCI patients. In this study, we also found that serum BDNF and FGF22 levels and the P300 latency correlated with the severity of cognitive impairment after the occurrence of MCI in patients with depression, which further supports the critical influence of these three indices in the occurrence of cognitive impairment in depression. The combination of serum BDNF and FGF22 levels and the P300 latency yielded an AUC of 0.790 and a predictive accuracy of 0.806, which has practical clinical value. Meanwhile, we found that the ROC combining BDNF, FGF22 levels, and P300 latency had better AUC, sensitivity, and specificity. This may be because this combination better reflects synaptic damage from both serum and EEGee perspectives, thus providing better performance value than other combinations, which also suggests that considering synaptic-related indicators comprehensively may better predict the occurrence of MCI.
In addition, we considered economic factors. Since testing all 3 indices is expensive, we also analyzed the potential use of different combinations of BDNF levels, FGF22 levels and the P300 latency to identify a more cost-effective solution. The results showed that the accuracy rate of the P300 latency was 0.625, the accuracy rate of FGF22 + P300 latency was 0.722, and the accuracy rate of BDNF + FGF22 + P300 latency was of some application value. Thus, we recommend the use of FGF22 + P300 latency or BDNF + FGF22 + P300 latency to predict MCI occurrence in patients with depression. In addition, measurements of serum BDNF and FGF22 levels and the P300 latency are easy to carry out, which facilitates their clinical use and the promotion of early clinical screening and early interventions for cognitive impairment in patients with depression.
The present study was a preliminary exploratory study of a predictive model for the occurrence of MCI in patients with depression, and a number of issues may affect the interpretation of our results. Firstly, decision support tools derived from our comprehensive predictive models show promise but require validation with significantly larger samples than those utilized in the current study. Secondly, owing to the complexity of the pathogenesis and treatment of cognitive impairment in depression, the indices we selected may not offer sufficient insight, necessitating the development of more precise predictive models; further exploration is warranted.
Conclusion
Overall, our study indicated that the combination of serum BDNF and FGF22 levels and the P300 latency could objectively and effectively predict the occurrence of MCI in patients with depression within one year, which provides a more objective and effective method of predicting the occurrence of MCI in patients with depression. However, we also acknowledge that there is still much progress to be made. In future work, larger study samples are needed to validate our results and optimize our model to better predict and intervene in cognitive impairment in patients with depression.
Abbreviations
AD, Alzheimer disease; BDNF, brain-derived neurotrophic factor; FGF2, fibroblast growth factor 2; FGF7, fibroblast growth factor 7; FGF22, fibroblast growth factor 22; EEG, electroencephalography; ERP, event-related potential; MMN, mismatch negative; MCI, mild cognitive impairment; SBP, systolic blood pressure; DBP, diastolic blood pressure; ROC, receiver operating characteristic; AUC, area under the curve; BMI, body mass index; SSRI, selective serotonin reuptake inhibitor; SNRI, selective norepinephrine reuptake inhibitor; HAMD, Hamilton Depression Scale; MoCA, Montreal Cognitive Assessment; ns, non-significant.
Ethics Statement
The study was conducted in accordance with the Declaration of Helsinki and approved by the Institutional Review Board of the Affiliated Hospital of Jiangsu University in Zhenjiang, China (Approval Number: SWYXLL20210401). Informed consent was obtained from all subjects involved in the study.
Acknowledgments
The authors thank all patients, their families, and the investigators who participated in this study.
Author Contributions
All the authors made a significant contribution to the work reported, whether that is in the conception, study design, execution, acquisition of data, analysis and interpretation, or in all these areas; took part in drafting, revising or critically reviewing the article; gave final approval of the version to be published; have agreed on the journal to which the article has been submitted; and agree to be accountable for all aspects of the work.
Funding
This work was supported by National Natural Science Foundation of China (82101431), Key Project of Medical Research of Jiangsu Provincial Health and Health Commission (ZD2022062), Medical Education Collaborative Innovation Fund of Jiangsu University (No.JDY2023002), Scientific and Technological Innovation Funding Project of Zhenjiang City (SH2022039), Open Project of Jiangsu Key Laboratory of Integrated Traditional Chinese and Western Medicine for Prevention and Treatment of Senile Diseases (202210), Project of Introducing New Technologies for Elderly Health of Jiangsu Provincial Health Commission (LX2021018), Scientific Research Project of Jiangsu Maternal and Child Health Association (FYX202006); Incubation Project of Zhenjiang City Hierarchical Diagnostic and Treatment Innovative Project (2021ZDX07), Scientific Research Project of Zhenjiang City “169 Project”, CSA Cerebrovascular Disease Innovation Medical Research Fund.
Disclosure
The authors report no conflicts of interest in this work.
References
1. Price RB, Duman R. Neuroplasticity in cognitive and psychological mechanisms of depression: an integrative model. Mol Psychiatry. 2020;25(3):530–543. doi:10.1038/s41380-019-0615-x
2. Matcham F, Simblett SK, Leightley D, et al. The association between persistent cognitive difficulties and depression and functional outcomes in people with major depressive disorder. Psychol Med. 2023;53(13):6334–6344. doi:10.1017/S0033291722003671
3. Porter RJ, Douglas KM. Cognitive impairment in people remitted from major depression. Lancet Psychiatry. 2019;6(10):799–800. doi:10.1016/S2215-0366(19)30278-0
4. Semkovska M, Quinlivan L, O’Grady T, et al. Cognitive function following a major depressive episode: a systematic review and meta-analysis. Lancet Psychiatry. 2019;6(10):851–861. doi:10.1016/S2215-0366(19)30291-3
5. Kriesche D, Woll CFJ, Tschentscher N, Engel RR, Karch S. Neurocognitive deficits in depression: a systematic review of cognitive impairment in the acute and remitted state. Eur Arch Psychiatry Clin Neurosci. 2023;273(5):1105–1128. doi:10.1007/s00406-022-01479-5
6. Wang G, Si TM, Li L, et al. Cognitive symptoms in major depressive disorder: associations with clinical and functional outcomes in a 6-month, non-interventional, prospective study in China. Neuropsychiatr Dis Treat. 2019;15:1723–1736. doi:10.2147/NDT.S195505
7. Kaser M, Zaman R, Sahakian BJ. Cognition as a treatment target in depression. Psychol Med. 2017;47(6):987–989. doi:10.1017/S0033291716003123
8. Sociali A, Borgi M, Pettorruso M, et al. What role for cognitive remediation in the treatment of depressive symptoms? A superiority and noninferiority meta-analysis for clinicians. Depress Anxiety. 2022;39(7):586–606. doi:10.1002/da.23263
9. Mecca AP, O’Dell RS, Sharp ES, et al. Synaptic density and cognitive performance in Alzheimer’s disease: a PET imaging study with [11 C]UCB-J. Alzheimers Dement. 2022;18(12):2527–2536. doi:10.1002/alz.12582
10. Xu L, Zhou Y, Hu L, et al. Deficits in N-Methyl-D-Aspartate receptor function and synaptic plasticity in hippocampal CA1 in APP/PS1 mouse model of Alzheimer’s disease. Front Aging Neurosci. 2021;13:772980. doi:10.3389/fnagi.2021.772980
11. Wang CS, Kavalali ET, Monteggia LM. BDNF signaling in context: from synaptic regulation to psychiatric disorders. Cell. 2022;185(1):62–76. doi:10.1016/j.cell.2021.12.003
12. Gupta S, M-Redmond T, Meng F, et al. Fibroblast growth factor 2 regulates activity and gene expression of human post-mitotic excitatory neurons. J Neurochem. 2018;145(3):188–203. doi:10.1111/jnc.14255
13. Terauchi A, Timmons KM, Kikuma K, Pechmann Y, Kneussel M, Umemori H. Selective synaptic targeting of the excitatory and inhibitory presynaptic organizers FGF22 and FGF7. J Cell Sci. 2015;128(2):281–292. doi:10.1242/jcs.158337
14. Babiloni C, Blinowska K, Bonanni L, et al. What electrophysiology tells us about Alzheimer’s disease: a window into the synchronization and connectivity of brain neurons. Neurobiol Aging. 2020;85:58–73. doi:10.1016/j.neurobiolaging.2019.09.008
15. Tarawneh HY, Mulders WHAM, Sohrabi HR, Martins RN, Jayakody DMP. Investigating auditory electrophysiological measures of participants with mild cognitive impairment and alzheimer’s disease: a systematic review and meta-analysis of event-related potential studies. J Alzheimers Dis. 2021;84(1):419–448. doi:10.3233/JAD-210556
16. Fitzgerald K, Todd J. Making sense of mismatch negativity. Front Psychiatry. 2020;11:468. doi:10.3389/fpsyt.2020.00468
17. Deardorff WJ, Lee SJ. Mild cognitive impairment as a clinical and research outcome: ready for prime time? J Am Geriatr Soc. 2022;70(5):1361–1364. doi:10.1111/jgs.17744
18. Albert MS, DeKosky ST, Dickson D, et al. The diagnosis of mild cognitive impairment due to Alzheimer’s disease: recommendations from the National Institute on Aging-Alzheimer’s Association workgroups on diagnostic guidelines for Alzheimer’s disease. Alzheimers Dement. 2011;7(3):270–279. doi:10.1016/j.jalz.2011.03.008
19. Czerwińska A, Pawłowski T. Cognitive dysfunctions in depression - significance, description and treatment prospects. Psychiatr Pol. 2020;54(3):453–466. doi:10.12740/PP/OnlineFirst/105415
20. Shilyansky C, Williams LM, Gyurak A, Harris A, Usherwood T, Etkin A. Effect of antidepressant treatment on cognitive impairments associated with depression: a randomised longitudinal study. Lancet Psychiatry. 2016;3(5):425–435. doi:10.1016/S2215-0366(16)00012-2
21. Numakawa T, Kajihara R. Neurotrophins and other growth factors in the pathogenesis of Alzheimer’s disease. Life. 2023;13(3):647. doi:10.3390/life13030647
22. Terauchi A, Johnson-Venkatesh EM, Bullock B, Lehtinen MK, Umemori H. Retrograde fibroblast growth factor 22 (FGF22) signaling regulates insulin-like growth factor 2 (IGF2) expression for activity-dependent synapse stabilization in the mammalian brain. Elife. 2016;5:e12151. doi:10.7554/eLife.12151
23. Terauchi A, Johnson-Venkatesh EM, Toth AB, Javed D, Sutton MA, Umemori H. Distinct FGFs promote differentiation of excitatory and inhibitory synapses. Nature. 2010;465(7299):783–787. doi:10.1038/nature09041
24. Jiang S, Qu C, Wang F, et al. Using event-related potential P300 as an electrophysiological marker for differential diagnosis and to predict the progression of mild cognitive impairment: a meta-analysis. Neurol Sci. 2015;36(7):1105–1112. doi:10.1007/s10072-015-2099-z
 © 2024 The Author(s). This work is published and licensed by Dove Medical Press Limited. The full terms of this license are available at https://www.dovepress.com/terms.php and incorporate the Creative Commons Attribution - Non Commercial (unported, v3.0) License.
By accessing the work you hereby accept the Terms. Non-commercial uses of the work are permitted without any further permission from Dove Medical Press Limited, provided the work is properly attributed. For permission for commercial use of this work, please see paragraphs 4.2 and 5 of our Terms.
© 2024 The Author(s). This work is published and licensed by Dove Medical Press Limited. The full terms of this license are available at https://www.dovepress.com/terms.php and incorporate the Creative Commons Attribution - Non Commercial (unported, v3.0) License.
By accessing the work you hereby accept the Terms. Non-commercial uses of the work are permitted without any further permission from Dove Medical Press Limited, provided the work is properly attributed. For permission for commercial use of this work, please see paragraphs 4.2 and 5 of our Terms.