Back to Journals » Journal of Inflammation Research » Volume 15
Sustained Inflammation Induced by LPS Leads to Tolerable Anorexia and Fat Loss via Tlr4 in Mice
Authors Yang Y, Zhong W, Zhang Y, Cheng Y, Lai H, Yu H, Feng N, Han Y, Huang R, Zhai Q
Received 31 January 2022
Accepted for publication 6 September 2022
Published 1 October 2022 Volume 2022:15 Pages 5635—5648
DOI https://doi.org/10.2147/JIR.S358518
Checked for plagiarism Yes
Review by Single anonymous peer review
Peer reviewer comments 2
Editor who approved publication: Professor Ning Quan
Yale Yang,1 Wuling Zhong,1 Yali Zhang,1 Yalan Cheng,1 Hejin Lai,1 Huimin Yu,1 Ning Feng,1 Yumo Han,2 Rui Huang,1 Qiwei Zhai1,2
1CAS Key Laboratory of Nutrition, Metabolism and Food Safety, Shanghai Institute of Nutrition and Health, University of Chinese Academy of Sciences, Chinese Academy of Sciences, Shanghai, People’s Republic of China; 2School of Life Science and Technology, ShanghaiTech University, Shanghai, People’s Republic of China
Correspondence: Qiwei Zhai, Shanghai, 200031, People’s Republic of China, Tel +86 21 5492 0903, Fax +86 21 5492 0291, Email [email protected]
Background: Sustained inflammation is implicated in a variety of pathological conditions like infection, obesity and type 2 diabetes. Lipid metabolism is crucial to support immune response during infection of bacteria. However, how sustained inflammation affects lipid metabolism, especially in white adipose tissue remains largely unknown.
Methods: Sustained inflammation was induced by daily injection of Lipopolysaccharide (LPS). Tlr4 knockout mice were used to study the mechanism. Inflammation and lipid metabolism were evaluated by quantitative PCR, white blood cell counting, nuclear magnetic resonance, fat cell size quantification, lipolysis and fatty acid uptake assays, respiratory exchange ratio, and energy expenditure.
Results: Here, we found that sustained inflammation leads to fat loss in mice with a quick loss and gradual increase manner. Moreover, LPS injection leads to inflammation, anorexia, decreased lipid anabolism, and increased lipid catabolism. Mechanically, we show that LPS induces fat loss, inflammation, anorexia, and alteration of lipid metabolism mainly dependent on Tlr4. Interestingly, sustained inflammation induces less fat loss, especially in epididymal white adipose tissue, than pair-feeding, and pair-feeding has no significant effect on inflammation and leads to less fatty acid uptake, more lipid catabolism and energy expenditure than LPS injection. In addition, we demonstrate that short-term sustained inflammation leads to relative long-term tolerance for LPS-induced anorexia, inflammation and altered lipid metabolism.
Conclusion: These findings demonstrate that sustained inflammation induced by LPS leads to tolerable anorexia and fat loss via Tlr4 in mice, and provide new insights into the effect of sustained inflammation on lipid metabolism and subsequent tolerance.
Keywords: sustained inflammation, lipopolysaccharide, white adipose tissue, lipid metabolism, tolerance
Introduction
The interactions between immune response and metabolism are evolutionarily conserved.1,2 The immune system defends against pathogens and maintains tissue homeostasis, which is bioenergetically expensive, requiring precise control of cellular metabolic pathways and reallocation of nutrients.3,4 Infection leads to profound alterations in whole-body metabolism, which is characterized by markedly accelerated flux of glucose, fat and protein.5 Inflammatory stimuli, such as LPS, IL-1β, TNF-α, and saturated fatty acids, have been reported to influence lipid metabolism in liver, skeletal muscle, and adipose tissue.6 LPS injection as little as 0.1 μg/kg body weight through tail vein rapidly induced changes in lipid metabolism and led to hypertriglyceridemia in rats.7,8 Injection with LPS intraperitoneally at a dose of 5 mg/kg body weight in mice led to acute inflammation, decreased body weight from about 23 g to 20 g, and decreased epididymis fat weight from about 336 mg to 259 mg 24 h later.9 Sustained inflammation is implicated in a variety of pathological conditions like infection, obesity, type 2 diabetes, and atherosclerosis.10,11 LPS injected intravenously at a dose of 0.1 mg/kg increased the lipolysis in epididymal adipose tissues via Tlr4 in mice.12 Although it is well-known that LPS injection can lead to acute inflammation and alteration of lipid metabolism, the effect of sustained inflammation induced by LPS on lipid metabolism is still largely unknown. It has been reported that sustained inflammation induced by intraperitoneal LPS injection at a dose of 1.5 mg/kg/day for one week has been reported to affect hepatic mevalonate pathway and lead to hyperglycemia in mice.11 However, the effect of sustained inflammation induced by LPS on lipid metabolism in white adipose tissue and the underlying molecular mechanisms need further investigation.
The host organism can protect itself from infectious diseases by reducing the negative impact of infections on host fitness, and this ability to tolerate a pathogen’s presence is a very important host defense strategy to preserve homeostasis.13,14 Prolonged or repeated exposure to LPS induces a state of tolerance that reprograms the inflammatory response, resulting in reduced inflammatory cytokine production in vitro and in vivo.15,16 LPS stimulation for 12–24 h led to an inability to induce Il-6 and Il-1β mRNA after a second LPS challenge due to decreased glucose oxidation and acetyl-CoA production in mouse bone marrow-derived macrophages.17 LPS-tolerant RAW 264.7 mouse macrophage cells have significantly decreased secretion of inflammatory cytokines and decreased glycolysis and oxygen consumption rate upon LPS treatment.18 Macrophages differentiated from LPS-treated monocytes showed decreased TNF-α and IL-6 release following LPS stimulation.19 Injection of LPS at a dose of 100 μg/kg body weight blocked LPS-induced hypophagia in rats.20,21 Injection of LPS at a dose of 0.5 mg/kg body weight resulted in low LPS-induced anorexic effects in rats.22 Endotoxin tolerance developed during five consecutive LPS administrations as demonstrated by the attenuated release of proinflammatory cytokines on the fifth day in humans.23 LPS-tolerant mice induced by daily injections of 1.4 mg/kg body weight of LPS on day 1 to day 4 was unable to produce circulating TNF-α and IL-6 when LPS injected on day 6. However, whether sustained inflammation induced by LPS will lead to subsequent tolerance to the effect of LPS on lipid metabolism is yet to be elucidated.
Here, we investigated the effect of sustained inflammation induced by LPS on lipid metabolism in mouse white adipose tissue and subsequent tolerance. We found that sustained inflammation induced by daily injection of LPS leads to fat loss mainly due to anorexia, inhibited lipid anabolism and enhanced lipid catabolism in a Tlr4-dependent manner. Interestingly, LPS induces less fat loss than pair-feeding mainly due to less energy expenditure. Finally, we show short-term sustained inflammation leads to relative long-term tolerance to anorexia, inflammation and fat loss. These findings provide new insights into the effect of sustained inflammation on lipid metabolism and subsequent tolerance.
Materials and Methods
Animals
All animals were maintained and used in accordance with the guidelines of the Institutional Animal Care and Use Committee of the Shanghai Institute of Nutrition and Health. Before conducting the animal experiment, the committee reviewed and approved our study protocol (Protocol number SIBS-2017-ZQW-1, SIBS-2019-ZQW-1, SIBS-2020-ZQW-1). C57BL/6J male mice were purchased from Slac (Shanghai, China), and C57BL/10J and Tlr4−/− male mice on a C57BL/10J background were obtained from GemPharmatech. The genotype of mice was confirmed by PCR analysis of genomic DNA from mouse tail using the following primer pairs. ATATGCATGATCAACACCACAG and TTTCCATTGCTGCCCTATAG, GCAAGTTTCTATATGCATTCTC and CCTCCATTTCCAATAGGTAG. Except indicated, mice were maintained on a 12-h light/dark cycle with free access to water and standard rodent chow.
LPS Injection
Mice at the age of 9–10 weeks were intraperitoneally injected with saline or LPS from E. coli 0111:B4 or E. coli 055:B5 (Sigma-Aldrich) at the indicated dose once a day. To study the tolerance of LPS, mice at the age of 9–10 weeks were intraperitoneally injected with LPS from E. coli 0111:B4 at a dose of 0.8 mg/kg body weight once a day or without injection for one week. After 0, 1, 2, 3 or 4 weeks, the mice were injected with LPS at a dose of 0.8 mg/kg body weight once a day for one or three days.
Food Intake, Body Weight and Fat Mass Measurement by NMR
Food intake was measured at ZT3. Body weight and fat mass of mice were measured at ZT8. Fat and lean mass of non-anesthetized live mice were detected by NMR using a body composition analyzer (EchoMRI™-100H).
Tissue Samples Collection
Mice were anesthetized with 6% chloral hydrate at indicated time and tissues of interest were excised, weighed, photographed, and then fixed in 4% paraformaldehyde or snap-frozen in liquid nitrogen immediately and subsequently stored at −80°C.
Hematoxylin and Eosin Staining and Fat Cell Size Quantification
White adipose tissues and liver were fixed in 4% paraformaldehyde for 24–48 h at 4°C, dehydrated, embedded into paraffin and sectioned for hematoxylin and eosin (H&E) staining. Fat cell size was quantified by measurement of average adipocyte area using ImageJ software (version 1.51).
Measurements of Alanine Transaminase and Aspartate Transaminase Activity
The blood samples were collected and centrifuged to collect serum. Serum alanine transaminase (ALT) and aspartate transaminase (AST) activity were determined by enzymatic assay kits (Shensuo Unf Medical Diagnostics).
RNA Isolation and Quantitative PCR
Total RNA was extracted with TRIzol reagent (Thermo) and then 2 μg total RNA was reverse transcribed to cDNA using MMLV reverse transcriptase (Promega) with random hexamer primers. qPCR was performed with ABI Prism 7900 sequence detection system using Fast Start Universal SYBR Green Master (Roche). The expression levels were normalized to Gapdh. Primers were as follows: GTGCCGCCTGGAGAAACCT and TGAAGTCGCAGGAGACAACC for mouse Gapdh, TAGTCCTTCCTACCCCAATTTCC and TTGGTCCTTAGCCACTCCTTC for mouse Il-6, GCAACTGTTCCTGAACTCAACT and ATCTTTTGGGGTCCGTCAACT for mouse Il-1β, CCCTCACACTCAGATCATCTTCT and GCTACGACGTGGGCTACAG for mouse Tnf-α, TGGATGCCACAGCTGACTAC and GGTTCAGCAAGGTCAGCTTC for Acl, CCTTGGAGAAGTGCCGAGAG and CAGCAGATCTGGACATCTGGAC for mouse Acss2, GCTGCGGAAACTTCAGGAAAT and AGAGACGTGTCACTCCTGGACTT for mouse Fas, GAAAAGCAGTTCAACGAGAACG and AGATGCCGACCACCAAAGATA for mouse Elovl6, TTCTTGCGATACACTCTGGTGC and CGGGATTGAATGTTCTTGTCGT for mouse Scd1, GCGCTACTTCCGAGACTACTT and GGGCCTTATGCCAGGAAACT for mouse Dgat2. CTTTGGCTATGGGCTTCCAGTC and GCAAGGAGGACAGAGTTTATCGTG for mouse F4/80, AGTGGGTCAAGGAACAGAAGCA and CTTTACCAGCTCATTTCTCACC for Tlr4.
Fatty Acid Uptake
About 40 mg white adipose tissue from mice was cut into small pieces, and incubated at 37°C on a shaker at 80 rpm for 1 h in 1.5 mL Hank’s solution (140 mM NaCl, 5 mM KCl, 0.3 mM Na2HPO4, 0.4 mM KH2PO4, 4 mM NaHCO3, 1 mM CaCl2, 0.4 mM MgSO4, 0.5 mM MgCl2, 6 mM glucose) supplemented with 0.4 mg/mL collagenase (Sigma), 2% fatty acid free BSA (Equitech-Bio) and 0.1% glucose. Then the samples were filtered with 100 μm cell strainer (Corning), and centrifuged at 23×g for 2 min. The floating layer containing the adipocytes was transferred into 10 mL Hank’s buffer, and centrifuged at 48×g for 2 min. The floating layer was transferred into a new tube containing 300 μL Hank’s solution supplemented with 1mg/mL BODIPY 500/510 C1, C12 (Invitrogen) and 1% fatty acid-free BSA, briefly mixed, and incubated at 37°C for 5 min. The samples were filtered with 40 μm cell strainer (Corning) to keep the adipocytes on the mesh, and then the adipocytes were lysed with 200 μL 0.3 M NaOH to detect the fluorescence intensity of BODIPY 500/510 C1, C12.
Lipolysis Assay
Lipolysis assay was performed as described previously with modification.24 About 30 mg white adipose tissue from mice were dissected and incubated in 400 µL of KRB buffer (12 mM HEPES, 121 mM NaCl, 4.9 mM KCl, 1.2 mM MgSO4, and 0.33 mM CaCl2) containing 2% fatty acid-free BSA and 0.1% glucose with or without 10 µM isoproterenol (Sigma) at 37°C for 1 h. The KRB buffer was collected and used for fatty acid and free glycerol analysis with NEFA assay Kit (Shensuo Unf Medical Diagnostics) and Free Glycerol Reagent (Sigma), respectively. The levels of fatty acid and free glycerol were normalized to the weight of tissue samples.
Immunohistochemistry
Epididymal white adipose tissue was fixed in 4% paraformaldehyde and embedded in paraffin. Paraffin-embedded adipose tissues were cut into 4 μm sections and placed onto slides. Sections were deparaffinized, rehydrated in graded mixtures of ethanol/water, pretreated in boiling citrate buffer (pH 6.0), and endogenous peroxidase activity was blocked with 3% H2O2 for 30 min at room temperature. The sections were washed and incubated with antibody against F4/80 (Cell Signaling Technology) for 1 h at room temperature. Then, the sections were washed, incubated with Horseradish peroxidase-conjugated secondary antibody for 30 min, and then washed with PBS and stained by diaminobenzidine tetrahydrochloride (Gene Tech). Subsequently, the sections were counterstained with hematoxylin.
Metabolic Rate and Physical Activity Measurement
Metabolic rate and physical activity of mice were measured using a multi-chamber environment-controlled comprehensive lab animal monitoring system (Columbus Instruments). Mice were acclimatized to the cages for at least one day before recording. Respiratory exchange ratio refers to the volume of CO2 produced per volume of O2 consumed (both in L/h). Energy expenditure (or heat) was calculated as the product of the calorific value of oxygen (3.815 + 1.232 × respiratory quotient) and the volume of O2 consumed.25
White Blood Cell Counting
The blood samples from mouse tail vein were mixed with an equal volume of 0.5 M EDTA to avoid clotting, and used for white blood cell counting with an automated hematology analyzer (Mindray BC-2800Vet).
Statistical Analysis
Except indicated, data are expressed as mean ± SD of at least three independent experiments. Statistical significance was assessed by Student’s t-test. Differences were considered statistically significant at P < 0.05.
Results
Sustained Inflammation Leads to Fat Loss in Mice
To investigate whether sustained inflammation affects lipid metabolism, we devised a model whereby C57BL/6J male mice at the age of 9–10 weeks were given daily injection of low-dose LPS for 7 days. Both LPS from E. coli 0111:B4 and 055:B5 reduced body weight and fat mass of mice after injection for 7 days (Figure 1A and B). Moreover, LPS reduced body weight and fat mass of mice after injection for 7 days in a dose-dependent manner (Figure 1C and D). Interestingly, when body weight and fat mass were monitored daily, we found that the body weight and fat mass of mice with daily injection of LPS were gradually decreased from day 1 to day 2, and then gradually increased from day 3 to day 7 (Figure 1E and F). Consistently, the epididymal white adipose tissue (eWAT) and inguinal white adipose tissue (iWAT) from the mice with daily injection of LPS have similar time-dependent morphological and weight changes (Figure 1G–I). Hematoxylin and eosin (H&E) staining revealed that LPS injection reduced the size of adipocytes in eWAT first and then increased the size of adipocytes (Figure 1J and K). In addition, we found that LPS injection once a day for 3 days had no significant effect on morphology and weight of liver, hepatocyte size and serum ALT and AST activity levels (Figure 1L–O). These data demonstrate that sustained inflammation induced by LPS leads to fat loss in mice with a quick loss and gradual increase manner.
 |
Figure 1 LPS injection induces fat loss in mice. (A and B) Injection with LPS from E. coli 0111:B4 (B4) and 055:B5 (B5) at a dose of 1.5 mg/kg body weight once a day for 7 days decreased the body weight (A) and fat mass (B) of 9-week-old male C57BL/6 mice. (C and D) Injection with LPS once a day for 7 days dose-dependently downregulated the body weight (C) and fat mass (D) of mice. For this and the following experiments, LPS from E. coli 0111:B4 was used. (E and F) The time response of injection with LPS once a day for 7 days on the body weight (E) and fat mass (F) of mice. For this and the following experiments, LPS at a dose of 0.8 mg/kg body weight was used. D0-D7, Day 0 to Day 7. (G) Representative images of epididymal white adipose tissue (eWAT) and inguinal white adipose tissue (iWAT) from mice in (E). Scale bar, 0.5 cm. (H and I) The weight of eWAT and iWAT in (G). (J) Representative images of hematoxylin and eosin (H&E) staining of eWAT in (G). Scale bar, 50 μm. (K) Quantification of adipocyte size in (J). (L and M) Images and weight of livers from mice injected with saline or LPS once a day for three days. Scale bar, 0.5 cm. (N) Representative images of H&E-stained sections of liver in (L). Scale bar, 50 μm. (O) Serum ALT and AST levels of mice injected with saline or LPS once a day for three days. *, p < 0.05; **, p < 0.01; ***, p < 0.001; versus D0 except indicated. |
LPS Induces Inflammation and Anorexia, Decreases Lipid Anabolism and Increases Lipid Catabolism
The inflammation induced by LPS was confirmed by qPCR to monitor the transcriptional level of inflammatory factors. As expected, LPS led to dramatic increases of Il-6, Il-1β and Tnf-α mRNA levels in eWAT, and also led to moderate increases of Il-6, Il-1β and Tnf-α mRNA levels in liver (Figure 2A and B). Moreover, immunostaining and qPCR analysis showed that the expression of macrophage marker F4/80 in eWAT was elevated after LPS injection (Figure 2C and D). To investigate the potential mechanism of fat loss induced by daily LPS injection, we measured the daily food intake. As shown in Figure 2E, the food intake of mice with daily injection of LPS was dramatically reduced to about 10% and 19% of normal levels on day 1 and day 2, respectively, and then quickly recovered to around normal level. Moreover, the mRNA levels of some key enzymes responsible for fatty acid and triglyceride synthesis including Acl, Acss2, Fas, Elovl6, Scd1, and Dgat2 were significantly downregulated (Figure 2F). Furthermore, fatty acid uptake of primary adipocyte from mice treated with LPS for one day was markedly decreased (Figure 2G), and ex vivo lipolysis characterized by basal and β-adrenoceptor agonist-stimulated glycerol and fatty acid release was significantly increased in eWAT isolated from mice injected with LPS for one day (Figure 2H and I). Meanwhile, the fatty acid uptake of primary adipocyte and glycerol and fatty acid release of eWAT explant from mice injected with LPS for three days were not significantly changed (Figure 2J–L). In addition, the respiratory exchange ratio of LPS-treated mice was significantly lower than that of saline control during both light and dark cycle (Figure 2M and N), indicating increased total lipid oxidation in LPS-treated mice.26 Collectively, these data show that LPS injection leads to inflammation, anorexia, decreased lipid anabolism, and increased lipid catabolism.
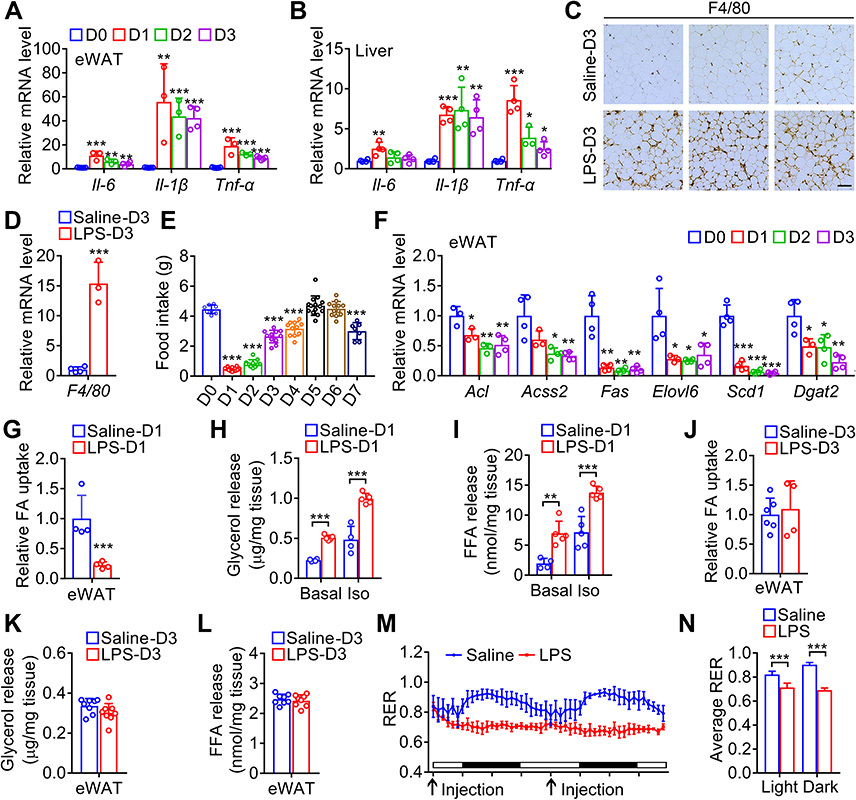 |
Figure 2 LPS injection induces inflammation and anorexia, inhibits lipid anabolism and enhances lipid catabolism. (A and B) The mRNA levels of inflammatory cytokines in eWAT (A) and liver (B) of the mice injected with LPS once a day from day 0 to day 3. (C) Immunostaining of F4/80 in sections of eWAT from mice injected with LPS once a day for 3 days. Scale bar, 50 μm. (D) Relative mRNA levels of F4/80 in eWAT from mice in (C). (E) The time response of injection with LPS once a day for 7 days on the food intake of mice. (F) The mRNA levels of enzymes responsible for fatty acid and triglyceride synthesis in eWAT of the mice in (A). (G) Uptake of BODIPY-labeled fatty acid in adipocytes isolated from eWAT of mice after injection with saline or LPS for 24 h. (H and I) Basal and isoproterenol-stimulated (Iso) glycerol (H) and fatty acid (I) release from explants of eWAT from mice after injection with saline or LPS for 24 h. (J) Uptake of BODIPY-labeled fatty acid in adipocytes isolated from eWAT of mice after injection with saline or LPS once a day for 3 days. (K and L) Glycerol (K) and fatty acid (L) release from explants of eWAT of mice after injection with saline or LPS once a day for 3 days. (M and N) Respiratory exchange ratio (RER) was measured for the mice injected with LPS once a day for 2 days. Arrows indicate the time points for LPS injection. *, p < 0.05; **, p < 0.01; ***, p < 0.001; versus D0 except indicated. |
LPS Induces Fat Loss via Tlr4
Toll-like Receptor-4 (Tlr4), as a member of the Toll-like receptor family, mediates lipopolysaccharide-induced signal transduction.27 To investigate whether LPS-induced fat loss in mice is also mediated by this canonical pathway, C57BL/10J wild-type mice and Tlr4 knockout mice on a C57BL/10J background were injected with LPS once a day for 3 days. The deficiency of Tlr4 gene in eWAT and liver was confirmed by qPCR (Figure 3A). As shown in Figure 3B and C, LPS injection induced a significant decrease of body weight and dramatic fat loss in wild-type mice but not in Tlr4 knockout mice from day 1 to day 3. Consistently, the size and weight of eWAT and iWAT from the mice with daily injection of LPS for 3 days were markedly decreased in wild-type mice but not in Tlr4 knockout mice (Figure 3D–F). In addition, H&E staining also revealed that LPS injection reduced the size of adipocytes in eWAT and iWAT of wild-type mice but not in Tlr4 knockout mice (Figure 3G–I). These data show that LPS injection leads to the decrease of body weight, fat loss and reduced adipocyte size dependent on Tlr4.
 |
Figure 3 LPS-induced fat loss in mice depends on its receptor Tlr4. (A) The mRNA level of Tlr4 in eWAT and liver from wild-type (WT) or Tlr4−/− mice on a C57BL/10J background. (B and C) The time response of injection with LPS once a day for 3 days on body weight (B) and fat mass (C) of WT and Tlr4−/− mice. (D) Representative images of eWAT and iWAT from mice in (B) on day 3. Scale bar, 0.5 cm. (E and F) The weight of eWAT and iWAT in (D). (G) Representative images of H&E staining of eWAT and iWAT in (D). Scale bar, 50 μm. (H and I) Quantification of adipocyte size in (G). *, p < 0.05; **, p < 0.01; ***, p < 0.001. |
LPS Induces Inflammation and Anorexia, Decreases Lipid Anabolism and Increases Lipid Catabolism via Tlr4
To further investigate whether LPS-induced inflammation, anorexia and altered lipid metabolism are also mediated by Tlr4, wild-type and Tlr4 knockout mice were injected with LPS once a day for 3 days. As shown in Figure 4A and B, LPS led to significant increases of Il-6, Il-1β and Tnf-α mRNA levels in eWAT and liver of wild-type mice but not in those of Tlr4 knockout mice. Furthermore, LPS markedly increased the blood counts of lymphocytes in wild type mice but not in Tlr4 knockout mice (Figure 4C). Moreover, LPS-induced anorexia was dramatically blocked in Tlr4 knockout mice (Figure 4D). Interestingly, LPS-induced decreases of the mRNA levels of some key enzymes responsible for fatty acid and triglyceride synthesis including Acss2, Fas, Scd1, and Elovl6 in eWAT were only moderately attenuated in Tlr4 knockout mice (Figure 4E). However, LPS-induced downregulation of fatty acid uptake of primary adipocyte and upregulation of basal and β-adrenoceptor agonist-stimulated glycerol and fatty acid release were almost completely blocked in Tlr4 knockout mice (Figure 4F–H). In addition, Tlr4 knockout almost completely reversed the reduction of respiratory exchange ratio caused by LPS injection during both light and dark cycle (Figure 3I and J), indicating that Tlr4 knockout reversed the increased lipid oxidation caused by LPS treatment. These data show that LPS induces inflammation and anorexia, and decreases lipid anabolism, and increases lipid catabolism mainly dependent on Tlr4.
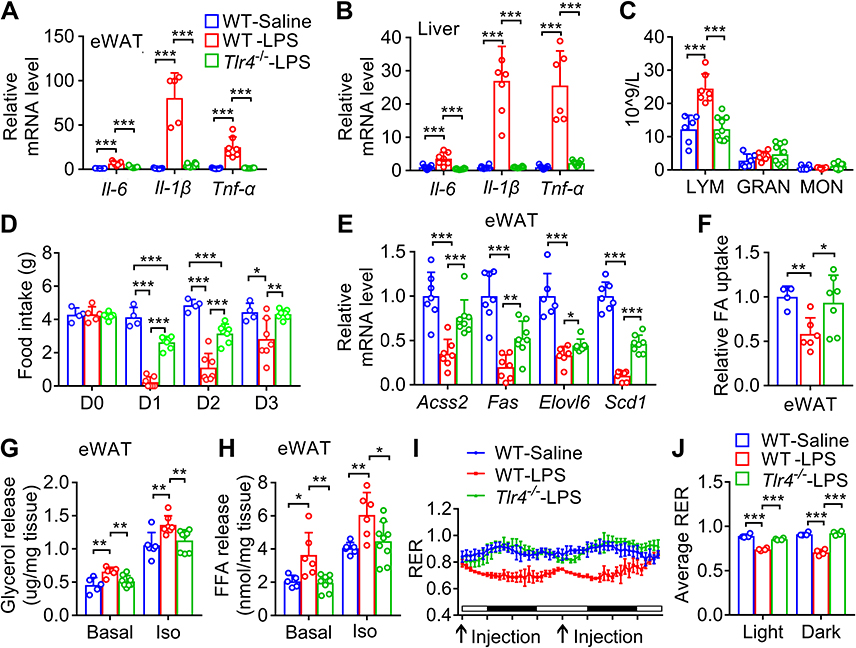 |
Figure 4 LPS-induced inflammation, anorexia and altered lipid metabolism depends on its receptor Tlr4. (A and B) The mRNA levels of inflammatory cytokines in eWAT (A) and liver (B) from mice on day 3 after injection with LPS once a day for 3 days. (C) Complete blood count analysis of the WT and Tlr4−/− mice after injection with saline or LPS for 24 h. (D) The time response of injection with LPS once a day for 3 days on the food intake of WT and Tlr4−/− mice. (E) The mRNA levels of enzymes responsible for fatty acid and triglyceride synthesis in eWAT from mice in (A). (F) Uptake of BODIPY-labeled fatty acid in adipocytes isolated from eWAT of mice in (D) on day 1. (G-H) Basal and isoproterenol-stimulated (Iso) glycerol (G) and fatty acid (H) release from explants of eWAT from mice in (F). (I and J) Respiratory exchange ratio (RER) was measured for the WT and Tlr4−/− mice injected with saline or LPS once a day for 2 days. Arrows indicate the time points for LPS injection. *, p < 0.05; **, p < 0.01; ***, p < 0.001. Abbreviations: LYM, lymphocyte; GRAN, granulocyte; MON, monocyte. |
Sustained Inflammation Induces Less Fat Loss Than Pair-Feeding
To investigate whether LPS-induced fat loss almost equals to the effect of reduced food intake induced by LPS, we compared the effect of pair-feeding with that sustained inflammation. As shown in Figure 5A, pair-feeding reduced more body weight than sustained inflammation induced by LPS. Moreover, pair-feeding induced more fat loss than sustained inflammation (Figure 5B). Furthermore, pair-feeding significantly induced more fat loss in eWAT than sustained inflammation but not in iWAT (Figure 5C–F). In addition, pair-feeding also significantly induced more reduction of adipocyte size in eWAT than sustained inflammation (Figure 5G and H). These data show that sustained inflammation induces less fat loss, especially in eWAT, than pair-feeding, suggesting sustained inflammation regulates lipid metabolism with distinct molecular mechanisms compared with pair-feeding.
 |
Figure 5 LPS injection induces less fat loss in mice than pair-feeding. (A and B) The time response of injection with LPS once a day or the corresponding pair-feeding (PF) for 3 days on body weight (A) and fat mass (B) of mice. (C and D) Representative images (C) and the weight (D) of eWAT from mice in (A), scale bar, 0.5 cm. (E and F) Representative images (E) and the weight (F) of iWAT from mice in (A), scale bar, 0.5 cm. (G) Representative images of H&E staining of eWAT in (C). Scale bar, 50 μm. (H) Quantification of adipocyte size in (G). *, p < 0.05; **, p < 0.01; ***, p < 0.001. |
Pair-Feeding Leads to Less Fatty Acid Uptake, More Lipid Catabolism and Energy Expenditure Than LPS Injection
To further elucidate the underlying mechanisms for why sustained inflammation induces less fat loss than pair-feeding, inflammation, lipid metabolism and energy expenditure were investigated. As shown in Figure 6A and B, LPS injection led to significant increases of Il-6, Il-1β and Tnf-α mRNA levels in eWAT and liver of wild-type mice, but pair-feeding did not induce the increases of these inflammatory factors. Pair-feeding had similar effect on the mRNA levels of some key enzymes responsible for fatty acid and triglyceride synthesis including Acl, Acss2, Fas, and Elovl6 in eWAT as LPS injection (Figure 6C), but pair-feeding led to less fatty acid uptake in eWAT than LPS injection (Figure 6D). Furthermore, pair-feeding induced more lipolysis in eWAT of mice than LPS injection (Figure 6E and F). Pair-feeding led to more oxygen consumption and energy expenditure in both light and dark phases than LPS injection (Figure 6G–J). Consistently, pair-feeding also led to more physical activity in both light and dark phases than LPS injection (Figure 6K and L). These data demonstrate that pair-feeding has no significant effect on inflammation and leads to less fatty acid uptake, more lipolysis and energy expenditure than LPS injection in mice.
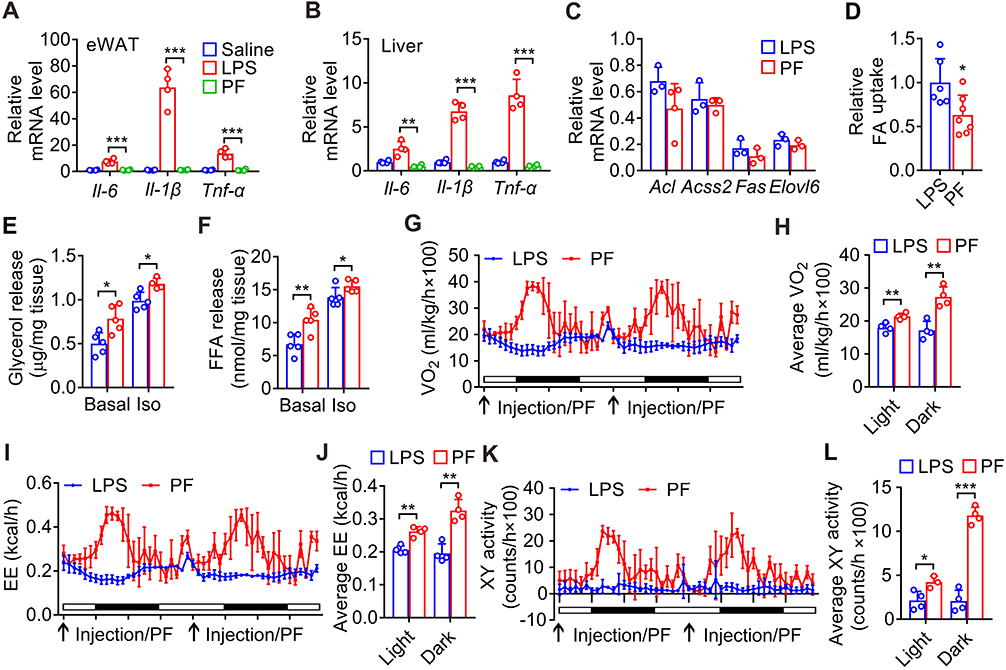 |
Figure 6 Comparison of the effects of LPS injection with pair-feeding on inflammation, lipid metabolism and energy expenditure in mice. (A) The mRNA levels of inflammatory cytokines in eWAT of mice after injection with LPS once a day or pair-feeding for 2 days. (B) The mRNA levels of inflammatory cytokines in liver of mice after injection with LPS once a day or pair-feeding for one day. (C) The mRNA levels of enzymes responsible for fatty acid and triglyceride synthesis in eWAT from mice in (A). (D) Uptake of BODIPY-labeled fatty acid in adipocytes isolated from eWAT of mice after injection with LPS or pair-feeding for one day. (E and F) Basal and isoproterenol-stimulated (Iso) glycerol (E) and fatty acid (F) release from explants of eWAT of mice in (D). (G and H) The oxygen consumption of the mice injected with LPS once a day or pair-feeding for 2 days. (I and J) The energy expenditure (EE) of the mice in (G). (K and L) The physical activity of the mice in (G). *, p < 0.05; **, p < 0.01; ***, p < 0.001. |
Short-Term Sustained Inflammation Leads to Tolerance for LPS-Induced Anorexia, Inflammation and Altered Lipid Metabolism
To further investigate whether sustained inflammation induced by LPS will lead to subsequent tolerance to the effect of LPS on lipid metabolism, mice were injected with LPS for one week once a day to induce sustained inflammation, and subsequently were injected with LPS after 1, 2, 3 or 4 weeks to monitor anorexia, inflammation and lipid metabolism (Figure 7A). As shown in Figure 7B, first-time LPS injection led to severe anorexia on day 1 and day 2, and moderate anorexia on day 3. After induction of sustained inflammation for 1 or 2 weeks, subsequent LPS injection only induced slight anorexia on day 1, and failed to induce anorexia on day 2 and day 3 (Figure 7B). Subsequent LPS injection after 3 or 4 weeks only induced moderate anorexia on day 1, slight anorexia on day 2 and no anorexia on day 3 (Figure 7B). Similarly, first-time LPS injection led to a significant decrease of body weight on day 1, day 2 and day 3, while subsequent LPS injection after the sustained inflammation for 1–4 weeks had no significant effect on body weight (Figure 7C). Consistently, first-time LPS injection led to a significant decrease of fat mass from day 1 to day 3, while subsequent LPS injection after 1–4 weeks had no significant effect on fat mass (Figure 7D). As expected, short-term sustained inflammation led to tolerance for LPS-induced increase of inflammatory factors including Il-6, Il-1β and Tnf-α mRNA levels in eWAT and the increase of lymphocytes in blood (Figure 7E and F). Moreover, first-time LPS injection led to a marked decrease of some key enzymes responsible for fatty acid and triglyceride synthesis including Acl, Acss2, Fas, and Elovl6 in eWAT of mice, which could be partially attenuated when subjected to sustained inflammation three weeks ago (Figure 7G). Short-term sustained inflammation also led to tolerance for LPS-induced decrease of fatty acid uptake and increase of lipolysis in eWAT (Figure 7H–J). These findings show that short-term sustained inflammation leads to relative long-term tolerance for LPS-induced anorexia, inflammation and altered lipid metabolism.
 |
Figure 7 Short-term LPS injection leads to relative long-term tolerance for LPS-induced anorexia, fat loss, inflammation and altered lipid metabolism. (A) The schematic for pretreatment with LPS injection once a day for one week followed with 1-, 2-, 3- or 4 week intervals and subsequent LPS reinjection once a day. (B–D) One-week LPS injection led to relative long-term tolerance for LPS-induced anorexia, weight and fat loss. The mice were treated as shown in (A). (E and F) One-week LPS injection led to relative long-term tolerance for LPS-induced increase of inflammatory cytokines in eWAT (E) and blood lymphocytes (F) from mice in Group 1 and 4 as shown in (A) or mice injected with saline for one day. (G) One-week LPS injection led to relative long-term partial tolerance for LPS-induced decrease of mRNA levels for the indicated enzymes participated in fatty acid and triglyceride synthesis in eWAT of mice from (E). (H–J) One-week LPS injection leads to relative long-term tolerance for LPS-induced decrease of fatty acid uptake in adipocytes isolated from eWAT (H), and increase of glycerol (I) and fatty acid (J) release from explants of eWAT and iWAT of mice in (E). *, p < 0.05; **, p < 0.01; ***, p < 0.001; versus D0 except indicated. #, p <0.05; ##, p < 0.01; ###, p < 0.001; versus G1 at the same time point. |
Discussion
In this study, we show that sustained inflammation induced by LPS led to fat loss in mice most likely due to reduced food intake and lipid anabolism and increased lipid catabolism. Consistently, it is well-known that a consequence of fighting an infection in nearly all species examined is a reduction of food intake, and rapid breakdown of the body’s reserves of protein, carbohydrates, and lipids to support the upregulation of immune system.28,29 Similarly, a recent study show that skin resident adipocytes undergo lipolysis to promote efficient macrophage inflammation after injury.30 Interestingly, it has been reported that in humans, severe infections routinely lead to loss of body weight and increase of metabolic rate.31–33 For the mice with sustained inflammation induced by LPS in this study, we found the loss of body weight and fat mass accompanied by decreased oxygen consumption and body temperature (data not shown). The discrepancy between our mouse study and the human studies mentioned above might be due to the different immune stimuli and relative mild inflammatory responses in our mouse study. In consistent with our observation, it has been reported that LPS injection, L. monocytogenes or E. coli infection led to a significant decrease of food intake, body weight, metabolic rate, oxygen consumption, and body temperature.34 Although it has been reported that LPS injection at a dose of 1.5 mg/kg body weight once a day for 7 days has no significant effect on body weight,11 in our study, injection of LPS from different E. coli strains at the dose of both 0.8 mg/kg and 1.5 mg/kg body weight once a day for 7 days all led to a significant decrease of body weight.
Usually, extracellular LPS is sensed by immune system via TLR4, a transmembrane protein, which transmits the information of LPS detection to the cytosol.35,36 However, studies in recent years have uncovered a diverse set of eukaryotic receptors that recognize LPS, including Toll-like receptors, G-protein-coupled receptors, integrins, receptor-like kinases, and caspases.27,35 Our data show that LPS-induced anorexia and the decrease of lipid synthesis in white adipose tissue were dramatically but partially blocked in Tlr4 knockout mice, suggesting that Tlr4-independent pathways are also involved in LPS signaling. It has been reported that transient receptor potential (TRP) channels present in sensory neurons and epithelial cells have been demonstrated as novel LPS sensors sensitized and activated before the initiation of immune responses through Tlr4.27,37 TRP channels are expressed in tissues that influence energy intake and expenditure, including the hypothalamus, peripheral sensory neurons, gastrointestinal tract, liver, and adipocytes.38 Therefore, LPS might regulate food intake in brain and lipid synthesis in white adipose tissue via both Tlr4 and TRP channels. More recently, caspase-4/5 (and caspase-11 in mice) have been established as the cytoplasmic sensors for LPS, and direct activation of caspase-4/5 or caspase-11 by intracellular LPS elicits pyroptosis, which occurs in multiple cell types.27,39 Whether LPS-induced pyroptosis via direct activation of caspase-11 contributes to LPS-induced anorexia and the decrease of lipid synthesis in white adipose tissue needs to be investigated in the future.
We show that sustained inflammation induces less fat loss, especially in eWAT, than pair-feeding, and pair-feeding leads to less fatty acid uptake, more lipolysis in eWAT and energy expenditure than LPS injection in mice. It is well-known that both inflammation and fasting lead to fat loss, decrease of lipid anabolism and increase of lipid catabolism.6,40–43 Under starvation conditions, the host eventually adjusts physiologically to the reduction of nutrient inputs by decreasing metabolism.29 Consistently, we also observed that pair-feeding also leads to the decrease of energy expenditure (data not shown). Under inflammation conditions, infection with LPS, L. monocytogenes or E. coli. In mice also lead to decrease of energy expenditure.34,44 Active infection usually leads to the decrease of energetically expensive movement to make more energy available to the immune system.45,46 However, caloric restriction has no significant effect on spontaneous physical activity in humans,47–49 and fasting increases locomotor activity of rodents representing a higher exploratory behavior improving the chances to find food in the environment.50,51 Since energy is expended primarily through basal metabolism, physical activity, and adaptive thermogenesis,52 the dramatic decrease of physical activity in mice injected with LPS should contribute to the less fat loss than pair-feeding. Increased lipolysis of eWAT in the pair-feeding group is likely to provide sufficient energy for increased physical activity.
Host immune cells exposed to endotoxin are rendered “tolerant” and manifest a profoundly altered response including inhibition of producing pro-inflammatory cytokines when rechallenged with bacterial endotoxin or lipopolysaccharide.19,53 Mice were tolerant to acute cytokine responses on day 5 after the initial LPS dose, and regained their ability to respond normally to a second LPS dose within 5 to 10 days.54 Here, we show that one-week consecutive injection of LPS led to consequent tolerance to inflammatory cytokine production even after a rest period of 3 weeks, suggesting multiple doses of LPS may lead to a relative long-term tolerance. Interestingly, rabbits received typhoid vaccine every day for 13 days lost their tolerance to typhoid pyrogen after a rest period of 3 weeks,55 which might be due to the different inflammatory stimuli or different species. It has been reported that tolerant mice did not show a significant decrease in food intake when exposed to a second dose of LPS 2 or 3 days after the first injection.20,56 Continuous infusion of endotoxin in rats led to alterations in glucose metabolism, which return to control levels by 54 h.57 Similarly, we show that short-term sustained inflammation leads to relative long-term tolerance for LPS-induced anorexia and altered lipid metabolism. Interestingly, tolerant mice induced by 4-day intraperitoneally injection of LPS were not responsive to an intravenous injection of LPS after 2 days, but markedly responsive to an intracerebroventricular challenge,58 suggesting the tolerance of LPS-induced anorexia is a peripheral effect. Combined with our observations, how LPS affects the central nervous system needs to be studied in the future to reveal the molecular mechanism of LPS tolerance in the brain, which might also contribute to long-term LPS tolerance.
Conclusion
In this study, we show that sustained inflammation induced by LPS leads to fat loss, anorexia, decreased lipid anabolism, and increased lipid catabolism in mice via Tlr4. Pair-feeding leads to less fatty acid uptake, more lipid catabolism and energy expenditure than LPS injection, and short-term sustained inflammation leads to tolerance for LPS-induced anorexia, inflammation and altered lipid metabolism. Our findings shed new light on understanding the alteration of lipid metabolism during sustained inflammation and the tolerance to inflammation, anorexia and alteration of lipid metabolism.
Abbreviations
LPS, Lipopolysaccharide; NMR, Nuclear Magnetic Resonance; eWAT, epididymal white adipose tissue; iWAT, inguinal white adipose tissue.
Acknowledgments
This work was supported by grants from the National Natural Science Foundation of China (31630037, 91940306 and 91740103), the National Key R&D Program of China (2018YFA0800603), the Frontier Science of Chinese Academy of Sciences Key Research Projects (QYZDJ-SSW-SMC022), the Strategic Priority Research Program of the Chinese Academy of Sciences (XDB19030103) and the Shanghai Leading Talents Program.
Disclosure
The authors report no conflicts of interest in this work.
References
1. Henao-Mejia J, Elinav E, Thaiss CA, Flavell RA. Flavell aRA. Inflammasomes and metabolic disease. Annu Rev Physiol. 2014;76(1):57–78. doi:10.1146/annurev-physiol-021113-170324
2. Hotamisligil GS. Inflammation, metaflammation and immunometabolic disorders. Nature. 2017;542(7640):177–185. doi:10.1038/nature21363
3. Ganeshan K, Chawla A. Metabolic regulation of immune responses. Annu Rev Immunol. 2014;32(1):609–634. doi:10.1146/annurev-immunol-032713-120236
4. Arroyo V, Angeli P, Moreau R, et al. The systemic inflammation hypothesis: towards a new paradigm of acute decompensation and multiorgan failure in cirrhosis. J Hepatol. 2021;74(3):670–685. doi:10.1016/j.jhep.2020.11.048
5. McGuinness OP. Defective glucose homeostasis during infection. Annu Rev Nutr. 2005;25(1):9–35. doi:10.1146/annurev.nutr.24.012003.132159
6. Glass CK, Olefsky JM. Inflammation and lipid signaling in the etiology of insulin resistance. Cell Metab. 2012;15(5):635–645. doi:10.1016/j.cmet.2012.04.001
7. Feingold KR, Staprans I, Memon RA, et al. Endotoxin rapidly induces changes in lipid metabolism that produce hypertriglyceridemia: low doses stimulate hepatic triglyceride production while high doses inhibit clearance. J Lipid Res. 1992;33(12):1765–1776. doi:10.1016/S0022-2275(20)41334-3
8. Nonogaki K, Moser AH, Feingold KR, Grunfeld C. Alpha-adrenergic receptors mediate the hypertriglyceridemia induced by endotoxin. Endocrinology. 1994;135(6):2644–2650. doi:10.1210/endo.135.6.7988454
9. Guo J, Gao S, Liu Z, Zhao R, Yang X. Alpha-lipoic acid alleviates acute inflammation and promotes lipid mobilization during the inflammatory response in white adipose tissue of mice. Lipids. 2016;51(10):1145–1152. doi:10.1007/s11745-016-4185-2
10. Nathan C, Ding A. Nonresolving inflammation. Cell. 2010;140(6):871–882. doi:10.1016/j.cell.2010.02.029
11. Okin D, Medzhitov R. The effect of sustained inflammation on hepatic mevalonate pathway results in hyperglycemia. Cell. 2016;165(2):343–356. doi:10.1016/j.cell.2016.02.023
12. Zu L, He J, Jiang H, Xu C, Pu S, Xu G. Bacterial endotoxin stimulates adipose lipolysis via toll-like receptor 4 and extracellular signal-regulated kinase pathway. J Biol Chem. 2009;284(9):5915–5926. doi:10.1074/jbc.M807852200
13. Medzhitov R, Schneider DS, Soares MP. Disease tolerance as a defense strategy. Science. 2012;335(6071):936–941. doi:10.1126/science.1214935
14. Soares MP, Teixeira L, Moita LF. Disease tolerance and immunity in host protection against infection. Nat Rev Immunol. 2017;17(2):83–96. doi:10.1038/nri.2016.136
15. Seeley JJ, Ghosh S. Molecular mechanisms of innate memory and tolerance to LPS. J Leukoc Biol. 2017;101(1):107–119. doi:10.1189/jlb.3MR0316-118RR
16. Hotchkiss RS, Monneret G, Payen D. Sepsis-induced immunosuppression: from cellular dysfunctions to immunotherapy. Nat Rev Immunol. 2013;13(12):862–874. doi:10.1038/nri3552
17. Langston PK, Nambu A, Jung J, et al. Glycerol phosphate shuttle enzyme GPD2 regulates macrophage inflammatory responses. Nat Immunol. 2019;20(9):1186–1195. doi:10.1038/s41590-019-0453-7
18. Gillen J, Ondee T, Gurusamy D, et al. LPS tolerance inhibits cellular respiration and induces global changes in the macrophage secretome. Biomolecules. 2021;11(2):164. doi:10.3390/biom11020164
19. Novakovic B, Habibi E, Wang SY, et al. β-Glucan reverses the epigenetic state of LPS-induced immunological tolerance. Cell. 2016;167(5):1354–1368. doi:10.1016/j.cell.2016.09.034
20. Porter MH, Arnold M, Langhans W. TNF-a tolerance blocks LPS-induced hypophagia but LPS tolerance fails to prevent TNF-A-induced hypophagia. Am J Physiol Regul Integr Comp Physiol. 1998;274(3):R741–R745. doi:10.1152/ajpregu.1998.274.3.R741
21. Borges BC, Antunes-Rodrigues J, Castro M, Bittencourt JC, Elias CF, Elias LL. Expression of hypothalamic neuropeptides and the desensitization of pituitary-adrenal axis and hypophagia in the endotoxin tolerance. Horm Behav. 2007;52(4):508–519. doi:10.1016/j.yhbeh.2007.07.006
22. Pacheco-Lopez G, Niemi MB, Engler H, et al. Weakened taste-LPS association during endotoxin tolerance. Physiol Behav. 2008;93(1–2):261–266. doi:10.1016/j.physbeh.2007.08.022
23. Draisma A, Pickkers P, Bouw MP, van der Hoeven JG. Development of endotoxin tolerance in humans in vivo. Crit Care Med. 2009;37(4):1261–1267. doi:10.1097/CCM.0b013e31819c3c67
24. Ahmadian M, Abbott MJ, Tang T, et al. Desnutrin/ATGL is regulated by AMPK and is required for a brown adipose phenotype. Cell Metab. 2011;13(6):739–748. doi:10.1016/j.cmet.2011.05.002
25. Sleeman MW, Garcia K, Liu R, et al. Ciliary neurotrophic factor improves diabetic parameters and hepatic steatosis and increases basal metabolic rate in db or ob mice. PNAS. 2003;100(24):14297–14302. doi:10.1073/pnas.2335926100
26. Bray MS, Ratcliffe WF, Grenett MH, Brewer RA, Gamble KL, Young ME. Quantitative analysis of light-phase restricted feeding reveals metabolic dyssynchrony in mice. Int J Obes. 2013;37(6):843–852. doi:10.1038/ijo.2012.137
27. Mazgaeen L, Gurung P. Recent advances in lipopolysaccharide recognition systems. Int J Mol Sci. 2020;21(2):379. doi:10.3390/ijms21020379
28. Sadd BM, Schmid-Hempel P. Principles of ecological immunology. Evol Appl. 2009;2(1):113–121. doi:10.1111/j.1752-4571.2008.00057.x
29. Lochmiller RL, Deerenberg C. Trade-offs in evolutionary immunology just what is the cost of immunity? Oikos. 2000;88(1):87–98. doi:10.1034/j.1600-0706.2000.880110.x
30. Shook BA, Wasko RR, Mano O, et al. Dermal adipocyte lipolysis and myofibroblast conversion are required for efficient skin repair. Cell Stem Cell. 2020;26(6)):880–895. doi:10.1016/j.stem.2020.03.013
31. Kreymann G, Grosser S, Buggisch P, Gottschall C, Matthaei S, Greten H. Oxygen consumption and resting metabolic rate in sepsis, sepsis syndrome, and septic shock. Crit Care Med. 1993;21(7):1012–1019. doi:10.1097/00003246-199307000-00015
32. Long CL. Energy balance and carbohydrate metabolism in infection and sepsis. Am J Clin Nutr. 1977;30(8):1301–1310. doi:10.1093/ajcn/30.8.1301
33. Muehlenbein MP, Hirschtick JL, Bonner JZ, Swartz AM. Toward quantifying the usage costs of human immunity: altered metabolic rates and hormone levels during acute immune activation in men. Am J Hum Biol. 2010;22(4):546–556. doi:10.1002/ajhb.21045
34. Ganeshan K, Nikkanen J, Man K, et al. Energetic trade-offs and hypometabolic states promote disease tolerance. Cell. 2019;177(2):399–413 e312. doi:10.1016/j.cell.2019.01.050
35. Kagan JC. Lipopolysaccharide detection across the Kingdoms of Life. Trends Immunol. 2017;38(10):696–704. doi:10.1016/j.it.2017.05.001
36. Fitzgerald KA, Kagan JC. Toll-like receptors and the control of immunity. Cell. 2020;180(6):1044–1066. doi:10.1016/j.cell.2020.02.041
37. Meseguer V, Alpizar YA, Luis E, et al. TRPA1 channels mediate acute neurogenic inflammation and pain produced by bacterial endotoxins. Nat Commun. 2014;5(1):3125. doi:10.1038/ncomms4125
38. Ahern GP. Transient receptor potential channels and energy homeostasis. Trends Endocrinol Metab. 2013;24(11):554–560. doi:10.1016/j.tem.2013.06.005
39. Rathinam VAK, Zhao Y, Shao F. Innate immunity to intracellular LPS. Nat Immunol. 2019;20(5):527–533. doi:10.1038/s41590-019-0368-3
40. Pang S, Tang H, Zhuo S, Zang YQ, Le Y. Regulation of fasting fuel metabolism by toll-like receptor 4. Diabetes. 2010;59(12):3041–3048. doi:10.2337/db10-0418
41. Rohm M, Sommerfeld A, Strzoda D, et al. Transcriptional cofactor TBLR1 controls lipid mobilization in white adipose tissue. Cell Metab. 2013;17(4):575–585. doi:10.1016/j.cmet.2013.02.010
42. Ohhira M, Motomura W, Fukuda M, et al. Lipopolysaccharide induces adipose differentiation-related protein expression and lipid accumulation in the liver through inhibition of fatty acid oxidation in mice. J Gastroenterol. 2007;42(12):969–978. doi:10.1007/s00535-007-2119-8
43. Lu B, Moser AH, Shigenaga JK, Feingold KR, Grunfeld C. Type II nuclear hormone receptors, coactivator, and target gene repression in adipose tissue in the acute-phase response. J Lipid Res. 2006;47(10):2179–2190. doi:10.1194/jlr.M500540-JLR200
44. Johnson RM, Olatunde AC, Woodie LN, Greene MW, Schwartz EH. The systemic and cellular metabolic phenotype of infection and immune response to listeria monocytogenes. Front Immunol. 2020;11:614–697. doi:10.3389/fimmu.2020.00614
45. Hart BL. Biological basis of the behavior of sick animals. Neurosci Biobehav Rev. 1988;12(2):123–137. doi:10.1016/S0149-7634(88)80004-6
46. Schrock JM, Snodgrass JJ, Sugiyama LS. Lassitude: the emotion of being sick. Evol Hum Behav. 2019;41(1):44–57. doi:10.1016/j.evolhumbehav.2019.09.002
47. Redman LM, Ravussin E. Caloric restriction in humans impact on physiological, psychological, and behavioral outcomes. Antioxid Redox Signal. 2011;14(2):275–287. doi:10.1089/ars.2010.3253
48. Martin CK, Heilbronn LK, Jonge L, et al. Effect of calorie restriction on resting metabolic rate and spontaneous physical activity. Obesity. 2007;15(12):2964–2973. doi:10.1038/oby.2007.354
49. Redman LM, Smith SR, Burton JH, Martin CK, Il’yasova D, Ravussin E. Metabolic slowing and reduced oxidative damage with sustained caloric restriction support the rate of living and oxidative damage theories of aging. Cell Metab. 2018;27(4):805–815 e804. doi:10.1016/j.cmet.2018.02.019
50. Pedroso JAB, Wasinski F, Donato J
51. Koubi HE, Robin JP, Dewasmes G, Le Maho Y, Frutoso J, Minaire Y. Fasting-induced rise in locomotor activity in rats coincides with increased protein utilization. Physiol Behav. 1991;50(2):337–343. doi:10.1016/0031-9384(91)90075-Y
52. Masand R, Paulo E, Wu D, et al. Proteome imbalance of mitochondrial electron transport chain in brown adipocytes leads to metabolic benefits. Cell Metab. 2018;27(3):616–629. e614. doi:10.1016/j.cmet.2018.01.018
53. West MA, Heagy W. Endotoxin tolerance: a review. Crit Care Med. 2002;30(1):S64–S73. doi:10.1097/00003246-200201001-00009
54. Lu M, Varley AW, Ohta S, Hardwick J, Munford RS. Host inactivation of bacterial lipopolysaccharide prevents prolonged tolerance following gram-negative bacterial infection. Cell Host Microbe. 2008;4(3):293–302. doi:10.1016/j.chom.2008.06.009
55. Beeson PB. Tolerance to bacterial pyrogens: i. Factors influencing its development. J Exp Med. 1947;86(1):29–38. doi:10.1084/jem.86.1.29
56. Marks DL, Ling N, Cone RD. Role of the central melanocortin system in cachexia. Cancer Res. 2001;61(4):1432–1438.
57. Spitzer JA, Lang CH. Glucose kinetics and development of endotoxin tolerance during long-term continuous endotoxin infusion. Metabolism. 1987;36(5):469–474. doi:10.1016/0026-0495(87)90045-X
58. Faggioni R, Fantuzzi G, Villa P, Buurman W, van Tits LJ, Ghezzi P. Independent down-regulation of central and peripheral tumor necrosis factor production as a result of lipopolysaccharide tolerance in mice. Infect Immun. 1995;63(4):1473–1477. doi:10.1128/iai.63.4.1473-1477.1995
 © 2022 The Author(s). This work is published and licensed by Dove Medical Press Limited. The
full terms of this license are available at https://www.dovepress.com/terms
and incorporate the Creative Commons Attribution
- Non Commercial (unported, 3.0) License.
By accessing the work you hereby accept the Terms. Non-commercial uses of the work are permitted
without any further permission from Dove Medical Press Limited, provided the work is properly
attributed. For permission for commercial use of this work, please see paragraphs 4.2 and 5 of our Terms.
© 2022 The Author(s). This work is published and licensed by Dove Medical Press Limited. The
full terms of this license are available at https://www.dovepress.com/terms
and incorporate the Creative Commons Attribution
- Non Commercial (unported, 3.0) License.
By accessing the work you hereby accept the Terms. Non-commercial uses of the work are permitted
without any further permission from Dove Medical Press Limited, provided the work is properly
attributed. For permission for commercial use of this work, please see paragraphs 4.2 and 5 of our Terms.