")
Back to Journals » Pediatric Health, Medicine and Therapeutics » Volume 12
Survival Status and Predictors of Mortality Among Low-Birth-Weight Neonates Admitted to the Neonatal Intensive Care Unit at Felege Hiwot Comprehensive Specialized Hospital, Bahir Dar, Ethiopia, 2020
Authors Woelile TA, Kibret GT, Workie HM , Amare AT , Tigabu A , Aynalem YA , Chanie ES , Birlie TA
Received 16 June 2021
Accepted for publication 19 August 2021
Published 4 September 2021 Volume 2021:12 Pages 451—466
DOI https://doi.org/10.2147/PHMT.S323526
Checked for plagiarism Yes
Review by Single anonymous peer review
Peer reviewer comments 3
Editor who approved publication: Professor Roosy Aulakh
Tamiru Alene Woelile,1 Getasew Tesfa Kibret,2 Hailemariam Mekonnen Workie,2 Abraham Tsedalu Amare,3 Agimasie Tigabu,3 Yared Asmare Aynalem,4 Ermias Sisay Chanie,5 Tekalign Amera Birlie3
1Department of Pediatrics and Neonatal Nursing, Wolaita Sodo University, Sodo, Southern Nation and Nationalities of Ethiopia, Ethiopia; 2Department of Pediatrics and Child Health Nursing, Bahir Dar University, Bahir Dar, Amhara, Ethiopia; 3Department of Adult Health Nursing, Debre Tabor University, Debra Tabor, Amhara, Ethiopia; 4Department of Nursing, Debre Berhan University, Debre Berhan, Amhara, Ethiopia; 5Department of Pediatrics and Child Health, Debre Tabor University, Debre Tabor, Amhara, Ethiopia
Correspondence: Tamiru Alene Woelile
Pediatrics and Neonatal Nursing at Wolaita Sodo University, Wolaita, Ethiopia
Email [email protected]
Abraham Tsedalu Amare
Adult Health Nursing at Debre Tabor University, Debre Tabor, Ethiopia
Email [email protected]
Background: Low birth weight neonates are subjected to different comorbidities due to anatomical and physiological immaturity. Globally, 60– 80% of neonatal mortality was due to low birth weight. Hence, this study aimed to assess the survival status and predictors of mortality among low birth weight neonates.
Methods: An institutional-based retrospective cohort study design was conducted among 718 low birth weight neonates admitted to the neonatal intensive care unit from January 1, 2017, to December 30, 2019, at Felege Hiwot Comprehensive Specialized Hospital. Data were entered into Epi data version 3.1 and analyzed with STATA version 14. Kaplan–Meier curves together with a Log rank test were used to estimate the survival time and showed the presence of differences among groups. Cox proportional-hazard regression was used to estimate the hazard ratio at the 5% level of significance to determine the net effect of each explanatory variable on survival status.
Results: The overall incidence density was 35.3 per 1000 person-day observations (CI: 30.8 − 40.6) with 5715 follow-up days. Deliveries outside the health institution [AHR; 2.31 (95% CI: 1.20– 4.42)], maternal age < 18 years [AHR; 3.08 (95% CI: 1.64– 5.81)] and maternal age > 35 years [AHR; 3.83 (95% CI: 2.00– 7.31)], neonatal sepsis [AHR; 2.33 (95% CI: 1.38– 3.94)], neonatal respiratory distress syndrome [AHR; 1.92 (95% CI: 1.27– 2.89)], necrotizing enterocolitis [AHR; 3.09 (95% CI: 1.69– 5.64)] and birth weight < 1000 gm [AHR; 3.61 (95% CI: 1.73– 7.55)] were found to be significant predictors.
Conclusion: This study showed that two of the seven low birth weight neonates died during the follow-up period. Therefore, it is better for health care providers and other stakeholders to focus more on early diagnosis and management of low birth weight neonates with sepsis, respiratory distress syndrome, necrotizing enterocolitis and counseling mothers on the risk of having a child in early and old age.
Keywords: low birth weight, incidence density, survival status, predictors, Ethiopia
Background
Low birth weight neonates are babies whose first measured weight is less than 2500 gm without respect to gestational age. Preferably, it should be measured within the first hour of life before significant postnatal weight loss has occurred.1,2 It includes both preterm neonates and term neonates.3 They are at increased risk of death because of underdeveloped or poorly developed organ systems and the inability to physiologically respond to their external environment. Therefore, a newborn’s weight at birth is considered as an important marker of maternal and fetal health.4
The major health problems associated with low birth weight (LBW) neonatal mortality include feeding difficulties, hypoglycemia, hypothermia, pulmonary immaturity, susceptibility to infection, fluid and electrolyte imbalance.5 These health problems keep them at a higher risk of dying within the first 28 days of life. Besides, those who survive the neonatal period are also more likely to suffer from stunted growth and lower intelligence quotient in early childhood.6,7 Even the consequences of low birth weight continue into adulthood as increasing the risk of adult-onset chronic conditions, such as obesity and diabetes.8
Globally, the incidence and mortality of LBW neonates are still high and are considered a major cause of neonatal mortality especially in developing countries. It contributes to 60–80% of all neonatal deaths annually.9 For many neonates, mainly low birth weight neonates, their day of birth is also their day of death, with approximately 1 and 2 million deaths occurring on the day of their birth and in the first week of their life annually in the world, respectively.10
In East Africa, preterm babies and babies with low birth weight were found to account for 52% of newborn deaths. The risk of death in the first 28 days of life was also seven times higher for babies born of low birth weight compared to those with normal birth weight. Therefore, LBW is strongly negatively associated with infant survival.11
There is considerable variation in the neonatal survival rate across regions and within countries. Sub-Saharan Africa had the highest neonatal mortality rate in 2018 at 28 deaths per 1000 live births, followed by Central and Southern Asia with 25 deaths per 1000 live births.12 In Ethiopia according to 2016, Ethiopian Demographic Health Survey (EDHS) and 2019 mini EDHS report neonatal mortality accounts for 29/1000 and 30/1000 live births, respectively.13,14
Trends in Ethiopia showed that the change in neonatal mortality was slowest compared to infant and child mortality. According to EDHS report, neonatal mortality was 49, 39, 37 and 29 in 2000, 2005, 2011, and 2016, respectively.15 These different strategic plans,m such as millennium development goal three16 and health sector transformation plan, aim to reduce neonatal mortality to 11/1000 live births by 2020.17 However, according to the 2019 EDHS report, neonatal mortality (NMR) remains high in Ethiopia.12 To break this and bring better child survival, other strategic plans, such as sustainable development goal target 3 and the global strategy for women’s, children’s and adolescents’ health, which focuses on reducing NMR to 12/1000 live births by 2030, were established. So that, improving the life chances of those who are born too small and too sick by accessing the quality of care will help to achieve these targets.18,19
In general, even if improving the health of neonates is one of the government priority issues by designing different strategies and policies to reduce neonatal mortality, it is not achieved as required. This is mainly due to the high prevalence of LBW as reported by different studies. The prevalence of LBW in Ethiopia as well as in the study area was also high (13%) and (11%), respectively,15,20 which further increased neonatal mortality. More studies were conducted regarding the prevalence and associated factors of LBW. Nevertheless, there is a paucity of the literature concerning the survival status of LBW neonates during the full neonatal period. Therefore, this study aims to assess survival status and predictors of mortality among LBW neonates.
Methods
Study Period and Setting
The study was conducted from February 29, 2020 to March 29, 2020 among LBW neonates who were admitted to the neonatal intensive care unit (NICU) of Felege Hiwot Comprehensive Specialized Hospital (FHCSH) from January 1, 2017 to December 30; 2019. This hospital is found in Bahir Dar city, the capital of Amhara regional state, which is 565 km away from the capital city of Ethiopia, Addis Ababa. It serves more than 5 million people annually. The NICU ward has 75 neonatal beds with an average annual admission of 3500 neonates and 800 LBW neonates. Currently, a total of 30 nurses and 6 physicians are working in the NICU.
Study Design and Population Characteristics
An institution-based retrospective cohort study design was conducted at Felege Hiwot Comprehensive Specialized Hospital. All LBW neonates admitted to the NICU from January 1, 2017 to December 30, 2019 with gestational age greater than 28 weeks were considered in the study population. All LBW neonates with a gestational age greater than 28 weeks were included, but those LBW neonates with incomplete records and charts, which were not found at the time of data collection, were excluded from this study.
Sample Size Determination and Procedure
The sample size was determined using the double population proportion difference formula using Epi Info version 7 by considering major predictor variables (antenatal care (ANC) visit, mode of delivery, maternal illness during pregnancy, the weight of neonate and gestational age) from a previous study conducted in southern Ethiopia.21 From those predictors, the sample size that we obtained from gestational age was considered the final sample size of the study. It gives a maximum sample size when compared to other predictors. Using a proportion of exposed (16.4%) and non-exposed (9.4%), one-to-one exposed-to-non-exposed ratio (1:1), 95% level of confidence interval and power of 80%; the final sample size became 718. The Federal Ministry of Health registration logbook was reviewed to obtain all LBW neonatal medical registration numbers. The three-year data from January 1, 2017, to December 30, 2019, were reviewed. A total of 2716 LBW neonatal medical registration numbers were obtained over these years. Then, all neonatal medical registration numbers were entered into Microsoft Excel 2010. After entry, the study units from the list were selected by a simple random sampling technique by using the computer random number generating system in Excel.
Operational Definitions
Low birth weight neonate: Neonates whose birth weight is less than 2500 grams irrespective of gestational age.22
Survival status: Outcome of LBW neonates either death or censored.
Event: Low birth weight neonates with the outcome of death in the study period.
Censored: Low birth weight neonates with predictors other than death (lost follow-up, survived over the follow-up period, referred to other health facilities against medical treatment).
Survival time: It is the time from admission to the NICU to the occurrence of an event or censoring.
Incomplete charts: Charts with one of the following predictors missed: status of a neonate, birth weight, gestational age, number of pregnancies and parities, antenatal care, neonatal age, the status of pregnancy, sex, maternal age, place of delivery and residency.
Data Collection Tools and Procedures
A data collection tool was prepared from the standardized national neonatal and delivery room registration book as a checklist. It includes: sociodemographic factors of maternal and neonatal predictors, neonatal medical predictors, maternal predictors, the outcome of LBW neonates, date of admission and date of death or censored. The first day of admission was taken as the starting time of follow-up, while the last day of an event or censored occurrence was taken as the end of follow-up time. The survival time was calculated by subtracting the first date of admission from the last date of death or censoring. All LBW neonatal medical registration numbers were first obtained from the NICU ward by reviewing three-year data from the federal ministry of health registration book. Then, according to their eligibility criteria, the required numbers of medical registration cards were selected by a simple random sampling method using a computer generating method. The selected medical cards were obtained from the medical record office. Finally, data were retrospectively reviewed by two BSc nurses and supervised by an MSc nurse.
Data Processing and Analysis
The data were checked for completeness every day by the supervisor and principal investigator. It was then cleaned and coded using Epi data version 3.1. The consistency of the data was also checked before the analysis. After that, it was exported to STATA 14 statistical software. After checking the normality distribution, by the Shapiro Wilk test for continuous variables (maternal age, neonatal age, birth weight and gestational age), descriptive statistics were reported by a median with interquartile range. For categorical variables, frequency and percentages were computed, and the results were presented as graphs, result statements and tables. The outcome of each LBW neonate was dichotomized into censored or dead and the incidence density rate was calculated for the entire study period. Kaplan-Meier curves with Log rank tests were used to estimate median survival time and the cumulative probability of survival and compare survival times between two or more groups. The Cox-proportional hazard assumptions were checked by using the scaled Schoenfeld residual test. Those variables with p values >0.05 were considered fulfilling the assumption. Model goodness-of-fit was also checked by the Cox Snell residuals test. After checking the multicollinearity and interaction term, each independent predictor variable with p-value <0.25 in the bivariate analysis was included in multivariate Cox proportional hazard regression. Finally, an adjusted hazard ratio (AHR) with a 95% confidence interval and p values <0.05 was used to measure the strength of the association and identify statistical significance.23
Data Quality Management
The data collection checklist was a standardized tool taken from the national neonatal and labor ward registration book. Five percent of the sample sizes of LBW neonatal charts were revised before data collection for the sake of rearranging the checklist per registration system in FHCSH. After revision, the 1st, 2nd, 3rd and 4th ANC follow-ups were modified. One-day training was given to data collectors and supervisors. The supervisor carried out close supervision throughout the data collection time. Finally, all the collected data were checked by an investigator for completeness and consistency every day. Moreover, the data were checked during the time of management and analysis.
Results
Sociodemographic Characteristics of Study Subjects
During the follow-up period, 2716 LBW neonates were admitted at FHCSH. Of these, 718 neonatal charts were reviewed. From all LBW neonatal charts, male neonates accounted for 396 (55.1%) and more than half (59.3%) of the caregivers lived outside Bahir Dar city. Out of all LBW neonates, 85.8% were born from maternal age 18–35 years old. The median age of mothers was 26 years with an interquartile range (IQR) of 7 years. Among all mothers enrolled in the study, 88 (12.3%) had given their birth at home or during the journey. The highest number of neonatal admissions occurred in the first 24 hrs of neonatal life, which was 554 (77.2%). Of the total deaths, 171 (84.7%) deaths occurred from neonates admitted within 24 hrs of age (Table 1).
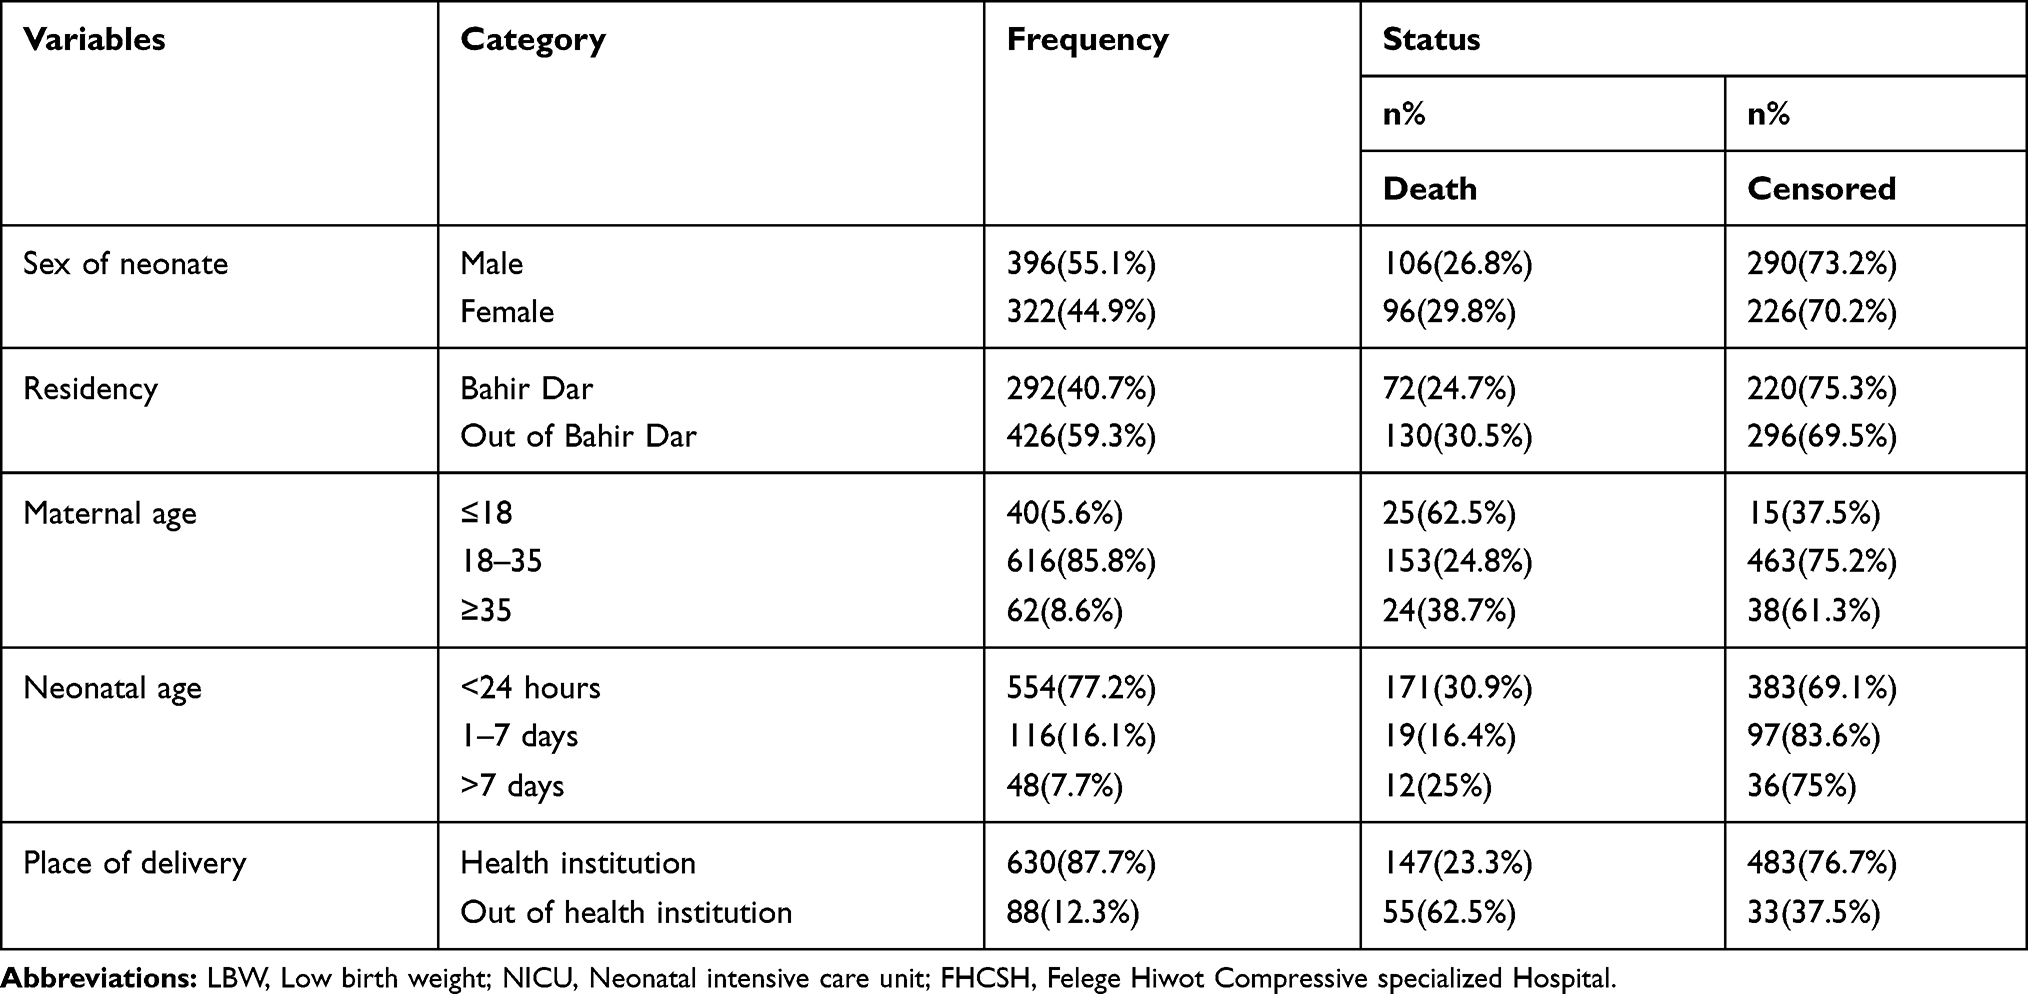 |
Table 1 Sociodemographic Characteristics of LBW Neonates Admitted to NICU of FHCSH from January 1, 2017–December 30, 2019 (N=718) |
Maternal Medical and Obstetric Characteristics
Of the 718 mothers, 86.9% had ANC follow-up at nearby health institutions. From this study, mothers who had more than or equal to two pregnancies and births accounted for 441 (61.6%) and 437 (60.9%), respectively. Among all mothers included in the study, 212 (29.5%) were diagnosed with obstetric problems. The most commonly identified obstetric problems were preeclampsia 50%, premature rapture of membrane (PROM) 35.4%, antepartum hemorrhage (APH) 17.5% and others accounting for 8%. Less than 10% of mothers were also diagnosed with medical problems, such as HIV, anemia and chronic hypertension (CHTN). Of all births, the highest percentage of births was given by spontaneous vaginal delivery 443 (61.2%). However, the highest proportion (34.9%) of LBW neonatal deaths was occurred in neonates delivered by cesarean section (Table 2).
 |
Table 2 Maternal Obstetric and Medical Characteristics of LBW Neonates Admitted to the NICU at FHCSH from January 1, 2017–December 30, 2019 (N=718) |
Common Clinical Problems and Other Characteristics of LBW Neonates Admitted to the NICU
The median weight of neonates in the birth weight cohort follow-up was 1800 gm with an interquartile range (IQR) of 601.25 gm. The majorities (68.5%) of neonates were weighted between 1500 and 2500 gm 4 and the median gestational age was 34 weeks with an IQR of 5 weeks of gestational age. For 440 (61.1%) neonates their first-minute and fifth-minute activities, pulse, grimace, appearance and respiration (APGAR) score was recorded. In this study, the most common causes of admission were sepsis 471 (65.6%), hypothermia 313 (43.6%), respiratory distress syndrome (RDS) 216 (30.1%), jaundice 83 (11.6%), perinatal asphyxia (PNA) 63 (8.8%), necrotizing enterocolitis (NEC) 42 (5.9%), congenital heart disease (CHD) 19 (2.7%) and others 12% of total admission (Table 3).
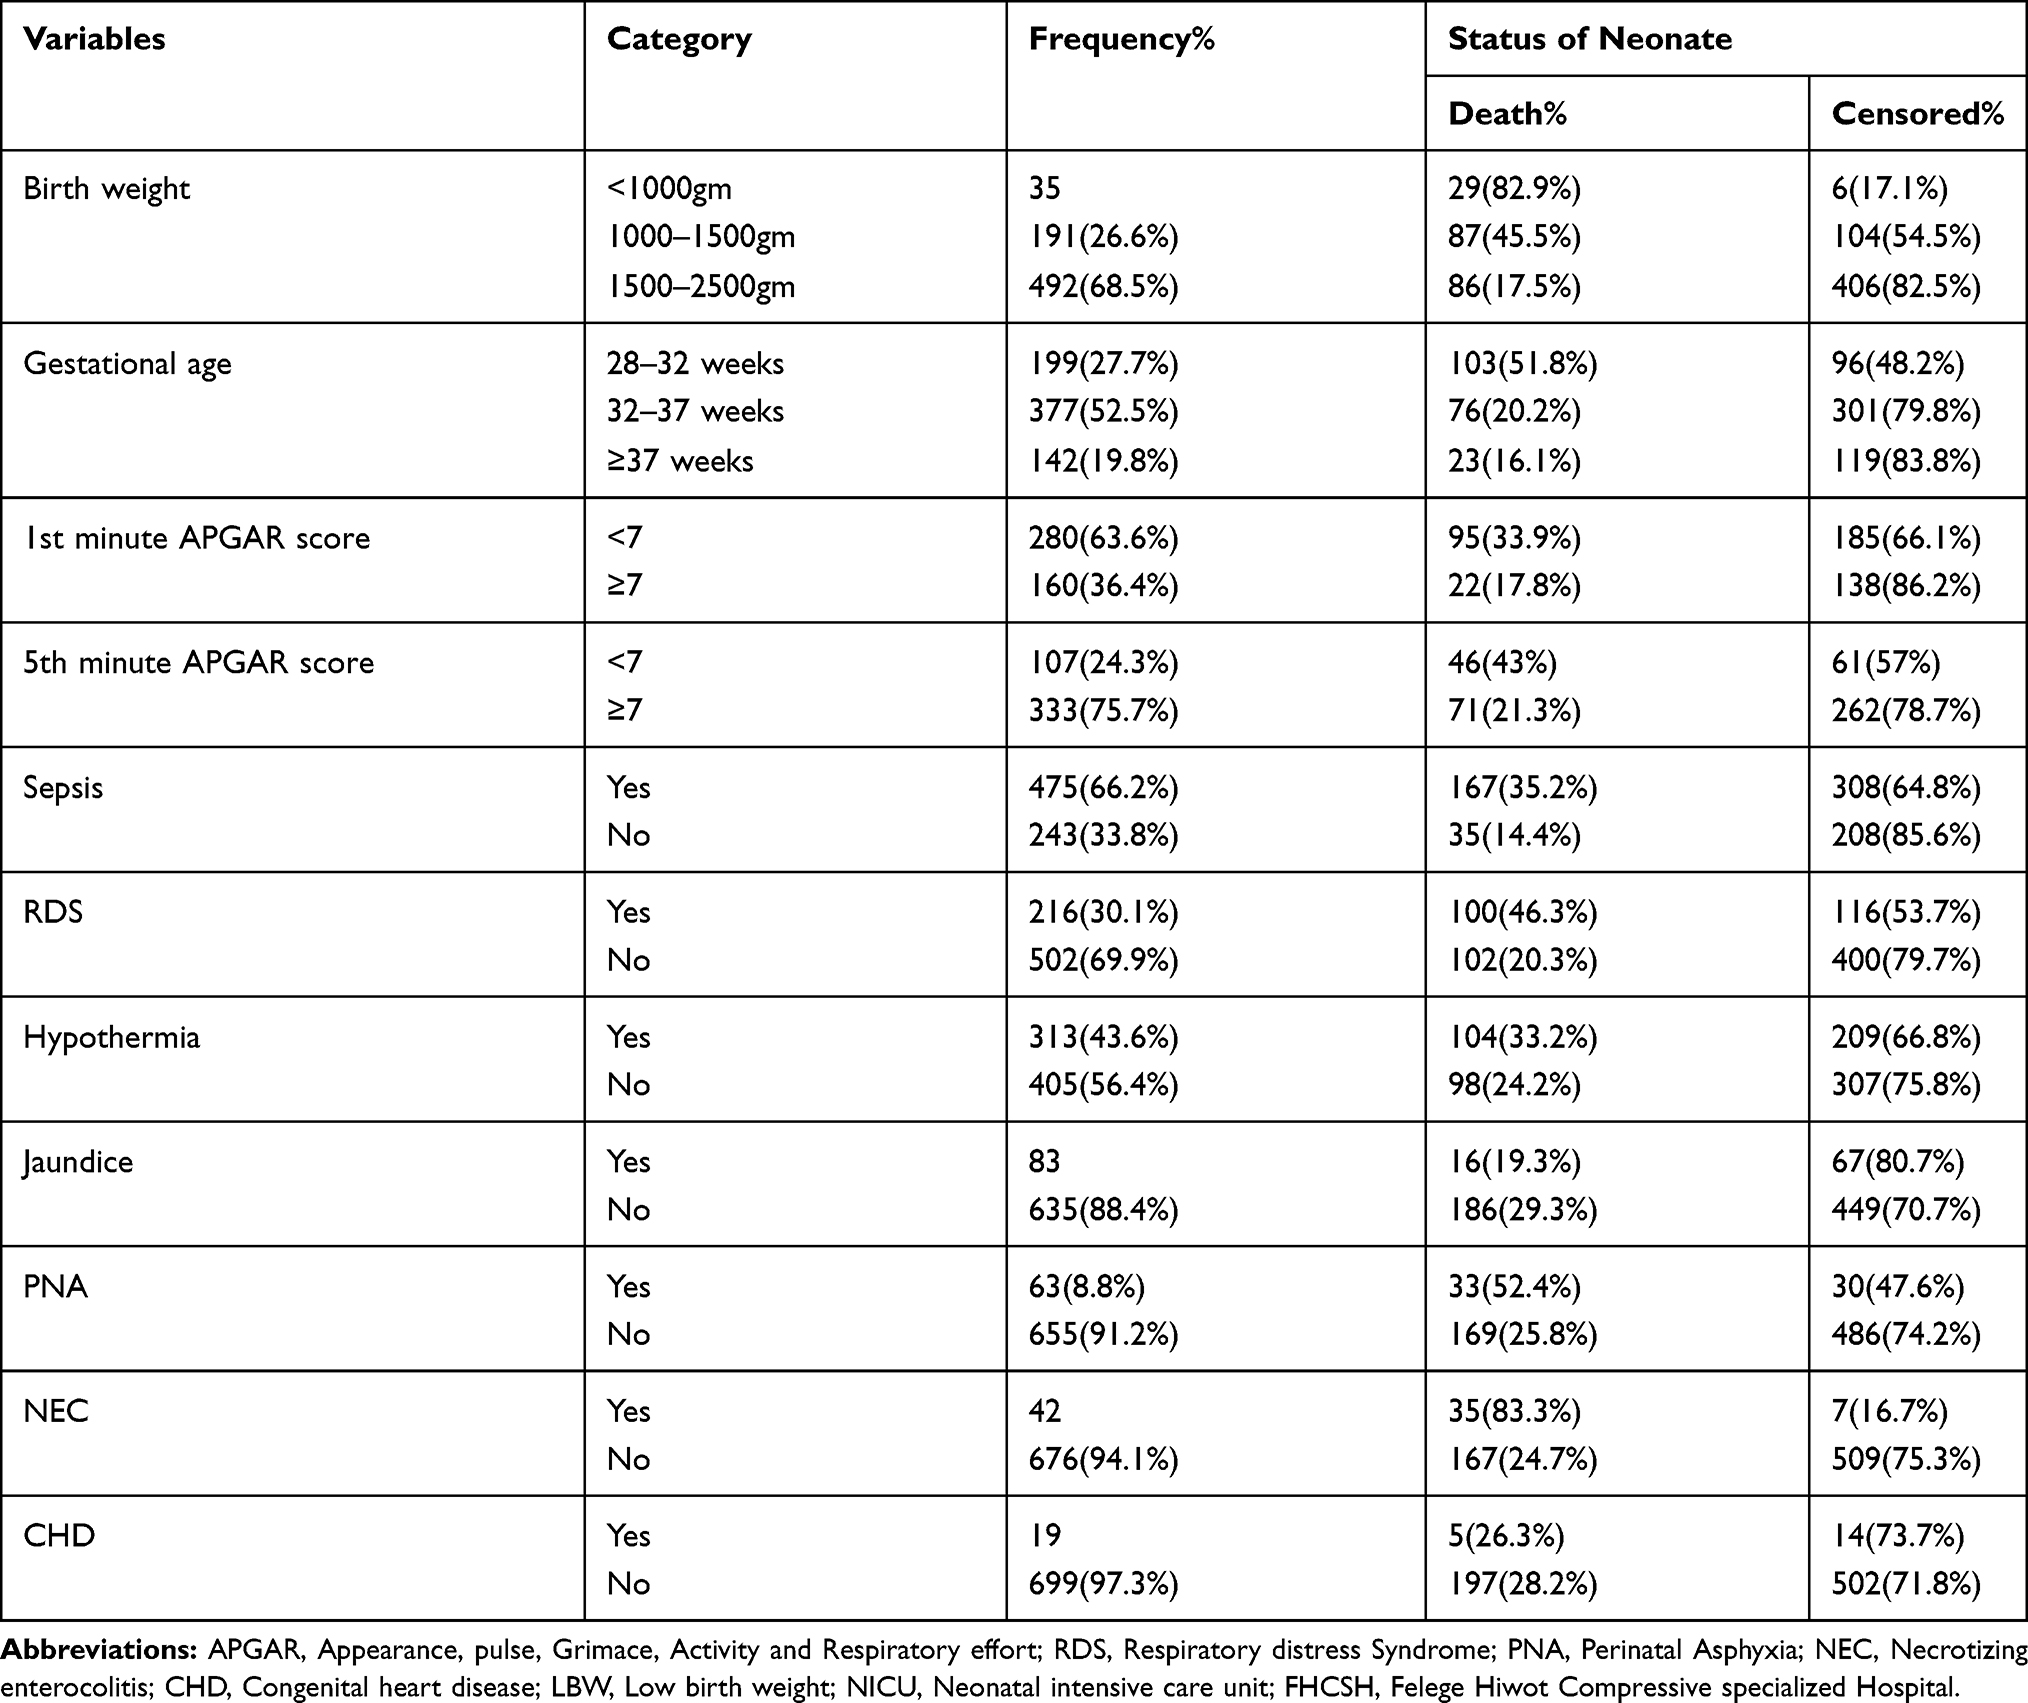 |
Table 3 Neonatal Medical and Other Characteristics of LBW Neonates Admitted to the NICU at FHCSH from January 1, 2017–December 30, 2019 (N=718) |
Survival Status of LBW Neonates Admitted to the NICU
A total of 718 LBW neonates were followed for 0–28 days. The overall proportion of neonatal mortality among the LBW neonates was 202 (28.1%) (95% CI: 25.0–31.54). Of the 516 censored LBW neonates, 395 (76.6%) were discharged with improvement, 99 (19.2%) were against medical treatment, 13 (2.5%) survived above follow-up time and 9 (1.7%) were referred to other health institutions. The overall incidence density was 35.3 per 1000 person-days (95% CI: 30.8–40.6) with 5715 person-days observation.
In this study, the incidence rates of mortality among LBW neonates in the first 24 hrs, 1–7 days and 7–28 days were 38, 22 and 29 per 1000 person-days observation, respectively. Similarly, the incidence rate of mortality for extremely low birth weight (ELBW), very low birth weight (VLBW) and LBW was 222, 48 and 23 per 1000 person-days observation, respectively. This showed that as birth weight decreases, the incidence of mortality increases (Table 4).
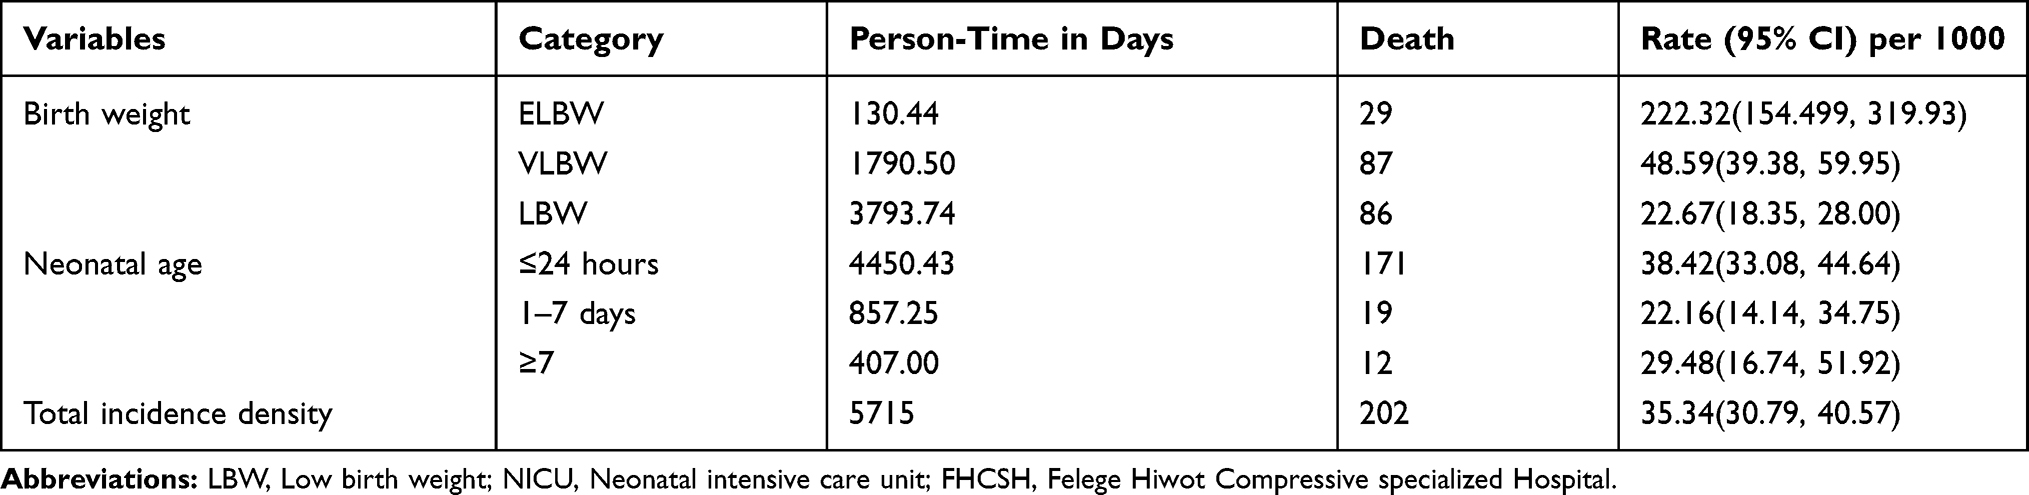 |
Table 4 Incidence Density by Birth Weight and Neonatal Age Among LBW Neonates Admitted to the NICU at FHCSH from January 1, 2017–December 30, 2019 |
Overall Survival of LBW Neonates Admitted to the NICU
The overall Kaplan-Meier estimate showed that the probability of surviving around the 1st day of admission was highest, but it decreased as follow-up time increased. The probability of survival on the 1st day and 7th day was 91.7% (95% CI: 89.4–93.5) and 71.4% (95% CI: 67.5–74.9), respectively. The first quartile survival time was 5 days (95% CI: 5–7), and the overall mean survival time was 17 days (95% CI: 16–18). The overall survival ship probability of LBW neonates admitted to the NICU throughout the follow-up period was 50.9% (95% CI: 35.9–64.0) (Figure 1).
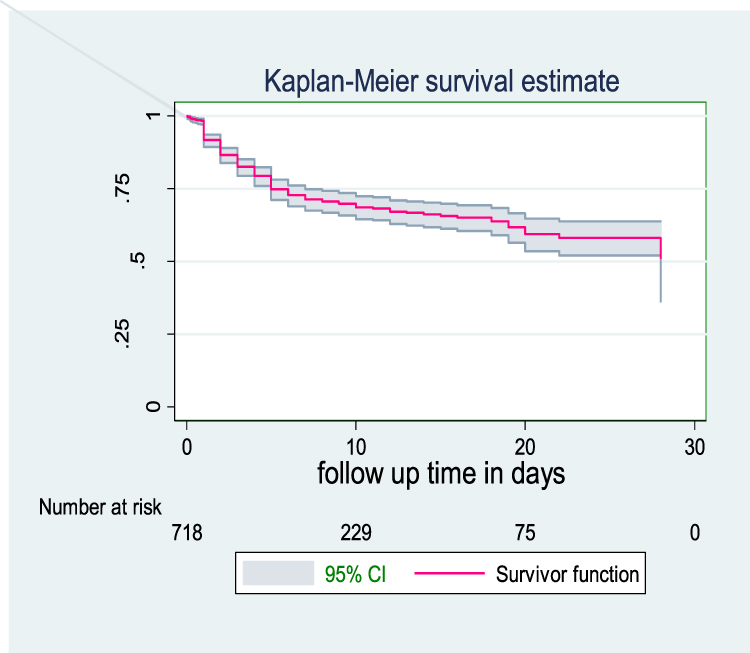 |
Figure 1 Common cause of LBW neonatal admission at NICU in FHCSH from January 1, 2017-December 30, 2019 (N=664). |
Survival Function Among Predictor Variables
In this study, LBW neonates delivered out of health institutions had lower survival with median survival time of 5 days (95% CI: 4–16) compared to those delivered at the health institution. In their overall hospital stay, the probability of survival was 29.3% and 54.9%, respectively. This difference was statistically significant (p value= 0.001). This indicates that LBW neonates delivered at health institutions had better survival time than those delivered at the outside health institution (Figure 2).
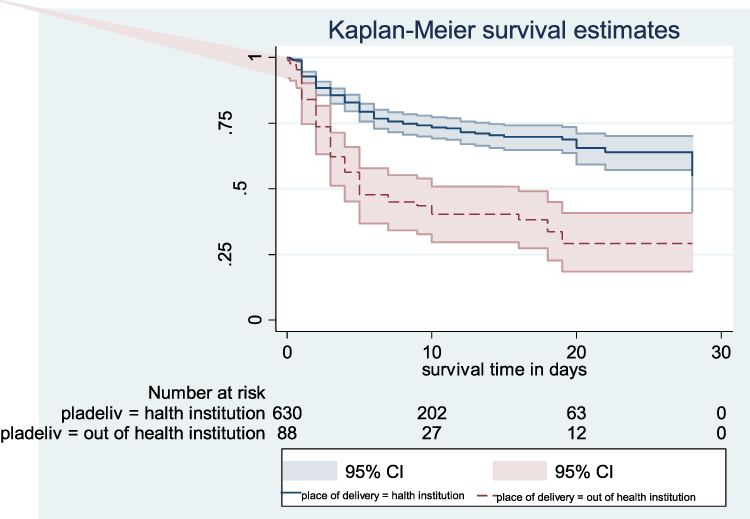 |
Figure 2 Overall Kaplan–Meier survival estimate of LBW neonates admitted in NICU at FHCSH January 1, 2017–December 30, 2019. |
The findings of this study showed that LBW neonates born from mothers less than 18 years old and greater than 35 years old had a lower survival time compared to the age group 18–35 years old. The median survival time for both age groups was 5 and 19 days, which was lower than the age group 18–35 years old. The cumulative survival probability among LBW neonates born from maternal age <18 years, 18–35 years and >35 was 0, 61.1% (95% CI: 54.1–67.3) and 48.8% (95% CI: 29.4–65.7), respectively. This difference was significant at a p-value of 0.001 (Figure 3).
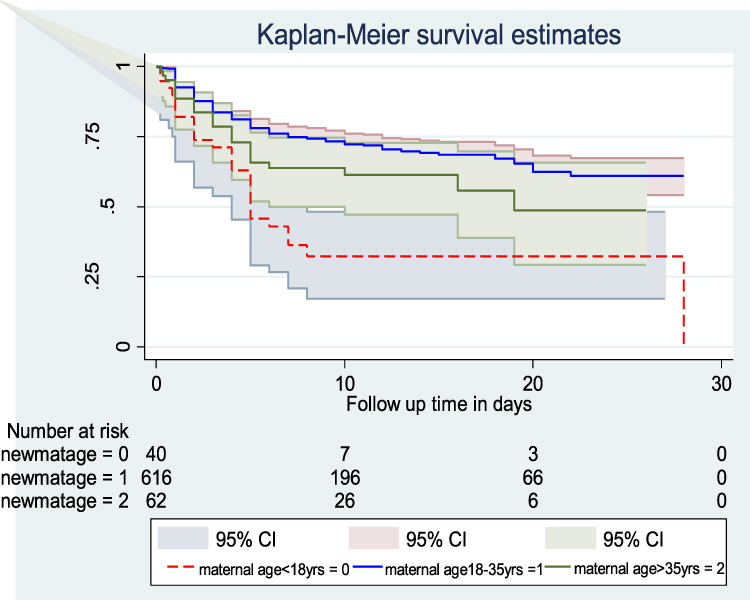 |
Figure 3 Kaplan–Meier survival estimate among LBW neonates admitted to NICU at FHCSH with the category of place of delivery from January 1, 2017–December 30, 2019. |
This study also showed the survival time difference among ELBW, VLBW and LBW neonates. The survival time of LBW>VLBW>ELBW, as shown below in Figure 4. The median survival time for ELBW was 2 days (CI: 1–4), VLBW was 19 days (95% CI: 8) and no median survival time for those LBW up to the end of the study. The overall survival probability for ELBW, VLBW and LBW was 9.3% (95% CI: 1.9–23.4), 34% (95% CI: 15.2–53.9) and 69.4% (95% CI: 60.9–76.3), respectively. This difference was statistically significant (p value=0.001) (Figure 5).
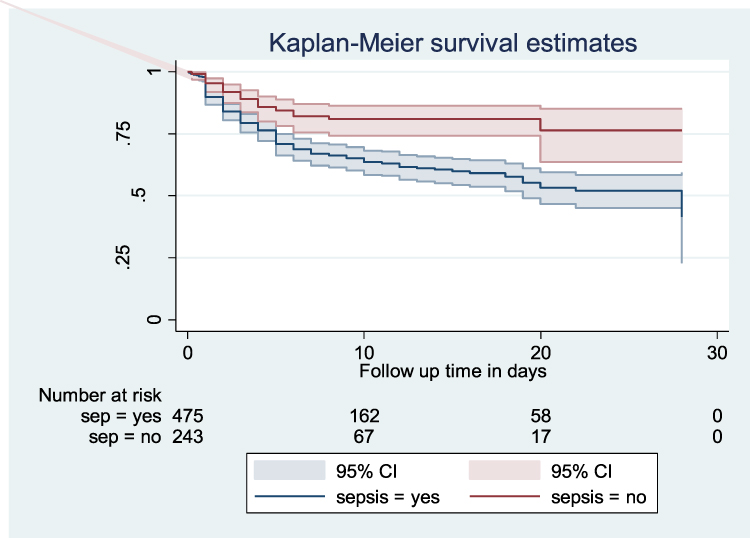 |
Figure 4 Kaplan–Meier survival estimate among LBW neonates admitted to NICU at FHCSH with the category of sepsis from January 1, 2017–December 30, 2019. |
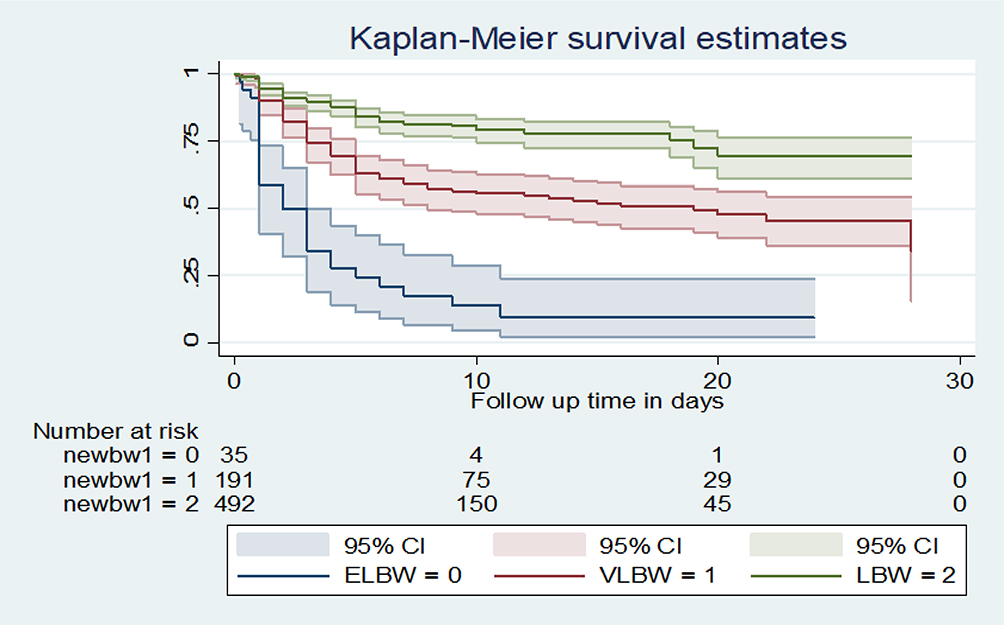 |
Figure 5 Kaplan–Meier survival estimate among LBW neonates admitted to NICU at FHCSH with the category of maternal age from January 1, 2017–December 30, 2019. |
LBW neonates with sepsis had a median survival time of 28 days. Nevertheless, greater than 50% of neonates without sepsis survived over the follow-up period. The overall survival rate for sepsis case was 50.6% (95% CI: 43.6–57.3), and that for non-sepsis cases was 75.1% (95% CI: 61.8–84.3%). This difference was statistically significant (p-value =0.001) (Figure 6).
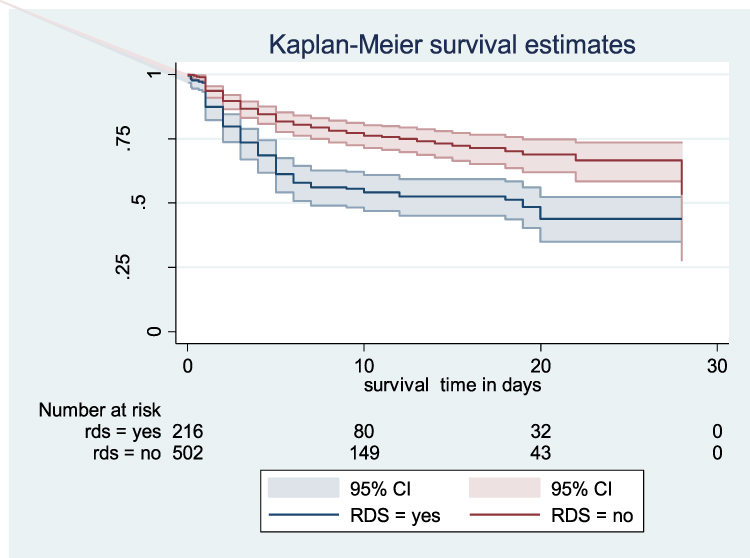 |
Figure 6 Kaplan–Meier survival estimate among LBW neonates admitted to NICU at FHCSH with the category of birth weight from January 1, 2017–December 30, 2019. |
The Kaplan-Meier survival curve showed that the median survival time of those neonates who had RDS was 19 days. The overall probability of survival for both RDS and without RDS was 43.9% and 53.3%, respectively. The Log rank test for this difference was significant at (p value=0.001). This indicates that neonates with RDS survived less than those without RDS (Figure 4).
Those hypothermic LBW neonates had lower survival rates than non-hypothermic neonates, with survival rate of 39.78% (95% CI: 17.44–61.47) and 62.12% (95% CI: 53.33–69.73), respectively. The median survival time for hypothermic neonates was 28 days. This difference was statistically significant using Log rank test (p value= 0.016) (Figure 7).
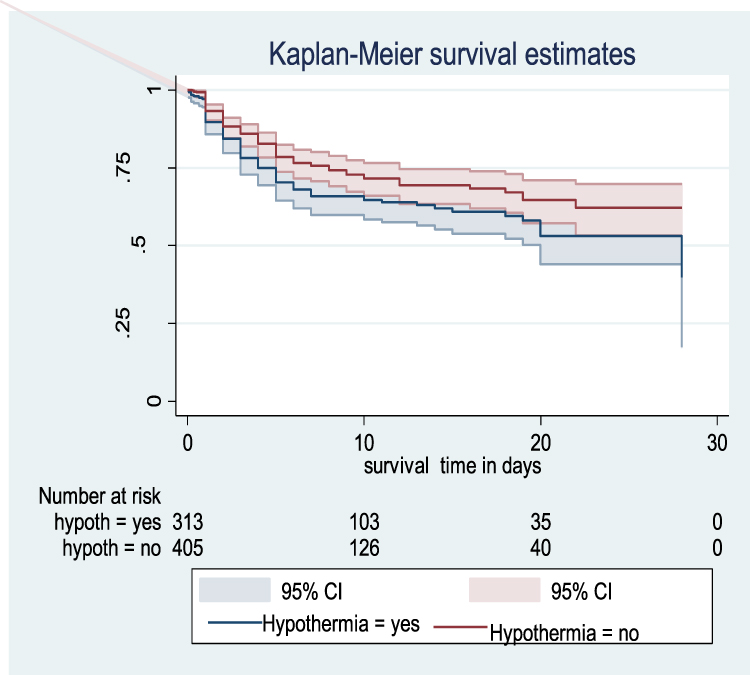 |
Figure 7 Kaplan–Meier survival estimate among LBW neonates admitted to NICU at FHCSH with the category of RDS from January 1, 2017–December 30, 2019. |
The Kaplan-Meier estimate showed that LBW neonates with NEC had a lower survival rate with an overall survival rate of 7.7% (95% CI: 1.5–20.9) than its counterpart with a survival rate of 60.8% (95% CI: 54.1–66.8). The median survival time for neonates with NEC was 3 days. This indicates that the majority of neonates with NEC died during the early neonatal period. This difference was statistically significant (p value= 0.001) (Figure 8).
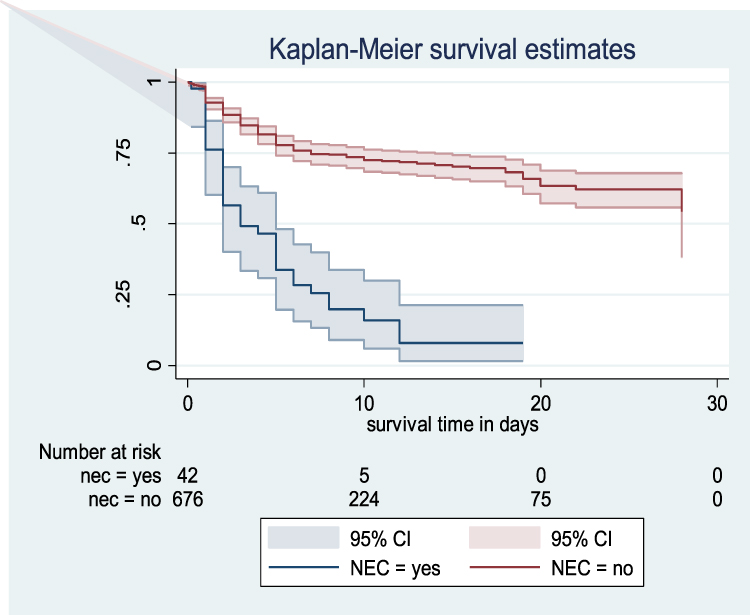 |
Figure 8 Kaplan–Meier survival estimate among LBW neonates admitted to NICU at FHCSH with the category of hypothermia from January 1, 2017–December 30, 2019. |
Cox Proportional Hazard Model for Different Predictor Variables
Cox proportional hazard model was used to identify predictors of mortality in LBW neonates. In bivariate Cox proportional hazard regression, from sociodemographic characteristics; maternal age, neonatal age, residency and place of delivery were significant predictors (p value <0.25). From maternal obstetric and medical predictors; ANC follow-up, mode of delivery, preeclampsia, APH and anemia. Among neonatal medical predictors; birth weight, gestational age, 1st and 5th minute APGAR score, sepsis, jaundice, RDS, PNA, NEC and hypothermia were significant predictors of mortality in LBW neonates (p-value <0.25). After assessing multicollinearity and interaction terms, those significant predictors in bivariate analysis were analyzed with a multivariate Cox proportional model. In a multivariate proportional hazard model, after possible confounders were controlled, place of delivery, maternal age, sepsis, RDS, NEC and birth weight remained potential independent predictors of mortality (p value <0.05).
Multivariate analysis revealed that LBW neonates delivered outside health institutions were 2.31 times as likely to have died at any time as LBW neonates delivered at health institutions [AHR; 2.31 (95% CI: 1.2–4.42)]. LBW neonates with sepsis were 2.33 times as likely to have died at any time as LBW neonates without sepsis [AHR; 2.33 (95% CI: 1.38–3.94)]. Low birth weight neonates with RDS were also 1.92 times as likely to have died at any time as LBW neonates without RDS [AHR; 1.92 (95% CI: 1.27–2.89)]. LBW neonates with NEC were 3.09 times as likely to have died at any time as LBW neonates without NEC [AHR; 3.09 (95% CI: 1.69–5.64)]. Low birth weight neonates whose mothers were less than 18 years old and greater than 35 years old were 3.08 [AHR 3.08 (95% CI; 1.64–5.81)] and 3.83 [AHR; 3.83 (95% CI: 2.00–7.31)] times as likely to have death at any time as LBW neonates delivered from mothers aged between 18–35 years old. Low birth weight neonates born with birth weights of less than 1000 gm were 3.61 times as likely to have died at any time as LBW neonates weighing between 1500 and 2500 gm [AHR; 3.61, (95% CI:1.73–7.55)] (Table 5).
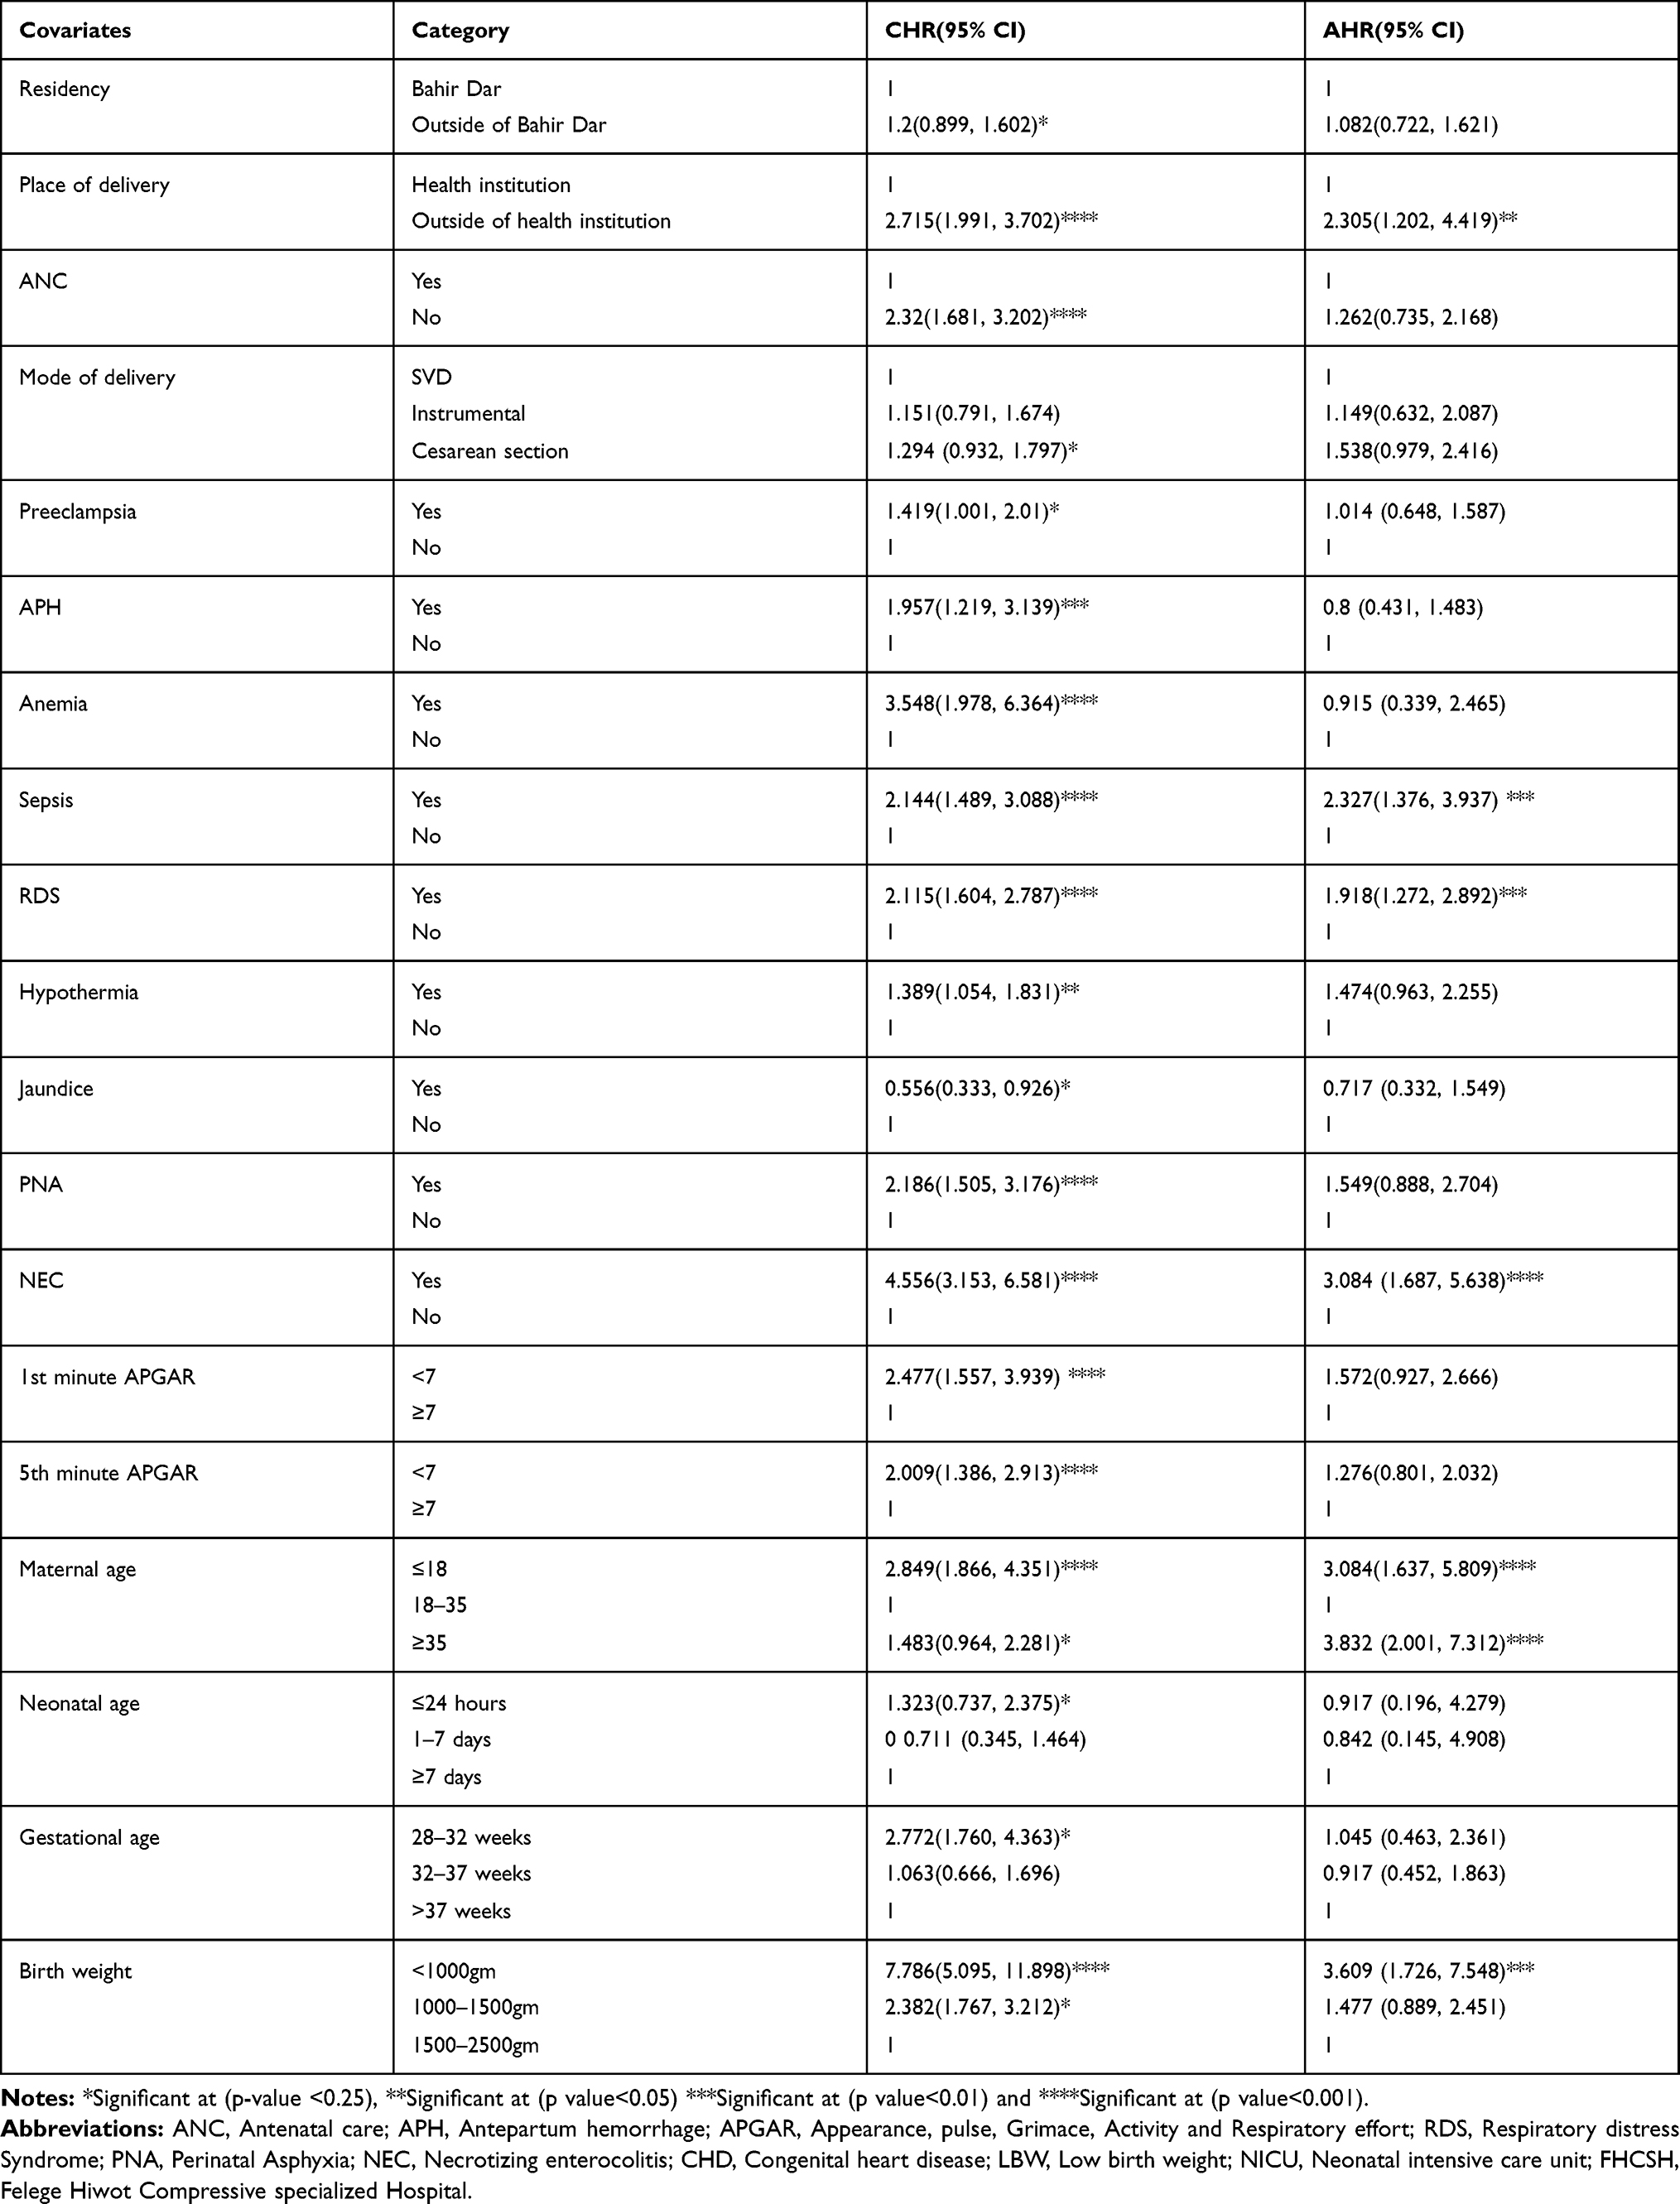 |
Table 5 Bivariate & Multivariate Cox Proportional Hazard Regression Outputs of LBW Neonates Who Were Admitted to the NICU at FHCSH from January 1, 2017–December 30, 2019 |
Cox Proportional Hazard Assumption Test
For each covariate, the Cox proportional hazard assumption was performed individually and simultaneously (globally). The test showed that the p-value for each covariate and the whole covariates simultaneously were >0.05. This showed that there were no time-varying covariates in the model.23
Discussion
This study reports an overall 28 days survival rate and predictors of mortality among low birth weight neonates admitted to the neonatal intensive care unit in FHCSH from January 1, 2017–December 30, 2019. This study showed that the proportion of mortality among LBW neonates admitted to the NICU in the FHCSH group was 28.1%, which was in line with a study conducted in India.24 However, it was higher than the study conducted in Indonesia (12.1%)25 and Iran (14.4%).26 This variation is due to the NICU physical environment difference. For example, in technologically advanced countries such as Iran, there is a dedicated ward space, enough neonatal bed, and even the distance between the NICU and labor ward is closely constructed. The other justification is that the ward of those developed nations might be staffed with health workers with specialty training, such as neonatologists, perinatologists and nursing specialties, unlike sub-Saharan African countries, including Ethiopia.27 Another justification is due to differences in the health care utilization of mothers due to discrepancies in socio-cultural factors. Contrarily, the findings of this study were lower than those of studies conducted at Zimbabwe (51.2%)28 and India (32.8%).29 This is due to the fact that with time, even if a reduction in neonatal mortality is not satisfactory, the skilled birth attendant is increased, NICU is expanded in a well-organized manner, the health-seeking and utilization behavior of the community is improved and accessibility of trained health care providers is comparatively increased. Second, this is due to differences in length of follow-up period, study period, study population, and study setting. The current study also revealed that the overall incidence rate of LBW neonates was 35.4 deaths per thousand person day observation, which was higher than the study conducted at Burkina Faso 1.93 per thousand person-days observation.30 This variation is due to study setting differences, study population difference and sociodemographic characteristic differences.
In this study, the highest proportion of deaths was recorded at 1–7 days of neonatal age 55.5%, which is consistent with the study conducted in India (51%). However, the proportion of deaths within 24 hours of age (23.27%) was higher than the study conducted in India (13%).31 This discrepancy is due to study population difference. In the Indian study, only inborn neonates were included that helped to receive care immediately after birth, but this study included outborn neonates, which delayed receiving care.
The overall mean survival time of this study was 19 days, which is higher than the study conducted in Iran (7.65 days).26 This discrepancy is due to extreme preterm neonates being included in the Iranian study, which decreases their survival time. The other justification is that now the improvements in terms of maternal awareness of health services, quality of NICU care and care at the delivery ward are increasing over time.
Place of delivery, maternal age less than 18 and greater than 35 years, sepsis, RDS, NEC and birth weight <1000 gm remained significant predictors of mortality in the multivariate Cox proportional hazard model. In the current study, LBW neonates delivered by mothers aged less than 18 years old were three times more likely to die than their counterparts. This was supported by studies conducted in Indonesia and Sub Saharan Africa.32,33 This is due to a biological effect mediated by young mother’s physiological immaturity.34 The other explanation is due to the difficulties of young mothers accessing health services due to the negative attitude from health providers. Similarly, the hazard of death was also four times higher in LBW neonates born from mothers greater than 35 years old than mothers aged 18–35 years old. Some studies have indicated that advanced maternal age is more prone to adverse maternal and neonatal outcomes, such as pregnancy-induced hypertension, APH, LBW and low APGAR scores, which in turn make them at greater risk of death.35,36
In our study, the hazard of mortality among neonates delivered outside health institutions was two folds higher than neonates delivered at the health institution. This was similar to a study conducted in Johannesburg.37 This is due to a lack of basic newborn care, delaying health services, environmental factors and even health professionals who did not obtain enough information to make the correct diagnosis. These factors enhance the rate of death in neonates delivered in an outside health institution.10
In this study, the hazard of death among LBW neonates was enhanced by two times due to the presence of sepsis, which was similar to studies in northern India.24,31 This is because LBW neonates have decreased immune function because of the low level of some immune cells, such as immunoglobulin G resulting from the low transfer of maternal immunoglobulin G.38
Neonates with RDS at admission were two times the hazard of death compared with neonates without RDS. This finding is supported by studies, such as at Zimbabwe,39 Brazil,40 Iran41 and Indian study.31 Since the majority of LBW neonates are preterm, the problem of lung immaturity is a common phenomenon that leads to lung collapse and respiratory failure.5 Similarly, the hazard of mortality among neonates with NEC was threefold higher than that among neonates without NEC. This is supported by a study conducted in Brazil.40 As evidenced by the results of this study, the majority of study subjects were preterm. Therefore, premature neonates are prone to the immaturity of the gastrointestinal tract regarding motility, digestive function, circulatory regulation, barrier function, and immune defense. This enhances the probability of death.5
The other predictor variable for the survival rate of LBW was birth weight. Neonates with birth weights of less than 1000 gm were three-point six times the hazard of death compared with neonates with birth weights of 1500–2500 gm. This was in line with a study conducted in southern Ethiopia,21 Pakistan42 and Zimbabwe.28 This is because as birth weight decreases exposure to various health problems increases, such as infection, hypothermia, hypoglycemia and electrolyte imbalance.5
Limitations of the Study
Since this study used secondary data, important predictors, such as maternal educational status and maternal nutritional predictors, were missed. Second, selection bias might be present during chart selection because charts with incomplete data were excluded from the study. The severity of the clinical condition was not included.
Conclusion
The findings of this study showed that two of the seven neonates died during the follow-up period among LBW neonates admitted to the NICU in FHCSH. The highest incidence rate of mortality was recorded in the first 24 hours of neonatal life, whereas; the largest proportion of mortality was seen within 1–7 days of neonatal age. The overall probability of survival decreases as birth weight decreases. The major predictors that decreased the survival rate among LBW were deliveries outside health institutions, maternal age less than 18 and greater than 35 years old, sepsis, RDS, NEC and birth weight less than 1000 gm. This evidence helps health professionals and policy makers in early identification of high-risk neonates and timely intervention for their better survival and also used for future researchers.
Abbreviations
AHR, Adjusted Hazard Ratio; ANC, Antenatal Care; APGAR, Activity, Pulse, Grimace, Appearance and respiration; APH, Antepartum Hemorrhage; CHD, Congenital Heart Disease; CHR, Crude Hazard Ratio; CHTN, Chronic Hypertension; EDHS, Ethiopian Demographic and Health Survey; ELBW, Extremely Low Birth Weight: FHCSH, Felege Hiwot Comprehensive Specialized Hospital; LBW, Low Birth Weight; NEC, Necrotizing Enter Colitis; NICU, Neonatal Intensive Care Unit; NMR, Neonatal Mortality Rate; PNA, Perinatal Asphyxia; RDS, Respiratory Distress Syndrome; VLBW, Very Low Birth Weight.
Data Sharing Statement
The data used in this manuscript are available upon reasonable request by contacting the corresponding authors via email.
Ethical Approval
Ethical clearance was obtained from Bahir Dar University College of Medicine and Health Science, School of Health Science Ethical Review Board with a protocol number of 0028/2020. Then, officials at different levels of the hospital were communicated through formal letters. Confidentiality of the information was secured throughout the study process.
Declarations
This study was conducted in accordance with the Declaration of Helsinki.
Acknowledgments
The authors thank the staff of Felege Hiwot Comprehensive Specialized Hospital.
Author Contributions
All authors contributed to data analysis, drafting or revising the article, have agreed on the journal to which the article will be submitted, gave final approval for the version to be published, and agreed to be accountable for all aspects of the work.
Funding
The authors have also confirmed that no financial funding was received for the study, authorship, and publication of this article.
Disclosure
The authors declare that they have no conflicts of interest.
References
1. World Health Organization. Global Nutrition Targets 2025. Low Birth Weight Policy Brief. World Health Organization; 2014.
2. WHO. International Statistical Classification of Diseases and Related Health.
3. UNICEF-WHO. Low Birthweight Estimates: Levels and Trends 2000–2015. Geneva: UNICEF-WHO; 2019.
4. Wardlaw T, Blanc A, Zupan J, Ahman E. Low Birthweight: Country, Regional and Global Estimates. United Nations Children’s Fund and World Health Organization; 2005.
5. Hay WW, Levin MJ, Deterding RR, Abzug MJ. Current Diagnosis & Treatment Pediatrics. McGraw-Hill Medical; 2018.
6. Gu H, Wang L, Liu L, et al. A gradient relationship between low birth weight and iq: a meta-analysis. Sci Rep. 2017;7(1):18035. doi:10.1038/s41598-017-18234-9
7. Christian P, Lee SE, Angel MD, et al. Risk of childhood undernutrition related to small-for-gestational age and preterm birth in low-and middle-income countries. Int J Epidemiol. 2013;42(5):1340–1355. doi:10.1093/ije/dyt109
8. Jornayvaz FR, Vollenweider P, Bochud M, Mooser V, Waeber G, Marques-Vidal P. Low birth weight leads to obesity, diabetes and increased leptin levels in adults: the colaus study. Cardiovasc Diabetol. 2016;15(1):73. doi:10.1186/s12933-016-0389-2
9. WHO. Care of the Preterm and Low-Birth-Weight Newborn: World prematurity Day. WHO; 2018.
10. UNICEF. A Fair Chance for Every Child: The State of the World’s Children 2016, Developed by Unicef Country and Regional Offices and Headquarters Divisions. UNCIF; 2016.
11. Marchant T, Willey B, Katz J, et al. Neonatal mortality risk associated with preterm birth in East Africa, adjusted by weight for gestational age: individual participant level meta-analysis. PLoS Med. 2012;9(8):e1001292. doi:10.1371/journal.pmed.1001292
12. UN IGME. Levels & Trends in Child Mortality: Report 2019. Estimates Developed by the United Nations Interagency Group for Child Mortality Estimation (UN IGME). New york: United nations children’s fund; 2019.
13. Endalamaw A, Engeda EH, Ekubagewargies DT, Belay GM, Tefera MA. Low birth weight and its associated factors in Ethiopia: a systematic review and meta-analysis. Ital J Pediatr. 2018;44(1):141. doi:10.1186/s13052-018-0586-6
14. Federal Democratic Republic Of Ethiopia. Mini demographic and health survey of key indicators. 2019.
15. I CSA. Ethiopia Demographic and Health Survey. Addis Ababa, Ethiopia and Calverton, Maryland, USA: Central Statistical Agency (CSA) [Ethiopia] and ICF; 2016.
16. Inter-Parliamentary Union. The millennium development goals report 2007. 2008.
17. Ethiopian Ministry of Health. Hstp. 2015.
18. World Health Organization. World Health Statistics 2016: Monitoring Health for the Sdgs Sustainable Development Goals. World Health Organization; 2016.
19. UN. The global strategy for women’s, children’s and adolescents’ health (2016–2030). Organization. 2016;201:4–103.
20. Adane T, Dachew BA. Low birth weight and associated factors among singleton neonates born at felege hiwot referral hospital, North West Ethiopia. Afr Health Sci. 2018;18(4):1204–1213. doi:10.4314/ahs.v18i4.42
21. Eshete A, Alemu A, Zerfu TA. Magnitude and risk of dying among low birth weight neonates in Rural Ethiopia: a community-based cross-sectional study. Int J Pediatr. 2019;2019:1–8. doi:10.1155/2019/9034952
22. Federal Ministry of Health Of Ethiopia. Neonatal Intensive Care Unit (Nicu) Training Participants’ Manual. Addisababa: Federal Ministry of Health Of Ethiopia; 2014.
23. Kleinbaum DG, Klein M. Survival Analysis a Self‐Learning Text.
24. Mukhopadhyay K, Louis D, Mahajan R, Kumar P. Predictors of mortality and major morbidities in extremely low birth weight neonates. Indian Pediatr. 2013;50(12):1119–1123. doi:10.1007/s13312-013-0305-8
25. Ketut Duara I, Wirawan DN, Januraga PP, Sagung Sawitri AA. Determinants of mortality among low birthweight infants. Public Health Prev Med Arch. 2016;4(2):215–221.
26. Moghaddam PS, Aghaali M. Survival of 798 low birth weight infants according to birth weight and gestational age. Shiraz E-Med J. 2015;16(11–12). Available form: https://www.vsointernational.org/sites/default/files/VSO-knowledge-product-nicu.pdf.
27. Vso Knowlege Product. Developing newborn intensive care units (nicu). 2018.
28. Zvenyika-Hlatywayo LT. Risk factors for mortality in low birth weight infants at Harare hospital (maternity unit). 2016.
29. Devi GR, Rao KR, Reddy VR. Morbidity and mortality of low birth weight newborns admitted in sncu/nicu in a tertiary care hospital. 2017.
30. Coulibaly A, Baguiya A, Millogo T, Meda IB, Koueta F, Kouanda S. Predictors of mortality of low birth weight newborns during the neonatal period: a cohort study in two health districts of Burkina Faso. Int J Gynecol Obstetr. 2016;135(S1):S89–S92. doi:10.1016/j.ijgo.2016.08.006
31. Bansal A, Chawla D. Mortality and morbidity profile of preterm very low birth weight infants. A prospective longitudinal observational study. Indian J Child Health. 2017;4(2):225–230. doi:10.32677/IJCH.2017.v04.i02.026
32. Suparmi S, Chiera B, Pradono J. Low birth weights and risk of neonatal mortality in Indonesia. Health Sci J Indones. 2016;7(2):113–117. doi:10.22435/hsji.v7i2.5587.113-117
33. Huda TM, Tahsina T, Arifeen SE, Dibley MJ. The importance of intersectoral factors in promoting equity-oriented universal health coverage: a multilevel analysis of social determinants affecting neonatal infant and under-five mortality in Bangladesh. Glob Health Action. 2016;9(1):29741. doi:10.3402/gha.v9.29741
34. Ramaiya A, Kiss L, Baraitser P, Mbaruku G, Hildon Z. A systematic review of risk factors for neonatal mortality in adolescent mother’s in Sub Saharan Africa. BMC Res Notes. 2014;7(1):750. doi:10.1186/1756-0500-7-750
35. Maeruf H, Robles CC, Woldemariam S, et al. Advanced maternal age pregnancy and its adverse obstetrical and perinatal outcomes in ayder comprehensive specialized hospital, Northern Ethiopia, 2017: a comparative cross-sectional study. BMC Pregnancy Childbirth. 2020;20(1):60. doi:10.1186/s12884-020-2740-6
36. Aboneaaj M. The association of advanced maternal age and adverse pregnancy outcomes. 2015.
37. Ballot DE, Chirwa T, Ramdin T, et al. Comparison of morbidity and mortality of very low birth weight infants in a central hospital in Johannesburg between 2006/2007 and 2013. BMC Pediatr. 2015;15(1):20. doi:10.1186/s12887-015-0337-4
38. Jenson HB, Pollock BH. Meta-analyses of the effectiveness of intravenous immune globulin for prevention and treatment of neonatal sepsis. Pediatrics. 1997;99(2):e2–e. doi:10.1542/peds.99.2.e2
39. Zvenyika-Hlatywayo LT, Chimhuya S, Gumbo FZ. Risk factors for mortality in low birth weight infants at Harare hospital (maternity unit), Zimbabwe. Clin Pediatr Res. 2018;2(1):33–41.
40. Guinsburg R, De Almeida MFB, De Castro JS, et al. Death or survival with major morbidity in VLBW infants born at Brazilian neonatal research network centers. J Matern Fetal Neonatal Med. 2016;29(6):1005–1009. doi:10.3109/14767058.2015.1031740
41. Lim JW, Chung S-H, Kang DR, Kim C-R. Risk factors for cause-specific mortality of very-low-birth-weight infants in the Korean neonatal network. J Korean Med Sci. 2015;30(Suppl 1):S35–S44. doi:10.3346/jkms.2015.30.S1.S35
42. Hussain S, Tarar SH. Neonatal mortality of low birth weight neonates born in a tertiary care teaching hospital in Pakistan. Malay J Paediatr Child Health. 2015;3(21):1.
 © 2021 The Author(s). This work is published and licensed by Dove Medical Press Limited. The full terms of this license are available at https://www.dovepress.com/terms.php and incorporate the Creative Commons Attribution - Non Commercial (unported, v3.0) License.
By accessing the work you hereby accept the Terms. Non-commercial uses of the work are permitted without any further permission from Dove Medical Press Limited, provided the work is properly attributed. For permission for commercial use of this work, please see paragraphs 4.2 and 5 of our Terms.
© 2021 The Author(s). This work is published and licensed by Dove Medical Press Limited. The full terms of this license are available at https://www.dovepress.com/terms.php and incorporate the Creative Commons Attribution - Non Commercial (unported, v3.0) License.
By accessing the work you hereby accept the Terms. Non-commercial uses of the work are permitted without any further permission from Dove Medical Press Limited, provided the work is properly attributed. For permission for commercial use of this work, please see paragraphs 4.2 and 5 of our Terms.