Back to Journals » International Journal of Nanomedicine » Volume 18
Surface Engineering of HEK293 Cell-Derived Extracellular Vesicles for Improved Pharmacokinetic Profile and Targeted Delivery of IL-12 for the Treatment of Hepatocellular Carcinoma
Authors Zhang J, Song H ![]() , Dong Y, Li G
, Dong Y, Li G ![]() , Li J, Cai Q, Yuan S, Wang Y
, Li J, Cai Q, Yuan S, Wang Y ![]() , Song H
, Song H
Received 9 September 2022
Accepted for publication 24 December 2022
Published 13 January 2023 Volume 2023:18 Pages 209—223
DOI https://doi.org/10.2147/IJN.S388916
Checked for plagiarism Yes
Review by Single anonymous peer review
Peer reviewer comments 2
Editor who approved publication: Dr Yan Shen
Jing Zhang,1 Haijing Song,2 Yanan Dong,1 Ganghui Li,3 Jun Li,1 Qizhe Cai,4 Shoujun Yuan,5 Yi Wang,1 Haifeng Song1
1State Key Laboratory of Proteomics, Beijing Proteome Research Center, National Center for Protein Sciences (Beijing), Beijing Institute of Lifeomics, Beijing, 102206, People’s Republic of China; 2Emergency Medicine, PLA Strategic Support Force Medical Center, Beijing, 100101, People’s Republic of China; 3China Pharmaceutical University, Nanjing, 211198, People’s Republic of China; 4Department of Echocardiography, Beijing Chao Yang Hospital, Capital Medical University, Beijing, 100020, People’s Republic of China; 5Beijing Institute of Radiation Medicine, Beijing, 100850, People’s Republic of China
Correspondence: Haifeng Song; Yi Wang, National Center for Protein Sciences (Beijing), Beijing Institute of Lifeomics, Beijing, 102206, People’s Republic of China, Tel +86 10 81139169, Fax +86 10 81139169, Email [email protected]; [email protected]
Background: Extracellular vesicles (EVs) are considered a promising drug delivery platform. Naïve EVs face numerous issues that limit their applications, such as fast clearance, hepatic accumulations, and a lack of target-specific tropism. We aimed to explore a series of surface engineering approaches to: 1) reduce the non-specific adhesion of EVs, and 2) improve their enrichment in the target tissue. As a proof-of-concept, we investigated the therapeutic potentials of a multi-modal EVs system carrying a tumor-specific nanobody and the immuno-stimulant interleukin-12 (IL12) using in vivo models of hepatocellular carcinoma.
Methods: The major cell adhesion molecule on the HEK293-derived EVs, integrin β 1 (ITGB1), was knocked out (KO) by CRISPR/Cas9-mediated gene editing, followed by deglycosylation to generate ITGB1−Deg EVs for the subsequent pharmacokinetic and biodistribution analyses. ITGB1−Deg EVs were further loaded with glypican-3 (GPC3)-specific nanobody (HN3) and mouse single-chain IL12 (mscIL12) to generate ITGB1−mscIL12+HN3+Deg EVs, for evaluation of tumor tropism and therapeutic potential in a mice model of hepatocellular carcinoma.
Results: Removal of ITGB1 led to the broad suppression of integrins on the EVs surface, resulting in a decrease in cellular uptake. Deglycosylation of ITGB1− EVs gave rise to inhibition of the EVs uptake by activated RAW264.7 cells. ITGB1 removal did not significantly alter the pharmacokinetic behaviors of HEK293-EVs, whereas the ITGB1−Deg EVs exhibited enhanced systemic exposure with reduced hepatic accumulation. Loading of HN3 conferred the ITGB1−Deg EVs with tumor-specific tropism for both subcutaneous and metastasized tumors in mice. The ITGB1−mscIL12+HN3+Deg EVs activated mouse splenocytes with high potency. Systemic administration of the EVs with the equivalent dose of 1.5μg/kg of exosomal IL12 achieved satisfactory tumor growth inhibition and good tolerability.
Conclusion: The combinatorial approach of EVs surface engineering conferred HEK293-EVs with reduced non-specific clearance and enhanced tumor targeting efficacy, which constituted an efficient delivery platform for critical cancer therapeutics like IL12.
Keywords: exosome, glycosylation, glycan, drug delivery
Introduction
Extracellular vesicles (EVs) are cell-secreted nanosized particles containing a variety of biomaterials in a lipid bilayer encapsulated form. Among different types of EVs, the smallest type or microvesicles (MVs) are widely employed as naturally derived therapeutic vehicles with great versatility in terms of cargo types, eg, peptide, membrane protein, miRNA, and mRNA, as well as specificity of delivery location.1–5 In addition to its amenability to scalable production in the current good manufacturing practice (GMP) system, human cell-derived EVs possess minimal immunogenicity and toxicity,6–9 which make them an ideal drug delivery system in critical clinical applications. With the recent advancement of biomaterial-based nanotechnologies, an increasing number of customized EVs derivatives have been entering clinical trials to evaluate their efficacies for the targeted delivery of therapeutic drugs to minimize systemic toxicity in patients.10
Similar to most of the commonly used therapeutic nanoparticles, the major challenge in employing the EVs-based drug delivery system is the limited bioavailability due to its short half-life (less than 10 minutes) and fast hepatic clearance following systemic intravenous administration.11–13 Furthermore, the biological function of EVs is primarily modulated by its molecular makeup, surface markers, and compositions, which determine the pharmacological and pharmacokinetic behavior of EVs in vivo. For instance, the vesicle surface is flagged by a myriad of membrane proteins and glycan moieties of particular molecular signatures that guide EVs to their destination for uptake by the target organelle/cell body.13–15 Although each of these EVs surface proteins specifically acts as either a receptor or ligand for its cognate counterpart, however, a plethora of such specific molecular interactions across diverse vesicular or cellular entities makes it difficult to deconvolute their seemingly “non-selective” or “non-specific” nature. Notably, it has been demonstrated that integrin alpha (α) and beta (β) chains regulate vesicular trafficking and are responsible for predisposing the organotropic metastasis of tumor-derived exosomes.16–19 Under physiological conditions, the ubiquitous extracellular matrix of various tissue types captures circulating EVs through binding their surface integrins. Additionally, heavily glycosylated exosomal proteins are recognized by cell surface lectins with strong binding affinities.20 N- and O-glycans expressed on tumor-derived EVs play crucial and non-overlapping mechanistic roles in adhesion and uptake processes during cancer metastasis.15,20–22 Whereas several in vitro studies suggest that exosomal glycans may shield EVs from their cell surface marker-mediated interactions, in vivo observations poorly correlate with this proposed mechanism, rather EVs recognition highly depend on their cellular origin.15,22 Therefore, EVs with efficient and precise drug delivery capabilities should have: 1) minimum non-specific interaction; 2) adequate bioavailability and retention capacity in the circulation; and 3) enhanced affinity and avidity for the target cell/tissue type. In principle, bioengineering-based alterations of EVs-surface markers can drastically change their functional behavior in the desired way, making them the most suitable drug delivery vehicles with improved pharmacokinetics.
In this study, we investigated both in vitro and in vivo effects of three major alterations to the surface markers of HEK293 cell-derived EVs such as: 1) removal of cell adhesion molecules (CAMs), 2) removal of N-glycans, and 3) loading of a nanobody targeting the hepatocyte carcinoma (HCC) antigen of human Glypican-3 (GPC3). We showed that the elimination of integrin family molecules and N-glycan moieties significantly altered the pharmacokinetic profile of HEK293-EVs. As further proof of concept, we engineered hGPC3-targeting and low-adhesion EVs with a surface-anchored single-chain IL12, which was long sought after for immunotherapy in HCC with little success due to its toxicity after systemic exposure. Our engineered EV carrying surface IL-12 achieved satisfactory inhibition of tumor growth in a murine model of HCC at a low and tolerable dosage.
Materials and Methods
Cell Culture
The HEK293F cell line (Thermo-Fisher, USA) was cultured in a CD05 medium (Shanghai OPM Biosciences, China) at 37°C and 7.5% of CO2 with continuous shaking at 120rpm in a sterile humidified incubator. Hepa1-6-mGPC3-KO cell model was generated by knocking out murine GPC3 in the Hepa-1-6 cell line. Then, hGPC3 was inserted by genetically engineering Hepa1-6-mGPC3-KO and HEK293T cells to over-express human GPC3 protein. All three cell lines were purchased from KYinno Biotechnology (Beijing, China). The HKB-11 cell line (CRL-12568, ATCC) was cultured in DMEM-F12 medium (Gibco) supplemented with 10% fetal bovine serum (FBS). The AML12 cells (Procell Life Sci. & Tech., Wuhan, China), a murine hepatocyte line, were cultured in DMEM-F12 medium supplemented with 10% FBS, 10µg/mL insulin, 5.5µg/mL transferrin, 5ng/mL selenium, 40ng/mL dexamethasone, 1% penicillin-streptomycin (PS) at 37°C and 5% CO2 in a humidified sterile incubator. Also, MRC5, HEK293T, RAW264.7, and HepG2 lines were procured from Procell (Wuhan, China) and cultured in DMEM medium (Gibco) supplemented with 10% FBS and 1% PS at 37°C and 5% CO2.
Animal Models
Male BALB/c (six to eight-week-old, 19–23g), and C57BL/6J (five to eight-week-old, 16–20g) mice were provided by SPF Biotechnology Co. Ltd. (Beijing, China) and Beijing Vital River Laboratory Animal Technology Co. Ltd. All animals were housed and bred in the special pathogen-free (SPF) animal facility at Beijing Immunoah Pharma Tech Co. Ltd. or United-Power Pharma Tech Co. Ltd. The study was performed with the approval of the Ethical Committee of Beijing Immunoah Pharma Tech Co., Ltd and United-Power Pharma Tech Co. Ltd. The animal studies were carried out by the listed authors, in strict accordance with the recommendations in the Guide for the Care and Use of Laboratory Animals of the Beijing Immunoah Pharma Tech Co., Ltd and United-Power Pharma Tech Co. Ltd. The ethical approvals included IACUC2021-W0003, IACUC2021-W0005, IACUC2021-W0010, IACUC2021-W0011, IACUC2021-W0012, IACUC2022-W0001, IACUC2022-W0002, IACUC2022-W0003, UPP-IACUC-2022-GW0001.
Engineered HEK293F Cell Line Generation
The integrin subunit beta 1 (ITGB1; gene ID: 3688) gene was knocked out using the CRISPR/Cas9 gene editing technique in the HEK293F cell line. The hITGB1-specific single guide RNA (sgRNA) plasmids were purchased from Ubigene (Guangzhou, China). First, hITGB1 sgRNA plasmids were transfected into wildtype (WT) HEK293F cells using the polycation polyethylenimine (PEI) reagent, then transfected cells were sorted by flow cytometer.
To generate a stable NanoLuc overexpression cell model, a fusion gene was constructed utilizing the transmembrane and intracellular domains (TMD+ICD) of ITGB1 as the EV loading motif, followed by the coding sequence of nanoluciferase (nanoLuc). The fusion gene was packaged into lenti virus particles that were purchased from OBiO Technology (OBiO Tech, Shanghai, China). Human ITGB1 KO HEK293F or WT HEK293F cells were transduced with lentivirus at a multiplicity of infection (MOI) of 10. Cells were cultured for 72h in a fresh medium before subjecting them to Zeocin (Invivogen, USA) selection at a final concentration of 500 μg/mL for stably overexpressing ITGB1-NanoLuc cells.
To generate anti-human GPC3 nanobody (HN3) cells,23 engineered HEK293F cells were infected with pcSLenti-HA-HN3 lentiviral particles at an MOI of 10. Then, cells were selected against Blasticidin S (YEASEN, China) at a final concentration of 10μg/mL after 72h of culturing in a fresh medium.
To generate a mouse single chain IL12 (mscIL12) expression line, engineered HEK293F cells were transduced with pcSLenti-mscIL12-hFc IgG4-NanoLuc lentivirus particles at an MOI of 10, and cells were selected against puromycin (Thermo Fisher, USA) at a final concentration of 2 μg/mL 72h post-infection.
Flow Cytometry Analysis
To analyze and sort out ITGB1 KO cells, infected cells were first filtered through a cell strainer cap (35-μm mesh) to obtain a single cell suspension (approximately 1×10⁶ cells/mL for analysis and 1×10⁷ cells/mL for sorting), which was then labeled with APC-conjugated anti-human ITGB1 antibody (#10587-MM05-A, Sino Biological, China) by incubating for 30 min in the dark at room temperature.
To detect any changes in immune cell profile in mouse blood, 50μL of whole blood was mixed with 0.5μL of each of CD45-PerCP/Cyanine5.5, CD3-FITC, and CD8-AF700 antibodies (Biolegend, USA), and incubated for 30min at room temperature, followed by incubation with 500μL of red blood cell (RBC) lysis solution for 5min at room temperature.
Antibody-labeled cells were then sorted on a fluorescence-activated cell sorter (FACS) SymphonyS6 (BD Biosciences, USA) and analyzed using FACSDiva software (BD Biosciences, USA). Flow cytometry (FCM) was carried out on a NovoSampler Pro or a NovoSampler Q (ACEA Biosciences, USA) system, and data were analyzed using the NovoExpress v1.4.1 software (ACEA Biosciences, USA).
EVs Isolation and Purification
Cell-derived EVs were sequentially isolated by tangential flow filtration (TFF), bind-elute size exclusion chromatography (BE-SEC) and density gradient ultracentrifugation (DGUC). Briefly, HEK293F cells were cultured in CD05 medium for 96h, while MRC5 and HKB-11 cells were, respectively, cultured in fresh DMEM and DMEM-F12 medium without FBS for 48h before processing for EVs isolation. The supernatant of cultured cells was sequentially centrifuged at 800 ×g for 5min and 2000 ×g for another 10min to remove dead cells and debris and then filtered using a 0.2μm filter (Millipore, USA). To remove any free proteins, a hollow fiber TFF column (300kDa, MWCO) was used to treat the supernatant from the previous step, followed by purification with the BE-SEC column (HiScreen Capto Core 700 column, Cytiva) on an ÄKTA Pure 25 chromatography system (Cytiva). Finally, collected samples were purified by DGUC at 100,000 ×g for 18h at 4°C to obtain a continuous density gradient, as previously described.24
Quantitative Proteomics
To determine proteomic profiles of EVs, WT HEK293F-, ITGB1 KO HEK293F-, MRC5-, or HKB11-derived EVs were analyzed by a liquid chromatography-tandem mass spectrometry (LC/MS) system, according to the process described elsewhere.25 Only peptides that were exclusively assigned to a protein were used for quantitative analysis by Wayen Biotechnologies Inc. Proteins found in EVs were compared against the Vesiclepedia database and then subjected to the differential analysis.
To estimate the loading efficiency of mscIL12 into EVs, reference standard mouse IL12 protein (mIL12, SinoBiological, China) of known quantity and EVs of known number of particles were analyzed by LC/MS, according to a process described elsewhere.26 Only peptides that were exclusively mapped to the sequence of mscIL12, NanoLuc, HN3, CD81 and CD9 were used for quantitative analysis with the Proteome Discoverer software (version 2.4) at the State Key Laboratory of Proteomics (Beijing, China). The abundance of mscIL12, NanoLuc, HN3, CD81 and CD9 were calculated based on the internal standard of the mIL12 protein.
NanoFlow Cytometry (NanoFCM)
Concentrations and size of EVs samples were determined by Nanoflow (NanoFCW, China), using the same instrument and software settings. To detect expressions of CD9 and CD81 on EVs, 2×10⁹ EVs particles in 90µL of PBS were incubated with 10µL of FITC-conjugated anti-human CD81 (#349504, Biolegend, USA), or anti-human CD9 (#312104, Biolegend, USA) antibody was incubated for 1h in the dark at room temperature, then purified using a HiTrap Capto Core 700 system and analyzed with NanoFlow software.
Transmission Electron Microscopy (TEM)
The morphology of the EVs was detected by transmission electron microscopy (TEM).10 μL EV samples were dropped onto formvar carbon-coated copper grids and incubated for 10 min. Then, stained with 10 μL of 3% phosphotungstic acid for 3 min at room temperature, followed by fixing with 2% glutaraldehyde for 5 min. After drying, samples were observed in a TEM system (JEM-2100; Jeol Ltd., Tokyo, Japan) at 200 kV.
Western Blot (WB) Analysis
For WB analysis, EVs pellets and cells were lysed in radioimmunoprecipitation assay (RIPA) buffer (Beyotime, China) containing a 1X protease inhibitor cocktail (Beyotime, China). The protein concentration was determined using a bicinchoninic acid (BCA) kit. Protein samples were resolved by running in sodium dodecyl sulfate-polyacrylamide gel electrophoresis (SDS-PAGE), followed by transfer onto nitrocellulose membranes. Blots were incubated with the following primary antibodies: anti-Alix (Abcam, ab186429, 1:1000), anti-CD9 (Abcam, ab195422, 1:1000), anti-CD81 (Abcam, ab79559, 1:200), anti-CD63 (Abcam, ab59479, 1:1000), anti-ITGB1 (Sinobiological, 100562-T46, 1:500), anti-TSG101 (Abcam, ab125011, 1:1000) and anti-GAPDH (Zsbio, TA-08, 1:1000), anti-HA tag (HRP) (Sinobiological, 100028-MM10-H, 1:1000) at 4°C overnight. After removing primary antibodies and washing with PBS, blots were incubated with horseradish peroxidase (HRP)-conjugated secondary anti-mouse (Zsbio, ZB-5305, 1:5000) or anti-rabbit (Zsbio, ZB-5301, 1:5000) antibody for 1h. The protein bands were detected using enhanced chemiluminescence (ECL) detection reagent (Thermo Scientific, USA), and visualized on a chemiluminescence imager (ChemiScope 6000, China).
N-Glycoprotein Deglycosylation Assay
To remove N-glycosylation from the surface of EVs, samples were incubated with 50U of PNGase F (Novoprotein, China) per 2×10⁹ particles in 50mM sodium phosphate buffer (pH7.5) at 37°C for 1h, followed by purification using the HiTrap Capto Core 700 system.
NanoLuc Detection Assay
For the detection of NanoLuc luciferase activity, 50μL of purified EVs sample was added into white-walled clear-bottom 96-well plates along with 50μL of Nano-Glo Luciferase substrate at 1:50 dilution, according to the manufacturer’s instructions (Promega, USA). The NanoLuc intensity in each well was immediately measured using the SuPerMax 3100 multi-mode microplate reader (Flash, Beijing, China).
For NanoLuc localization experiments, 5×10⁹ particles/mL of EVs were lysed in 0.1% Triton X-100 and incubated with 100µg/mL Proteinase K (Beyotime Biotechnology, China) at 37°C for 15min before measuring the luciferase activity.
Detection of EVs Uptake Capacity
To assess the effect of ITGB1 KO and N-glycoprotein deglycosylation on HEK293F-derived EVs, AML12, HepG2, Hepa1-6, RAW264.7, and lipopolysaccharide (LPS) activated RAW264.7 cell lines were used. Approximately, 50,000 cells were seeded in 24-well plates 24h before the assay, then incubated with 1×10⁹ particles/mL of NanoLuc+ HEK293F-derived EVs (WT EVs), ITGB1− NanoLuc+ HEK293F-derived EVs (ITGB1−EVs), or PNGase F treated ITGB1− NanoLuc+ HEK293F-derived EVs (ITGB1−Deg EVs) in 500μL growth medium per well for 1h or 4h at 37°C. Cells were then washed 3 times with PBS, dissociated in EDTA solution, and collected in 200μL PBS. Finally, 50μL of each sample was used to detect NanoLuc intensity as detailed above. The EVs particle number in each sample was determined using the standard curve.
Cell-Binding Assay of ITGB1−mscIL12+HN3+ EVs to hGPC3+ Cells
HepG2 (carrying hGPC3), 293T-hGPC3, Hepa1-6-hGPC3, Hepa1-6 (harboring mGPC3), or 293T (lacking hGPC3) cells were blocked with WT EVs (1 cell: 30,000 EVs) at 4°C for 1h. ITGB1−mscIL12+HN3+ EVs were pre-incubated with either human Fc-IgG1 or GPC3-Fc protein chimera (2.5×10⁹ EVs: 1μg of fusion protein) for 30min at 4°C as the test or control sample, respectively. Then, 2×10⁵ pre-blocked cells were incubated with test or control EVs at 4°C for 1h, followed by 3 times PBS washing before reading the NanoLuc activity.
Confocal Microscopic Analysis of Cellular Binding of ITGB1−mscIL12+HN3+ EVs
ITGB1−mscIL12+HN3+ and ITGB1− EVs were labeled with PKH67 fluorescent cell linker following the manufacturer’s protocols. 1×10⁵ HepG2 cells were seeded onto 14mm glass slides in 24-well plates before 24h, fixed with 4% paraformaldehyde (PFA) in PBS (pH7.4) for 10min at room temperature, and washed three times with cold PBS. Cells were blocked with 5% BSA in PBS for 2h to block the unspecific binding of the antibodies, then blocked with WT EVs (1 cell: 30,000 EVs). Then, cells were incubated with 2×10¹⁰ PKH67-labeled ITGB1−mscIL12+HN3+ or PKH67 labeled ITGB1− EVs at 4°C for 4h. After incubation, cells were again washed three times with PBS and mounted in DAPI (Invitrogen, USA) with a coverslip, stored in the dark at 4°C, and imaged with Nikon AX confocal laser microscope (Nikon, Japan).
Mouse Total Splenocytes Activation Analysis
About 200,000 cells were seeded in each well and treated with 1ng/mL of anti-mouse CD3 antibody (#100301, Biolegend, USA) to activate mouse total splenocytes in the presence of various concentrations of ITGB1−mscIL12+HN3+ EVs in 96-well culture plates. After 4 days, the level of mouse IFN-γ in the collected culture media was measured using the ELISA kit (Liankebio, China), according to the manufacturer’s instructions.
In vivo Pharmacokinetic Studies of Effects of ITGB1 KO and N-Glycoprotein Deglycosylation on HEK293F-Derived EVs
To examine the pharmacokinetic profile of HEK293F-derived EVs in vivo, six to eight-week-old male BALB/c mice with an average body weight of 20g were subjected to intravenous (i.v) tail vein interjections with 5×10¹⁰ EVs particles in 200µL of PBS (n = 6). After that, sham and experimental mice were sacrificed at different time points (5min, 15min, 30min, 1h, 2h, and 4h) to collect their blood samples into EDTA-coated K2-tubes (BD Biosciences, USA), and were processed for plasma analysis according to the manufacturer’s instructions. The animals were then perfused with ice-cold PBS and different organs were subsequently harvested and stored in 1 mL PBS at −80°C until further use.
For the NanoLuc measurement, tissues were homogenized in 1mL PBS using a tissue lyser (Jingxin, China) at 65Hz amplitude for 1min. Tissue lysates were collected after centrifuging homogenates at 12,000 xg for 10min at 4°C. Then, 50µL of tissue lysates were added into white-walled round-bottom 96-well plates along with 50μL of Nano-Glo Luciferase substrate in the provided buffer (Nano-Glo Luciferase Assay System: Promega), as per the manufacturer’s instructions.
The luciferase intensity in each well was immediately measured using the SuPerMax 3100 (Flash, China). For achieving sensitive quantification of EVs in different tissue samples, values for known concentrations of EVs were used to generate a standard curve.
In vivo Distribution of ITGB1−mscIL12+HN3+Deg EVs in Mice
Five to eight-week-old male C57BL/6 mice were used for this assay. Hepa1-6-hGPC3 cells (5 × 10⁶ cells in 100μL PBS) were transplanted in the left anterior subcutaneous part of the mice and allowed to grow to a tumor size of 0.4–0.8 cm3 (volume=length × width2/2, measured with a Vernier caliper). Lung metastasis models were developed by injecting 1×10⁶ cells suspended in 200μL PBS via the tail vein and allowed to grow into a tumor for 22 days. The mice were then randomly divided into two different experimental groups and treated as described in the result. Briefly, the mice were i.v injected with 5×10¹⁰ EVs particles in 200µL PBS (n = 6 for the subcutaneous tumor and n = 7 for the pulmonary tumor). Animals were sacrificed at 30min after injecting EVs. Plasma, tumor, lung, liver, spleen, and kidney samples were harvested to detect NanoLuc intensity as detailed above.
In vivo Testing of Anti-Tumor Efficacy of ITGB1−mscIL12+HN3+Deg EVs
Five to eight-week-old male C57BL/6 mice were used for this experiment. Hepa1-6-hGPC3 cells (5 × 10⁶ cells in 100μL PBS) were transplanted in the left anterior subcutaneous part of the mice. Then, mice were divided into different experimental groups according to the tumor volume on Day 4 and treated with 5×10¹⁰ particles of ITGB1−mscIL12+HN3+Deg, ITGB1−Deg EVs, or 3μg, 70ng of recombinant mouse IL12 (rmIL12) protein, respectively, on Day 4 and Day 7 (n = 7). Whole blood was collected for flow cytometry analysis, and plasma samples were used for cytokine profiling on Day 9. Tumor volume and weight were measured every 3 days. All the mice were sacrificed when most of each group’s tumor growth reached nearly 1800 mm3.
Plasma Cytokine Measurements
Plasma samples were collected from the sham and treated mice on Day 9 of the in vivo tumor inhibition study for the cytokine analysis. Multiple cytokines were measured using the Bio-Plex Pro Mouse Cytokine 23-plex assay system, according to the manufacturer’s protocol.
Statistical Analysis
Statistical analyses were performed using the GraphPad Prism 7 software and Microsoft Office Excel 2021. Data are presented as mean ± standard deviation (SD). The pharmacokinetic parameters were calculated by Phoenix 64 (version 8.2.0.4383). The statistical significance level was set at a P-value of 0.05. Data were compared using the two-tailed unpaired Student’s t-test (*P<0.05, **P<0.01, ***P<0.001, ****P<0.0001).
Results
As described earlier, EVs derived from HEK293F, MRC-5, and HKB-11 cells were purified using a sequential process involving TFF, BE-SEC and DGUC. The NanoFCM and WB analyses revealed that EVs particles possessed vesicular characteristics as well as well-defined exosomal biomarkers (Figure 1A and B). Quantitative proteomic analysis of EVs showed that several CAMs were highly abundant in EVs (Figure 1C), along with other typical EVs-enriched proteins (Table S1). Compared to adhering cultured cell types like MRC-5 and HKB-11, HEK293F-derived EVs lacked the expression of both laminin and fibronectin. Instead, ITGB1 was the primary CAM in the case of HEK293F-derived EVs. To abolish the ITGB1-mediated cell adhesion characteristics, we knocked out the ITGB1 gene in HEK293F cells by CRISPR/Cas9-mediated gene editing technique without affecting the normal cellular morphology and growth pattern (Figure S1). Further, we confirmed the complete KO of ITGB1 in HEK293F and HEK293F-derived EVs by flow cytometry and Western blot (Figure 1D and E). Quantitative proteomics of the ITGB1− EVs indicated that not only the level of ITGBI but also that of several α subunits containing integrins were reduced as well (Table 1).
 |
Table 1 The Relative Abundance of Integrins in ITGB1− EVs Concerning WT EVs |
 |
Figure 1 Comparisons of surface markers and immunogenic protein levels in HEK293F and EVs derived from this cell line. (A) Western blot (WB) of HEK293F-derived EVs for Alix, CD9, CD63, CD81, and TSG101 protein levels. GAPDH served as the loading control. (B) Nanoflow cytometry (NanoFCM) of HEK293F-EVs labeled with anti-CD9, and anti-CD81 antibodies, respectively. (C) Log2Fold abundance of cell adhesion molecules (CAMs), and standard EVs biomarkers such as CD81, CD63, and TSG101, normalized to the abundance of ITGB1 in respective EVs subtypes (proteins absent in the cellular proteome are marked as gray tiles, the Log2Fold abundance of ITGB1 in each cell line is 0 and colored white). (D) Flow cytometry analysis of WT and ITGB1− HEK293F cells stained with APC-conjugated anti-ITGB1 antibody confirmed that the ITGB1 expression was significantly diminished by CRISPR/Cas9-mediated knockout (KO). (E) WB of cells (left) and EVs (right) from WT and ITGB1− HEK293F cells, respectively, further validated the absence of ITGB1 in both WT and ITGB1 KO HEK293F cells. |
To investigate both in vitro and in vivo pharmacokinetic properties of ITGB1− EVs, we loaded EVs with NanoLuc via a chimeric scaffold consisting of a transmembrane helix and an intracellular domain of ITGB1. The nanoLuc domain was concatenated to the C-terminus of this EVs-targeting scaffold (Figure 2A). Lentiviral transduction of NanoLuc fused ITGB1 into WT and ITGB1− HEK293F cells allowed stable production of WT and ITGB1− NanoLuc EVs, respectively. The chemiluminescence of the exosomal NanoLuc was resistant to the proteinase K digestion (Figure 2B) but not to digestion combined with Triton X-100-mediated membrane disruption, suggesting that the ITGB1 TMD-ICD scaffold loaded NanoLuc inside the vesicle and the vesicle-free NanoLuc was successfully removed by BE-SEC and DGUC. Since the intensity of chemiluminescence was linearly correlated with the particle number of EVs (Figure S2), we could reliably quantify the number of EVs based on the NanoLuc activity, with a lower limit of quantitation (LLOQ) of 105 particles/mL of the sample. For brevity, all EVs described hereafter carry intraluminal NanoLuc unless otherwise noted.
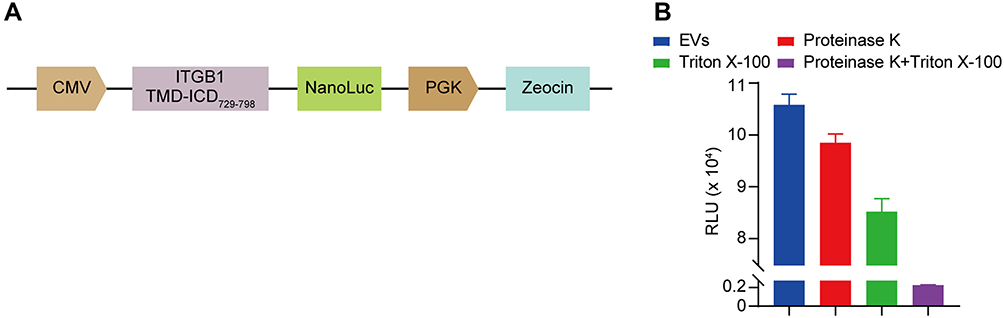 |
Figure 2 Construction and verification of NanoLuc-fused ITGB1 expression system. (A) Schematic design of exosomal NanoLuc-based reporter vector. The vesicular loading was driven by the transmembrane and intracellular domains (TMD, and ICD, respectively) of ITGB1. (B) The NanoLuc-tagged protein molecules was loaded inside the vesicle. The NanoLuc activity was resistant to the proteinase K digestion or membrane disruption by Triton X-100 alone, whereas the combinatorial treatment of membrane disruption and protease digestion completely abrogated the NanoLuc activity. |
We incubated the NanoLuc-loaded WT and ITGB1− EVs with a panel of cell lines of hepatic or myeloid origins and measured the cellular chemiluminescence activities to quantify the number of internalized EVs. Both human (HepG2) and murine (AML12 and Hepa1-6) hepatocytes readily absorbed NanoLuc-loaded EVs. But this interaction could be significantly attenuated in the first hour by the removal of exosomal integrins (Figure 3A). In contrast, RAW264.7 cells uptook a slightly higher number of ITGB1− EVs than that of WT EVs in the first hour, regardless of its activation status. At the 4h time point, AML12 cells exhibited similar levels of chemiluminescence for WT and ITGB1− EVs, while HepG2 and Hepa1-6 cells could only internalize only a few ITGB1− EVs than WT EVs (Figure 3B). The slight increase of uptake by RAW264.7 in 1h for the ITGB1− EVs was also observed in RAW264.7 cells in 4h. We next investigated the contribution of surface glycans on EVs’ cell-binding properties. ITGB1− EVs were incubated with PNGase F to remove surface N-glycans (Figure S3A), which did not alter the morphology and size distribution of EVs (Figure S3B and S3C). Compared to the glycosylated counterpart, removal of N-glycans significantly reduced the rate of cellular uptake of EVs by RAW264.7 cells in 1h, whereas the activated RAW264.7 cells uptook more deglycosylated EVs. During the first hour of incubation, while it was enhanced in cases of uptake of the ITGB1−Deg EVs were enhanced for HepG2 and Hepa1-6 cells, and roughly unchanged for AML12 cells (Figure 3A). By the 4h time point, all cells tested internalized a significantly higher number of N-glycan-free EVs than glycosylated EVs, with the exception of the activated RAW264.7 cells which uptook 2/3 fewer N-glycan-free EVs than glycosylated EVs (Figure 3B).
 |
Figure 3 A number of EVs particles uptaken by various cell lines after incubation with WT HEK293F EVs, ITGB1− EVs, or N-deglycosylated ITGB1− EVs for 1h (A) and 4h (B). Paired t-test analysis was performed with the rstatix package in R. *P < 0.05; **P < 0.01; ***P < 0.001;****P < 0.0001. Abbreviation: ns, Not significant. |
Next, we sought to investigate the impact of ITGB1 KO and N-glycan removal on HEK293F-derived EVs in vivo. WT HEK293F-, ITGB1− HEK293F-, Deg- and ITGB1−Deg-derived EVs were administered in mice via tail vein injection before harvesting their organ and blood samples for chemiluminescence analysis. In contrast to the significant reduction in cellular uptake of ITGB1− EVs in vitro assays, the plasma concentration curve of ITGB1− EVs was not significantly altered from that of the WT EVs, except that in the early phase (5–30min) the plasma concentration of ITGB1− EVs were slightly higher than that of WT EVs. At 4h when the level of WT EVs was rapidly reduced below the detection limit, the plasma population of ITGB1− EVs remained stable above the detection limit (Figure 4A). Surprisingly, ITGB1−Deg EVs, which exhibited elevated cellular uptake in in vitro assays, achieved 10-fold higher exposure (area under the curve, AUC0-∞) than that of the other three types of EVs, and 10-fold higher Cmax. These EVs also had a prolonged half-life for clearance compared to that of the WT EVs (30min vs 13min, Table 2). The tissue distribution profiles of WT and ITGB1− EVs were indistinguishable, while the deglycosylated ITGB1− EVs showed significantly reduced exposure in the liver and spleen tissues but similar levels of enrichment in the lung and kidney (Figure 4B). Consistent with the reduced tissue uptake, volume of distribution (Vd) of the ITGB1−Deg EVs was about 1/3 of that of WT EVs (Table 2).
 |
Table 2 Pharmacokinetic Analysis of WT, Deg, ITGB1−, and ITGB1−Deg EVs in vivo (n = 6) |
 |
Figure 4 Distribution profiles of EVs from different sources in plasma and vital organs of mice. (A) Plasma concentration of EVs following the tail vein injection of 5×10¹⁰ particles/mice. (B) EVs particle concentrations in major organs relative to the plasma Cmax of the respective type of EVs. a,aa,aaaP < 0.05,0.01,0.001 Deg EVs vs WT EVs; b,bb,bbbbP < 0.05,0.01,0.0001 ITGB1− EVs vs WT EVs; c,cc,ccc,ccccP < 0.05,0.01,0.001,0.0001 ITGB1−Deg EVs vs WT EVs; d,dd,dddP < 0.05,0.01,0.001 ITGB1− EVs vs Deg EVs; e,ee,eee,eeeeP < 0.05,0.01,0.001,0.0001 ITGB1−Deg EVs vs Deg EVs; f,ff,ffffP < 0.05,0.01,0.0001 ITGB1−Deg EVs vs ITGB1− EVs. LLOQ: Lower Limit of Quantification. |
To functionalize ITGB1−Deg EVs with the targeting and effector modules, we constructed several lentiviral vectors like the pDisplay scaffold carrying genes encoding the anti-hGPC3 nanobody (Nb) HN3, a fusion protein of mouse single chain IL12 (mscIL12), and a human IgG4-Fc domain, followed by the EVs-NanoLuc expression cassette (TMD and ICD of ITGB1 fused with the C-terminal of NanoLuc) (Figure 5A). ITGB1− HEK293F cells were sequentially transfected with two lentiviral vectors for stable expressions of HN3-Nb and mscIL12 on the cell surface (ITGB1−mscIL12+HN3+Deg EVs). Next, we verified the presence of mscIL12 on the EVs derived thereof by quantitative proteomic analysis, which showed that the population of IL12 surface markers was about half of that of CD9 (Table S2). In a mouse total splenocyte culture, the mscIL12-loaded EVs successfully elicited a significant amount of INF-γ secretion with an EC50 of 5×10⁶ particles/mL (Figure 5B). The presence of the anti-hGPC3 HN3-Nb on the cellular and vesicular surfaces was verified by FCM and WB (Figure S4). To verify the function of the HN3-Nb on the EVs, we labeled the ITGB1− and the ITGB1−mscIL12+HN3+ EVs with PHK67 dye and incubated them with HepG2 cells intrinsically expressing hGPC3. Notably, even under competition with the addition of unlabeled WT EVs, we still observed a significant green fluorescent signal on the HepG2 membrane for the ITGB1−mscIL12+HN3+ EVs, while no PHK67 signal was detected for the ITGB1− EVs (Figure 5C). Moreover, in cell lines expressing hGPC3 (HepG2, HEK293T-hGPC3+, and Hepa1-6-hGPC3+), the uptake of exosomal NanoLuc carried by the ITGB1−mscIL12+HN3+ EVs was susceptible to blockade by free hGPC3-Fc protein (Figure 5D). In contrast, in cell lines without hGPC3 (HEK293T-hGPC3−, Hepa1-6-mGPC3−), the addition of hGPC3-Fc fusion protein did not affect the uptake of exosomal NanoLuc. Thus, HN3-Nb expression conferred specific antigen recognition to EVs (Figure 5D). In C57BL/6 mice bearing subcutaneous or pulmonary tumor of Hepa1-6-hGPC3 cells, we also found significant enrichment of the ITGB1−mscIL12+HN3+Deg EVs in the tumor compared to that of ITGB1−mscIL12+Deg EVs lacking the HN3-Nb moiety. While these two types of EVs exhibited similar levels of abundance in the liver, spleen, and kidney (Figure 5E). The lungs of tumor-bearing mice internalized a greater number of ITGB1−mscIL12+HN3+Deg EVs than the ITGB1−mscIL12+Deg EVs, potentially due to the binding of HN3-Nb EVs to tumor cells metastasized to the lung. Furthermore, we verified this hypothesis in a mouse model of lung metastasis with the grafting of the Hepa1-6-hGPC3 cells (Figure 5F). Persistently, we noticed a significantly increased number of ITGB1−mscIL12+HN3+Deg EVs accumulated in the tumor-infested lungs than the analog lacking the HN3-Nb moiety (Figure 5G).
 |
Figure 5 Examination of the effect of mouse single chain IL12 and HN3 nanobody on the cell-binding properties of EVs. (A) Schematic design of an exosomal nanobody (HN3) and mouse single chain IL12 (mscIL12), whose vesicular loading was driven by the transmembrane domains of PDGFRβ and ITGB1, respectively. (B) Dose-response curve of mscIL12 EVs in mouse splenocytes, analyzed using the “drc” package in R. (C) Representative fluorescence images of HepG2 cells after incubation with PKH67-labeled EVs. Nuclei were stained with DAPI. (D) Cellular NanoLuc activities in various cell lines after incubation with ITGB1−mscIL12+HN3+ EVs, or ITGB1−mscIL12+HN3+ EVs in the presence of hGPC3-Fc fusion protein. Luciferase activities were normalized to the chemiluminescence intensities of cells incubated with respective EVs alone. (E) Particle populations (normalized to the plasma concentration) of EVs with or without the GPC3-targeting module (HN3) in the tumor and major organs. (F) Representative images of healthy and tumor-bearing lungs. (G) Particle populations (normalized to the plasma concentration) of the ITGB1−mscIL12+HN3+Deg EVs in the major organs of healthy (Control) or lung metastasized (pulmonary tumor) mice. **P < 0.01; ***P < 0.001. Abbreviation: ns, Not significant. |
Next, we investigated the efficacy of ITGB1−mscIL12+HN3+Deg EVs in a murine model of subcutaneous tumor of Hepa1-6-hGPC3 cells. The level of exosomal mscIL12 was first quantified by quantitative proteomic analysis. Single dosing of 5×10¹⁰ particles per animal equaled 43ng of mscIL12 per animal (Table S2). The ITGB1−mscIL12+HN3+Deg EVs, ITGB1−Deg EVs, or the rmIL12 protein were administered on days 4 and 7 post-tumor inoculations in mice. Both the ITGB1−mscIL12+HN3+Deg EVs and a high dose of rmIL12 protein suppressed the tumor growth (Figure 6A and B), while the low dose of rmIL12 failed to exhibit a similar efficacy. The prominent suppression of tumor growth by the ITGB1−mscIL12+HN3+Deg EVs corroborated with a systemic elevation in proinflammatory cytokines (Figure 6C and Table S3). FCM analyses of the peripheral blood monocytes (PBMC) revealed a well-anticipated decrease in total leukocyte counts on Day 9, while the CD8+ T-cell populations were elevated in the EVs and 3µg of rmIL12 treated groups (Figure 6D).
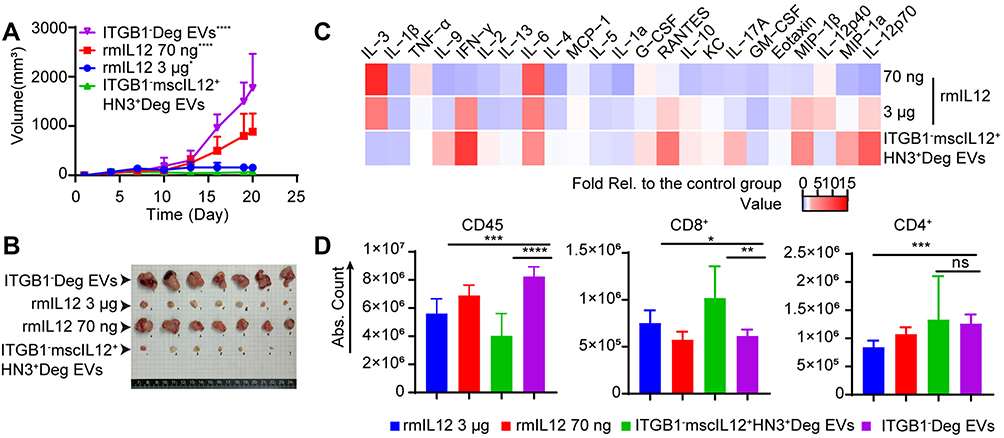 |
Figure 6 Comparative effects of ITGB1 KO and recombinant mouse IL12 (rmIL12) protein on the anti-tumor efficacy of EVs. (A) Tumor growth curves of mice bearing subcutaneous tumors of Hepa1-6-hGPC3 cells, which were treated with intravenous doses of rmIL12 (70ng or 3μg per animal), control EVs (ITGB1−Deg) or the ITGB1−mscIL12+HN3+Deg EVs (5.0×10¹⁰ p/animal). *,****P < 0.05, 0.0001 vs ITGB1−mscIL12+HN3+Deg EVs group. (B) Tumor size shown after treatment with intravenous doses of rmIL12 (70ng or 3μg per animal), control EVs (ITGB1−Deg) or the ITGB1−mscIL12+HN3+Deg EVs. (C) Heat map of mouse plasma cytokine levels normalized to the control group at 48h post-second dosing (Day 9). (D) Flow cytometry analysis of mouse plasma cells for total CD45+/CD4+ T-cells and CD8+ T-cells 48h after the second dosing (Day 9). *P < 0.05; **P < 0.01; ***P < 0.001; ****P < 0.0001. |
Discussion
In this study, we successfully altered in vivo pharmacokinetic behaviors of HEK293-derived EVs via surface engineering. A reduction in off-target binding and an increase in tumor cell-specific targeting conferred improved therapeutic potentials of EVs in terms of tissue distribution and half-life. The association and internalization of EVs involve a variety of signaling mechanisms with distinct characteristics. Molecular recognition of CAMs (eg, integrins and fibronectins) might be the rate-limiting step during the acute phase interaction between EVs and target cell membranes, as the removal of exosomal integrins led to a significant decrease in EVs internalization in the first hour, while the effect of integrin removal was marginal between 1h and 4h. On the other hand, deglycosylation affected the EVs internalization primarily in the 1–4h period. There was also a stark discrepancy between cells of hepatic and myeloid origins, as the EVs internalization profile of RAW264.7 cells was distinctly different from that of hepatic cells and was sensitive to the LPS stimulation, as well. Even within the group of hepatic cell lines, the deglycosylation led to an increase of internalization in Hepa1-6 cells, while the effect was marginal in AML12 and HepG2 cells, resembling the observation reported previously.22,27
The extent and pattern of EVs glycosylation had a profound influence on its biodistribution in vivo. Previous studies on tumor or stem cell-derived EVs have demonstrated that the removal of glycan moieties from the EVs surface usually enhances its cellular uptake rate, notwithstanding a number of exceptions.21 However, there was a lack of clear correlation between deglycosylation or glycoengineering and the biodistribution of EVs in vivo, as shown by previous and this study.20,22 Similar to the report by Williams et al,21 deglycosylations significantly enhanced the cellular uptake of EVs by HepG2 and Hepa1-6 cells. Our observation of extended plasma half-life after N-deglycosylation corroborated with previous reports that the alteration in EV glycosylation had a direct impact on the adhesion and uptake by lectin-expressing immune cells.27–29
The in vivo behaviors of EVs appeared to be a compound outcome influenced by EVs’ interactions with a myriad of cellular and molecular entities. It is thus expected that the elimination of one family of surface molecules (integrins) might not have significantly affected EVs’ pharmacokinetic profiles. To efficiently improve the circulation half-lives of EVs, synergistic alteration of EVs surface molecules are needed. For instance, our removal of CAMs and glycans reduces its cellular capture, extending the serum clearance half-lives of EVs from 1–10 min to more than 30min.12,14,30 Karmerka et al loaded the “don’t-eat-me” signals to EV, which dampened monocytic clearance.31 Significant reduction in the “off-target” adhesion/clearance is a prerequisite for enhancing the EVs tropism towards target tissues, as the exosomal nanobody domain needs to compete with other surface moieties for specific recognition and internalization in vivo.
For the IL12 loading into EVs, we did not employ high-efficiency loading scaffolds such as EWI-F or pDisplay,32 as the high abundance of IL12 might narrow down the therapeutic window with regard to efficacy and toxicity. Moreover, membrane-bound native cell signaling molecules were more potent than their Fc fusion analogs, primarily owing to the receptor sequestration effects of EVs.33 Hence, our exosomal IL12 expression system was more potent than the IL12-Fc chimera, which was consistent with the effect of exosomal IL12 on immune activation as reported by Dooley et al.32 This discrepancy might be attributed to the reduced loading density of IL12 on our engineered EVs, compared to that of the exosomal IL12. Therefore, the molecular density of immune stimulators like IL12 on EVs might not work in “the more the better” manner. The fast clearance of the IL12-bearing EVs (with an average serum half-life of ~30min), compared to that of the IL12-Fc protein chimera (with an average serum half-life from hours to days),34,35 might have contributed to the improved tolerability of bioengineered than the fusion protein. An increase in potency by several orders of magnitude along with a fast clearance yielded an improved therapeutic window of the ITGB1−mscIL12+HN3+Deg EVs in comparison to other conventional forms of therapeutic IL12.
Conclusion
In summary, we constructed an exosomal delivery platform for HEK293F-derived EVs and achieved improved pharmacokinetic profiles by engineering the cell surface integrins and N-glycans. The resulting EVs exhibited longer bioavailability, enhanced circulation half-life, and reduced hepatic accumulation following the intravenous administration in mice. Loading of a single-peptide antibody targeting GPC3 significantly improved the tumor targeting efficiency and precision of EVs, which in turn enhanced the precise delivery of exosomal IL12 to achieve significant anti-tumor efficacy with adequate tolerability. The multi-modal and highly engineered EVs system constituted a promising delivery platform for targeted delivery of therapeutic modalities, with a significantly improved therapeutic window.
Acknowledgments
The authors acknowledge financial supports from the Ministry of Science and Technology (China) (grant No. 2015ZX09501008-006, 2015ZX09501007-002-05) and the National Science Foundation of China (grant No. 81272701/H1617, 31400733). The authors also acknowledge the helpful discussions and critical reviews on pharmacokinetic studies from Dr. Lihou Dong at the Beijing Institute of Lifeomics.
Disclosure
The authors report no conflicts of interest in this work.
References
1. Sterzenbach U, Putz U, Low LH, Silke J, Tan SS, Howitt J. Engineered exosomes as vehicles for biologically active proteins. Mol Ther. 2017;25(6):1269–1278. doi:10.1016/j.ymthe.2017.03.030
2. O’Brien K, Breyne K, Ughetto S, Laurent LC, Breakefield XO. RNA delivery by extracellular vesicles in mammalian cells and its applications. Nat Rev Mol Cell Biol. 2020;21(10):585–606. doi:10.1038/s41580-020-0251-y
3. Giassafaki LN, Siqueira S, Panteris E, et al. Towards analyzing the potential of exosomes to deliver microRNA therapeutics. J Cell Physiol. 2021;236(2):1529–1544. doi:10.1002/jcp.29991
4. Cheng L, Hill AF. Therapeutically harnessing extracellular vesicles. Nat Rev Drug Discov. 2022;21(5):379–399. doi:10.1038/s41573-022-00410-w
5. Fang Z, Zhang X, Huang H, Jun W. Exosome based miRNA delivery strategy for disease treatment. Chin Chem Lett. 2022;33(4):1693–1704. doi:10.1016/j.cclet.2021.11.050
6. Cross R. Meet the exosome, the rising star in drug delivery. Available from: https://cen.acs.org/business/start-ups/Meet-exosome-rising-star-drug/96/i31.
7. Kalra H, Drummen GP, Mathivanan S. Focus on extracellular vesicles: introducing the next small big thing. Int J Mol Sci. 2016;17(2):170. doi:10.3390/ijms17020170
8. Zhu X, Badawi M, Pomeroy S, et al. Comprehensive toxicity and immunogenicity studies reveal minimal effects in mice following sustained dosing of extracellular vesicles derived from HEK293T cells. J Extracell Vesicles. 2017;6(1):1324730. doi:10.1080/20013078.2017.1324730
9. Kalluri R, LeBleu VS. The biology, function, and biomedical applications of exosomes. Science. 2020;367(6478). doi:10.1126/science.aau6977
10. Cully M. Exosome-based candidates move into the clinic. Nat Rev Drug Discov. 2021;20(1):6–7. doi:10.1038/d41573-020-00220-y
11. Mulcahy LA, Pink RC, Carter DR. Routes and mechanisms of extracellular vesicle uptake. J Extracell Vesicles. 2014;3(1):24641.
12. Gupta D, Liang X, Pavlova S, et al. Quantification of extracellular vesicles in vitro and in vivo using sensitive bioluminescence imaging. J Extracell Vesicles. 2020;9(1):1800222. doi:10.1080/20013078.2020.1800222
13. Kang M, Jordan V, Blenkiron C, Chamley LW. Biodistribution of extracellular vesicles following administration into animals: a systematic review. J Extracell Vesicles. 2021;10(8):e12085. doi:10.1002/jev2.12085
14. Charoenviriyakul C, Takahashi Y, Morishita M, Nishikawa M, Takakura Y. Role of extracellular vesicle surface proteins in the pharmacokinetics of extracellular vesicles. Mol Pharm. 2018;15(3):1073–1080. doi:10.1021/acs.molpharmaceut.7b00950
15. Williams C, Royo F, Aizpurua-Olaizola O, et al. Glycosylation of extracellular vesicles: current knowledge, tools and clinical perspectives. J Extracell Vesicles. 2018;7(1):1442985. doi:10.1080/20013078.2018.1442985
16. Hoshino A, Costa-Silva B, Shen TL, et al. Tumour exosome integrins determine organotropic metastasis. Nature. 2015;527(7578):329–335. doi:10.1038/nature15756
17. Altei WF, Pachane BC, Dos Santos PK, et al. Inhibition of alphavbeta3 integrin impairs adhesion and uptake of tumor-derived small extracellular vesicles. Cell Commun Signal. 2020;18(1):158. doi:10.1186/s12964-020-00630-w
18. Grigoryeva ES, Savelieva OE, Popova NO, Cherdyntseva NV, Perelmuter VM. Do tumor exosome integrins alone determine organotropic metastasis? Mol Biol Rep. 2020;47(10):8145–8157. doi:10.1007/s11033-020-05826-4
19. Casari I, Howard JA, Robless EE, Falasca M. Exosomal integrins and their influence on pancreatic cancer progression and metastasis. Cancer Lett. 2021;507:124–134. doi:10.1016/j.canlet.2021.03.010
20. Shimoda A, Miura R, Tateno H, et al. Assessment of surface glycan diversity on extracellular vesicles by lectin microarray and glycoengineering strategies for drug delivery applications. Small Methods. 2022;6(2):e2100785. doi:10.1002/smtd.202100785
21. Williams C, Pazos R, Royo F, et al. Assessing the role of surface glycans of extracellular vesicles on cellular uptake. Sci Rep. 2019;9(1):11920. doi:10.1038/s41598-019-48499-1
22. Nishida-Aoki N, Tominaga N, Kosaka N, Ochiya T. Altered biodistribution of deglycosylated extracellular vesicles through enhanced cellular uptake. J Extracell Vesicles. 2020;9(1):1713527. doi:10.1080/20013078.2020.1713527
23. Feng M, Gao W, Wang R, et al. Therapeutically targeting glypican-3 via a conformation-specific single-domain antibody in hepatocellular carcinoma. Proc Natl Acad Sci U S A. 2013;110(12):E1083–1091. doi:10.1073/pnas.1217868110
24. Hurwitz SN, Meckes DG Jr. An adaptable polyethylene glycol-based workflow for proteomic analysis of extracellular vesicles. Methods Mol Biol. 2017;1660:303–317.
25. Song Z, Xu Y, Zhang L, et al. Comprehensive proteomic profiling of urinary exosomes and identification of potential non-invasive early biomarkers of alzheimer’s disease in 5XFAD mouse model. Front Genet. 2020;11:565479. doi:10.3389/fgene.2020.565479
26. Ferries S, Perkins S, Brownridge PJ, et al. Evaluation of parameters for confident phosphorylation site localization using an orbitrap fusion tribrid mass spectrometer. J Proteome Res. 2017;16(9):3448–3459. doi:10.1021/acs.jproteome.7b00337
27. Ben Ami Pilo H, Khan KS, Lühle J, et al. Sialylated N-glycans mediate monocyte uptake of extracellular vesicles secreted from Plasmodium falciparum-infected red blood cells. J Extracell Bio. 2022;1(2):e33. doi:10.1002/jex2.33
28. Christianson HC, Svensson KJ, van Kuppevelt TH, Li JP, Belting M. Cancer cell exosomes depend on cell-surface heparan sulfate proteoglycans for their internalization and functional activity. Proc Natl Acad Sci U S A. 2013;110(43):17380–17385. doi:10.1073/pnas.1304266110
29. Dusoswa SA, Horrevorts SK, Ambrosini M, et al. Glycan modification of glioblastoma-derived extracellular vesicles enhances receptor-mediated targeting of dendritic cells. J Extracell Vesicles. 2019;8(1):1648995. doi:10.1080/20013078.2019.1648995
30. Lazaro-Ibanez E, Faruqu FN, Saleh AF, et al. Selection of fluorescent, bioluminescent, and radioactive tracers to accurately reflect extracellular vesicle biodistribution in vivo. ACS Nano. 2021;15(2):3212–3227. doi:10.1021/acsnano.0c09873
31. Kamerkar S, LeBleu VS, Sugimoto H, et al. Exosomes facilitate therapeutic targeting of oncogenic KRAS in pancreatic cancer. Nature. 2017;546(7659):498–503. doi:10.1038/nature22341
32. Dooley K, McConnell RE, Xu K, et al. A versatile platform for generating engineered extracellular vesicles with defined therapeutic properties. Mol Ther. 2021;29(5):1729–1743. doi:10.1016/j.ymthe.2021.01.020
33. Staufer O, Hernandez Bucher JE, Fichtler J, Schroter M, Platzman I, Spatz JP. Vesicle induced receptor sequestration: mechanisms behind extracellular vesicle-based protein signaling. Adv Sci. 2022;9(13):e2200201. doi:10.1002/advs.202200201
34. Jung K, Ha JH, Kim JE, et al. Heterodimeric Fc-fused IL12 shows potent antitumor activity by generating memory CD8(+) T cells. Oncoimmunology. 2018;7(7):e1438800. doi:10.1080/2162402X.2018.1438800
35. Bernett M, Liu K, Bonzon C, et al. IL12 Fc-fusions engineered for reduced potency and extended half-life exhibit strong anti-tumor activity and improved therapeutic index compared to wild-type IL12 agents. J Immunother Cancer. 2021;9(Suppl 2):A736–A736. doi:10.1136/jitc-2021-SITC2021.707
 © 2023 The Author(s). This work is published and licensed by Dove Medical Press Limited. The
full terms of this license are available at https://www.dovepress.com/terms
and incorporate the Creative Commons Attribution
- Non Commercial (unported, 3.0) License.
By accessing the work you hereby accept the Terms. Non-commercial uses of the work are permitted
without any further permission from Dove Medical Press Limited, provided the work is properly
attributed. For permission for commercial use of this work, please see paragraphs 4.2 and 5 of our Terms.
© 2023 The Author(s). This work is published and licensed by Dove Medical Press Limited. The
full terms of this license are available at https://www.dovepress.com/terms
and incorporate the Creative Commons Attribution
- Non Commercial (unported, 3.0) License.
By accessing the work you hereby accept the Terms. Non-commercial uses of the work are permitted
without any further permission from Dove Medical Press Limited, provided the work is properly
attributed. For permission for commercial use of this work, please see paragraphs 4.2 and 5 of our Terms.
Recommended articles
Impaired Autophagy Response in Hepatocellular Carcinomas Enriches Glypican-3 in Exosomes, Not in the Microvesicles
Koksal AR, Thevenot P, Aydin Y, Nunez K, Sandow T, Widmer K, Nayak L, Scott J, Delk M, Moehlen MW, Cohen AJ, Dash S
Journal of Hepatocellular Carcinoma 2022, 9:959-972
Published Date: 7 September 2022
Identification of the Level of Exosomal Protein by Parallel Reaction Monitoring Technology in HCC Patients
Huang H, Zhang Q, Zhang Y, Sun X, Liu C, Wang Q, Huang Y, Li Q, Wu Z, Pu C, Sun A
International Journal of General Medicine 2022, 15:7831-7842
Published Date: 14 October 2022
Identification and Experimental Validation of the Prognostic Significance and Immunological Correlation of Glycosylation-Related Signature and ST6GALNAC4 in Hepatocellular Carcinoma
Dai T, Li J, Liang RB, Yu H, Lu X, Wang G
Journal of Hepatocellular Carcinoma 2023, 10:531-551
Published Date: 3 April 2023
A Single-Step Immunocapture Assay to Quantify HCC Exosomes Using the Highly Sensitive Fluorescence Nanoparticle-Tracking Analysis
Koksal AR, Ekmen N, Aydin Y, Nunez K, Sandow T, Delk M, Moehlen M, Thevenot P, Cohen A, Dash S
Journal of Hepatocellular Carcinoma 2023, 10:1935-1954
Published Date: 2 November 2023
Bioengineered Exosome-Magnetic Nanoplatform for Precision Therapy of Hepatocellular Carcinoma via Dual-Targeted Drug Delivery
Han Y, Yan S, Wan R, Li X, Wu G
International Journal of Nanomedicine 2026, 21:576489
Published Date: 8 July 2026