Back to Journals » Cancer Management and Research » Volume 11
Super-Enhancer-Associated Hub Genes In Chronic Myeloid Leukemia Identified Using Weighted Gene Co-Expression Network Analysis
Authors Ma H, Qu J ![]() , Luo J, Qi T, Tan H, Jiang Z, Zhang H, Qu Q
, Luo J, Qi T, Tan H, Jiang Z, Zhang H, Qu Q
Received 28 May 2019
Accepted for publication 26 October 2019
Published 23 December 2019 Volume 2019:11 Pages 10705—10718
DOI https://doi.org/10.2147/CMAR.S214614
Checked for plagiarism Yes
Review by Single anonymous peer review
Peer reviewer comments 2
Editor who approved publication: Professor Harikrishna Nakshatri
Hongying Ma,1,2 Jian Qu,3 Jian Luo,1,2 Tingting Qi,3 Huanmiao Tan,4 Zhaohui Jiang,1 Haiwen Zhang,1 Qiang Qu1,2
1Department of Pharmacy, Xiangya Hospital, Central South University, Changsha 410008, Hunan, People’s Republic of China; 2Institute for Rational and Safe Medication Practices, National Clinical Research Center for Geriatric Disorders, Xiangya Hospital, Central South University, Changsha 410008, Hunan, People’s Republic of China; 3Department of Pharmacy, The Second Xiangya Hospital, Central South University, Changsha 410078, Hunan, People’s Republic of China; 4College of Bioscience and Biotechnology, Hunan Agricultural University, Changsha 410128, Hunan, People’s Republic of China
Correspondence: Qiang Qu
Department of Pharmacy, Xiangya Hospital, Central South University, Changsha 410008, Hunan, People’s Republic of China
Tel/Fax +86 731 84327460
Email [email protected]
Purpose: Super-enhancer (SE)-associated oncogenes extensively potentiate the uncontrolled proliferation capacity of cancer cells. In this study, we aimed to identify the SE-associated hub genes associated with the clinical characteristics of chronic myeloid leukemia (CML).
Methods: Eigengenes from CML clinical modules were determined using weighted gene co-expression network analysis (WGCNA). Overlapping genes between eigengenes and SE-associated genes were used to construct protein–protein interaction (PPI) networks and annotate for pathway enrichment analysis. Expression patterns of the top-ranked SE-associated hub genes were further determined in CML patients and healthy controls via real-time PCR. After treatment of K562 cells with the BRD4 inhibitor, JQ1, for 24 hrs, mRNA and protein levels of SE-associated hub genes were evaluated using real-time PCR and Western blotting, respectively. H3K27ac, H3K4me1 and BRD4 ChIP-seq signal peaks were used to predict and identify SEs visualized by the Integrative Genomics Viewer.
Results: The yellow module was significantly related to the status and pathological phase of CML. SE-associated hub candidate genes were mainly enriched in the cell cycle pathway. Based on the PPI networks of hub genes and the top rank of degree, five SE-associated genes were identified: specifically, BUB1, CENPO, KIF2C, ORC1, and RRM2. Elevated expression of these five genes was not only related to CML status and phase but also positively regulated by SE and suppressed by the BRD4 inhibitor, JQ1, in K562 cells. Strong signal peaks of H3K27ac, H3K4me1 and BRD4 ChIP-seq of the five genes were additionally observed close to the predicted SE regions.
Conclusion: This is the first study to characterize SE-associated genes linked to clinical characteristics of CML via weighted gene co-expression network analysis. Our results support a novel mechanism involving aberrant expression of hub SE-associated genes in CML patients and K562 cells, and these genes will be potential new therapeutic targets for human leukemia.
Keywords: chronic myeloid leukemia, WGCNA, super-enhancer, hub gene, eigengene
Introduction
Chronic myeloid leukemia (CML), a homogeneous genetic disease and clonal myeloproliferative disorder of pluripotent hematopoietic stem cells, is mainly triggered by a Philadelphia (Ph) chromosome encoding the BCR-ABL oncogenic fusion protein with constitutive and aberrant tyrosine kinase activity.1–3 While the causes and mechanisms underlying progression of CML in most cases remain unknown, it is suggested that genetic variations and aberrant expression of key genes play a role in the pathogenesis of the disease.4
Recent studies have identified hundreds of hub genes in critical signaling pathways involved in oncogenesis and that may be effectively utilized as therapeutic targets of CML.5 BCR-ABL, a fusion tyrosine kinase, was initially determined as a therapeutic target for patients with CML.6 Several other genes and pathways have been reported as potential prognostic markers and drug-sensitive indicators for CML, including ephrin type-B receptor 4 (EPHB4),7 Janus kinase 2 (JAK2),8 epidermal growth factor receptor (EGFR),9 β-catenin (CTNNB1),10 vascular endothelial growth factor A (VEGFA),11 KIT proto-oncogene receptor tyrosine kinase (c-Kit), and tumor protein p53 (TP53).12 Due to the small sample sizes of the studies performed to date, the molecular mechanisms associated with clinical traits, such as development and progress of CML, are yet to be fully elucidated.
Weighted gene co-expression network analysis (WGCNA) is a widely used systems genetic data analysis strategy based on pairwise correlations between variables.13–15 WGCNA is used to define modules, intramodular hubs, and network nodes with regard to module membership to determine the relationships between co-expression modules and compare the topology of different networks, thereby defining the significant eigengenes related to clinical traits.14 WGCNA has been extensively applied for analyzing genomics and metabolomics data, including microarray data,16,17 single-cell RNA-Seq data,18 DNA methylation, data19 and non-coding RNA data,20,21 peptide counts,22,23 and microbiota 16sRNA data,24 and shown to be suitable for investigating integrated co-expression networks obtained with large-scale samples.
Super-enhancers (SEs) are a special group of enhancers, which have since been identified in many cell types.25–27 Compared with typical enhancers (TEs), SEs recruit an exceptionally large number of transcription factors/co-factors and consequently induce transcription of multiple target oncogenes. H3K27ac and H3K4me1 are both indicators for identifying active enhancers. Compared to H3K4me1, mediators (CDK7, BRD4) and other biomarkers, H3K27ac is a common and efficient biomarker for identifying super-enhancers.25–27 Aberrant expression of oncogenes triggered by SEs is a key factor underlying tumorigenesis, so the screening and identification of hub oncogenes-driven by SEs attract many researchers.
In the present study, we developed a WGCNA-based method to effectively identify the SE-associated hub genes involved in clinical characteristics of CML. The CML microarray datasets and corresponding clinical traits were applied to perform WGCNA and determine key eigengenes. SE-associated genes were obtained using the dbSuper database based on H3K27ac ChIP-seq.28 Node genes were selected on the basis of gene overlap in the yellow module and SE-associated genes. SE-associated hub genes were further predicted according to the signal peaks of H3K27ac, H3K4me1 and BRD4 ChIP-seq. The BRD4-specific inhibitor, JQ1, was additionally applied to identify SE-associated genes in the CML cell line K562. Elucidation of the mechanisms associated with upregulation of these hub genes by SEs should facilitate our understanding of the tumorigenesis process and aid in improving therapeutic options.
Materials And Methods
Data Collection
CML datasets of GSE77191 were available from the NCBI Gene Expression Omnibus (GEO) (https://www.ncbi.nlm.nih.gov/geo/). GSE77191 is composed of 4 normal and 36 CML samples, including 26 chronic phase (CP), 7 accelerated phase (AP), and 3 blast phase (BP) samples. Annotation of the probe and clinical information was downloaded from the [HTA-2_0] Affymetrix Human Transcriptome Array 2.0 platform [transcript (gene) version]. Raw data were processed to generate an expression matrix and all probes matched to their gene symbol using the R package “limma” and annotation information on the GPL17586 array platform.
SE-associated genes in K562 CML cells were downloaded from the dbSuper database (http://asntech.org/dbsuper/).28 Master transcriptional factors and mediators (SOX2, OCT4, Nanog and BRD4) as biomarkers were reported to be used to identify SEs.25–27 H3K27ac and H3K4me1 as active enhancer markers are frequently used as biomarkers for the identification of SEs.25–27 In the present study, according to the algorithm of rank ordering of super-enhancers (ROSE), H3K27ac ChIP signal peaks (GSM733656) within 12,500 bp were stitched into one peak and considered as a super-enhancer, while peaks entirely contained within a window of ± 2,000 bp around transcription start site (TSS) were excluded from stitched regions.28 SE-associated genes were in the closest proximity to their corresponding SEs. We also use BRD4 (GSM2700494) and H3K4me1 (GSM788085) ChIP-seq to verify super-enhancer.
Construction Of WGCNA
The R package of “WGCNA” provides functions for carrying out all aspects of weighted network analysis (module construction, hub gene selection, module preservation statistics, differential network analysis, and network statistics). Here, WGCNA was used to construct a co-expression network for whole genes in samples from GSE77191 with the corresponding clinical information. Firstly, we employed Pearson’s correlation analysis to identify the outlying microarray samples. A matrix of similarity using Pearson’s correlation analysis of all gene pairs was constructed, which excluded outlying samples. The power value of the appropriate soft-thresholding was estimated for network construction by calculating the scale-free topology fit index (0.9) for several powers through the pickSoftThreshold function of WGCNA. The best-fit power value was selected to raise the matrix of similarity to achieve a scale-free co-expression network. Cluster analysis was subsequently performed with flashClust. Moreover, adjacency matrix was converted into a topological overlap matrix (TOM). According to the TOM-based dissimilarity measure with a minimum size (gene group) of 30 for the gene dendrogram, average linkage hierarchical clustering was conducted and genes with similar expression profiles classified into the same modules using the dynamic tree cut algorithm (deep split = 2, cut height = 0.25; default values were used for the other parameters).29 Module eigengenes (MEs) with dissimilarities were merged into the same modules under the cut line of 0.25.
Identification Of Clinically Significant Modules
Two approaches were applied to establish the relationships between modules and clinical phenotypes of CML via WGCNA. Firstly, the Pearson’s correlation coefficient was calculated to analyze the correlation between MEs and clinical traits. In addition, gene significance (GS) was calculated as the log10 transformation of the p-value of each gene (GS = LgP) in the linear regression slope between gene expression and clinical information. Module significance (MS) representing the average GS value for all the genes in a selected module was measured to incorporate clinical information into the co-expression network. The module with the highest MS value was considered the key module related to clinical traits.
Functional Annotations Of Clinically Significant Modules And SE-Associated Genes
Metascape (http://metascape.org/gp/index.html) is a web-based tool for gene annotation and functional enrichment analysis of pathways.30 Eigengenes within the clinically significant modules and SE-associated genes were annotated and analyzed using Metascape with default parameters, and p-values < 0.05 were regarded as significant.
Identification Of SE-Associated Hub Genes In Clinically Significant Modules
Venn diagrams were obtained with the online tool Venny 2.1 (http://bioinfogp.cnb.csic.es/tools/venny/index.html) to identify the genes intersecting between eigengenes from clinically significant module and SE-associated genes. A protein–protein interaction (PPI) network was constructed using overlapping genes via Networkanalyst (https://www.networkanalyst.ca/). The network diagram of all PPI node genes was visualized with Cytoscape.31 SE-associated hub genes were further selected based on the rank of node degree. Differential expression of node genes in CML patients was examined via Heatmap and Dotplot. Due to broad usage of the predicted markers of SE, signal peaks of H3K27ac, H3K4me1 and BRD4 ChIP-seq were downloaded from the dbSuper database and visualized using Integrative Genomics Viewer (IGV).32
Identification Of SE-Associated Hub Genes In CML Samples And K562 Cells
Thirty healthy and thirty CML blood samples were collected with the approval of Medical Ethics Committee of the Xiangya Hospital of Centre South University (201502032). The blood donors have written informed consent in accordance with the declaration of Helsinki. K562 cells were obtained from the Cell Bank of the Chinese Academy of Sciences (Shanghai, China) where they were characterized by mycoplasma negative, DNA-Fingerprinting, isozyme detection and cell vitality detection. K562 cells cultured in RPMI-1640 were treated with 1 or 10 μM JQ1 (CSNpharm, Shanghai, China, Cat # CSN13058) for 24 hrs. Total RNA was extracted using TRIzol (Thermol Fisher Scientific, Shanghai, China, Cat # 15596026) and expression levels of SE-associated hub genes identified using SYBR Green quantitative real-time PCR (TOYOBO, shanghai, China, Cat # QPK-201). Primer sequences were downloaded from PrimerBank.33 The antibodies, including BUB1 (Cat # 14H5), KIF2C (Cat # 2488C3a), ORC1 (Cat # F10), RRM2 (Cat # ab57653) and CENPO (Cat # ab173489) were purchased from Santa Cruz Biotechnology (Shanghai, China) and Abcam (Shanghai, China). Protein levels of SE-associated genes were analyzed via Western blotting according to the previous methods in our publications.34
Statistical Analysis
Statistical analysis of differential gene expression was conducted by a one-way ANOVA and post-hoc analysis by Student–Newman–Keuls test using SPSS version 13.0 (SPSS, Inc., Chicago, IL, USA). Biological differences were considered significant at p-values < 0.05.
Results
Construction Of The Weighted Gene Co-Expression Network
To build the weighted gene co-expression network, raw data of GSE77191 were downloaded from the GEO database. In total, 40 samples were enrolled for study, including 26 CML CP, 7 CML AP, 3 CML BP, and 4 normal samples. A total of 3538 probes were annotated and gene expression preprocessed identically using the “limma” R package for background correction and normalization. Expression for each gene was calculated and ranked from large to small, and the top 3000 genes selected for WGCNA. Cluster analysis was further performed using the flashClust function of the WGCNA package (Figure 1A). GSM2045756 as an outlier sample was removed in the following analysis.
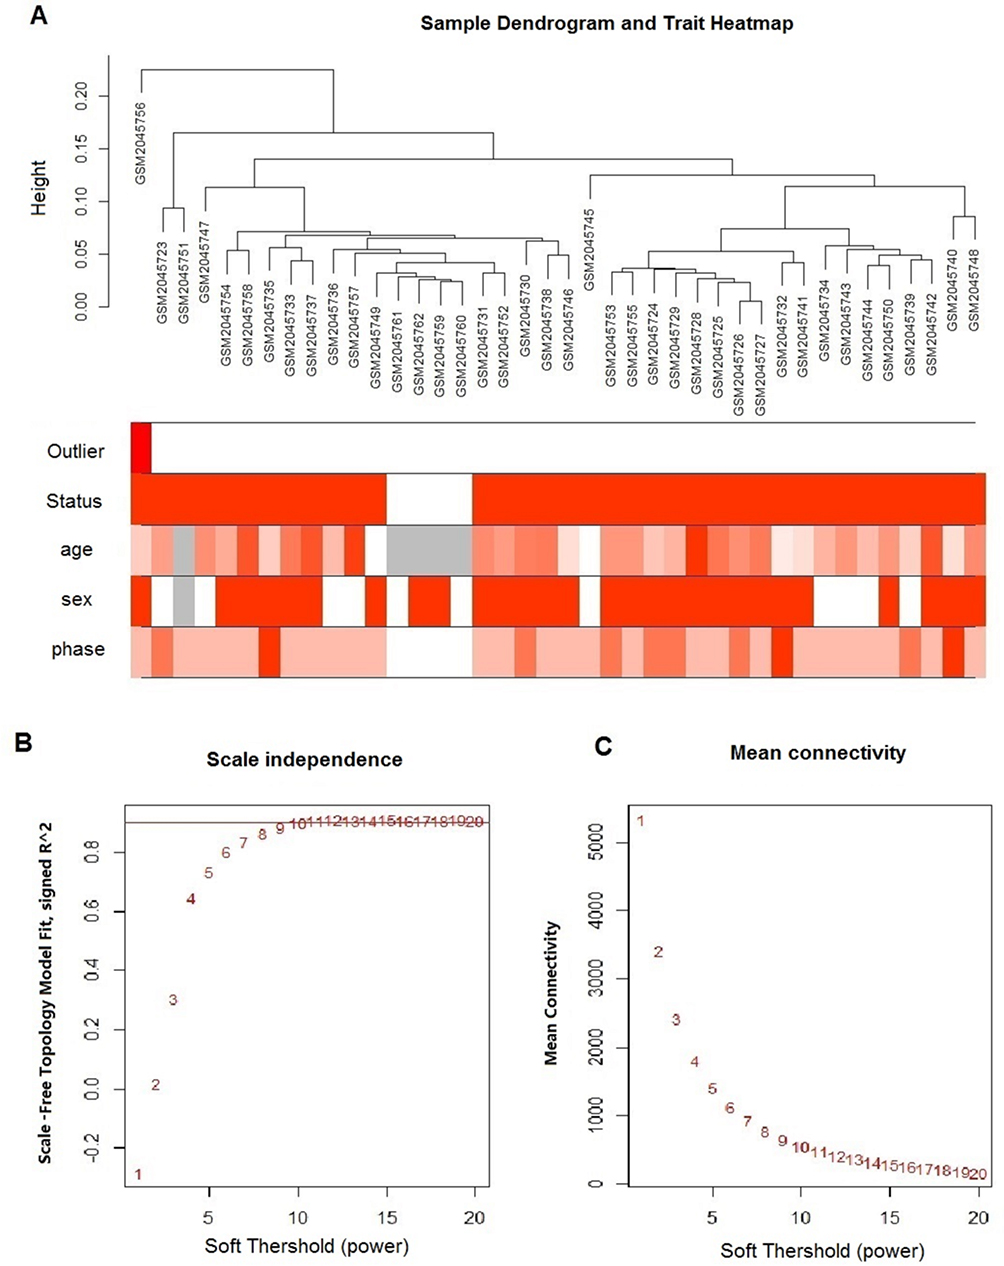 |
Figure 1 Clustering of samples and determination of soft-thresholding power. (A) The clustering heat map was based on expression data of GSE77191, including 26 CML CP, 7 CML AP, 3 CML BP, and 4 normal samples. The top 10,000 genes with the highest SD values were used for WGCNA analysis. Color intensity was proportional to sample outliers, disease status (CML and normal control), phase (normal control, CP, AP, BP), sex, and age. (B) Analysis of the scale-free fit index (y-axis) for various soft-thresholding powers (β value of x-axis). (C) Analysis of the mean connectivity (y-axis) for various soft-thresholding powers (β value of x-axis). |
To construct the gene co-expression network, the power value of appropriate soft-thresholding was obtained through prediction of the scale-free topology fit index (scale-free R2=0.90) for several powers. We selected β = 10 as the soft-thresholding power to ensure a scale-free network as the same analysis of the mean connectivity for various soft-thresholding powers (Figure 1B and C). A power of β = 10 was applied to produce a hierarchical clustering tree of module eigengenes (Figure 2A). We set the cut line at 0.25 to merge similar modules (Figure 2A), consequently generating 6 merged modules (Figure 2B).
 |
Figure 2 Construction of co-expression modules using WGCNA. (A) Cluster dendrogram of module eigengenes. (B) Dendrograms of differentially expressed genes clustered based on dissimilarity measures (1-TOM). Each short vertical line represents one gene, and the area of each color signifies the number size of each cluster of co-expression modules. |
Identification Of Clinically Significant Modules
We further analyzed the interactions of eigengenes in six modules and mapped the network heat map based on randomly 500 selected genes (Figure 3A). A module–trait relationship was calculated according to the Pearson correlation coefficient and displayed in the heat map. The yellow module displayed a higher correlation with CML status (r = 0.44, p = 0.005) and phase (r = 0.46, p = 0.003), compared with other modules (Figure 3B), with the highest module gene significance (GS) in relation to CML status (p = 3.5e-156) and phase (p = 8e-86) (Figure 3C, D). A scatter plot in Figure 3E illustrates the significant relationship between yellow module membership and GS. The heat map and column chart of gene expression in the yellow module further confirmed the significance of the relationship (Figure 3F). Accordingly, the yellow module was identified as the most significant clinically related unit and selected for subsequent analyses.
 |
Figure 3 Identification of key modules associated with the clinical traits of CML. (A) Topological overlap matrix plot. The different colors on the horizontal and vertical axes represent different modules. The brightness of the yellow in the middle represents the degree of connectivity of different modules. We observed no significant differences in interactions among the different modules, indicating a high-scale independence degree. (B) Heat map of the correlation between modules and clinical traits of CML. Numbers in the table signify the correlations of the corresponding module eigengenes and clinical traits, with the p-values specified below the correlations in parentheses. (C and D) Distribution of the average gene significance and errors in the modules associated with status and phase of CML. (E) Scatter plot of module eigengenes related to status and phase in the yellow module. (F) Heat map and column chart of gene expression in the yellow module. Intensity and direction of the correlations are indicated in the heat map (red, positively correlated; green, negatively correlated). |
Functional Annotation Of Clinically Significant Modules And SE-Associated Genes
SEs in K562 were downloaded from dbSuper and 806 SE-associated genes estimated according to the “ROSE” algorithm based on the H3K27ac ChIP-seq signal (Figure 4A). To identify the functions of eigengenes within the yellow module and SE-associated genes in K562, 254 eigengenes (Supplementary Table 1) and 806 SEs-associated genes (Supplementary Table 2) were annotated for pathway analysis via Metascape. Heat map was applied to determine the top enrichment clusters for SE-associated genes and eigengenes (Figure 4B) (Supplementary Table 3). The rows represent SE-associated genes and eigengenes, with a discrete color scale used to indicate statistical significance (-Log P). Both SE-associated genes and eigengenes in the yellow module were significantly enriched in eight pathways (red box). Metascape enrichment network visualization disclosed intra-cluster and inter-cluster similarities of enriched terms between SE-associated genes and eigengenes (Figure 4C and D). One term from each cluster was selected for description, shown as a color label. Common pathways are additionally depicted in the figure, whereby nodes are represented by pie charts, indicating their associations with each input gene.
 |
Figure 4 Pathways and functional annotations for SE-associated genes and eigengenes in the yellow module. (A) Prediction of SEs and SE-associated genes. SEs were predicted using the ROSE algorithm, and SE-associated genes were located closest to their respective SEs. A dot plot of the rank of enhancers based on the H3K27ac ChIP-seq signal was generated. In total, 806 SEs and SE-associated genes were predicted (red dots). Blue dots represent typical enhancers (TE). (B) Heat map showing top enrichment clusters for SE-associated genes and eigengenes, one row per cluster, with a discrete color scale representing statistical significance (-Log P). Gray color indicates lack of significance. (C) Metascape enrichment network visualization showing intra-cluster and inter-cluster similarities of enriched terms for SE-associated genes and eigengenes in the yellow module. Each term is represented by a circle node, where its size is proportional to the number of input genes falling into that term, and its color represents cluster identity. Terms with a similarity score > 0.3 are linked by an edge (the thickness of the edge represents the similarity score). One term from each cluster was selected to have its description shown as a label. (D) Enrichment network visualization of results from SE-associated genes and eigengenes in the yellow module, whereby nodes are represented by pie charts indicating association with each input study. |
Identification Of SE-Associated Hub Genes Related To CML Status And Phase
To identify the common genes between SE-associated genes and genes from yellow module, 25 node genes of the intersections were identified in the Venn diagram (Figure 5A). 25 genes were further uploaded into the STRING database for PPI analysis (Figure 5B). We visualized the 25 node genes and other connecting genes in the PPI network using cytoscape and identified 12 hub genes by sorting the node degree of candidate genes (Figure 5B and C). UBC was excluded in the following study. UBC is a selected hub gene in the PPI network, but is not SE-associated gene. The hierarchical clustering heat map further disclosed expression levels of 11 node genes in different disease status groups, including CP, AP, and BP, compared to normal control (Figure 5D). Five SE-associated hub genes showing significantly different expression levels were selected to analyze ChIP-seq tracks of SE. As shown in Figure 6, signal peaks of H3K27ac in blue were used to predict SE regions. H3K4me1 and BRD4 ChIP-seq were also used to display in pink and green, respectively. In Figure 6, predicted SEs and several constituent active enhancers are shown in red. The five SE-associated hub genes identified (BUB1, CENPO, KIF2C, ORC1, and RRM2) were located close to the predicted SE. Strong peak signal of H3K4me1 and BRD4 is also observed at the predicted active enhancer. Thus, these biomarkers are favorable biomarkers for the identification of super-enhancer. In the boxplot diagram (Figure 7A), expression levels of the five genes from GSE77191 in the normal control group were markedly lower than those of CML (CP, AP, and BP) groups (p < 0.05). These hub genes also showed higher mRNA expression in CML patients, compared to healthy controls (Figure 7B). Expression of the genes gradually decreased after treatment with JQ1 (1 or 10 μM) at both the mRNA and protein levels (Figure 7C and D). Our results clearly demonstrate that expressions of SE-associated hub genes in both CML patients and K562 cells are probably upregulated by SEs.
 |
Figure 5 Screening of SE-associated hub genes. (A) Venn plot of SE-associated genes and yellow module eigengenes. Genes intersecting within the Venn plot were considered candidate hub genes. (B) Plot of ranking node genes based on node degree. Genes with a node degree of >3 were considered hub genes. (C) PPI network of SE-associated genes constructed using NetworkAnalyst. The square and oval boxes represent node and hub genes, respectively. The continuous color map depicts the node degree. (D) Heat map of SE-associated hub gene expression in CML patients and control groups. |
 |
Figure 6 Signal tracks for H3K27ac (blue), H3K4me1 (pink) and BRD4 (green) ChIP-seq profiles of SE-associated hub genes in K562 cells visualized using IGV. The stitched regions of active enhancers and SEs are shown in red. |
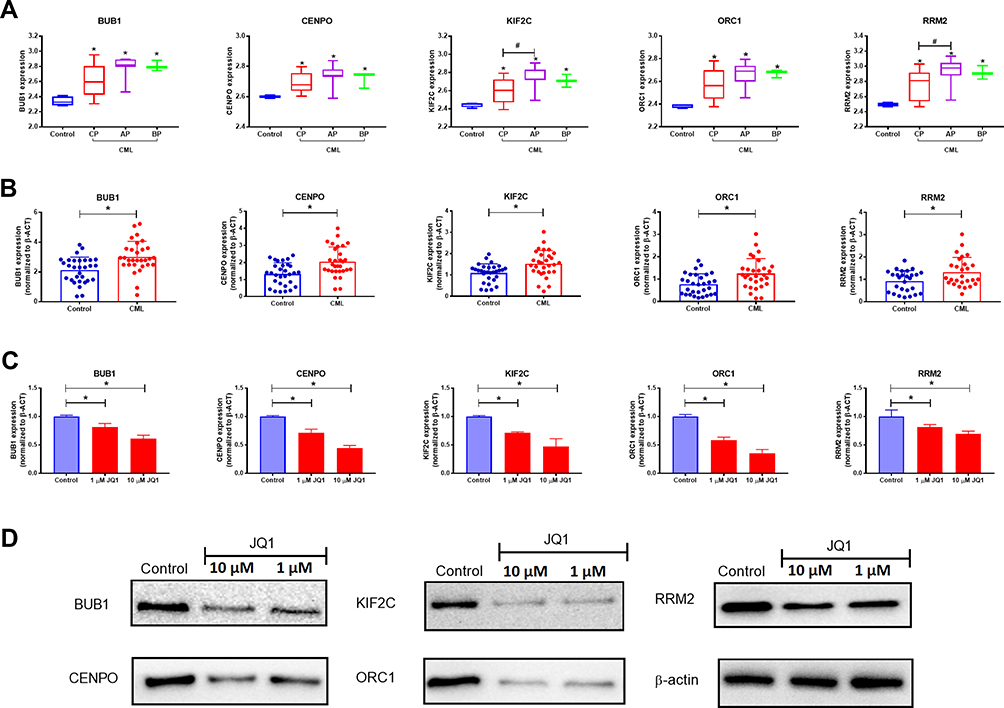 |
Figure 7 Identification of SE-associated hub genes in CML patients and K562 cells. (A) Boxplots showing mRNA expression of SE-associated hub genes in CML patient groups (CP, AP, and BP) (GSE), compared to the control group. Differences were considered significant at p-values < 0.05 (*). Compared to different phase groups, p-values < 0.05 were considered significant (#). (B) Boxplots and dotplots showing mRNA expression of SE-associated hub genes in CML patients from Xiangya Hospital. Differences were considered significant at p-values < 0.05 (*), compared to the control group. (C and D) mRNA and protein levels of SE-associated genes in K562 cells after treatment with JQ1 (1 and 10 μM). Differences were considered significant at p-values < 0.05 (*), compared to the control group. |
Discussion
CML is characterized by accumulation of myeloid cells in blood and caused by uncontrolled growth of myeloid cells in the bone marrow.4 Despite improvements in CML treatments during the last decade, the ability to treat advanced cases remains limited due to the lack of precise molecular targets. Thus, identification of novel biomarkers potentially involved in specific prognosis and progression of CML is essential to improve therapeutic options.
In this study, we identified the key modules and hub genes in tumorigenesis and phases of CML using WGCNA. While genome-wide gene expression results from CML datasets are available, analyses that can effectively link expression patterns to clinical traits remain a major challenge.35 WGCNA methods avoid this limitation by focusing on a group of genes rather than individual genes through screening the modules and eigengenes associated with clinical traits. The top 3000 genes based on SD ranking were used to construct a co-expression network and six significant modules were subsequently identified. Based on the analysis of module–trait relationships, the yellow module was most significantly associated not only with CML disease status but also with CML phase. Within the yellow module, 254 genes with high connectivity were screened and enrichment analysis of signaling pathways and GO function conducted. Genes in the yellow module and SE-associated genes were mostly enriched in the pathways involved in cell cycle phase transition, megakaryocyte differentiation, Ub-specific processing proteases, hemostasis, regulation of chromosome organization, signaling by interleukins, and centromere complex assembly.
Super-enhancers are an emerging sub-class of regulatory regions that recruit master regulators and co-activators, and control cell identity and disease-related genes.36,37 Recent findings indicate that SE-associated specific oncogenes may be required for tumor cell proliferation but are not observed in normal cells.37 The utility of SEs in the therapeutic targeting strategies has been minimally explored to date.38 Given the pivotal roles of SE-associated genes in determining cancer cell identity and supporting cancer cell growth, we speculated that the SE-associated genes screened from eigengenes in the clinically related module are also critical for CML tumorigenesis and development. In our study, 25 SE-associated genes from K562 cells were selected and further subjected to PPI analysis.
Based on the ranking of node genes in the PPI network and differences in expression levels between the normal control and CML groups, five SE-associated genes were identified as hub genes. In particular, KIF2C and RRM2 displayed significant differences between the CP and AP phases of CML while the other genes were associated with status but not phase. Following the treatment of K562 with a specific BRD4 inhibitor, JQ1, the levels of five SE-associated genes were reduced. These findings imply that five hub genes significantly related to CML status and phase are upregulated by SEs and suppressed by JQ1. Although KIF2C and BUB1 connected each other in Figure 5, there is no report about this connection and binding partners. In future, the interaction of KIF2C and BUB1 is probably interfered by drugs as a therapeutic target. Other interactions between the five SE-associated genes were not found. Based on the signal peaks of H3K27ac ChIP-seq shown in blue, five SE-associated hub genes (BUB1, CENPO, KIF2C, ORC1, and RRM2) were identified close to their respective predicted SEs. The high signal peaks of H3K4me1 and BRD4 ChIP-seq also showed near SE-associated hub genes. Our results support the enhancement of expression of the hub genes identified in CML patients. While several critical SEs have been previously reported, it remains unclear whether the regulation of these genes is relevant to the development and status of CML.26,39 The SE-associated gene CCND3 was reported in an earlier study, but was not significantly changed in CML patients in GSE77191 dataset (p > 0.05).26,39 Thus, these SE-associated genes probably play pivotal roles in K562 cell line but not in CML patients. Here, we focused solely on the most important module and genes displaying the most significant fold changes. Thus, several SE-associated genes in K562 cells previously reported as important were excluded from our study due to the indistinct expression changes.
BUB1 encodes a serine/threonine–protein kinase that functions, in part, by phosphorylating members of the mitotic checkpoint complex and activating the spindle checkpoint.40 BUB1 additionally plays a role in abrogating activation of the anaphase-promoting complex/cyclosome.40 Germline mutations or aberrant expression in BUB1 have been associated with aneuploidy and several forms of cancer.41–43 The BUB1 inhibitor, BAY 1816032, is reported to sensitize tumor cells to taxanes, ATR Serine/Threonine Kinase (ATR), and Poly(ADP-Ribose) Polymerase (PARP) inhibitors in human triple-negative breast xenograft models.44 These findings highlight a role of BUB1 in inducing a state of tumorigenesis and suggest promising new therapeutic avenues for treating highly invasive cancer.
Kinesin Family Member 2C (KIF2C), also known as mitotic centromere-associated kinesin (MCAK), functions as a microtubule-dependent molecular motor involved in related cell cycle, mitotic, and reelin pathways.45 The function of KIF2C is correlated to its conformational changes and depolymerization activity.45 A model of its regulation by multiple mitotic kinases has been proposed and its potential involvement in oncogenesis and drug resistance highlighted.45 KIF2C serves as a novel prognostic marker in human gliomas, and suprarenal epithelioma.46,47 Expression of this protein is also correlated to poor prognosis of operable esophageal squamouscell carcinoma in male patients.48 Thus, repression of KIF2C may present a novel therapeutic strategy for combating malignancy in some tumor entities.
Ribonucleotide reductase regulatory subunit M2 (RRM2) encodes one of two non-identical subunits for ribonucleotide reductase involved in interrelated cell cycle, mitotic, and pyrimidine metabolism pathways. Integration of transcriptomic data revealed significantly elevated RRM2 in glioblastoma,49 breast cancer,50–53 prostate cancer,54 neuroblastoma,55 colorectal cancer,17,56 pancreatic cancer,57 hepatocellular carcinoma,58,59 and adrenocortical cancer.60 Knockdown of RRM2 with siRNA effectively impeded pancreatic tumor growth either alone or synergistically with doxorubicin.61 Delivery of RRM2 siRNA to vascular smooth muscle cells through liposome–polycation–DNA complex conjugated with cell-penetrating peptides could also markedly inhibit RRM2 mRNA and protein expression, resulting in significant suppression of cellular proliferation and migration.62 Trans−4, 4ʹ-dihydroxystilbene (DHS) was shown to suppress DNA replication by inhibiting RRM2, thereby decreasing the growth of pancreatic, ovarian, and colorectal tumor.63 In summary, RRM2 as a hub gene and related pathways may serve as biomarkers or therapeutic targets for cancer.
ORC1, a highly conserved six-subunit protein complex, binds specifically to origins of replication and serves as a platform for the assembly of additional initiation factors, such as Cdc6 and Mcm proteins.64 ORC1 is reported to be involved in cell cycle, mitosis, and E2F-mediated regulation of DNA replication.65,66 Recent findings revealed that knocking down of ORC1 memorably suppressed cell proliferation, blocked cell cycle, decreased the expression of Bcl-2 while increased the apoptosis rate and the expression of c-caspase3 and cleaved PARP in cervical cancer cell lines HeLa and C33A.67 CENPO encodes a component of the interphase centromere complex, which localizes to the centromere throughout the cell cycle and is required for bipolar spindle assembly, chromosome segregation, and checkpoint signaling during mitosis.68 Although few reports have linked ORC1 and CENPO to cancer treatment to date, the findings that these genes are enriched in the signaling pathways of cell cycle and mitosis support their utility as novel therapeutic biotargets for CML.
Conclusion
This is the first study to apply WGCNA-based methods to identify SE-associated hub genes expressed in association with CML clinical traits. Further investigation of these genes should not only enhance our understanding of CML tumorigenesis and development but also provide potential therapeutic targets. Our study presents proof of principle applicable to other diseases and clinical traits, which can be used to redefine molecular mechanisms and disease phenotypes for optimization of clinical practice.
Acknowledgments
This work was supported by grants from the National Natural Scientific Foundation of China (No. 81503166, 81603208), the Youth Foundation of Xiangya Hospital in Central South University (2014Q08), and the Natural Scientific Foundation of Hunan province in China (2018JJ3846).
Disclosure
The authors report no conflicts of interest in this work.
References
1. Groffen J, Stephenson JR, Heisterkamp N, de Klein A, Bartram CR, Grosveld G. Philadelphia chromosomal breakpoints are clustered within a limited region, bcr, on chromosome 22. Cell. 1984;36(1):93–99. doi:10.1016/0092-8674(84)90077-1
2. Daley GQ, Baltimore D. Transformation of an interleukin 3-dependent hematopoietic cell line by the chronic myelogenous leukemia-specific P210bcr/abl protein. Proc Natl Acad Sci U S A. 1988;85(23):9312–9316. doi:10.1073/pnas.85.23.9312
3. Zhang J, Jiang Y, Han X, et al. Differential expression profiles and functional analysis of plasma miRNAs associated with chronic myeloid leukemia phases. Future Oncol. 2018;15(7):763–776.
4. Arber DA, Orazi A. Update on the pathologic diagnosis of chronic myelomonocytic leukemia. Mod Pathol. 2019. doi:10.1038/s41379-019-0215-y
5. Heidari N, Abroun S, Bertacchini J, Vosoughi T, Rahim F, Saki N. Significance of inactivated genes in leukemia: pathogenesis and prognosis. Cell J. 2017;19(Suppl 1):9–26. doi:10.22074/cellj.2017.4908
6. Druker BJ, Tamura S, Buchdunger E, et al. Effects of a selective inhibitor of the Abl tyrosine kinase on the growth of Bcr-Abl positive cells. Nat Med. 1996;2(5):561–566. doi:10.1038/nm0596-561
7. Zhao WH, Huang BT, Zhang JY, Zeng QC. Distinct EphB4-mediated mechanisms of apoptotic and resistance to dasatinib in human chronic myeloid leukemia and K562 cell lines. Leuk Res. 2017;63:28–33. doi:10.1016/j.leukres.2017.10.014
8. Xiao X, Jiang K, Xu Y, et al. (-)-Epigallocatechin-3-gallate induces cell apoptosis in chronic myeloid leukaemia by regulating Bcr/Abl-mediated p38-MAPK/JNK and JAK2/STAT3/AKT signalling pathways. Clin Exp Pharmacol Physiol. 2018;46(2):126–136.
9. Corrado C, Saieva L, Raimondo S, Santoro A, De Leo G, Alessandro R. Chronic myelogenous leukaemia exosomes modulate bone marrow microenvironment through activation of epidermal growth factor receptor. J Cell Mol Med. 2016;20(10):1829–1839. doi:10.1111/jcmm.12873
10. Riva B, De Dominici M, Gnemmi I, et al. Celecoxib inhibits proliferation and survival of chronic myelogenous leukemia (CML) cells via AMPK-dependent regulation of beta-catenin and mTORC1/2. Oncotarget. 2016;7(49):81555–81570. doi:10.18632/oncotarget.13146
11. Lakkireddy S, Aula S, Kapley A, et al. Association of Vascular Endothelial Growth Factor A (VEGFA) and its receptor (VEGFR2) gene polymorphisms with risk of chronic myeloid leukemia and influence on clinical outcome. Mol Diagn Ther. 2016;20(1):33–44. doi:10.1007/s40291-015-0173-0
12. Weich N, Ferri C, Moiraghi B, et al. TP53 codon 72 polymorphism predicts chronic myeloid leukemia susceptibility and treatment outcome. Blood Cells Mol Dis. 2016;59:129–133. doi:10.1016/j.bcmd.2016.05.007
13. Liu W, Li L, Ye H, Tu W. [Weighted gene co-expression network analysis in biomedicine research]. Sheng Wu Gong Cheng Xue Bao. 2017;33(11):1791–1801. doi:10.13345/j.cjb.170006
14. Langfelder P, Horvath S. Eigengene networks for studying the relationships between co-expression modules. BMC Syst Biol. 2007;1:54. doi:10.1186/1752-0509-1-54
15. Langfelder P, Horvath S. WGCNA: an R package for weighted correlation network analysis. BMC Bioinformatics. 2008;9:559. doi:10.1186/1471-2105-9-559
16. Shi T, Chen J, Li J, Yang BY, Zhang QL. Identification of key gene modules and pathways of human glioma through coexpression network. J Cell Physiol. 2019;234(2):1862–1870. doi:10.1002/jcp.27059
17. Liu R, Zhang W, Liu ZQ, Zhou HH. Associating transcriptional modules with colon cancer survival through weighted gene co-expression network analysis. BMC Genomics. 2017;18(1):361. doi:10.1186/s12864-017-3761-z
18. Qiu JJ, Ren ZR, Yan JB. Identification and functional analysis of long non-coding RNAs in human and mouse early embryos based on single-cell transcriptome data. Oncotarget. 2016;7(38):61215–61228. doi:10.18632/oncotarget.11304
19. Luo Z, Liu R, Sun B, et al. Identification of gene modules associated with warfarin dosage by a genome-wide DNA methylation study. Pharmazie. 2018;73(5):288–293. doi:10.1691/ph.2018.7319
20. Alaei S, Sadeghi B, Najafi A, Masoudi-Nejad A. LncRNA and mRNA integration network reconstruction reveals novel key regulators in esophageal squamous-cell carcinoma. Genomics. 2019;111(1):76–89. doi:10.1016/j.ygeno.2018.01.003
21. Liu S, Xie F, Xiang X, et al. Identification of differentially expressed genes, lncRNAs and miRNAs which are associated with tumor malignant phenotypes in hepatoblastoma patients. Oncotarget. 2017;8(57):97554–97564. doi:10.18632/oncotarget.22181
22. Shirasaki DI, Greiner ER, Al-Ramahi I, et al. Network organization of the huntingtin proteomic interactome in mammalian brain. Neuron. 2012;75(1):41–57. doi:10.1016/j.neuron.2012.05.024
23. Pei G, Chen L, Zhang W. WGCNA application to proteomic and metabolomic data analysis. Methods Enzymol. 2017;585:135–158.
24. Tong M, Li X, Wegener Parfrey L, et al. A modular organization of the human intestinal mucosal microbiota and its association with inflammatory bowel disease. PLoS One. 2013;8(11):e80702. doi:10.1371/journal.pone.0080702
25. Chapuy B, McKeown MR, Lin CY, et al. Discovery and characterization of super-enhancer-associated dependencies in diffuse large B cell lymphoma. Cancer Cell. 2013;24(6):777–790. doi:10.1016/j.ccr.2013.11.003
26. Hnisz D, Abraham BJ, Lee TI, et al. Super-enhancers in the control of cell identity and disease. Cell. 2013;155(4):934–947. doi:10.1016/j.cell.2013.09.053
27. Whyte WA, Orlando DA, Hnisz D, et al. Master transcription factors and mediator establish super-enhancers at key cell identity genes. Cell. 2013;153(2):307–319. doi:10.1016/j.cell.2013.03.035
28. Khan A, Zhang X. dbSUPER: a database of super-enhancers in mouse and human genome. Nucleic Acids Res. 2016;44(D1):D164–D171. doi:10.1093/nar/gkv1002
29. Langfelder P, Zhang B, Horvath S. Defining clusters from a hierarchical cluster tree: the dynamic tree cut package for R. Bioinformatics. 2008;24(5):719–720. doi:10.1093/bioinformatics/btm563
30. Zhou Y, Zhou B, Pache L, et al. Metascape provides a biologist-oriented resource for the analysis of systems-level datasets. Nat Commun. 2019;10(1):1523. doi:10.1038/s41467-019-09234-6
31. Shannon P, Markiel A, Ozier O, et al. Cytoscape: a software environment for integrated models of biomolecular interaction networks. Genome Res. 2003;13(11):2498–2504. doi:10.1101/gr.1239303
32. Robinson JT, Thorvaldsdottir H, Winckler W, et al. Integrative genomics viewer. Nat Biotechnol. 2011;29(1):24–26. doi:10.1038/nbt.1754
33. Wang X, Spandidos A, Wang H, Seed B. PrimerBank: a PCR primer database for quantitative gene expression analysis, 2012 update. Nucleic Acids Res. 2012;40(Database issue):D1144–D1149. doi:10.1093/nar/gkr1013
34. Luo J, Qu J, Yang R, et al. Phytochemicals mediate the expression and activity of OCTN2 as activators of the PPARgamma/RXRalpha pathway. Front Pharmacol. 2016;7:189. doi:10.3389/fphar.2016.00189
35. Ferreira AF, de Oliveira GL, Tognon R, et al. Apoptosis-related gene expression profile in chronic myeloid leukemia patients after imatinib mesylate and dasatinib therapy. Acta Haematol. 2015;133(4):354–364. doi:10.1159/000369446
36. Ko JY, Oh S, Yoo KH. Functional enhancers as master regulators of tissue-specific gene regulation and cancer development. Mol Cells. 2017;40(3):169–177. doi:10.14348/molcells.2017.0033
37. Sengupta S, George RE. Super-enhancer-driven transcriptional dependencies in cancer. Trends Cancer. 2017;3(4):269–281. doi:10.1016/j.trecan.2017.03.006
38. Thandapani P. Super-enhancers in cancer. Pharmacol Ther. 2019. doi:10.1016/j.pharmthera.2019.02.014
39. Huang J, Li K, Cai W, et al. Dissecting super-enhancer hierarchy based on chromatin interactions. Nat Commun. 2018;9(1):943. doi:10.1038/s41467-018-03279-9
40. Rodriguez-Rodriguez JA, Lewis C, McKinley KL, et al. Distinct roles of RZZ and Bub1-KNL1 in mitotic checkpoint signaling and kinetochore expansion. Curr Biol. 2018;28(21):
41. Mur P, De Voer RM, Olivera-Salguero R, et al. Germline mutations in the spindle assembly checkpoint genes BUB1 and BUB3 are infrequent in familial colorectal cancer and polyposis. Mol Cancer. 2018;17(1):23. doi:10.1186/s12943-018-0762-8
42. de Voer RM, Geurts van Kessel A, Weren RD, et al. Germline mutations in the spindle assembly checkpoint genes BUB1 and BUB3 are risk factors for colorectal cancer. Gastroenterology. 2013;145(3):544–547. doi:10.1053/j.gastro.2013.06.001
43. Zhang L, Huang Y, Ling J, et al. Screening and function analysis of hub genes and pathways in hepatocellular carcinoma via bioinformatics approaches. Cancer Biomark. 2018;22(3):511–521. doi:10.3233/CBM-171160
44. Siemeister G, Mengel A, Fernandez-Montalvan AE, et al. Inhibition of BUB1 kinase by BAY 1816032 sensitizes tumor cells toward taxanes, ATR, and PARP inhibitors in vitro and in vivo. Clin Cancer Res. 2018;5(4):1404–1414.
45. Ritter A, Kreis NN, Louwen F, Wordeman L, Yuan J. Molecular insight into the regulation and function of MCAK. Crit Rev Biochem Mol Biol. 2015;51(4):228–245. doi:10.1080/10409238.2016.1178705
46. Bie L, Zhao G, Wang YP, Zhang B. Kinesin family member 2C (KIF2C/MCAK) is a novel marker for prognosis in human gliomas. Clin Neurol Neurosurg. 2012;114(4):356–360.
47. Gu Y, Lu L, Wu L, Chen H, Zhu W, He Y. Identification of prognostic genes in kidney renal clear cell carcinoma by RNAseq data analysis. Mol Med Rep. 2017;15(4):1661–1667. doi:10.3892/mmr.2017.6194
48. Duan H, Zhang X, Wang FX, et al. KIF-2C expression is correlated with poor prognosis of operable esophageal squamous cell carcinoma male patients. Oncotarget. 2016;7(49):80493–80507. doi:10.18632/oncotarget.11492
49. Rasmussen RD, Gajjar MK, Tuckova L, et al. BRCA1-regulated RRM2 expression protects glioblastoma cells from endogenous replication stress and promotes tumorigenicity. Nat Commun. 2016;7:13398. doi:10.1038/ncomms13398
50. Luo X, Yu H, Song Y, Sun T. Integration of metabolomic and transcriptomic data reveals metabolic pathway alteration in breast cancer and impact of related signature on survival. J Cell Physiol. 2018;34(8):13021–13031.
51. Liang WH, Li N, Yuan ZQ, Qian XL, Wang ZH. DSCAM-AS1 promotes tumor growth of breast cancer by reducing miR-204-5p and up-regulating RRM2. Mol Carcinog. 2018;58(4):461–473.
52. Liu R, Guo CX, Zhou HH. Network-based approach to identify prognostic biomarkers for estrogen receptor-positive breast cancer treatment with tamoxifen. Cancer Biol Ther. 2015;16(2):317–324. doi:10.1080/15384047.2014.1002360
53. Liu R, Lv QL, Yu J, et al. Correlating transcriptional networks with pathological complete response following neoadjuvant chemotherapy for breast cancer. Breast Cancer Res Treat. 2015;151(3):607–618. doi:10.1007/s10549-015-3428-x
54. He Z, Tang F, Lu Z, et al. Analysis of differentially expressed genes, clinical value and biological pathways in prostate cancer. Am J Transl Res. 2018;10(5):1444–1456.
55. Li J, Pang J, Liu Y, et al. Suppression of RRM2 inhibits cell proliferation, causes cell cycle arrest and promotes the apoptosis of human neuroblastoma cells and in human neuroblastoma RRM2 is suppressed following chemotherapy. Oncol Rep. 2018;40(1):355–360. doi:10.3892/or.2018.6420
56. Chang CC, Lin CC, Wang CH, et al. miR-211 regulates the expression of RRM2 in tumoral metastasis and recurrence in colorectal cancer patients with a k-ras gene mutation. Oncol Lett. 2018;15(5):8107–8117. doi:10.3892/ol.2018.8295
57. Farrell JJ, Moughan J, Wong JL, et al. Precision medicine and pancreatic cancer: a gemcitabine pathway approach. Pancreas. 2016;45(10):1485–1493. doi:10.1097/MPA.0000000000000710
58. He B, Yin J, Gong S, et al. Bioinformatics analysis of key genes and pathways for hepatocellular carcinoma transformed from cirrhosis. Medicine (Baltimore). 2017;96(25):e6938. doi:10.1097/MD.0000000000006938
59. Zhang C, Peng L, Zhang Y, et al. The identification of key genes and pathways in hepatocellular carcinoma by bioinformatics analysis of high-throughput data. Med Oncol. 2017;34(6):101. doi:10.1007/s12032-017-0963-9
60. Grolmusz VK, Karaszi K, Micsik T, et al. Cell cycle dependent RRM2 may serve as proliferation marker and pharmaceutical target in adrenocortical cancer. Am J Cancer Res. 2016;6(9):2041–2053.
61. Zheng S, Wang X, Weng YH, et al. siRNA knockdown of RRM2 effectively suppressed pancreatic tumor growth alone or synergistically with doxorubicin. Mol Ther Nucleic Acids. 2018;12:805–816. doi:10.1016/j.omtn.2018.08.003
62. Wu Y, Sun J, Li A, Chen D. The promoted delivery of RRM2 siRNA to vascular smooth muscle cells through liposome-polycation-DNA complex conjugated with cell penetrating peptides. Biomed Pharmacother. 2018;103:982–988. doi:10.1016/j.biopha.2018.03.068
63. Chen CW, Li Y, Hu S, et al. DHS (trans-4,4ʹ-dihydroxystilbene) suppresses DNA replication and tumor growth by inhibiting RRM2 (ribonucleotide reductase regulatory subunit M2). Oncogene. 2018;38(13):2364–2379.
64. Fernandez-Cid A, Riera A, Tognetti S, et al. An ORC/Cdc6/MCM2-7 complex is formed in a multistep reaction to serve as a platform for MCM double-hexamer assembly. Mol Cell. 2013;50(4):577–588. doi:10.1016/j.molcel.2013.03.026
65. Diaz-Trivino S, Del Mar Castellano M, de la Paz Sanchez M, Ramirez-Parra E, Desvoyes B, Gutierrez C. The genes encoding arabidopsis ORC subunits are E2F targets and the two ORC1 genes are differently expressed in proliferating and endoreplicating cells. Nucleic Acids Res. 2005;33(17):5404–5414. doi:10.1093/nar/gki854
66. Asano M, Wharton RP. E2F mediates developmental and cell cycle regulation of ORC1 in Drosophila. Embo J. 1999;18(9):2435–2448. doi:10.1093/emboj/18.9.2435
67. Chen X, Xiong D, Ye L, et al. Up-regulated lncRNA XIST contributes to progression of cervical cancer via regulating miR-140-5p and ORC1. Cancer Cell Int. 2019;19:45. doi:10.1186/s12935-019-0744-y
68. Saito A, Muro Y, Sugiura K, Ikeno M, Yoda K, Tomita Y. CENP-O, a protein localized at the centromere throughout the cell cycle, is a novel target antigen in systemic sclerosis. J Rheumatol. 2009;36(4):781–786. doi:10.3899/jrheum.080726
 © 2019 The Author(s). This work is published and licensed by Dove Medical Press Limited. The
full terms of this license are available at https://www.dovepress.com/terms
and incorporate the Creative Commons Attribution
- Non Commercial (unported, 3.0) License.
By accessing the work you hereby accept the Terms. Non-commercial uses of the work are permitted
without any further permission from Dove Medical Press Limited, provided the work is properly
attributed. For permission for commercial use of this work, please see paragraphs 4.2 and 5 of our Terms.
© 2019 The Author(s). This work is published and licensed by Dove Medical Press Limited. The
full terms of this license are available at https://www.dovepress.com/terms
and incorporate the Creative Commons Attribution
- Non Commercial (unported, 3.0) License.
By accessing the work you hereby accept the Terms. Non-commercial uses of the work are permitted
without any further permission from Dove Medical Press Limited, provided the work is properly
attributed. For permission for commercial use of this work, please see paragraphs 4.2 and 5 of our Terms.