Back to Journals » Diabetes, Metabolic Syndrome and Obesity » Volume 16
Study on the Association Between Dietary Quality and Overweight/Obesity of Han Nationality with Cold in Yunnan Plateau by DBI-16 – A Study Based on a Multi-Ethnic Cohort in China
Authors Qian Y, Che Z, Fu C, Chen X, Zeng J, Zhang X, Zeng Y, Yin J ![]()
Received 6 May 2023
Accepted for publication 12 July 2023
Published 3 August 2023 Volume 2023:16 Pages 2311—2327
DOI https://doi.org/10.2147/DMSO.S420260
Checked for plagiarism Yes
Review by Single anonymous peer review
Peer reviewer comments 2
Editor who approved publication: Prof. Dr. Juei-Tang Cheng
Ying Qian,1,* Zhuohang Che,1,* Chuanwen Fu,1,* Xinqiang Chen,1 Jia Zeng,1 Xuehui Zhang,1 Yongli Zeng,2 Jianzhong Yin1,3
1School of Public Health, Kunming Medical University, Kunming, 650500, People’s Republic of China; 2Department of Cardiology, First Affiliated Hospital of Kunming Medical University, Kunming, 650032, People’s Republic of China; 3Baoshan College of Traditional Chinese Medicine, Baoshan, 678000, People’s Republic of China
*These authors contributed equally to this work
Correspondence: Jianzhong Yin, Baoshan College of Traditional Chinese Medicine, Longyang District, Baoshan City, Yunnan Province, 678000, People’s Republic of China, Tel +86 13987645337, Email [email protected] Yongli Zeng, Department of Cardiology, First Affiliated Hospital of Kunming Medical University, Kunming, 650032, People’s Republic of China, Tel +86 13888931757, Email [email protected]
Background: In recent years, with the rapidly development of economic globalization, residents’ dietary structure has undergone major changes, and diet have emerged as an important environmental factors linked to the increased incidence of obesity. Therefore, evaluating the overall dietary quality and structure of residents, further clarifying the main dietary factors that lead to disease occurrence, is of great practical significance for disease prevention and control.
Methods: Baseline data from the China Multi-Ethnic Cohort study (CMEC), Han people living in high-altitude and cold regions of Yunnan Province, which was 1518 participants. In this study, the dietary balance index (DBI-16) was used (i) To evaluate the dietary quality of Han nationality residents 30– 79 years old in the Yunnan plateau; (ii) To analyze the correlation between the dietary quality and overweight/obesity; (iii) And to provide reference basis of nutritional intervention for local residents and explore the main dietary factors affecting their health status.
Results: The dietary structure of the Han nationality residents in the cold regions of Yunnan plateau is unreasonable. Firstly, the intake of cereals, fruits, dairy, eggs and fishes is insufficient to varying degrees, while the intake of beans, poultry, and cooking oil is relatively high. Secondly, the dietary patterns of normal groups, the overweight and obese groups obeyed the A, E, H and I dietary patterns, and the serum Leptin and adipocyte fatty acid binding protein (A-FABP) levels of the overweight and obese group were higher than the normal group between the different dietary patterns (P < 0.05, r > 0). Additionally, excessive dietary intake was positively correlated with a higher serum UCP1 level (P < 0.05, r > 0). In comparison, insufficient dietary intake was positively correlated with a higher serum A-FABP level (P < 0.05, r > 0).
Conclusion: Through the DBI-16, it is found that the dietary structure of the Han nationality residents in the cold regions of Yunnan plateau was in a serious imbalance state, and nutritional guidance and intervention should be further strengthened.
Keywords: plateau Han nationality, dietary balance index-16, dietary quality, dietary evaluation, dietary pattern
Introduction
In recent years, with the development of economic globalization, the dietary structure of residents has undergone major changes, and unhealthy diet has become a serious public health problem worldwide.1 The Global Burden of Metabolic Risk Factors of Chronic Diseases Collaborating Group’s survey shows that diet is the main risk factors leading to human death. The number of deaths caused by diet is as high as 11 million in the world, and poor diet behavior is the main reason for obesity.2 In China, the overweight and obesity rates of adults aged 18 and above are 34.3% and 16.4%, respectively, and the overweight or obesity rates of adults has exceeded half (50.7%). The growth rates of obesity is faster than that of overweight, and the overweight and obesity rates of rural residents is higher than the urban residents, which show that obesity has posed a great threat to national health.3 In the past few decades, China has experienced an accelerated nutritional transformation, characterized by unhealthy changes in dietary patterns and increasing incidence rates of diet-related diseases, and irrational dietary patterns and unbalanced energy intake have led to an increasing number of obese people in China year by year; nearly half of Chinese adults face the dual burden of micronutrient deficiency, overweight and obesity.4–6 In addition, there are regional differences in food intake. People in different regions have different dietary behaviors and dietary structures, which have different impacts on human health. The results of an early “China obesity index” phase study conducted by Peking University showed that the obesity rates in northern China was 35%, while that in southern China was 27%. The reason may be related to the differences in diet caused by northern and southern regions. The residents in the south take rice as staple foods, with more poultry, fishes, fresh vegetables and fruits, while the people in the north mainly take pasta, with less fresh vegetables and fruits; meanwhile, the northern “heavy taste” high-salt diet can also lead to obesity, while the southern diet is relatively light.7
To solve the health problems caused by diet, according to the dietary habits and scientific research of Chinese residents, two dietary quality indexes were designed: “China Dietary Quality Index (DQI)”8 and “China Dietary Balance Index (DBI)”. These two indicators are designed to assess the situation of under-nutrition and over-nutrition, which are important risk factors for the rise of non-communicable diseases (NCDs) in China’s population undergoing rapid economic change.9 However, physical and physiological indicators of high-altitude populations also undergo significant changes due to unique geographical environments and dietary habits. So, is the occurrence of obesity in high-altitude populations related to changes in their dietary structure? And does the change in dietary structure affect the changes in its physical and physiological indicators? Are the changes in adipokines, such as Leptin, Visfatin and adipocyte fatty acid binding protein (A-FABP), as classic factors of obesity, related to changes in dietary structure? Currently, no relevant reports exist on the Yunnan Plateau.
Materials and Methods
Study Design
NCDs have become one of the leading causes of death for the world’s population, and ethnicity is increasingly recognized as an important risk factor for NCDs worldwide. China has the largest ethnic minority population in the world (about 125 million out of 55 ethnic groups10). The China Multi-ethnic cohort (CMEC) was launched in 2017 to investigate the ethnic differences of NCDs in southwest China and obtain data on the prevalence of NCDs, risk factors and related diseases of different ethnic groups. Established in five provinces in southwest China (Yunnan, Sichuan, Guizhou, Chongqing and Tibet), the cohort was designed to include 100,000 middle-aged people (including Han, Tibetan, Yi, Miao, Bai, Buyei, and Dong).11 The data source of this study is based on CMEC baseline survey, and the cohort project site was selected at the Han population in the cold plateau area of Yongsheng County, Lijiang City, Yunnan Province.
Study Participants
Based on the CMEC baseline survey of “Cohort Study of Natural Populations Living on the Plateau in high-altitude Areas of Southwest China”, we selected the Han nationality population whose cohort project site is located in high-altitude and cold regions of Yunnan Province, China, 10538 as the research objects. Based on a previously established case–control study including 475 obese individuals and an equal number of control, 284 overweight individuals and an equal number of control, excluding those who had refuse or incomplete dietary questionnaires and implausible or missing dietary intake data, we ultimately included 308 obese individuals and an equal number of control, 186 overweight individuals and an equal number of control in case–control study (Figure 1), and to preliminarily explore the main dietary factors affecting their health status. Based on BMI (body mass index), this study classifies overweight and obesity according to Chinese obesity standards (Normal: 18.5 ≤ BMI < 24kg/m2; Overweight: 24.0 ≤ BMI < 28.0kg/m2; Obesity: BMI ≥ 28kg/m2).12 And all the subjects were fully aware of the purpose and procedure of the study, which signed a written informed consent before being included in the study. Human Leptin Enzyme-Linked Immunosorbent Assay (ELISA) Kit, Human A-FABP ELISA Kit, and Human Visfatin ELISA Kit were obtained from Elabscience Biotechnology Co.,Ltd (Wuhan, China).
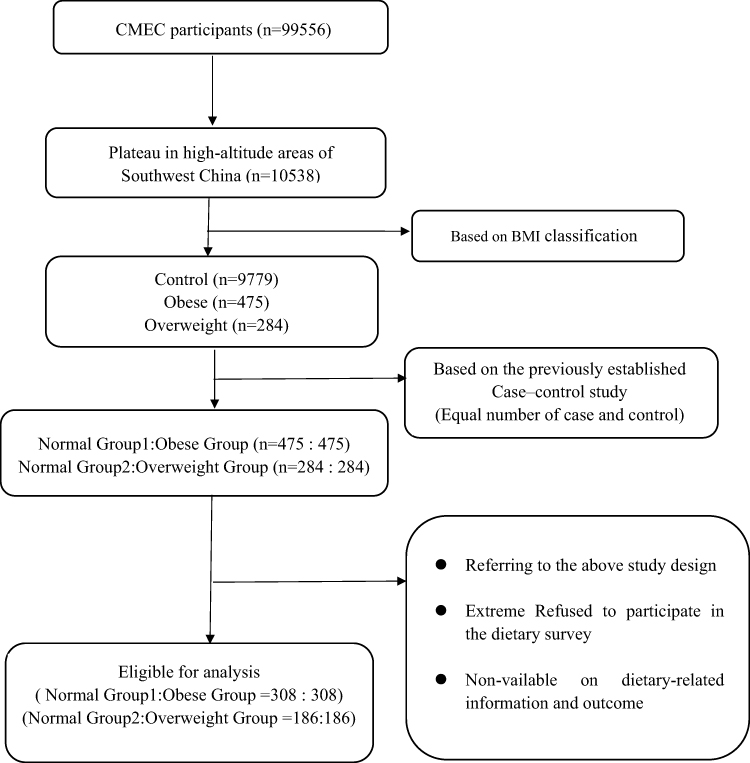 |
Figure 1 Flowchart of paticipants recruitments and study inclusion. |
Dietary Data Collection and Calculation
Dietary Balance Index (DBI-16)
Dietary score indexes of DBI-16 mainly include total score (TS), high bound score (HBS), low bound score (LBS) and diet quality distance (DQD). Among them, HBS is the absolute value of the sum of the positive fractions of all indicators, mainly reflecting the degree of excessive dietary intake; LBS is the absolute value of the sum of negative scores of all indicators, which mainly reflects the degree of insufficient dietary intake; DQD is to add the absolute value of each index scores to comprehensively reflect a specific dietary problem; and TS is to accumulate the scores of all indicators to reflect the average level of overall dietary quality.
The calculation method is as follows: (i) According to the requirements of DBI-16 dietary quality evaluation, the daily average intake of various foods and nutrients of the respondents were sorted and calculated; (ii) To assign and calculate the energy intake of each type of food according to the DBI-16 scoring standard; (iii) To calculate the scores of the DBI-16 dietary evaluation indicators HBS, LBS, TS and DQD of the respondents, and further analyze and evaluate the dietary quality.
DBI-16 Dietary Pattern
DBI-16 dietary pattern divides DBI-LBS into three levels: below 20 points, 20–40 points and above 40 points; DBI-HBS is also divided into three levels: below 10 points, 10–20 points and above 20 points; then the above DBI-LBS and DBI-HBS were combined at different score levels, and 9 dietary patterns were established, including A, B, C, D, E, F, G, H and I (Table 1). Among the nine dietary patterns, pattern A generally has a small difference from the ideal diet, while pattern F, H, and I generally have a significant difference from the ideal diet. Therefore, it is necessary to combine the scores of various DBI indicators to determine the types of food with insufficient and excessive intake issues.
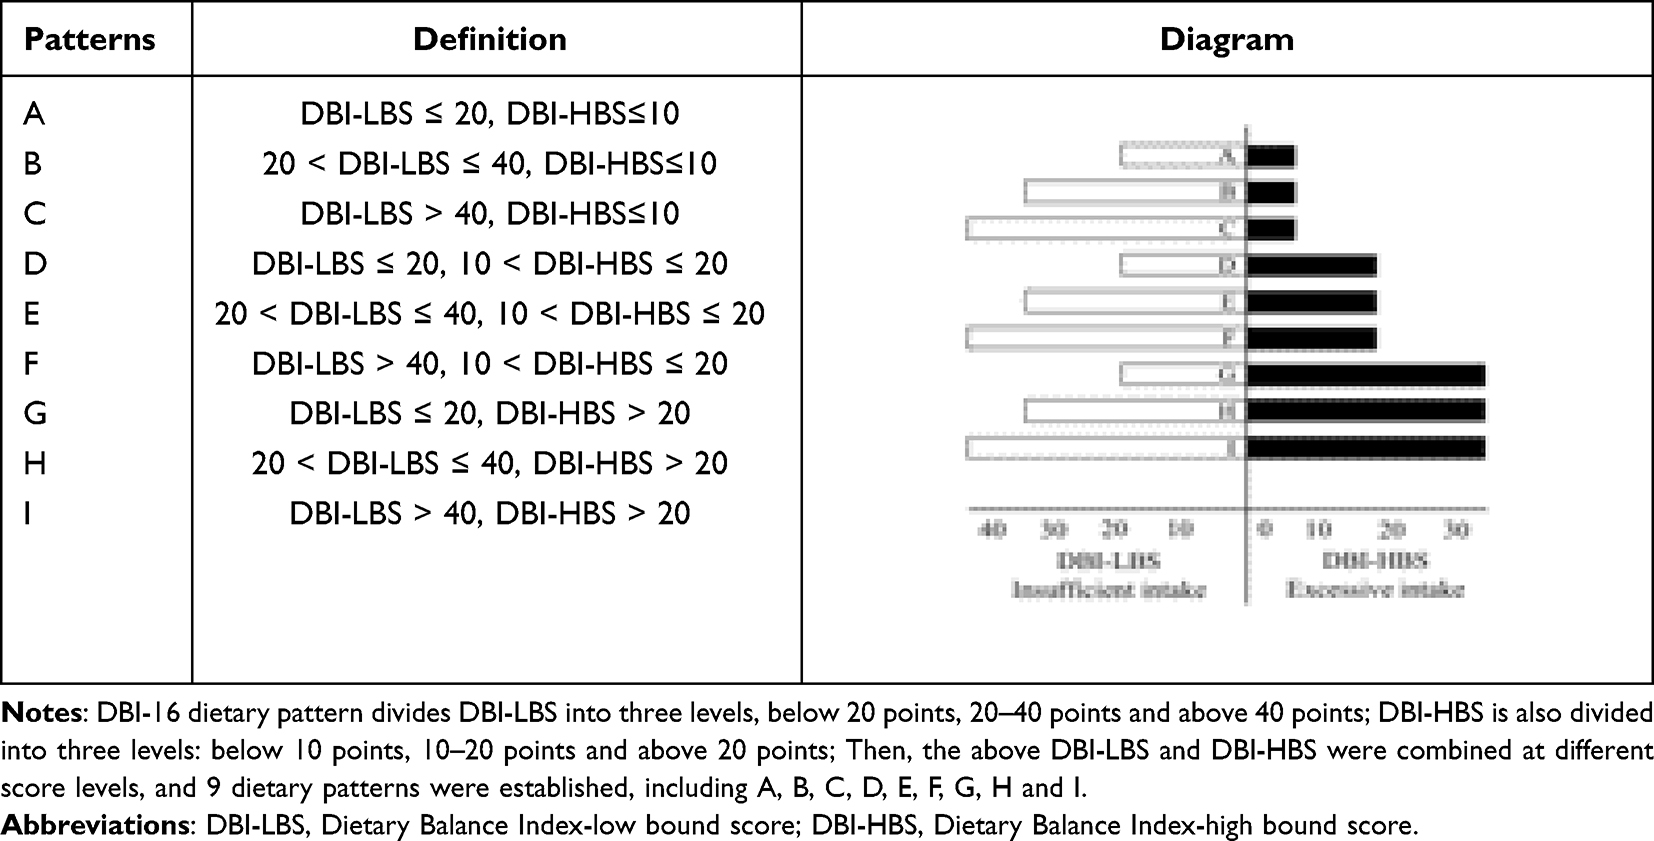 |
Table 1 Dietary Patterns of DBI-16 |
Statistical Analysis
Continuous variables were expressed as mean ± standard deviation if normally distributed; otherwise, were expressed as median and interquartile range, while categorical variables were expressed as frequency (n) and percentage (%). The Kolmogorov–Smirnov test was used to determine whether data were normally distributed. The significance of difference was determined by t-test, Mann–Whitney U-test, Kruskal–Wallis H-test for continuous variables, and by Chi-square test for categorical variables. Spearman correlation (for non-normally distributed data) or Pearson correlation (for normally distributed data) analysis was used to examine the relation with dietary DBI score with serum adipokine and blood indicators.
All reported P values were 2-tailed and α level of 0.05 or less was considered statistically significant. Statistical analyses were performed as indicated using IBM SPSS 26.0 statistical software (SPSS Inc., Chicago, USA).
Results
Basic Demographic Characteristics of Each Group
As shown in Table 2, this study investigated 616 people in obese group and normal group 1, and 372 people in overweight group and normal group 2. Among them, the obese group and normal group 1 include 194 males (31.5%) and 422 females (68.5%). The proportion of obese females 211 (68.5%) was higher than males 97 (31.5%); the average age of normal group 1 was 51.58 ± 8.89 and the obese group was 52.32 ± 9.31; the subjects are mostly elementary school 247 (40.1%) and illiterate 173 (28.1%). There were 186 subjects in normal group 2 and 186 subjects in overweight group, respectively; 134 males (36.0%) and 238 females (64.0%). The proportion of overweight females 119 (64.0%) is higher than males 67 (36.0%); the average age of normal group 2 was 51.89 ± 9.09 and the overweight group was 51.29 ± 9.08; the subjects are mainly elementary school 132 (35.5%) and illiterate 98 (26.3%). Compared with the normal group 1, the WBC, RBC, HCT, MCV, HGB, HR, Leptin and A-FABP levels in the obese group showed statistically significant differences (P < 0.05). Statistically significant differences were also observed in the levels of WBC, Leptin and A-FABP in the normal group 2 and overweight group showed statistically significant differences (P < 0.05).
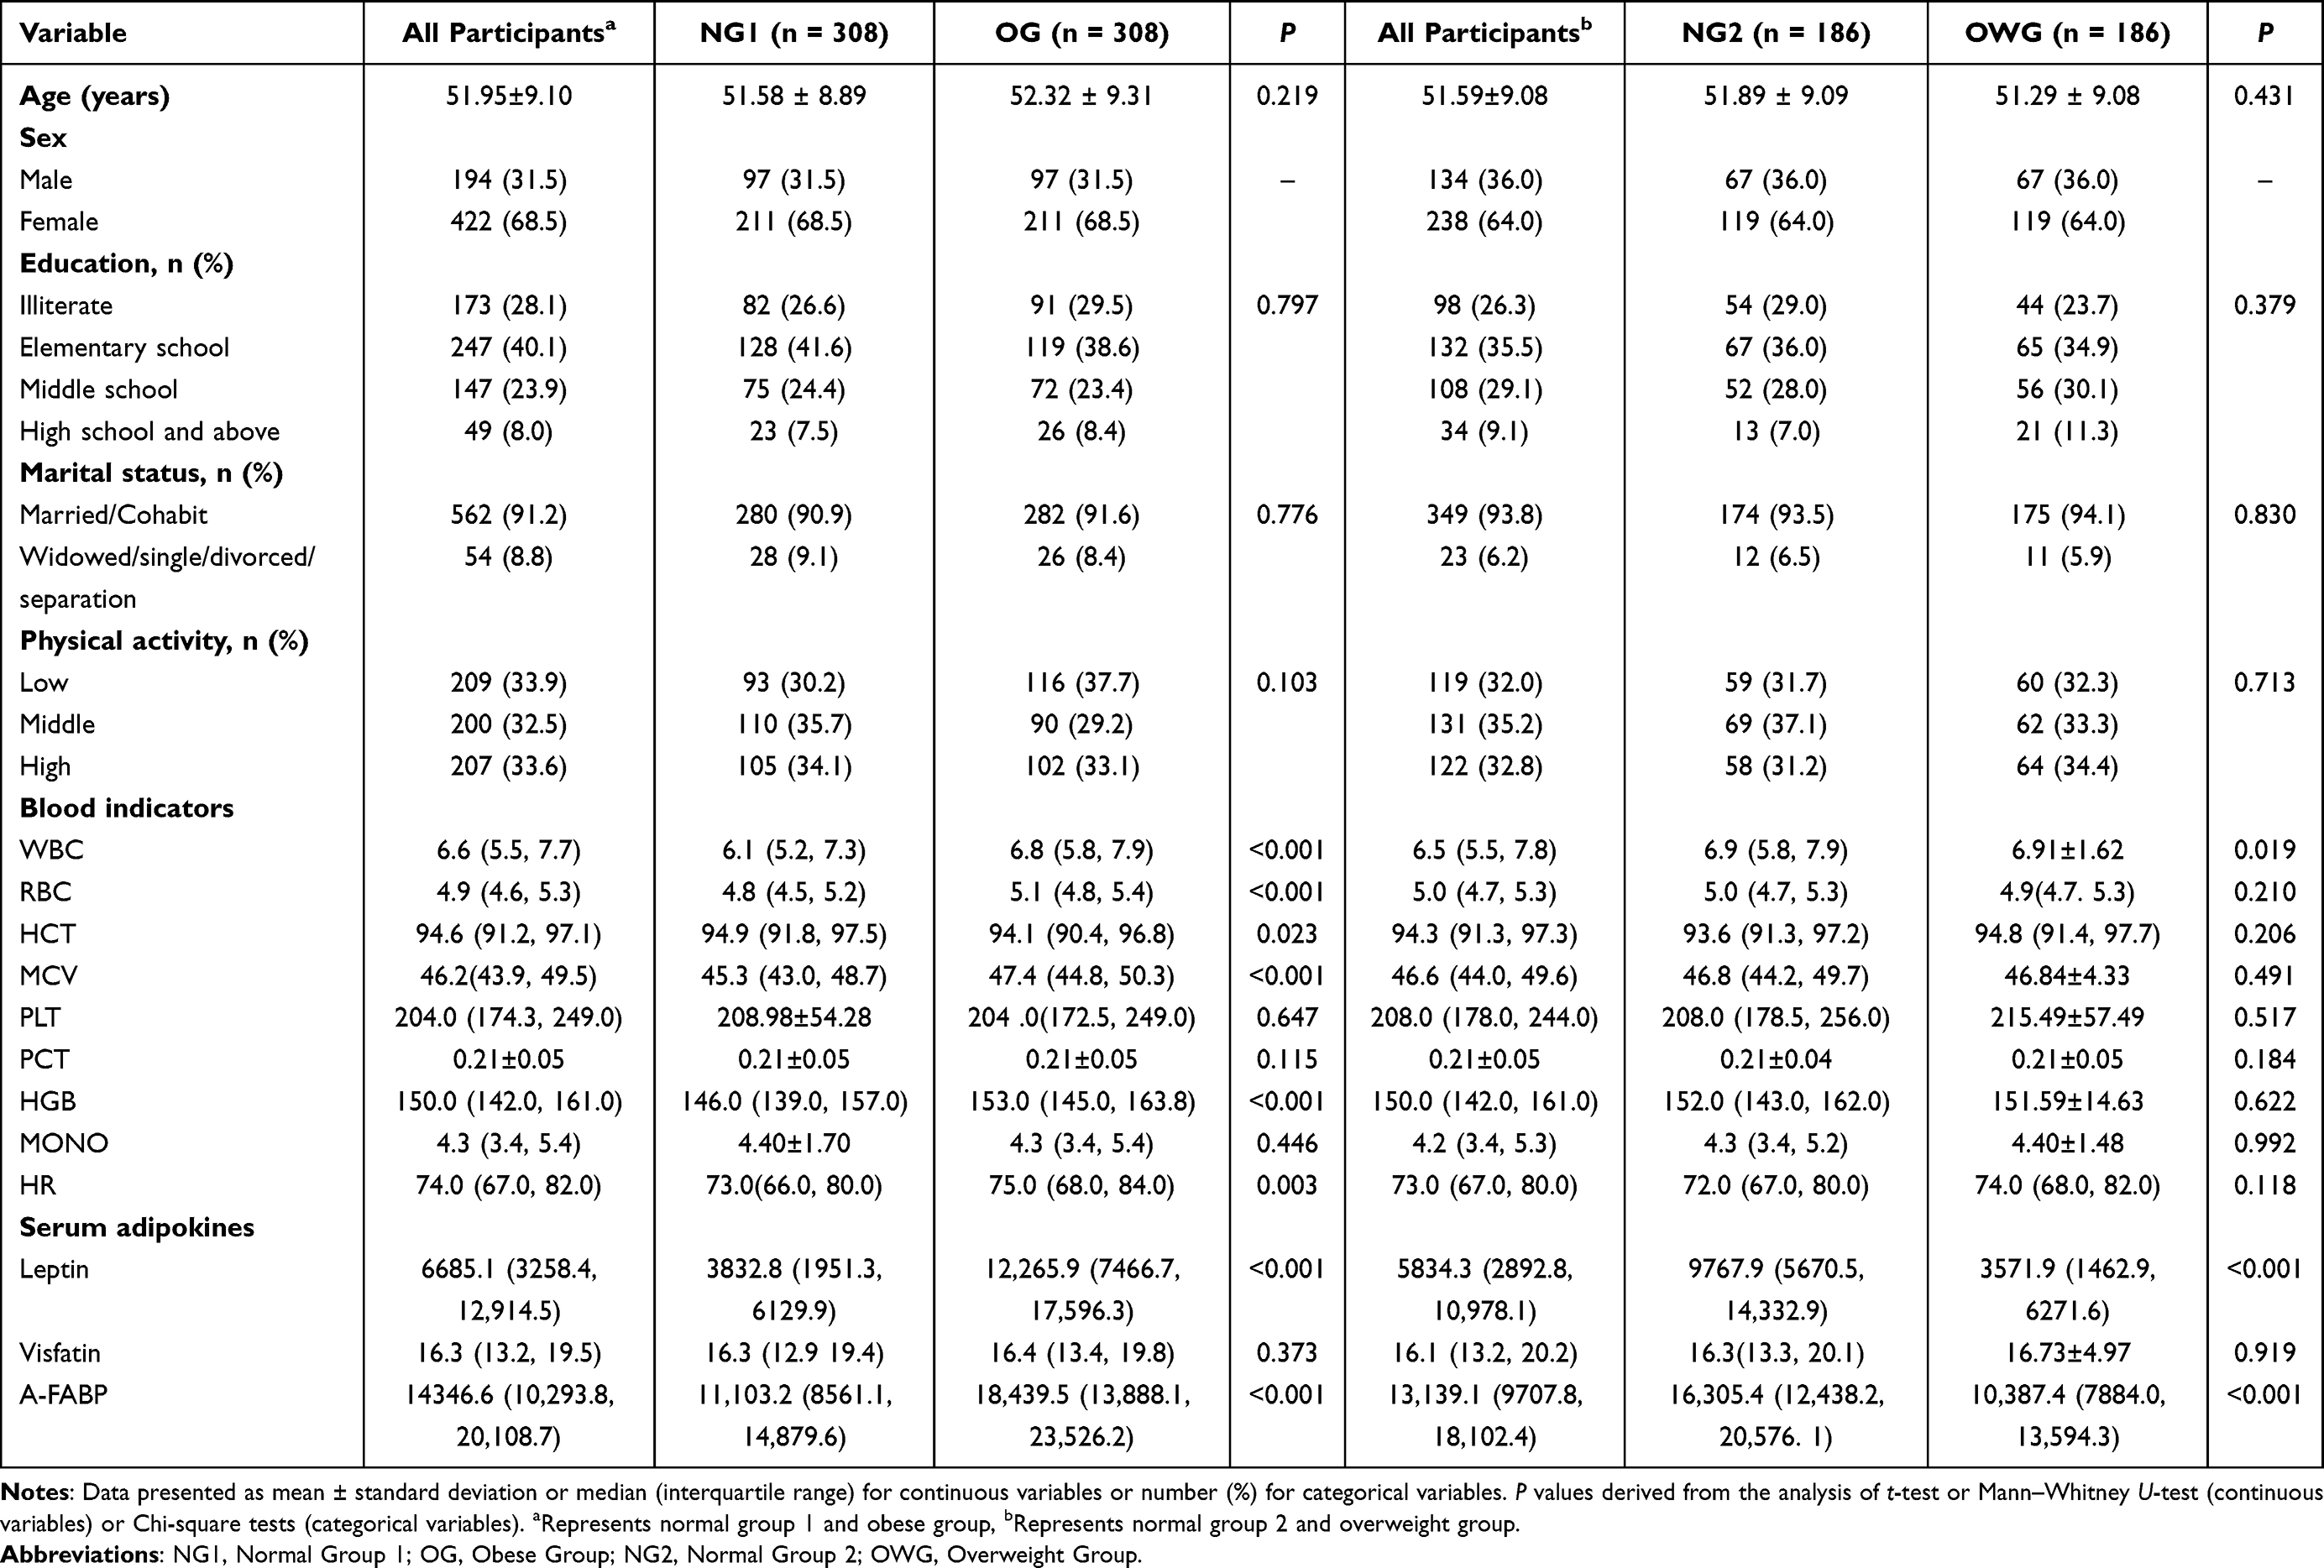 |
Table 2 Basic Demographic Characteristics of the Normal Group 1 and the Obese Group; Normal Group 2 and the Overweight Group [n (%)] |
DBI-16 Component Score and the Percentage of Participants with Each Score
Table 3 shows the average scores of cereal, vegetables, and fruits for obese residents were −4, −2, and −2, respectively. The proportion of people who reached or exceeded the recommended intake was 71.43%, 61.36%, and 67.21%, respectively; the average score for dairy products is −5, indicating a serious underintake of dairy products; the average score of beans is 0, with 89.29% of people reaching or exceeding the recommended quantity; the average score of poultry is 1, with 63.31% of people reaching or exceeding the recommended quantity; the average score of fishes is −3, and the number of people below the recommended quantity level is as high as 90.58%; the average score of eggs is −1, and only 33.12% of the population basically reaches the recommended intake, while the highest number does not reach the recommended intake; the average scores for cooking oil, alcoholic beverage, addible sugar, and salt were 4, 0, 0, and 1, respectively, all reaching or exceeding the recommended intake; the average score for food types is −1, and 99.68% of the population has a score higher than −6 (eating more than 6 types of food per day).
 |
Table 3 The DBI-16 Component Score and the Percentage of Participants with Each Score [n (%)] |
The average scores of cereals, vegetables, and fruits for overweight residents are −5, −2, and −3, respectively. The number of people who are lower than the recommended intake is as high as 21.51%, 38.17%, and 26.88%, respectively; the average scores for dairy is −5, indicating a serious underintake of dairy; the average scores of beans is 0, with 86.56% of people reaching or exceeding the recommended quantity; the average score of poultry is 1, with 63.44% of people reaching or exceeding the recommended quantity; the average scores of fish is −3, reaching 89.78%, which is lower than the recommended quantity level; the average egg scores is −2, with only 24.19% of people reaching the recommended intake, and 75.81% of people not reaching the recommended intake; the average scores for cooking oil, alcoholic beverage, addible sugar, and salt were 3, 1, 0, and −2, respectively, all reaching or exceeding the recommended intake; the average scores of food types is −1, and 93.01% of people have a score higher than −6 (eating more than 6 types of food per day).
The Dietary Quality of Each Group Was Unbalanced
Table 4 shows the median scores for LBS, HBS and DQD by sociodemographic characteristics of the participants. Based on the evaluation of HBS score, the dietary intake of the residents in normal group 1 and obese group mainly concentrated on the more appropriate intake (44.5%, 47.4%), and the low-degree intake (37.7%, 36.7%); the distribution of excessive dietary intake in normal group 2 and overweight group is similar to normal group 1 and obese group. Based on the LBS score evaluation, the dietary intake of residents in normal group 1 and obese group were mainly concentrated in relatively appropriate intake (13.6%, 19.5%), low intake (58.4%, 54.9%), and dietary patterns rates intake (17.9%, 16.6%); the distribution of insufficient dietary intake of normal group 2 and overweight group is similar to normal group 1 and obese group. Based on the evaluation of DQD score, the dietary quality of residents in normal group 1 and obese group mainly concentrated on low imbalance intake (66.9%, 67.2%) and dietary patterns rate imbalance intake (26.9%, 26.6%). The dietary quality of normal group 2 and overweight group also mainly concentrated in low imbalance intake (65.6%, 58.1%) and dietary moderate imbalance intake (28.0%, 33.9%).
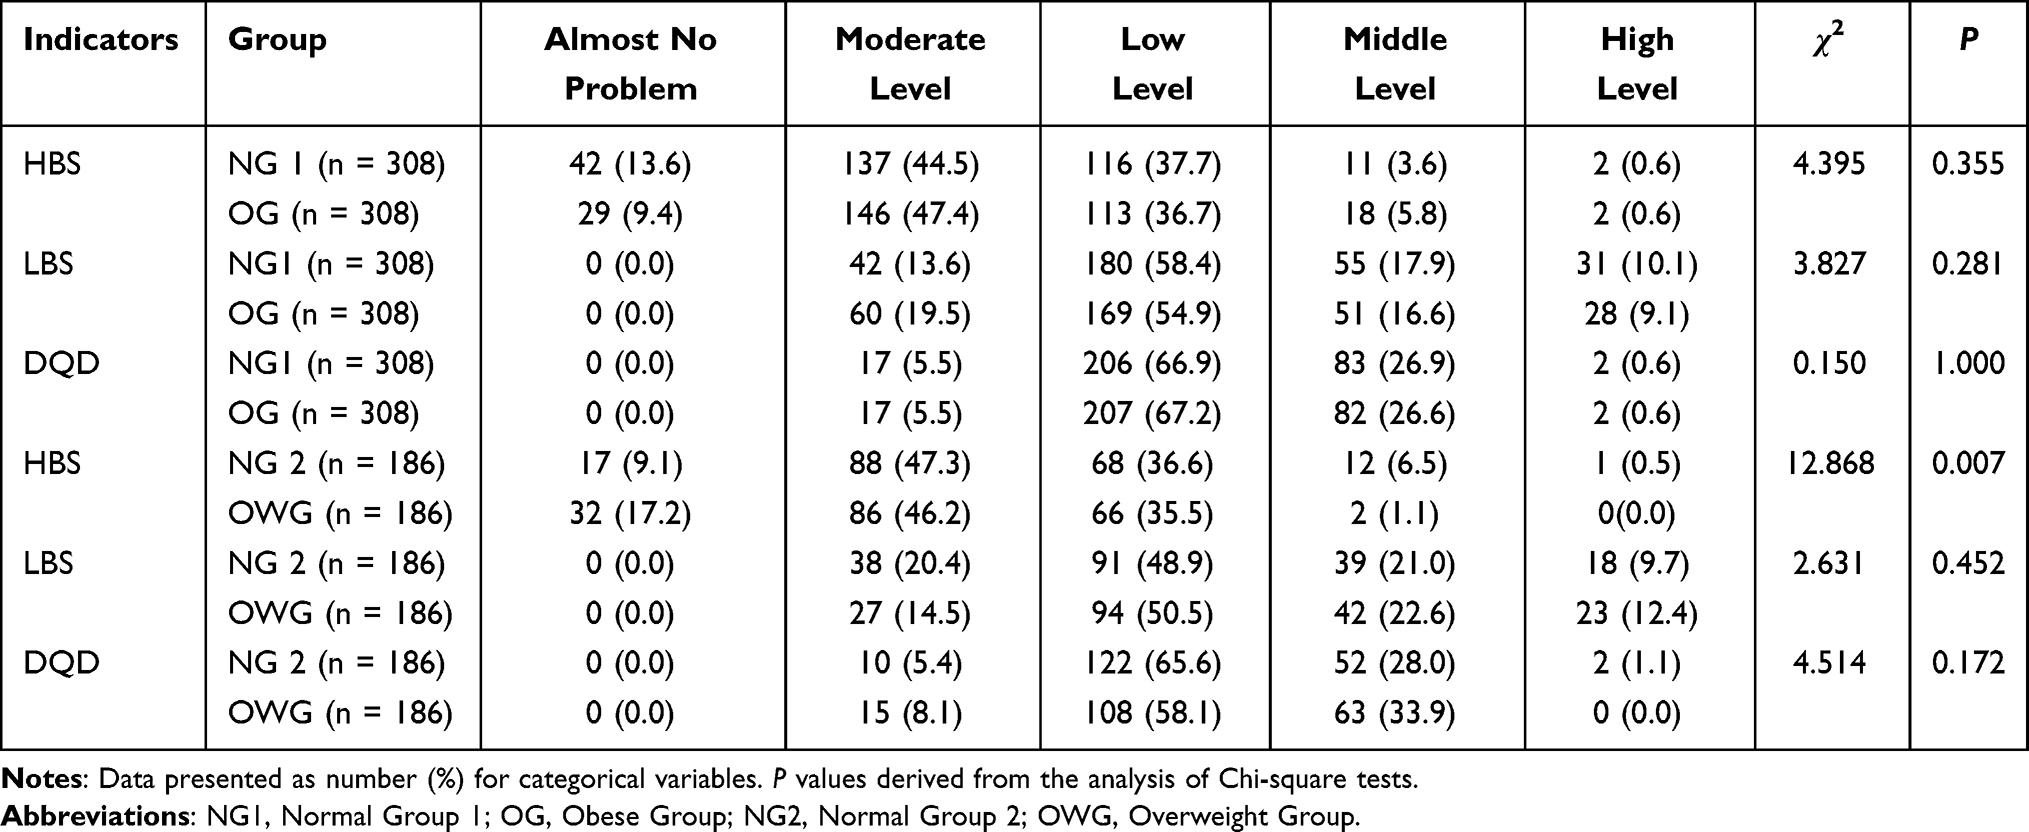 |
Table 4 The Distribution of DBI Indicators Among Participants [n (%)] |
Comparison of Energy and Macro-Nutrient Intakes Among Groups
Table 5 demonstrates the comparison of dietary indicators among groups. From the comparative analysis of energy intake level, the energy intake level of overweight group was higher than normal group 2 (P < 0.05); from the comparative analysis of macro-nutrient level, the carbohydrate intake of obese group was higher than normal group 1 (P < 0.01); the total energy, carbohydrate, protein and fat intake of overweight group were higher than normal group 2 (P < 0.05); from the intake levels of various types of food, the intake of cooking oil by obese group was higher than that of normal group 1 (P < 0.05) and the intake of dairy by overweight was lower than that of normal group 2 (P < 0.05), but there was no statistically significant difference was observed in other food intake between groups; from the comparison of different index scores of DBI-16, there was no statistical difference (P > 0.05) in the DBI-16 indicators of LBS, HBS, TS, and DQD between normal group 1 and obese group, indicating that there was no difference in the degree of excessive dietary intake, insufficient dietary intake, dietary quality, or dietary balance between the two groups. However, it can be seen that there is a statistical difference in the DBI-16 indicators of HBS and TS between normal group 2 and overweight group (P < 0.05), indicating the differences in excessive dietary intake and dietary quality varied between the two groups (P < 0.05).
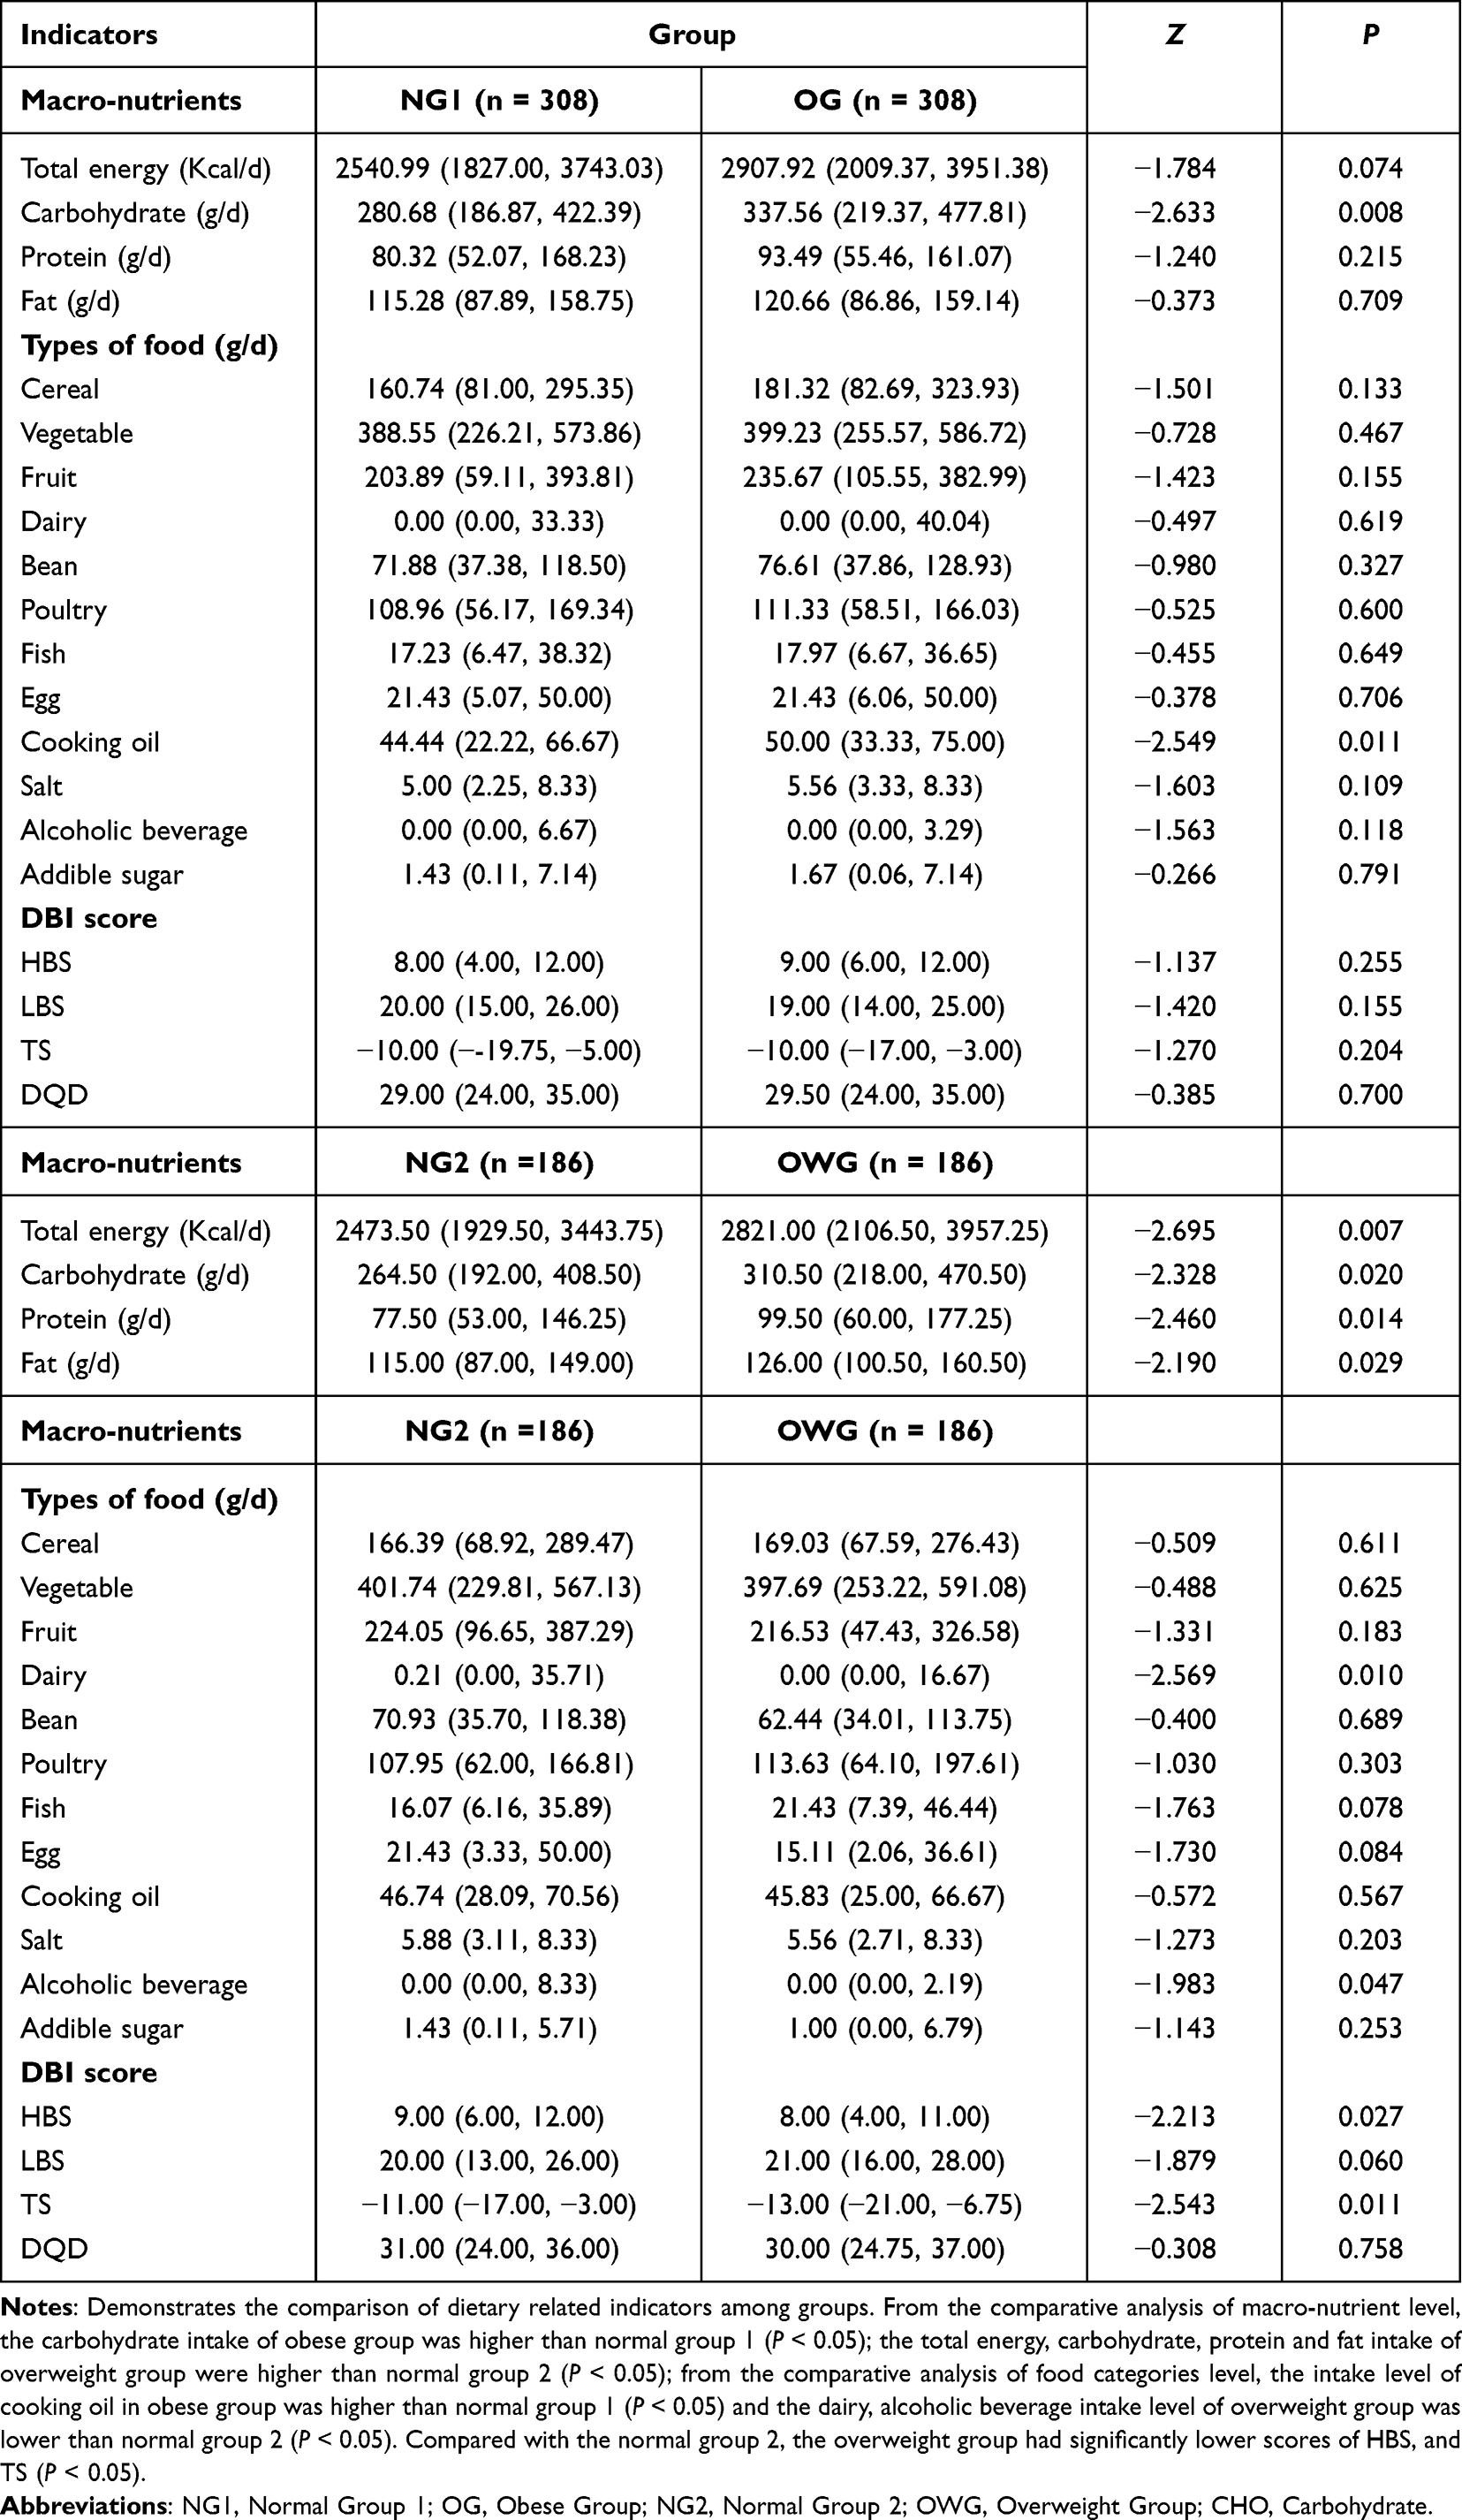 |
Table 5 Comparison of Dietary Related Indicators Between Groups |
Comparison of Serum Adipokines and UCP1 Levels Among Groups Under Different Dietary Patterns
Table 6 shows the comparison of Serum adipokines and UCP1 levels among groups under different dietary patterns. Under the conditions of A, E, H and I dietary patterns, the serum Leptin and A-FABP levels of the obese group was higher than normal group 1 (P < 0.001), but there was no statistical difference in serum Visfatin and UCP1 levels between the obese group and normal group 1 (P > 0.05). However, the trend of the obese group being higher than the normal group 1 can be seen, to some extent. Similarly, the serum Leptin and A-FABP levels of the overweight group were all higher than those of the normal group 2 (P < 0.05), but the serum UCP1 level was higher than normal group 2 only in dietary patterns A and H (P < 0.05) and the trend that the serum UCP1 level of the overweight group was higher than that of the normal group 2 can be observed in dietary patterns E and I (P > 0.05). Furthermore, there were no observed correlations between other dietary patterns and serum Visfatin (P > 0.05).
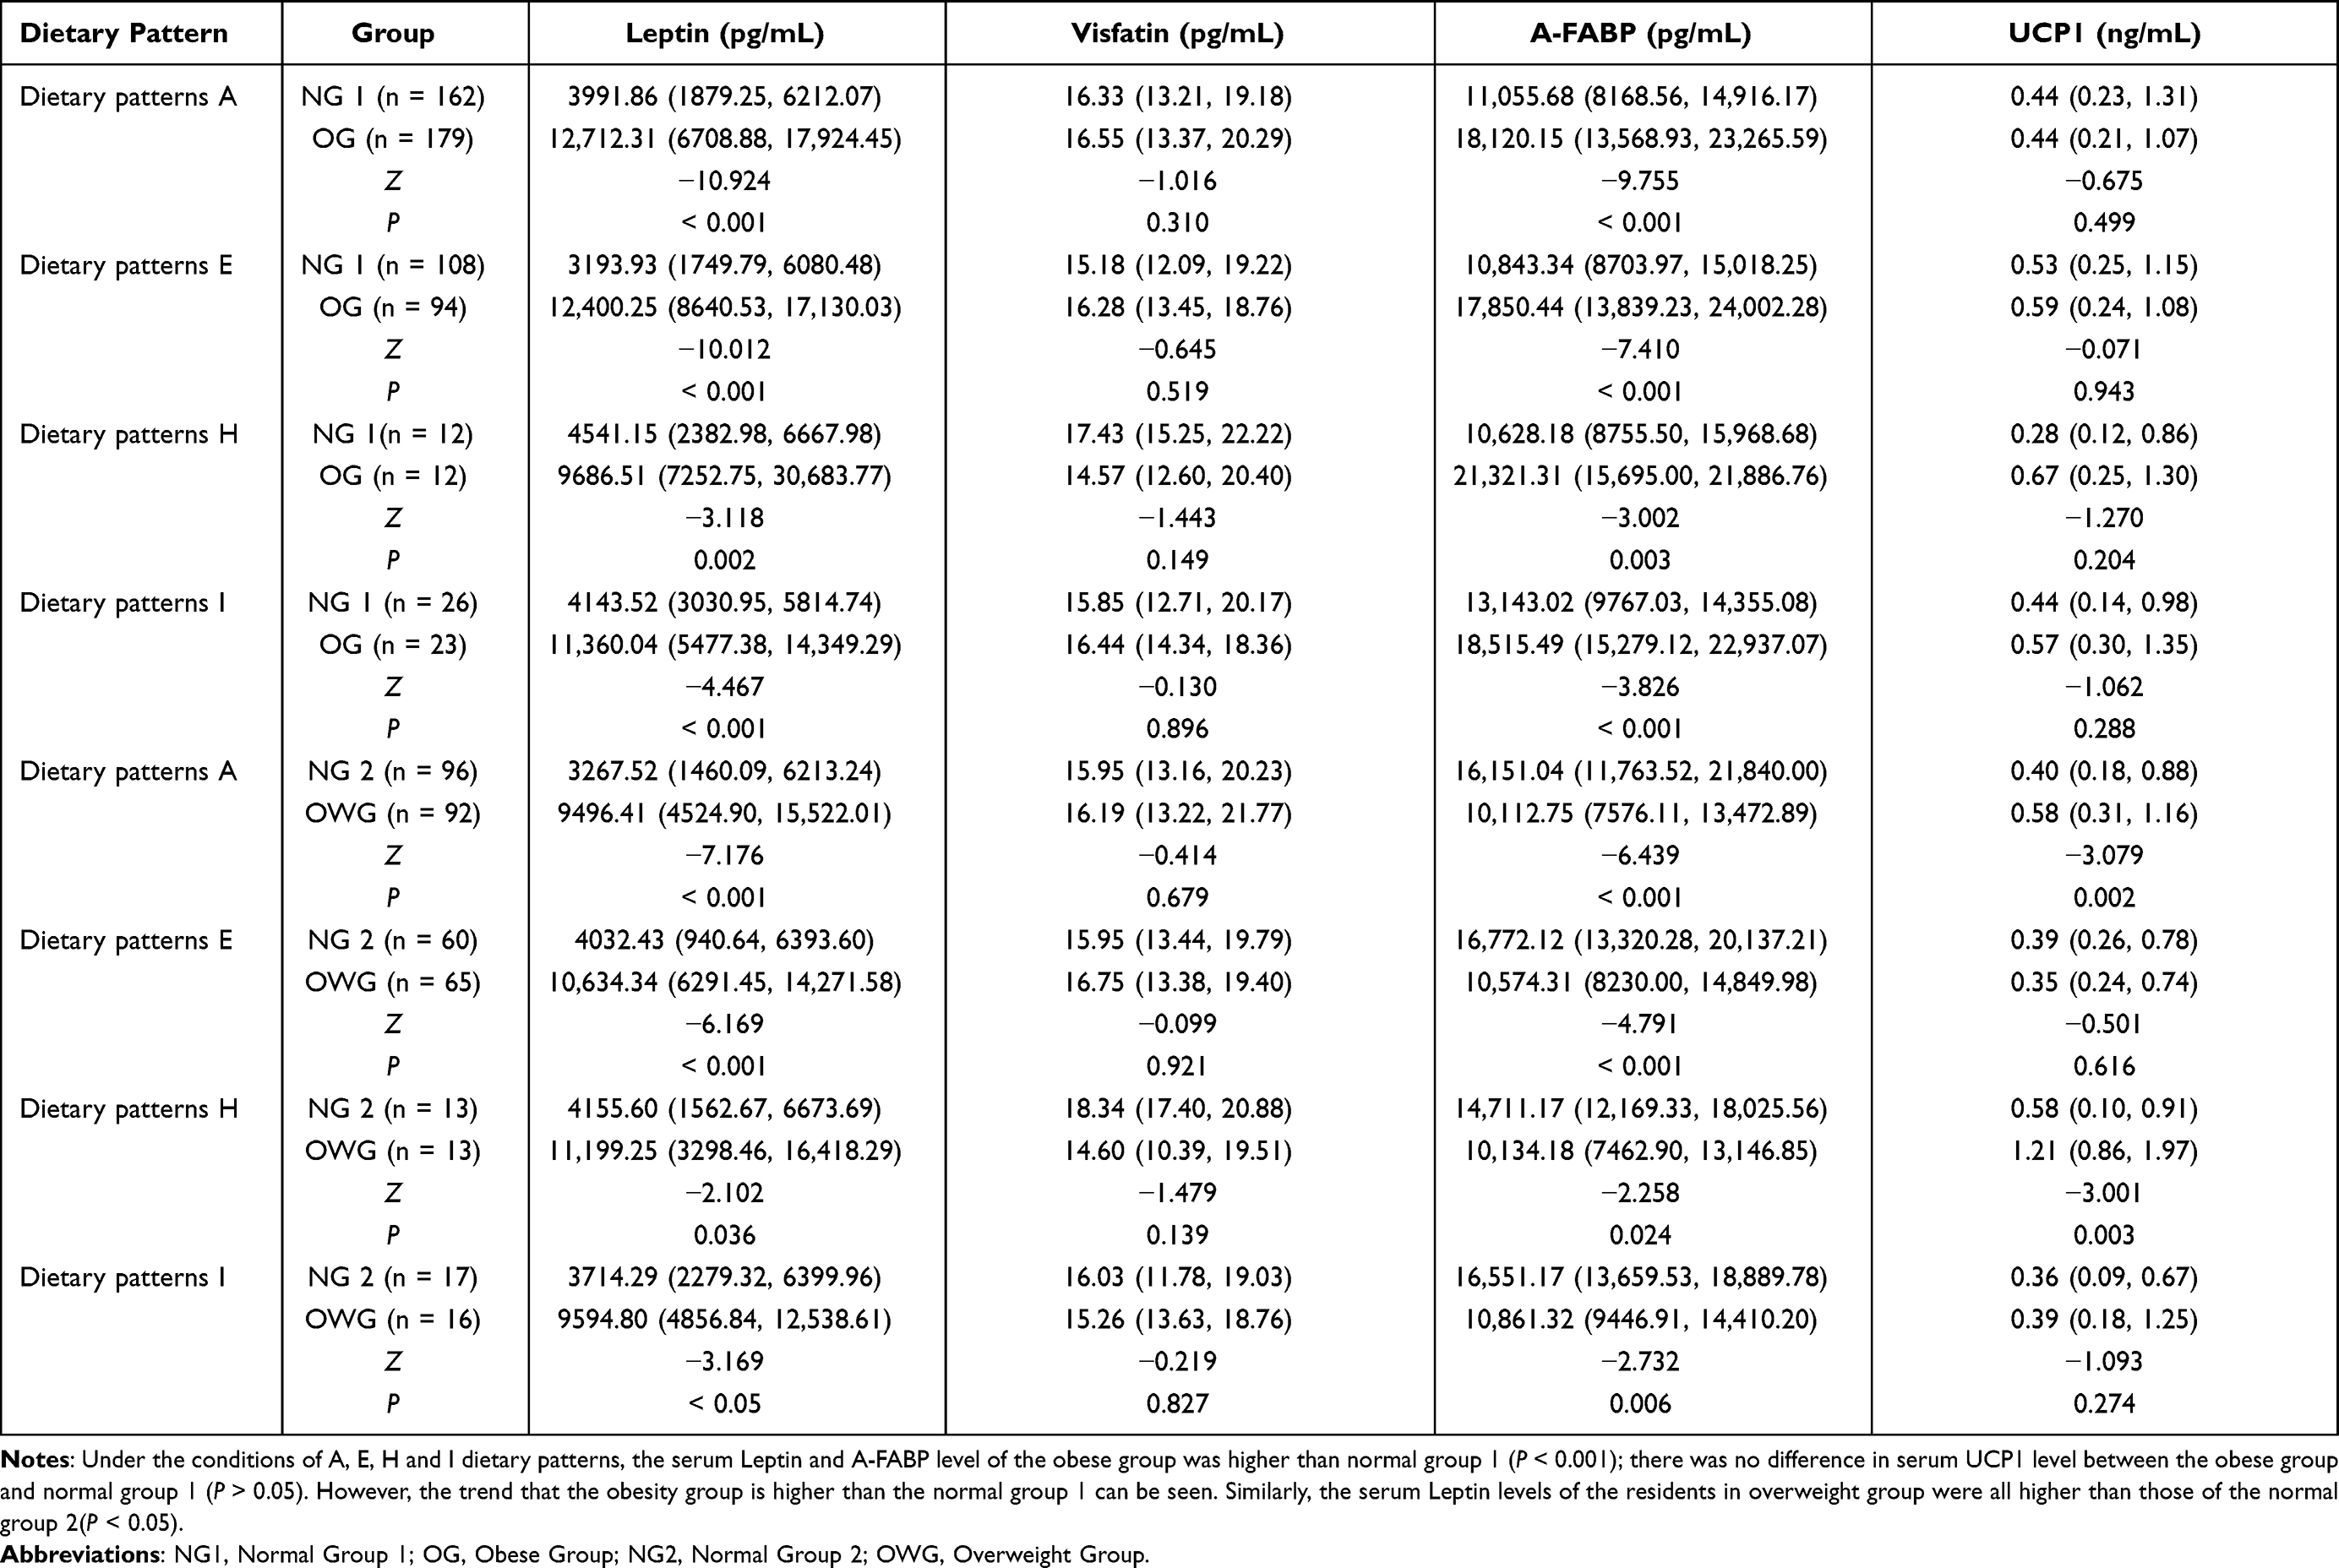 |
Table 6 Comparison of Serum Adipokines and UCP1 Levels Among Groups Under Different Dietary Patterns |
Correlation Analysis Between DBI Score and Serum Adipokines and UCP1 Among Groups
Table 7 shows the correlation analysis between DBI score and Serum adipokines and UCP1 among groups. In normal group 1 and obese group, normal group 2 and overweight group, only the dietary HBS score of overweight group was positively correlated with serum UCP1 level (P < 0.05, r > 0), and no correlation with serum Leptin, Visfatin, A-FABP, UCP1 levels (P > 0.05, r = 0).
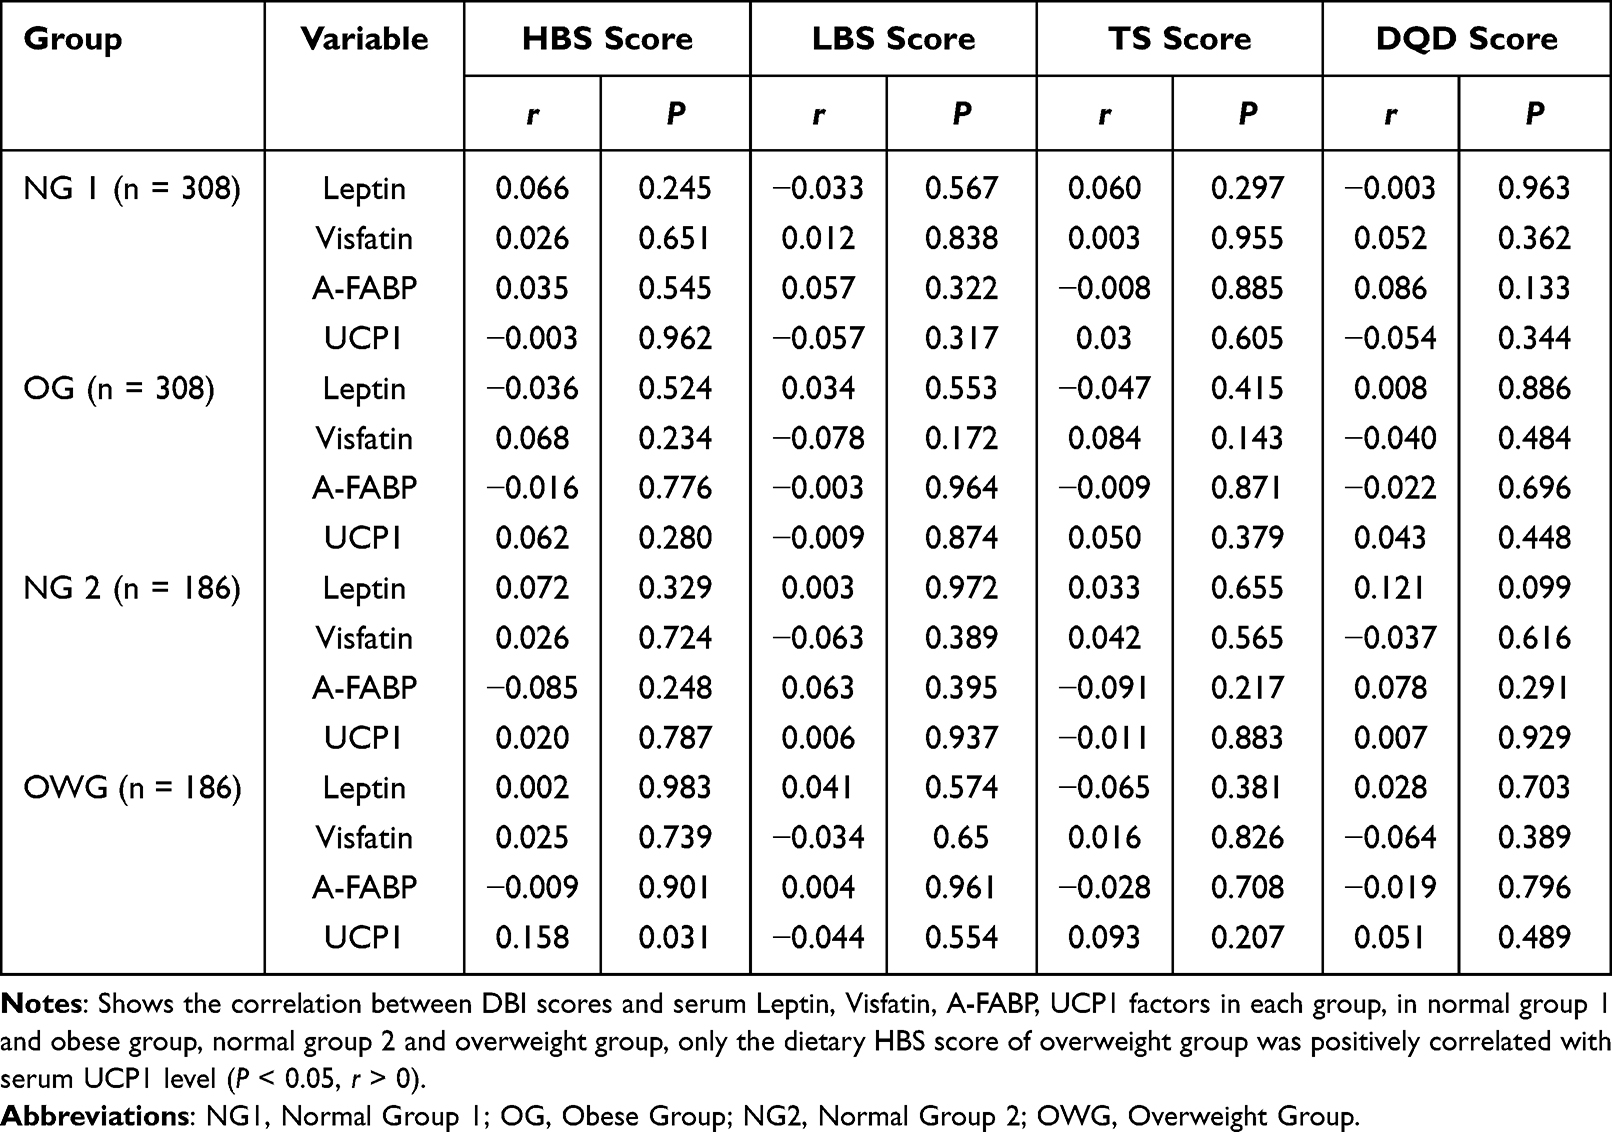 |
Table 7 Correlation Study Between DBI Score and Serum Leptin, Visfatin, A-FABP and UCP1 Factors in Each Group |
Correlation Study Between DBI Score and Blood Indicators Factors Among Groups
Table 8 demonstrates the correlation between DBI score and blood indicator factors in each group. In normal group 1 and obesity group, the dietary LBS score of obese group was positively correlated with blood PLT (P < 0.05, r > 0), PCT (P < 0.05, r > 0) and MONO (P < 0.05, r > 0) level; the dietary DQD score of obese group was positively correlated with blood PCT (P < 0.05, r > 0) and MONO (P < 0.05, r > 0) level. In normal group 2 and overweight group, the dietary DQD score of normal group 2 was positively correlated with blood WBC level (P < 0.05, r < 0); the dietary DQD score of overweight group was positively correlated with HR (P < 0.05, r > 0) level. However, no significant correlations were found for any blood indicators related to DBI score.
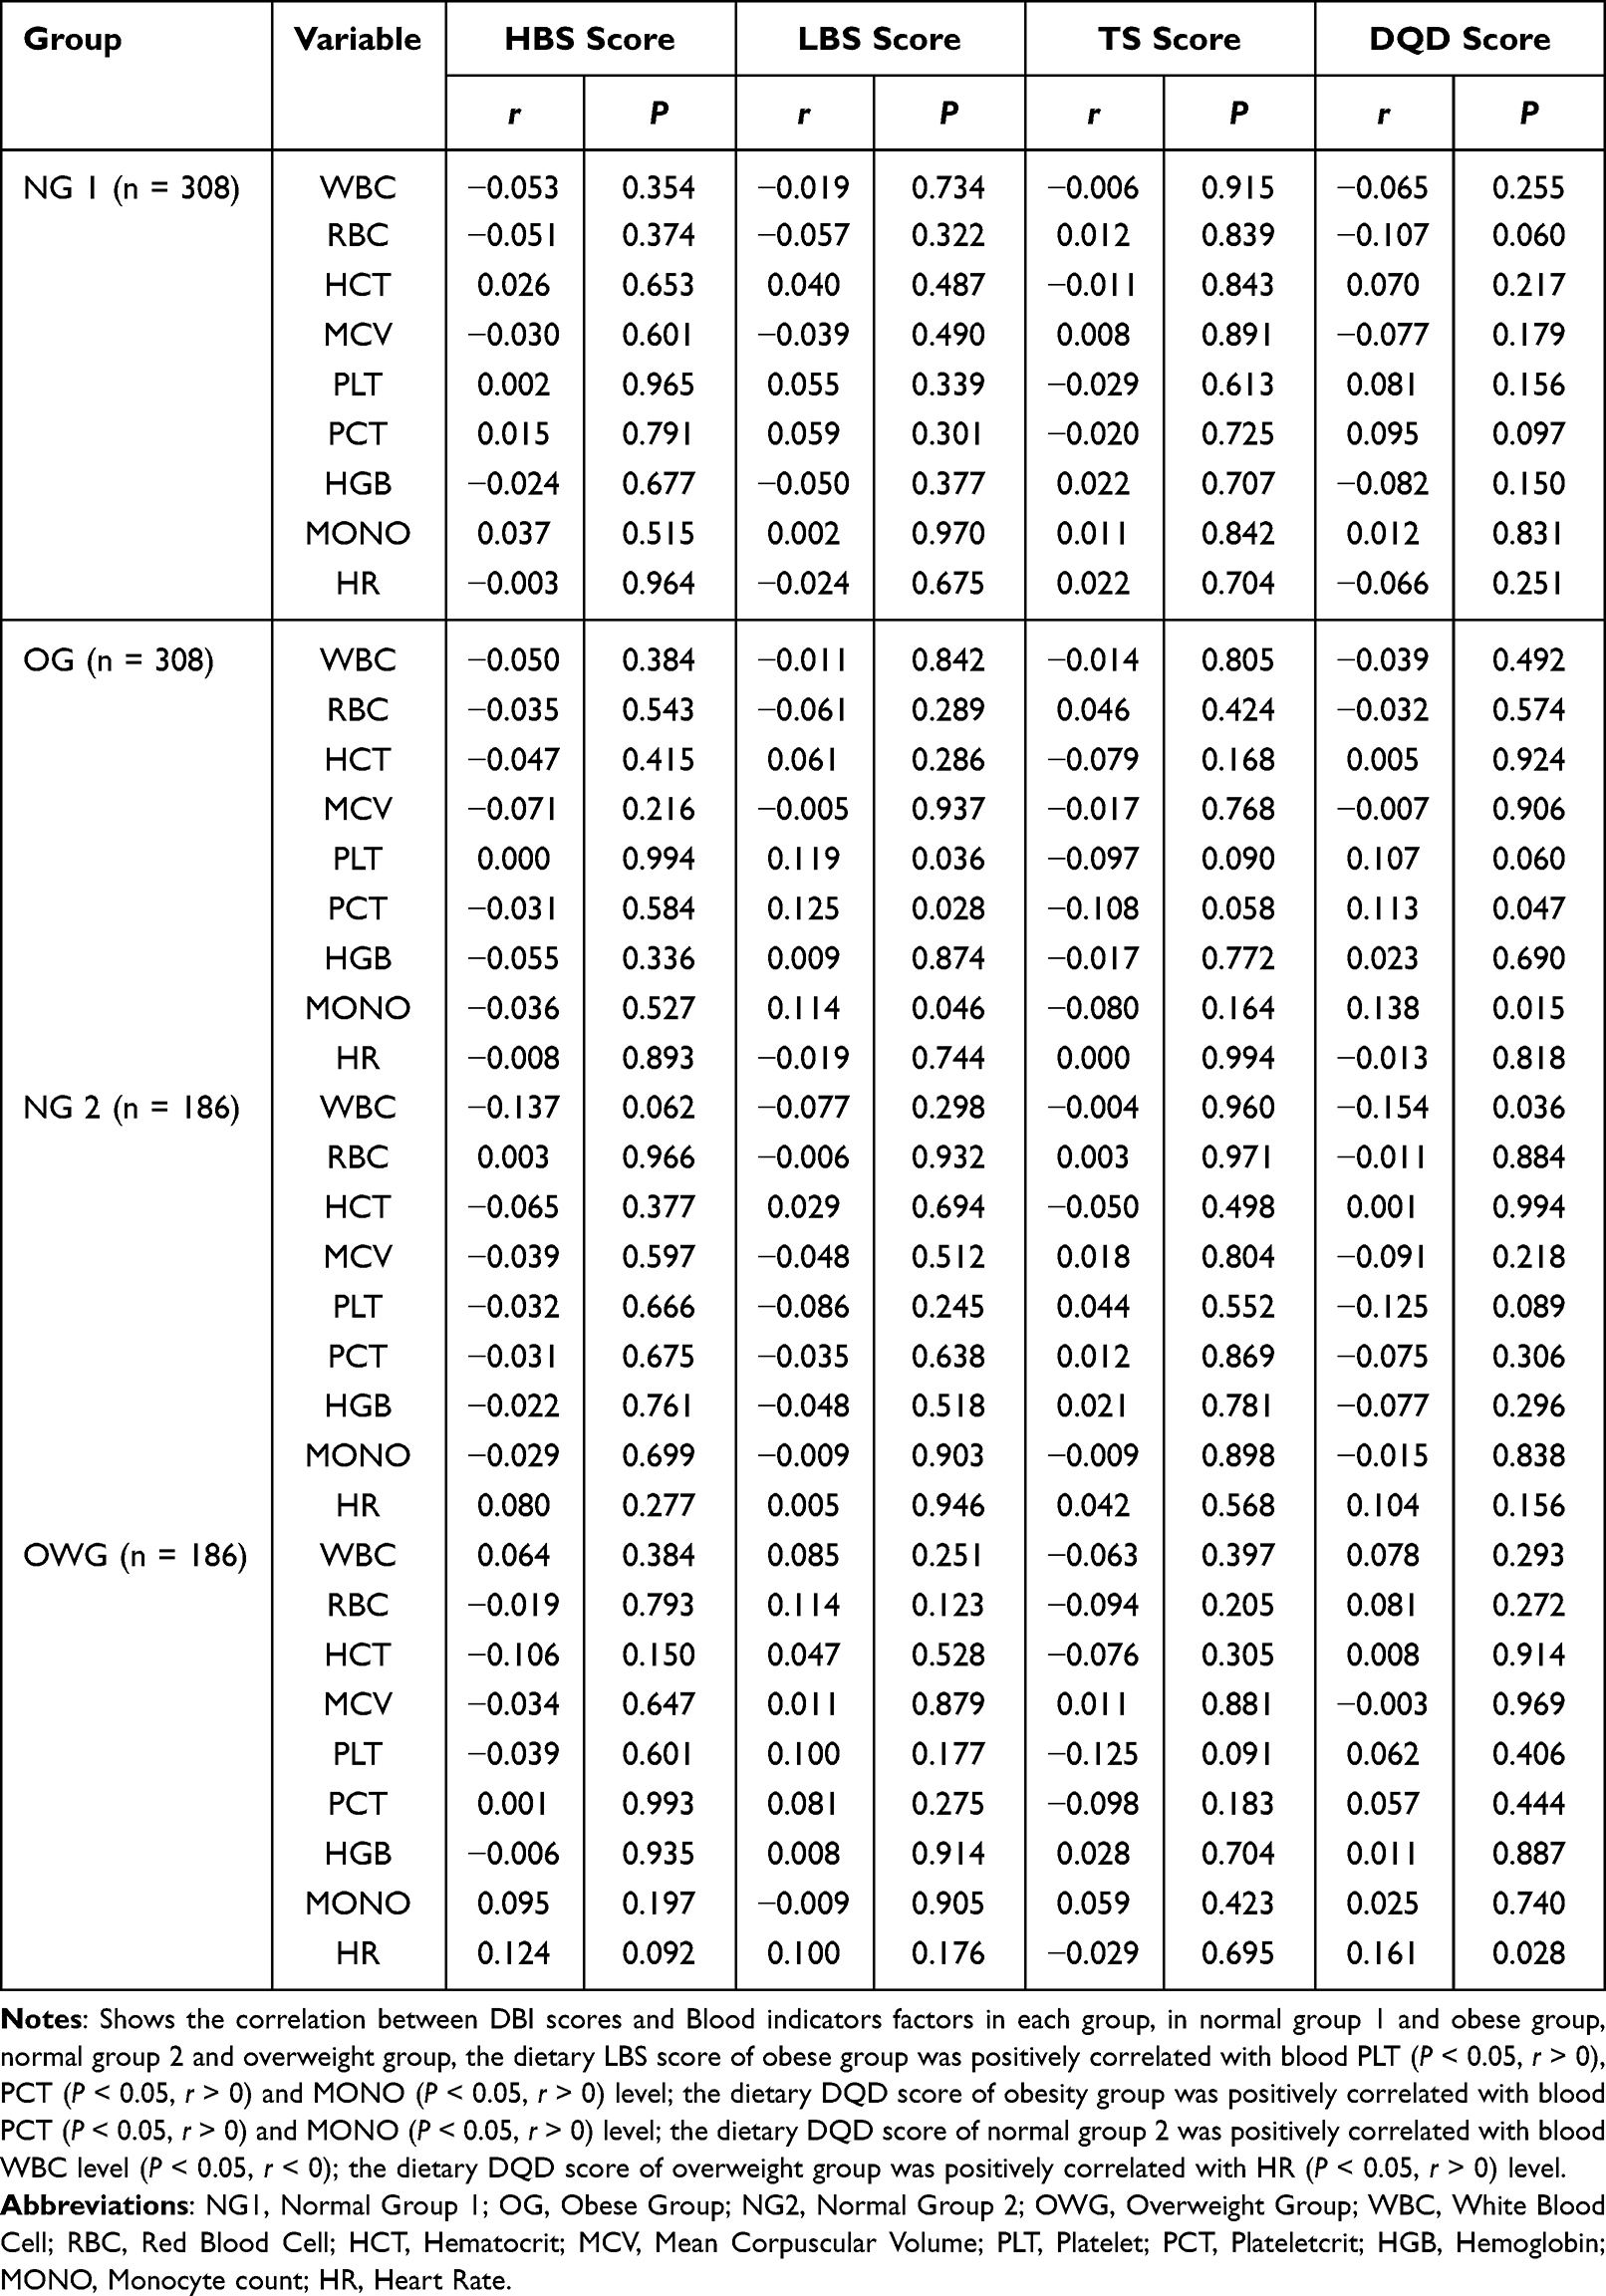 |
Table 8 Correlation Study Between DBI Score and Blood Indicators Factors in Each Group |
Discussion
With the rapidly development of social economy and the great changes of residents’ lifestyle, the situation of overweight and obesity in China’s residents is also increasingly serious.13 Dietary pattern is an important method to evaluate the dietary quality of residents. At present, the assessment of dietary nutrition in China has changed from a single nutrient to a dietary pattern and the assessment of health status and disease risk.14 This study investigated the relationship between DBI score and serum Leptin, UCP1 and other factors in 1518 plateau Han residents in Yongsheng County, Yunnan Province. In this study, the Chinese dietary pagoda (2016) was used to compare and analyze the various food intakes of Han residents living in cold regions in Yunnan plateau. It was found that the problem of insufficient dietary structure intake and excessive intake of residents in this regions existed at the same time. Normal group 1 and obese group, normal 2 and overweight group have different levels of inadequate intakes of cereals, fruits, dairy, eggs, fishes, the excessive intake of beans, poultry and cooking oil. This result is consistent with the Report on the Status of Nutrition and Chronic Diseases of Chinese Residents (2020)15 analysis of the dietary and nutritional status of urban and rural residents in Yunnan Province in 2016 that the residents of Yunnan Province consumed too much poultryand salt, while the vegetables, fruits, eggs, fishes, beans dairy were not enough. This is similar to the results of our previous investigation on Naxi diet in Yulong County, Lijiang City, Yunnan Province.16 The reasons may be closely related to the similar factors, such as economic development level, ethnic customs, dietary habits and geographical environment. However, there may be differences in dietary patterns intake among different nationalities. The analysis of Zhao et al17 in food and nutrient intake of Nu residents in Gongshan County, Yunnan Province in 2016 shows that the intake of cereals and potatoes, pork, aquatic products, dairy of Nu residents was higher than the average intake of Yunnan residents from 2010 to 2013, but the vegetables, fruits, eggs, legumes and products, nuts, cooking oil and salt were all lower than the average intake of Yunnan residents from 2010 to 2013. Otherwise, different altitude, geography environment and nationality culture may also influence dietary intake of residents. Chen Xiang18 in the study on the current situation and countermeasures of dietary diversity of residents in five high-altitude mountain villages in Yunnan’s poor mountainous areas, it was also found that relatively low-altitude villages, the intake rate of vegetables and fresh poultry in high-altitude villages was high, while the intake frequency of soybean and its products, dairy and aquatic products decreased with the increase of altitude.
Besides, our study found that the Han nationality residents, Yunnan Province mainly rely on carbohydrate and fat for energy supply, and there are differences between normal group 1 and obese group, normal group 2 and overweight group (P < 0.05). This may be related to the local high-altitude cold climate and dietary habits, which are caused by the local residents’ adaptation to the high and cold natural environments of the plateau; the carbohydrate and fat intake can provide a lot of energy for the body to resist the cold. Secondly, among the Han population in this area, the intake of cereal food and addible sugar of obese residents is higher than normal group 1 (P < 0.05), the main component is carbohydrate. On the one hand, it may be that fat oxidation at high-altitude requires more oxygen, and high glucose can promote the increase of blood oxygen in the body, which is conducive to the adaptation of hypoxic environment;19 on the other hand, the high carbohydrate contained in cereal and addible sugar can stimulate the body’s insulin secretion, thus promoting fat synthesis.20 In addition, the refined carbohydrate absorption efficiency and glycemic index are high, which is easy to lead to overeating and increase the total energy intake, leading to obesity.21 In addition, the intake of dairy, poultry, fishes, eggs and products, cooking oil, salt condiments and alcoholic beverage had no statistical difference between the residents of the normal group 1 and the obese group (P > 0.05), but the intake of the obese group was higher than normal group 1, which may be related to the special geographical location, ethnic culture, inconvenient transportation and daily diet of residents in the region. These results may explain to some extent that obesity is the result of energy imbalance.
The research of the energy intake and macronutrient levels found that both the obese group and overweight group are higher than normal group. Many results show that the intake of some macronutrients and trace elements by the Han nationality residents in Yongsheng, Yunnan Province is mostly at the over-standard level.22 On the one hand, it may be related to the increased consumption of oxygen and heat energy by the body in the plateau environment, which increases the body’s demand for nutrition; on the other hand, it may be related to the long-term consumption of pickled products such as Sanchuan ham, spicy ginseng, liver paste, etc. It is rich in many essential trace elements. In this study, the serum Leptin level of residents in obese group was higher than normal group 1 (P < 0.05), and the overweight group was also higher than normal group 2 (P < 0.05), which may be related to the local residents’ food intake mainly consisting of carbohydrate and fat, and the fat accumulation would be accompanied by the increase of Leptin level. Research found the Leptin concentration in plasma is related to fat quality,23 Leptin level changes slightly in the short term, most obesity people have hyperleptinemia, high levels of Leptin do not bring obese people back to normal weight,24 and diet and its components affect serum Leptin levels and resistance.25 If the obesity patients were given a low-calorie diet intervention for 10 days with the serum leptin level decreased by 26%, and the conclusion of this study is the same as that of short-term fasting to reduce Leptin gene expression in animals.26 At the same time, different types of fatty acids have different effects on serum Leptin levels. Saeb et al27 healthy non-obese men and women were randomly assigned to a high-fat diet supplemented with refined olive oil (rich in monounsaturated fatty acids), canola oil (rich in monounsaturated fatty acids and alpha-linolenic acid), and sunflower oil (rich in n-6 polyunsaturated fatty acids) for 4 weeks. Kratz, M randomly gave the healthy non-obesity men and women refined olive oil (rich in monounsaturated fatty acids), canola oil (rich in monounsaturated fatty acids and α- Linolenic acid) and sunflower oil (rich in n-6 polyunsaturated fatty acids) as fat sources for a 4-week high-fat diet intervention, which found that rapeseed oil can increase the serum Leptin level in men, while refined olive oil and sunflower oil have no effect on the serum Leptin level. In addition, other studies showed that after adjusting for BMI and other body confounding variables, the intake of total fatty acids and monounsaturated fatty acids was positively correlated with plasma leptin concentration, but this association was only limited to men of normal weight.28 Moreover, we did not found any correlation between dietary related indicators and changes in physical characteristic indicators (such as hemoglobin, red blood cell count, etc.) in high-altitude populations in our study. We consider that to some extent, this may be related to multiple factors, such as regional environment, survey subjects, and study sample size. Interestingly, we found that insufficient dietary intake was positively correlated with blood PLT (P < 0.05, r > 0), PCT (P < 0.05, r > 0) and MONO (P < 0.05, r > 0) level; dietary imbalance was positively correlated with blood PCT (P < 0.05, r > 0) and MONO (P < 0.05, r > 0) level in obese individuals, we speculate that insufficient dietary intake may lead to weakened immune system and malnutrition, while weakened immune system may further lead to infections and diseases.
In this study, we found that the level of serum UCP1 in the overweight group and obese group under different dietary patterns is higher than the normal group or has a tendency to be higher, which reflects the irrationality of the diet of residents in this area, which may be related to the dietary type. In the animal model, high-fat diet can increase metabolic heat and increase the heat production factor uncoupling UCP1.29 Low protein and high carbohydrate diet will increasing the UCP1, and limiting protein intake will promote overeating and increase dietary quality.30
Conclusions
In conclusion, unbalanced dietary consumption is common among the Han nationality in Yunnan Province. Through DBI-16 dietary balance index and dietary pattern analysis, it was found that the dietary structure and pattern of residents in the cold areas of Yunnan plateau were unreasonable, and the diet of residents was in a serious imbalance state. Based on the correlation between DBI-16 and Leptin, Visfatin, A-FABP and UCP1, we further studied the relationship between dietary factors and the occurrence of obesity, and found that dietary patterns were closely related to the expression levels of Leptin and UCP1.
Data Sharing Statement
The supporting documents for this study can be available from the corresponding author: Jianzhong Yin on reasonable request.
Ethical Conduct
Our study complies with the Declaration of Helsinki. The study met the standards for the ethical treatment of participants and was approved by Kunming Medical University Medical Ethical Review Board (KMMU2020MEC078).
Consent to Publication
The publication consent has been attached.
Acknowledgments
We thank all the participants in the study. Ying Qian, Zhuohang Che and Chuanwen Fu are co-first authors for this study.
Author Contributions
All authors made a significant contribution to the work reported, whether that is in the conception, study design, execution, acquisition of data, analysis and interpretation, or in all these areas; took part in drafting, revising or critically reviewing the article; gave final approval of the version to be published; have agreed on the journal to which the article has been submitted; and agree to be accountable for all aspects of the work.
Funding
This work was supported by grants from the National Natural Science Foundation of China (82260641, 81860597); National Key R & D Program of China (2017YFC0907302).
Disclosure
The authors report no conflicts of interest for this work and declare that the research was conducted in the absence of any commercial or financial relationships that could be construed as a potential conflict of interest.
References
1. White M, Aguirre E, Finegood DT, et al. What role should the commercial food system play in promoting health through better diet? BMJ. 2020;368:m545. doi:10.1136/bmj.m545
2. Forouhi NG, Unwin N. Global diet and health: old questions, fresh evidence, and new horizons. Lancet. 2019;393(10184):1916–1918. doi:10.1016/s0140-6736(19)30500-8
3. Wang C. Scientific research report on dietary guidelines for Chinese residents (2021). Food Saf Guide. 2021;07:15. doi:10.16043/j.cnki.cfs.2021.07.004
4. Li M, Shi Z. Dietary pattern during 1991–2011 and its association with cardio metabolic risks in Chinese adults: the China Health and Nutrition Survey. Nutrients. 2017;9(11):1218. doi:10.3390/nu9111218
5. Zhen S, Ma Y, Zhao Z, et al. Dietary pattern is associated with obesity in Chinese children and adolescents: data from China Health and Nutrition Survey (CHNS). Nutr J. 2018;17(1):68. doi:10.1186/s12937-018-0372-8
6. Huang Q, Wang L, Jiang H, et al. Intra-individual double burden of malnutrition among adults in China: evidence from the China Health and Nutrition Survey 2015. Nutrients. 2020;12(9):2811. doi:10.3390/nu12092811
7. Jia X. ”China’s obesity index” stage research results released: the south is thin, the north is fat, the northeast is the most fat. Available from: https://www.takefoto.cn/viewnews-569389.html.
8. Stookey JD, Wang Y, Ge K, et al. Measuring diet quality in China: the INFH-UNC-CH diet quality index. Eur J Clin Nutr. 2000;54(11):811–821. doi:10.1038/sj.ejcn.1601098
9. He Y, Zhai F, Yang X, et al. The Chinese diet balance index revised. Acta Nutrimenta Sin. 2009;31(6):532–536.
10. Statistics NNBo. Bulletin of the seventh national census. Available from: http://www.gov.cn/guoqing/2021-05/13/content_5606149.htm.
11. Zhao X, Hong F, Yin J, et al. Cohort profile: the China Multi-Ethnic Cohort (CMEC) study. Int J Epidemiol. 2021;50(3):721–721l. doi:10.1093/ije/dyaa185
12. Zhu Q, Huang B, Li Q, et al. Body mass index and waist-to-hip ratio misclassification of overweight and obesity in Chinese military personnel. J Physiol Anthropol. 2020;39(1):24. doi:10.1186/s40101-020-00236-8
13. Zhang Q, Ruan Y, Hu W, et al. Perceived social support and diet quality among ethnic minority groups in Yunnan Province, Southwestern China: a cross-sectional study. BMC Public Health. 2021;21(1):1726. doi:10.1186/s12889-021-11787-5
14. Moeller SM, Reedy J, Millen AE, et al. Dietary patterns: challenges and opportunities in dietary patterns research an experimental biology workshop, April 1, 2006. J Am Diet Assoc. 2007;107(7):1233–1239. doi:10.1016/j.jada.2007.03.014
15. Liu Y. Report on nutrition and chronic disease status of Chinese residents (2020). China Food Nutr. 2020;26(12):2. doi:10.19870/j.cnki.11-3716/ts.2020.12.001
16. Fu J, Wang S, Zhang X, et al. Application of dietary balance index to evaluate the dietary quality of naxi ethnic residents living in high altitude high-altitude areas. Soft Sci Health. 2021;35(01):87–90.
17. Zhao J, Liu Z, Tang Q, et al. Analysis of food and nutrient intake among nu residents in Gongshan County, Yunnan Province in 2016. J Kunming Med Univ. 2019;40(06):66–70.
18. Chen X A study on the current situation and countermeasures of dietary diversification among residents in five high altitude high-altitude mountain villages in poor mountain areas of Yunnan Province. Master. Kunming Medical University; 2013.
19. Xu T, He Y, Liu L, et al. Nutrition survey of a special combat unit on the plateau. J Prev Med People Liberation Army. 2019;37(02):1–3+7. doi:10.13704/j.cnki.jyyx.2019.02.001
20. Bamford NJ, Potter SJ, Baskerville CL, et al. Effect of increased adiposity on insulin sensitivity and adipokine concentrations in different equine breeds adapted to cereal-rich or fat-rich meals. Vet J. 2016;214:14–20. doi:10.1016/j.tvjl.2016.02.002
21. Sartorius K, Sartorius B, Madiba TE, et al. Does high-carbohydrate intake lead to increased risk of obesity? A systematic review and meta-analysis. BMJ Open. 2018;8(2):e018449. doi:10.1136/bmjopen-2017-018449
22. Cheng Y. Reference intake of dietary nutrients for Chinese residents(2013). J Nutr. 2014;36(04):313–317. doi:10.13325/j.cnki.acta.nutr.sin.2014.04.002
23. Pereira S, Cline DL, Glavas MM, et al. Tissue-specific effects of leptin on glucose and lipid metabolism. Endocr Rev. 2021;42(1):1–28. doi:10.1210/endrev/bnaa027
24. Andreoli MF, Donato J, Cakir I, et al. Leptin resensitisation: a reversion of leptin-resistant states. J Endocrinol. 2019;241(3):R81–R96. doi:10.1530/joe-18-0606
25. Mendoza-Herrera K, Florio AA, Moore M, et al. The leptin system and diet: a mini review of the current evidence. Front Endocrinol. 2021;12:749050. doi:10.3389/fendo.2021.749050
26. Saladin R, De Vos P, Guerre-Millo M, et al. Transient increase in obese gene expression after food intake or insulin administration. Nature. 1995;377(6549):527–528. doi:10.1038/377527a0
27. Saeb M, Nazifi S, Mohammad MS, et al. The effect of dietary wild pistachio oil on serum leptin concentration and thyroid hormones in the female rat. Zahedan J Res Med Sci. 2008;9(4):e94761.
28. Chu NF, Stampfer MJ, Spiegelman D, et al. Dietary and lifestyle factors in relation to plasma leptin concentrations among normal weight and overweight men. Int J Obes Relat Metab Disord. 2001;25(1):106–114.
29. Wang B, Kong Q, Li X, et al. A high-fat diet increases gut microbiota biodiversity and energy expenditure due to nutrient difference. Nutrients. 2020;12(10):3197. doi:10.3390/nu12103197
30. Zapata RC, Singh A, Pezeshki A, et al. Low-protein diets with fixed carbohydrate content promote hyperphagia and sympathetically mediated increase in energy expenditure. Mol Nutr Food Res. 2019;63(21):e1900088. doi:10.1002/mnfr.201900088
 © 2023 The Author(s). This work is published and licensed by Dove Medical Press Limited. The
full terms of this license are available at https://www.dovepress.com/terms
and incorporate the Creative Commons Attribution
- Non Commercial (unported, 3.0) License.
By accessing the work you hereby accept the Terms. Non-commercial uses of the work are permitted
without any further permission from Dove Medical Press Limited, provided the work is properly
attributed. For permission for commercial use of this work, please see paragraphs 4.2 and 5 of our Terms.
© 2023 The Author(s). This work is published and licensed by Dove Medical Press Limited. The
full terms of this license are available at https://www.dovepress.com/terms
and incorporate the Creative Commons Attribution
- Non Commercial (unported, 3.0) License.
By accessing the work you hereby accept the Terms. Non-commercial uses of the work are permitted
without any further permission from Dove Medical Press Limited, provided the work is properly
attributed. For permission for commercial use of this work, please see paragraphs 4.2 and 5 of our Terms.