Back to Journals » Drug Design, Development and Therapy » Volume 15
Study on Hepatotoxicity of Rhubarb Based on Metabolomics and Network Pharmacology
Authors Li S, Wang Y, Li C, Yang N, Yu H, Zhou W, Chen S, Yang S, Li Y ![]()
Received 13 January 2021
Accepted for publication 13 April 2021
Published 4 May 2021 Volume 2021:15 Pages 1883—1902
DOI https://doi.org/10.2147/DDDT.S301417
Checked for plagiarism Yes
Review by Single anonymous peer review
Peer reviewer comments 3
Editor who approved publication: Prof. Dr. Tin Wui Wong
Shanze Li,* Yuming Wang,* Chunyan Li, Na Yang, Hongxin Yu, Wenjie Zhou, Siyu Chen, Shenshen Yang, Yubo Li
Tianjin University of Traditional Chinese Medicine, Tianjin, People’s Republic of China
*These authors contributed equally to this work
Correspondence: Shenshen Yang; Yubo Li
Tianjin University of Traditional Chinese Medicine, No. 10, Poyang Lake Road, West Zone, Tuanbo New City, Jinghai District, Tianjin, 301617, People’s Republic of China
Tel +86-22-5959-6223
Fax +86-22-5959-6223
Email [email protected]; [email protected]
Background: Rhubarb, as a traditional Chinese medicine, is the preferred drug for the treatment of stagnation and constipation in clinical practice. It has been reported that rhubarb possesses hepatotoxicity, but its mechanism in vivo is still unclear.
Methods: In this study, the chemical components in rhubarb were identified based on UPLC-Q-TOF/MS combined with data postprocessing technology. The metabolic biomarkers obtained through metabolomics technology were related to rhubarb-induced hepatotoxicity. Furthermore, the potential targets of rhubarb-induced hepatotoxicity were obtained by network pharmacology involving the above components and metabolites. Meanwhile, GO gene enrichment analysis and KEGG pathway analysis were performed on the common targets.
Results: Twenty-eight components in rhubarb were identified based on UPLC-Q-TOF/MS, and 242 targets related to rhubarb ingredients were predicted. Nine metabolic biomarkers obtained through metabolomics technology were closely related to rhubarb-induced hepatotoxicity, and 282 targets of metabolites were predicted. Among them, the levels of 4 metabolites, namely dynorphin B (10– 13), cervonoyl ethanolamide, lysoPE (18:2), and 3-hydroxyphenyl 2-hydroxybenzoate, significantly increased, while the levels of 5 metabolites, namely dopamine, biopterin, choline, coenzyme Q9 and P1, P4-bis (5ʹ-uridyl) tetraphosphate significantly decreased. In addition, 166 potential targets of rhubarb-induced hepatotoxicity were obtained by network pharmacology. The KEGG pathway analysis was performed on the common targets to obtain 46 associated signaling pathways.
Conclusion: These data suggested that rhubarb may cause liver toxicity due to its action on dopamine D1 receptor (DRD1), dopamine D2 receptor (DRD2), phosphodiesterase 4B (PDE4B), vanilloid receptor (TRPV1); transient receptor potential cation channel subfamily M member 8 (TRPM8), prostanoid EP2 receptor (PTGER2), acetylcholinesterase (ACHE), muscarinic acetylcholine receptor M3 (CHRM3) through the cAMP signaling pathway, cholinergic synapses, and inflammatory mediators to regulate TRP channels. Metabolomics technology and network pharmacology were integrated to explore rhubarb hepatotoxicity to promote the reasonable clinical application of rhubarb.
Keywords: rhubarb, hepatotoxicity, metabolomics, network pharmacology
Introduction
Rhubarb is the dried root and rhizome of Rheum palmatum (Rheum palmatum L.), Tanghete rhubarb (Rheum tanguticum Maxim. ex Balf.) or medicinal rhubarb (Rheum officinale Bail.).1 Rhubarb has the following effects: such as purging and attacking accumulation, clearing away fire and heat, removing dampness and relieving yellow, removing blood stasis and clearing menstruation. At the same time, rhubarb is the first choice for the treatment of stagnation and constipation in clinical practice.2 Free anthraquinones and bound anthraquinones are the main effective ingredients of rhubarb. Free anthraquinones, including emodin, rhein, and aloe-emodin, are the antibacterial ingredients of rhubarb, and conjugated anthraquinones are the main diarrhea components of rhubarb, among which the bisanthrone glycoside has the strongest effect.3,4 In clinical practice, rhubarb is widely used to treat constipation, acute pancreatitis, renal failure, and hyperlipidemia.5–7 However, the misuse and abuse of rhubarb have endlessly emerged on account of the widespread clinical application of rhubarb in recent years. It has been found that rhubarb exhibits strong adverse reactions when used in large doses, among which liver toxicity of rhubarb is more prominent to become an unavoidable symptom.8–10 However, the mechanism of rhubarb-induced hepatotoxicity and its correlative components are still unclear. Therefore, it is necessary to study rhubarb hepatotoxicity with accurate and rapid methods.
Metabolomics is a discipline that has grown up after proteomics and genomics.11,12 The metabolic network of biological systems can be derived by observing the dynamic changes in metabolites before and after stimulation or perturbation of organism systems on the basis of various analytical tools.13,14 Metabolomics is widely used in various scientific fields due to its high pathway integrity, high sensitivity, and high selectivity.15 Because the research concept of metabolomics has a certain similarity with the overall view of traditional Chinese medicine (TCM), it was rapidly introduced into the field of TCM research and then quickly infiltrated into the investigation of TCM toxicology, becoming one of the main means of screening toxicity markers and studying the mechanism of toxic effects.16,17 Metabolomics is an important analysis method for studying the therapeutic effect and toxicity of drug.18–20 Therefore, nontargeted metabolomics technology in the study is used to analyze the changes in endogenous metabolic markers after rhubarb-induced liver injury. Network pharmacology is a discipline that explains the process of disease development based on the principles of systems biology, and it uses the overall view of network databases to study the interaction between drugs and the body.21 Network pharmacology creates a novel model to rapidly identify the complex network relationship between drug targets and disease targets, and it has an important application value in researching the pathogenesis and therapeutic targets of complex diseases.22 Network pharmacology provides a new perspective for the analysis of drug effects. The connection and relationship of nodes in the biological network can be used to analyze the characteristics of interconnections, and the mechanism between drug effects and body changes can be further clarified.23 Network pharmacology has made some progress in the study of combination drugs, diseases, and toxicity of TCM. Therefore, network pharmacology can be applied to the study of rhubarb hepatotoxicity, and the relevant targets of rhubarb-induced hepatotoxicity can be quickly obtained through virtual screening and analysis.
Metabolomics and network pharmacology are both important parts of systems biology.24 Metabolomics explores the toxic effects of TCM through changes in the body’s endogenous metabolic molecules and related metabolic pathways. Network pharmacology then explores the toxic effects of TCM by screening ingredients and their targets, constructing a network of “component-target-pathways”, and it systematically and comprehensively reveals the toxic mechanism of TCM.25 Drugs work by interacting with various molecular targets. Because most metabolites and drugs interact with multiple target proteins, the methods to predict new targets with existing endogenous metabolites and small molecule compounds have high biological and pharmacological value.26,27 Network pharmacology links the toxicology of Chinese medicine with metabolomics, genes, and proteomics in modern research.28 The combination of network pharmacology and metabolomics will better discover and describe the multicomponent, multitarget, and multipathway action mechanisms of Chinese medicine, which is conducive to the exploration of the action and toxicity mechanisms of Chinese medicine.29 This is also a new idea for the modernization of Chinese medicine research, resulting in better development prospects.
In light of the above research status, we explored a new perspective combining metabolomics and network pharmacology to study rhubarb-induced hepatotoxicity. Based on the UPLC-Q-TOF/MS technology platform, metabolomics technology was used to preliminarily study changes in the metabolic markers of rhubarb-induced liver toxicity. Furthermore, the common targets of liver injury in the Comparative Toxicogenomics Database (CTD) and combined targets, which included rhubarb component targets and hepatotoxic metabolite targets, were recognized as potential targets for rhubarb-induced hepatotoxicity. The pathways involved in rhubarb-induced hepatotoxicity in vivo were predicted through potential targets, and the mechanisms of which were researched and analyzed. This research will provide a safety warning for rhubarb in future clinical applications.
Materials and Methods
Experimental Instruments and Reagents
An electric heating jacket (Beijing Zhongxing Weiye Instrument Co., Ltd.), rotary evaporator (Swiss Buchi Co., Ltd.), a circulating water multipurpose vacuum pump (Yuhua Instrument Co., Ltd.), a low-temperature high-speed centrifuge (Changsha Xiangyi Centrifuge Instrument Co., Ltd.), 1/10,000 balance (Shanghai Balance Instrument Factory), small vortex meter (Haimen Qilinbeier Instrument Manufacturing Co., Ltd.), Waters ACQUITY UPLC (Waters, USA), Waters Xevo TQD high-resolution mass spectrometer (Waters, USA Company), and ACQUITY UPLC BEH C18 column (2.1 × 100 mm, 1.7 μm, Waters Corporation, USA) were used in the present study.
Rhubarb (Anguo Pingchuan Pharmaceutical Co., Ltd., production batch number: 18080035), chrysophanol (Chengdu Herbpurify Co., Ltd.), aloe-emodin (Chengdu Herbpurify Co., Ltd.), rhein (Chengdu Herbpurify Co., Ltd.), emodin (Chengdu Herbpurify Co., Ltd.), 95% ethanol (Tianjin Concord Technology Co., Ltd.), physiological saline (Shijiazhuang Fourth Pharmaceutical Co., Ltd.), distilled water (Guangzhou Watsons Food and Beverage Co., Ltd.), chloraldehyde hydrate (Shanghai McLean Biochemical Technology Co., Ltd.), tissue fixative (Beijing Yili Fine Chemicals Co., Ltd.), chromatographically pure acetonitrile (Sigma-Aldrich), chromatographically pure methanol (US ROE), chromatographically pure formic acid (Sigma-Aldrich), and analytical pure ethanol (US ROE company) were used in the present study.
Preparation of Rhubarb Extract
The rhubarb medicinal material was crushed into a coarse powder through a 10-mesh sieve. Ten times the amount of 95% ethanol was added to the powder, which was then heated to reflux for 1.5 h and filtered with gauze. Eight times the amount of 95% ethanol was added to the medicine residue, which was then heated to reflux for 45 min and filtered with gauze. After the ethanol in the filter residue was evaporated, ten times the amount of distilled water was added, and the mixture was heated to reflux for 1 h. After filtering the residue with gauze, the filtrate and the alcohol extract were combined and concentrated under reduced pressure with a rotary evaporator to obtain the rhubarb extract.30 Distilled water was added to the rhubarb extract to prepare a 1 g/mL drug solution (each 1 mL of the drug solution contained 1 g of crude drug). This drug solution was used for intragastric administration in rats. The prepared rhubarb extract was stored in 4 °C refrigerator.
Rhubarb Ingredient Detection
The abovementioned rhubarb extract was added to distilled water to prepare a 0.1 g/mL rhubarb extract (that is, 0.1 g crude drug per 1 mL of drug solution). The rhubarb extract was centrifuged at 13,000 rpm for 15 min at 4 °C, and the supernatant was collected through a 0.22 μm microporous membrane. All standard samples (0.5 mg/mL) were prepared in methanol aqueous solution through a 0.22 μm microporous membrane. Then, 200 μL of supernatant was transferred into the injection vial, and UPLC-Q-TOF/MS liquid quality sampling analysis was performed. The chromatographic conditions and mass spectrometry conditions are provided in the Supplementary Information.
Animal Experiment
Clean-grade male Wistar rats (Beijing Witton Lihua Experimental Animal Technology Co., Ltd.), weighing 200 ± 20 g, were kept in the Animal Laboratory of Tianjin Institute of Physical Education. After the rats were purchased, they were placed in a changing environment for 12 h day and night and then reared. The temperature in the cultivation room was 23 ± 2 °C, and the humidity was 35 ± 5%. The study was approved by the Animal Ethics Committee of Tianjin University of Traditional Chinese Medicine under permit number TCM-2012-078F01). All procedures were conducted in accordance with the Chinese national legislation and local guidelines. Rats were randomLy divided into the following four groups (n = 8): blank control group administered normal saline; low-dose group administered total rhubarb extract (1.5 g/kg/d); medium-dose group administered total rhubarb extract (6 g/kg/d); and high-dose group administered total rhubarb extract (12 g/kg/d). In animal experiments, all administration methods were gavage, and the rats were administered continuously for 20 days. The blank control group was given the same volume of saline as the administration group. The low dosage was calculated according to the maximum dosage of rhubarb in the “Chinese Pharmacopoeia”. In addition, dosing was performed according to the dosing schedule shown in Table 1.
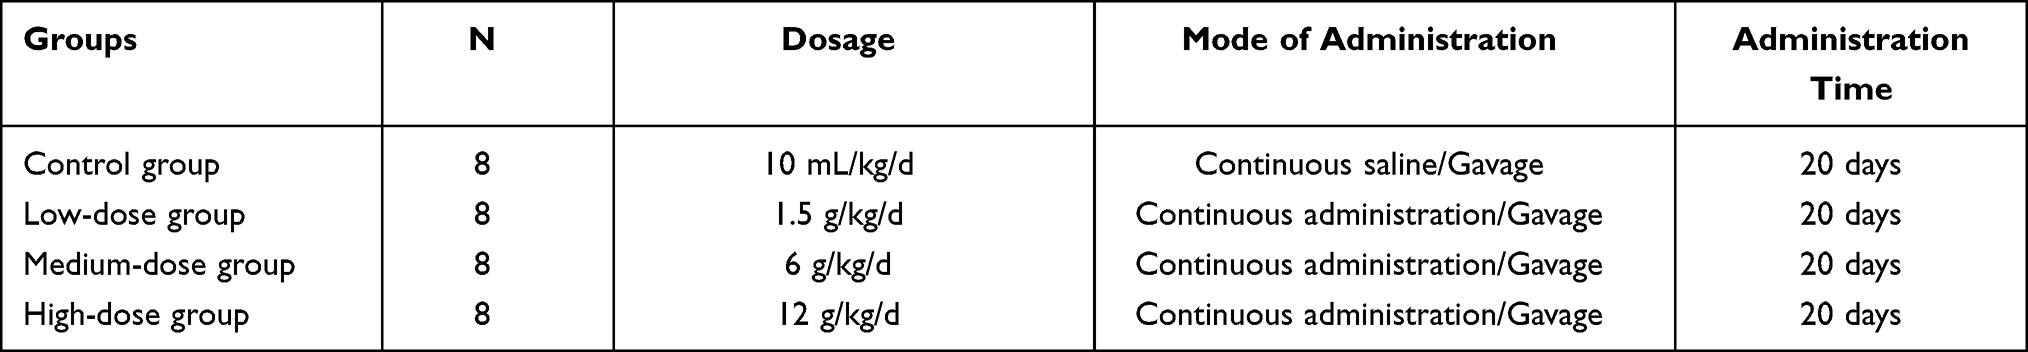 |
Table 1. Experimental Groups and Dosage of Each Group |
Collection and Pretreatment of Biological Samples
Rats in each group fasted for 12 h after the last administration time, and whole blood was collected. Rats were first anesthetized with a 10% chloral hydrate solution, and blood was taken from the abdominal aorta after anesthesia.31 Approximately 5 mL of whole blood was collected, and 1.5 mL of the whole blood sample was placed in a heparinized test tube, which was slowly rotated to ensure even mixing with heparin. The supernatant was centrifuged at 3000 rpm and 4 °C for 12 min, and the supernatant was centrifuged again at 3500 rpm and 4 °C for 8 min. The plasma sample was obtained and stored in −80 °C refrigerator for metabolomics research. The remaining 3 mL of whole blood was placed in a centrifuge tube, and the supernatant was centrifuged at 3000 rpm and 4 °C for 15 min. After collecting blood from each group, rats were perfused with physiological saline.32 The liver tissues of the rats were removed, and the blood stains on the surface were washed with physiological saline and then soaked in tissue fixation solution for pathological section analysis.
Plasma Metabolomics
Plasma samples were frozen at −80 °C and thawed at room temperature. Plasma (100 μL) was placed in an Ostro sample preparation plate, and 300 μL of acetonitrile was added to each well. The samples were mixed vigorously three times and allowed to stand at low temperature for 5 min. Then, 2–8 in-Hg pressure suction filtration was used, and suction filtration was completed. The solution was then collected from the plate and placed in a centrifuge tube. The solution was dried with nitrogen, and 100 μL of ultrapure water was added to reconstitute the sample, which was then vortexed for 1 min, sonicated for 15 min in an ice water bath, and centrifuged at 13,000 rpm for 15 min at 4 °C. Supernatant (200 μL) was transferred into the injection vial, and UPLC-Q-TOF/MS liquid quality sampling analysis was performed.33 The details for UPLC-Q-TOF/MS analysis conditions and mass spectrometry conditions are provided in the Supplementary Information.
Plasma samples (approximately 50 μL) were obtained from each group to prepare quality control (QC) samples, and the QC sample contained the biological information of all samples.34 The QC sample was prepared following the same procedure as the tissue sample to verify the experimental accuracy, repeatability, and stability. The detailed QC methodology surveys are provided in the Supplementary Information.
Biochemical Detection and Histopathology
The contents of alanine aminotransferase (ALT) and aspartate aminotransferase (AST) in the serum of experimental rats were determined using a fully automatic biochemical analyzer. The collected liver tissues were stained with HE, and the pathological manifestations of the rat liver were observed under an optical microscope. Optical microscope examination and histological evaluation were performed to determine the damage of rhubarb to liver tissue. For the HE staining procedure, paraffin sections were dewaxed with xylene, hydrated, stained with hematoxylin for 10 mins, differentiated, stained with eosin, dehydrated, rendered transparent with xylene, and glued with neutral resin.
Target Screening and Online Pharmacology
Target Prediction of Rhubarb Composition
In this study, rhubarb chemical components were used for target prediction. The above chemical composition structure was obtained from the PubChem (https://pubchem.ncbi.nlm.nih.gov/) database, and the SDF file was downloaded and saved. The downloaded SDF file was used to obtain the target point corresponding to the rhubarb component in the Swiss Target Prediction database (http://www.swisstargetprediction.ch/).35 The targets were imported into Cytoscape software to construct the “rhubarb component-target” interaction network diagram.
Target Prediction of Hepatotoxic Metabolites Caused by Rhubarb
Based on the hepatotoxic metabolites obtained in the metabolomics analysis, the chemical structure was obtained using the PubChem database and saved as a file in SPF format, and the corresponding target was obtained in the STP database. We summarized the obtained targets, merged targets, and deleted duplicates. We then obtained the “metabolite-target” and used Cytoscape software to construct an interaction network diagram.
Network Construction Analysis of Liver Injury Targets
The obtained rhubarb component targets and metabolite targets were crossed to obtain the rhubarb component metabolite targets. The intersection targets and the CTD database (http://ctdbase.org/) “chemical and drug-induced liver damage” targets were intersected to obtain the targets of hepatotoxicity caused by rhubarb. The STRING (https://string-db.org/) database was used to analyze the protein interactions of the above targets, and Cytoscape software was used to obtain protein interaction network maps.
Analysis of Related Channels
For the intersecting target proteins, the David database (https://david.ncifcrf.gov/) was used for GO functional enrichment analysis and KEGG pathway analysis. GO function analysis was mainly used to describe the function of gene products, including biological process, cell composition, and molecular function. The KEGG pathway was enriched to analyze the possible action pathways of the target and used to explore the mechanism of hepatotoxicity caused by rhubarb.
Data Processing
Masslynx (US Waters) software was used to collect the original data of each group and perform ion pair extraction, peak alignment, peak matching, and peak intensity correction on the spectrum. Targetlynx (US Waters) software was used to update the retention time and peak intensity of the category, and SIMCA-P14.0 statistical software was utilized for multivariate statistical analysis.36 Unsupervised principal component analysis (PCA) was performed. Within the 95% confidence interval, outliers of each group were eliminated. Supervised partial least squares-discriminant analysis (PLS-DA) was performed in UV mode, and cross-validation was performed to confirm that the established model was reliable. In the results of PLS-DA, substances with VIP values > 1 were selected as candidate markers.37 After the t-test, the candidate markers were selected to have significant differences as preliminary toxic biomarkers.
Results
Identification of Rhubarb
UPLC-Q-TOF/MS was used to qualitatively analyze the chemical constituents extracted from rhubarb. The base peak intensity (BPI) of ESI-MS is shown in Figure 1. Using information, such as mass spectrometry fragments and compound spectra, a total of 28 compounds were identified from rhubarb extracts by comparing standards and literature as shown in Table 2. The specific comparison information and atlas of the standard and sample are included in the Supplementary Information. The substances included anthraquinones, anthracnose, tannins, flavonoids, and simple phenolic acids. The ion fragmentation pathway for the identification of rhubarb components is included in the supporting information.
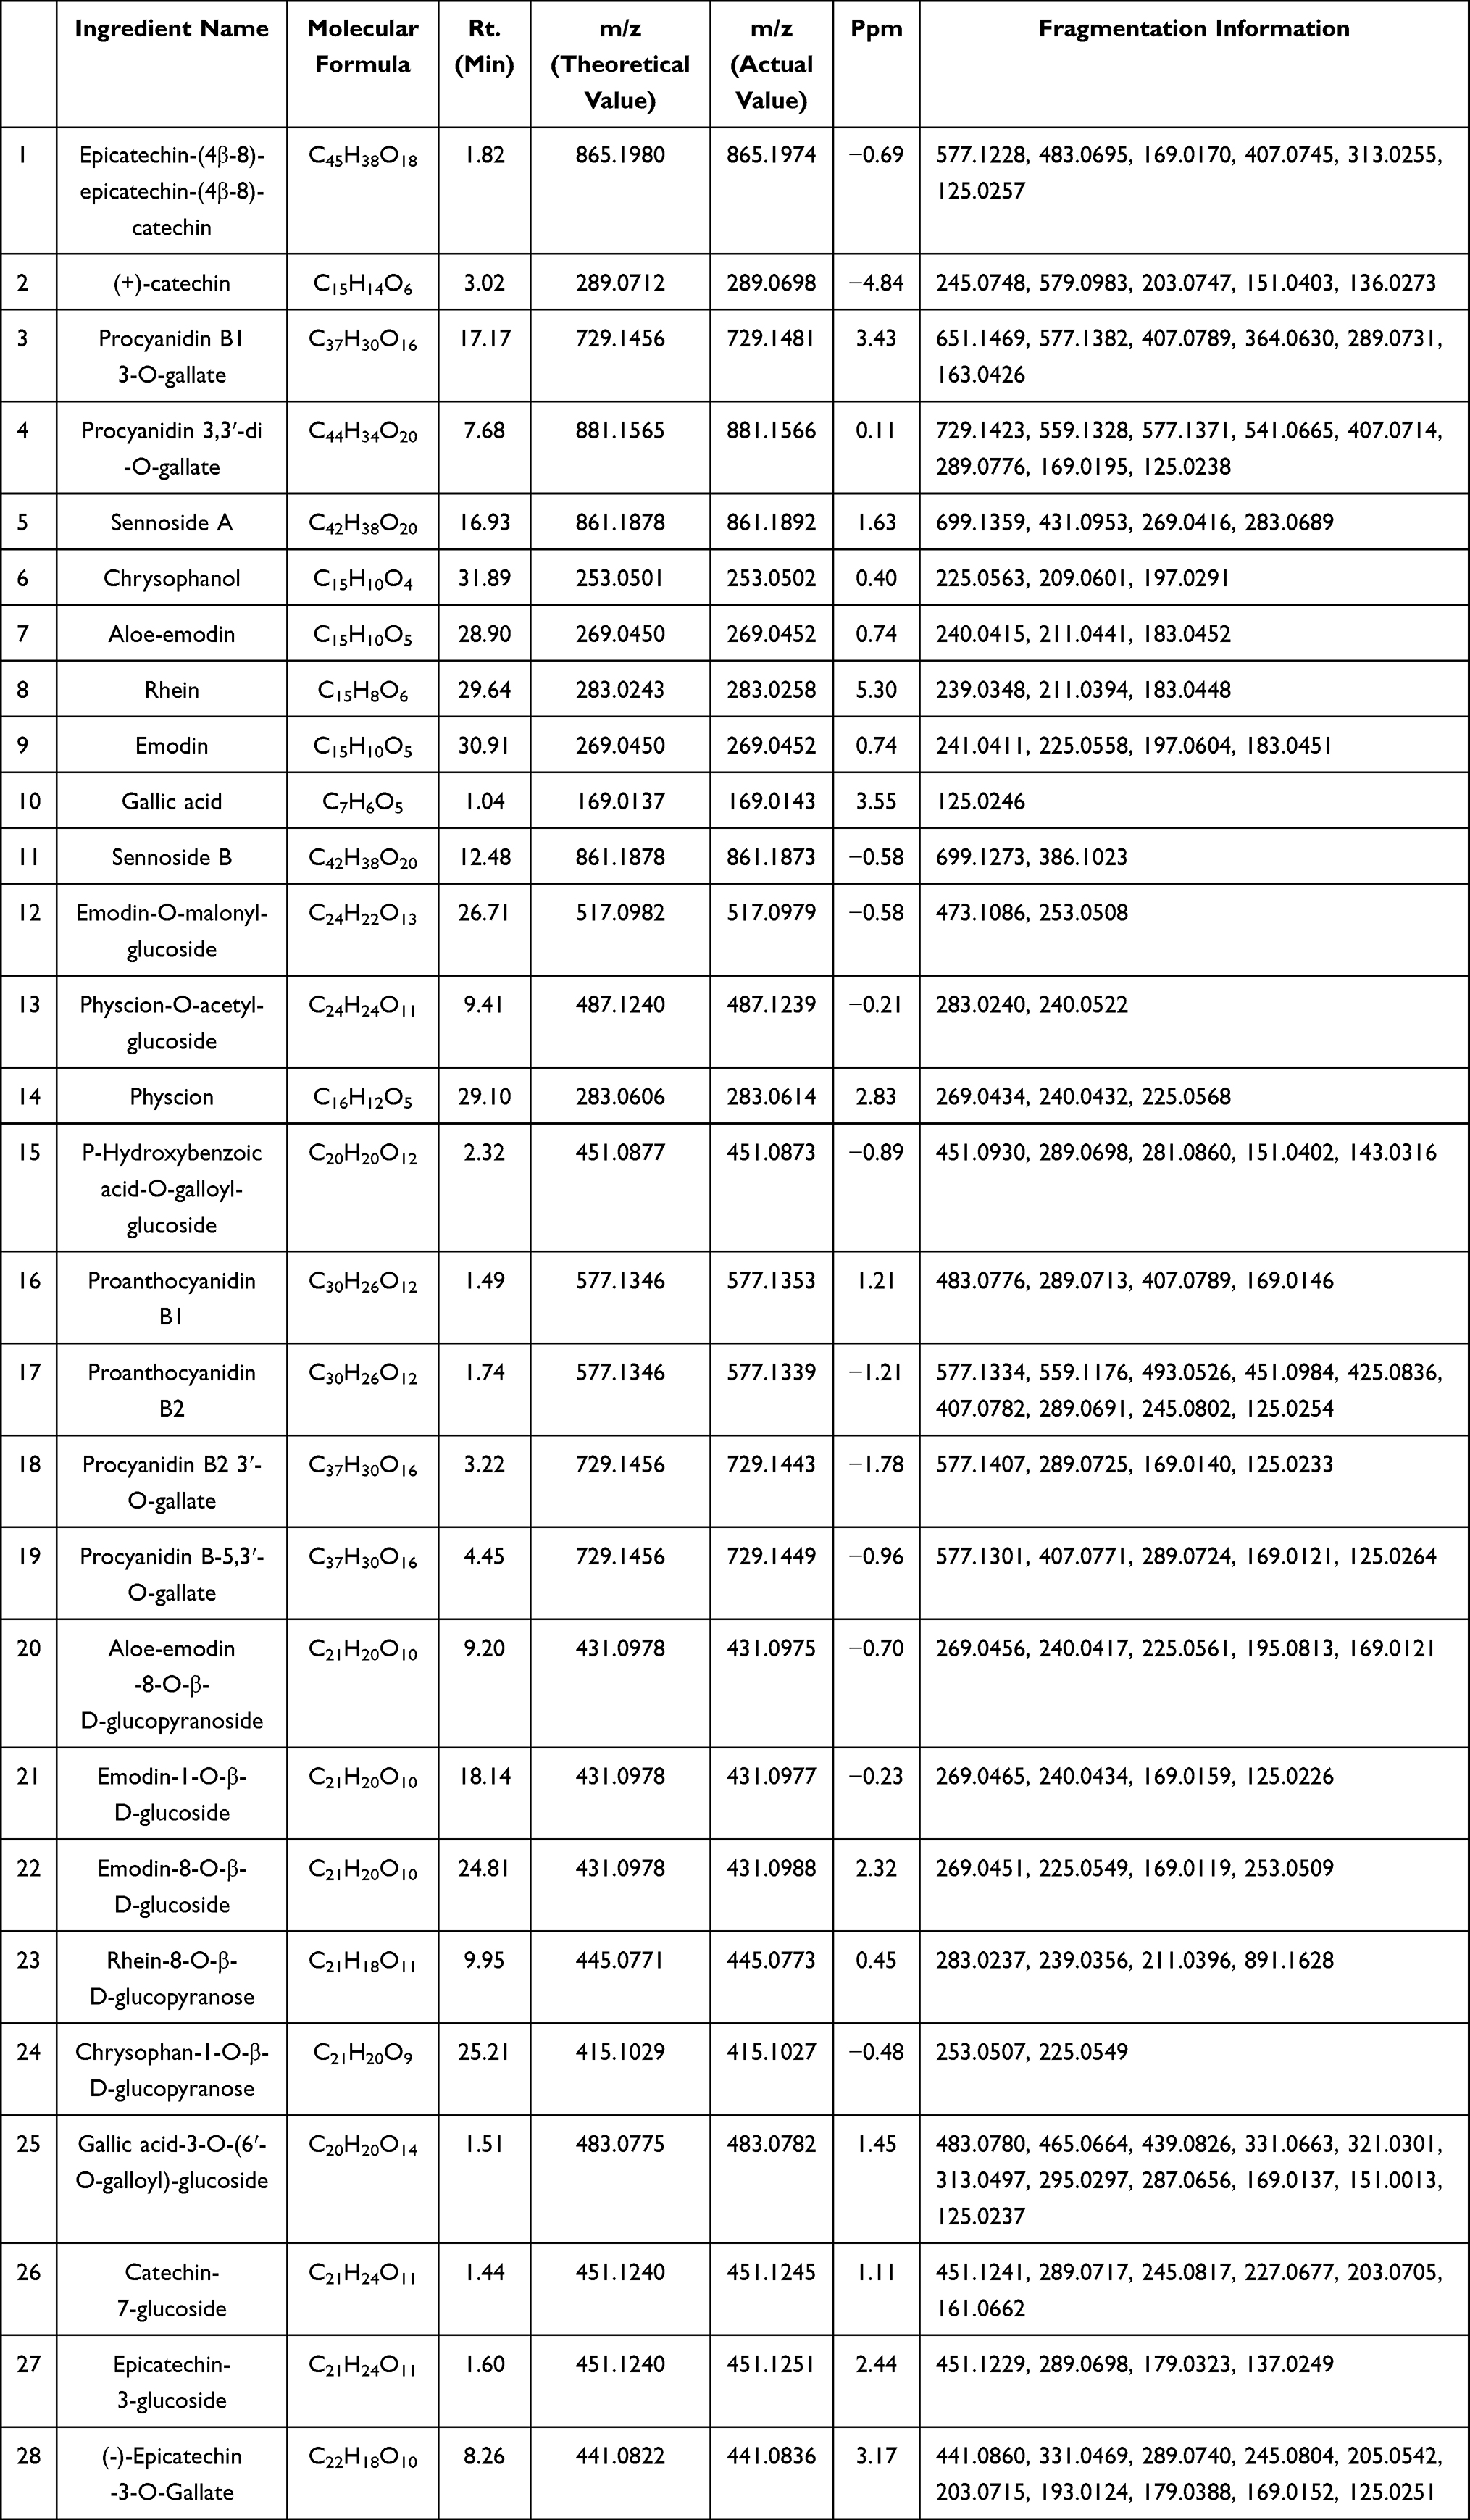 |
Table 2. Identification Information for Rhubarb Total Extract Composition |
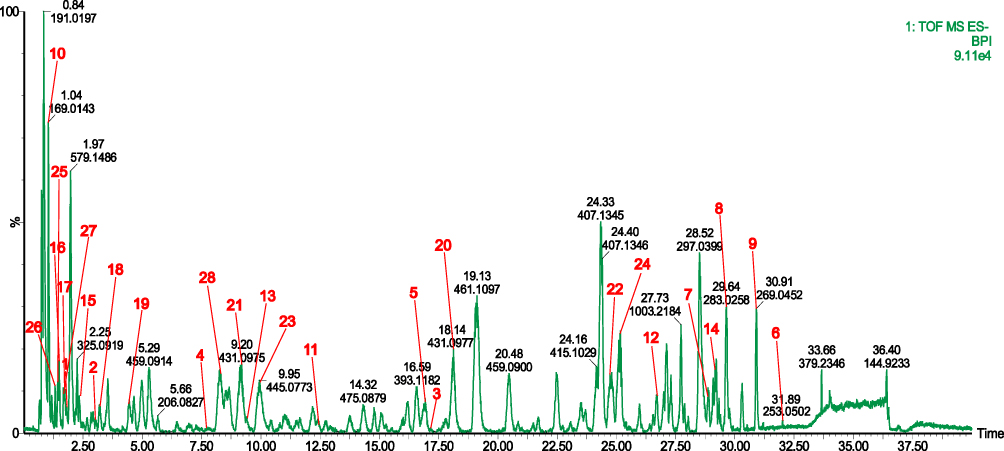 |
Figure 1 Rhubarb total extract with negative ion mode BPI. |
Rat Body Weight, Biochemical, and Pathological Results
The weight of each group of rats was weighed every day during the administration period. The change in body weight is shown in Figure 2A. The four curves in the figure represent the changes in the body weight of the normal control group (C), low-dose group (L), medium-dose group (M), and high-dose group (H) during the administration period. Throughout the entire administration period, the weight of the rats in each group showed an increasing trend. However, the weight of the rats in each dose group changed after the rhubarb total extract was administered. With the increase of the dose of rhubarb, the weight of rats increased more slowly. After 20 days of administration, the rats in the administration group weighed less than the control group. These findings indicated that the total extract of rhubarb has a certain degree of toxicity in rats.
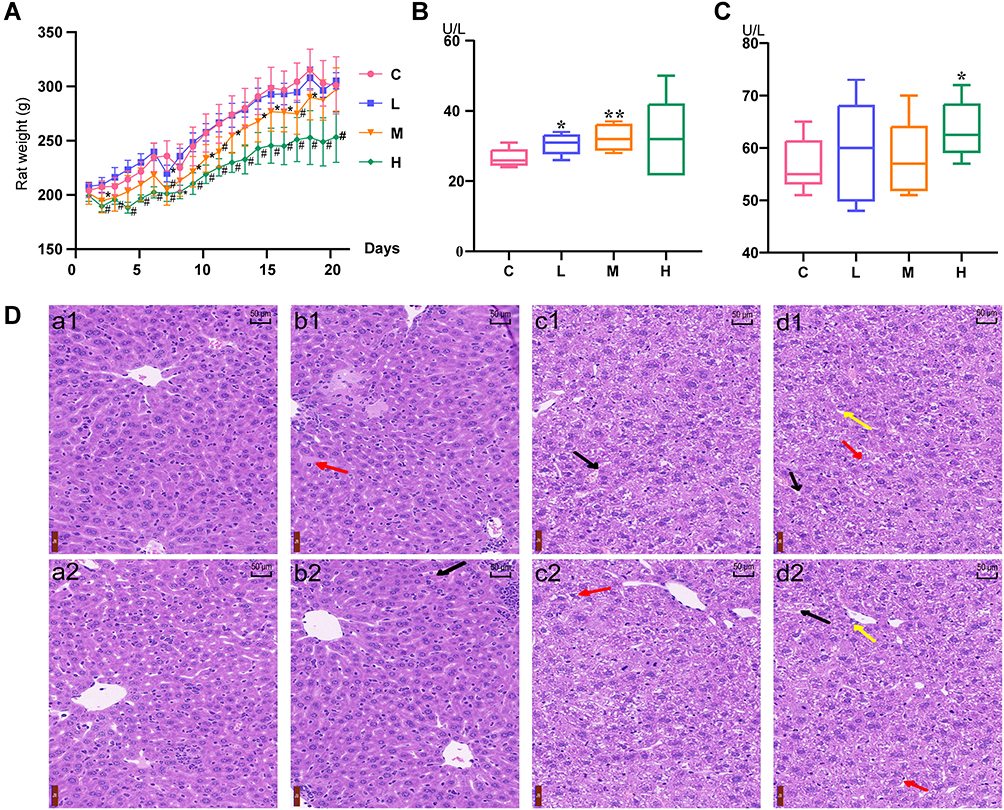 |
Figure 2 Trend chart of body weight change of each group (A). Changes in the contents of ALT (B) and AST (C) in the serum samples of different groups. Liver pathological results (D) for the C group (a1-a2), L group (b1-b2), M group (c1-c2) and H group (d1-d2) with 200x magnification. n= 6, 7, 7, and 6, respectively. Abbreviations: C group, normal control group; L group, low-dose group; M group, medium-dose group; H group, high-dose group. Notes: (A) *P value of the treatment group compared with the control group is less than 0.05, and #P value of the treatment group compared with the control group is less than 0.01; (B and C) *P value <0.05 and **P value <0.01. |
To evaluate the degree of damage of rhubarb to the liver, serum ALT and AST levels were used as biochemical indicators of liver damage. The results of the biochemical indicators detected by the experimental groups are shown in Figure 2B and C. The AST and ALT levels increased with increasing administered dose. During the 20-day administration process, the AST and ALT levels increased with increasing doses. The level of ALT increased significantly in the low and medium dose groups. The level of AST in the high-dose group increased significantly. These findings demonstrated that there was a certain degree of hepatotoxicity in rats after administration of the total extract of rhubarb.
The results of liver pathological sections are shown in Figure 2D. In the normal control group (a1-a2), the liver cells were regularly arranged with clear boundaries. The cytoplasm was loosely stained, and there was no obvious abnormality in the interstitium and no obvious inflammation. The cells in the low-dose group (b1-b2) were regularly arranged and clearly demarcated, but there was a small number of fibrotic cells as shown by black arrows. The fibrotic cells were accompanied by a small amount of inflammatory cell exudation as shown by red arrows. In the medium-dose group (c1-c2), a small amount of tissue damage was observed in the field of vision. A small number of cells disappeared, and a small amount of connective tissue hyperplasia and fibroblasts was observed as shown by black arrows. Additionally, a small amount of inflammatory cell exudation was observed with occasional granulocyte presence and lymph cell infiltration as shown by the red arrow. Liver tissue in the high-dose group (d1-d2) was extensively damaged. The connective tissue was relatively loose with a small amount of cell fibrosis as shown by the black arrow, and it was accompanied by inflammatory cell infiltration. In a large number of hepatocytes, the cytoplasm was loosely stained as shown by the red arrow, and a small amount of vacuoles, liquefied necrosis and steatosis was observed as shown by the yellow arrow. A small amount of nucleocytoplasm was observed in and around the venous cavity, and the nucleolus was obvious.
Metabolomics Results
PCA and PLS-DA Analysis
Using UPLC-Q-TOF/MS technology analysis, the four groups of rat plasma samples were subjected to metabolomics analysis. The plasma QC samples were analyzed by mass spectrometry in positive ion mode, and the resulting BPI diagram is shown in Figure 3.
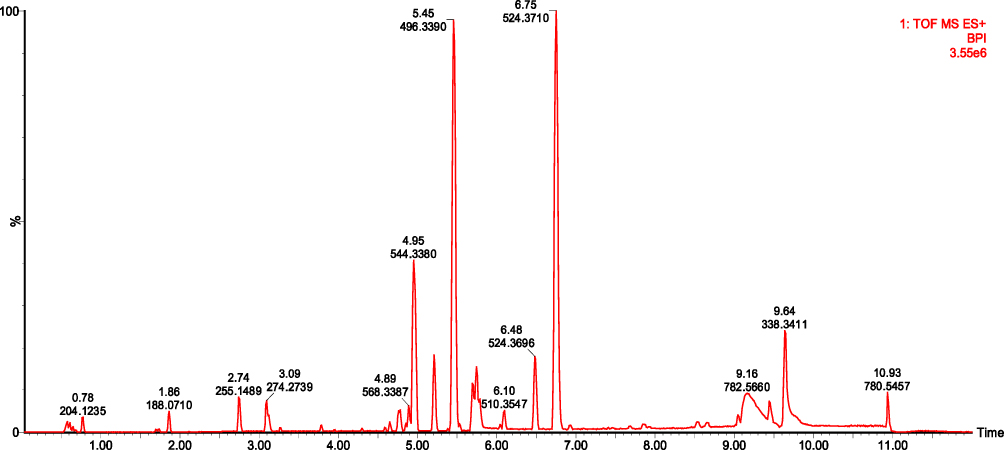 |
Figure 3 Plasma QC sample with positive ion mode BPI. |
PCA determined that the samples were within the 95% confidence interval (Figure 4A). The PCA results (PCA: R2X = 0.299, Q2 = 0.135) in the two-dimensional scatter plot were unable to distinguish three different doses. The samples in the dose groups and normal group had poor aggregation. There was a certain difference between the normal group and the different dose groups, which showed that the Chinese medicine rhubarb caused changes in endogenous metabolites in the body. The four groups of samples had differences in metabolic levels.
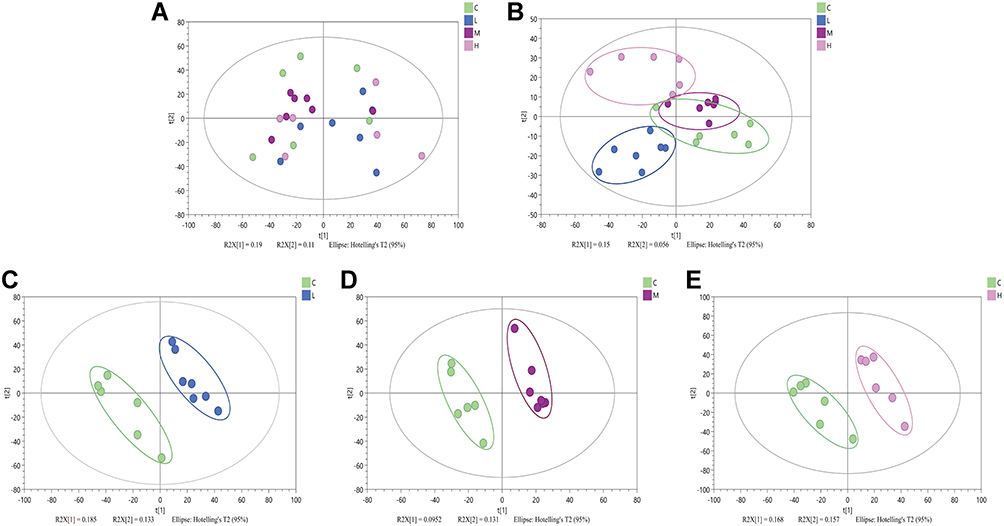 |
Figure 4 Two-dimensional PCA graphs of four groups (A). PLS-DA graphs of normal control group and toxic group (B). PLS-DA graphs of normal control group and low-dose group (C). PLS-DA graphs of normal control group and low-dose group (D). PLS-DA graphs of normal control group and low-dose group (E). |
On this basis, PLS-DA analysis was used to mine potential data information and further screen for differential metabolites with significant changes. Four groups of PLS-DA models were established (PLS-DA: R2X = 0.206, R2Y = 0.488, and Q2 = 0.0741). The results showed that each group was separated into different areas (Figure 4B). PLS-DA analysis was then used to build models for the following groups: normal and low-dose groups; normal and medium-dose groups; and normal and high-dose groups (PLS-DA-L: R2X = 0.318, R2Y = 0.963, and Q2 = 0.55; PLS-DA-M: R2X = 0.226, R2Y = 0.983, and Q2 = −0.21; PLS-DA-H: R2X = 0.325, R2Y = 0.957, and Q2 = 0.414). Thus, the VIP > 1 substance was selected as a candidate liver toxicity marker. The specific results are shown in Figure 4C–E.
Determination and Quantification of Markers
On the basis of screening candidate markers with VIP > 1, a t-test group difference test was performed to identify substances with VIP > 1 and P value < 0.05 as liver toxicity biomarkers. The biomarkers were tested by standard curve quantitative analysis. Through a database search of differential metabolites and further identification of related literature, nine hepatotoxicity markers were finally determined. The specific information of the selected biomarkers is shown in Table 3.
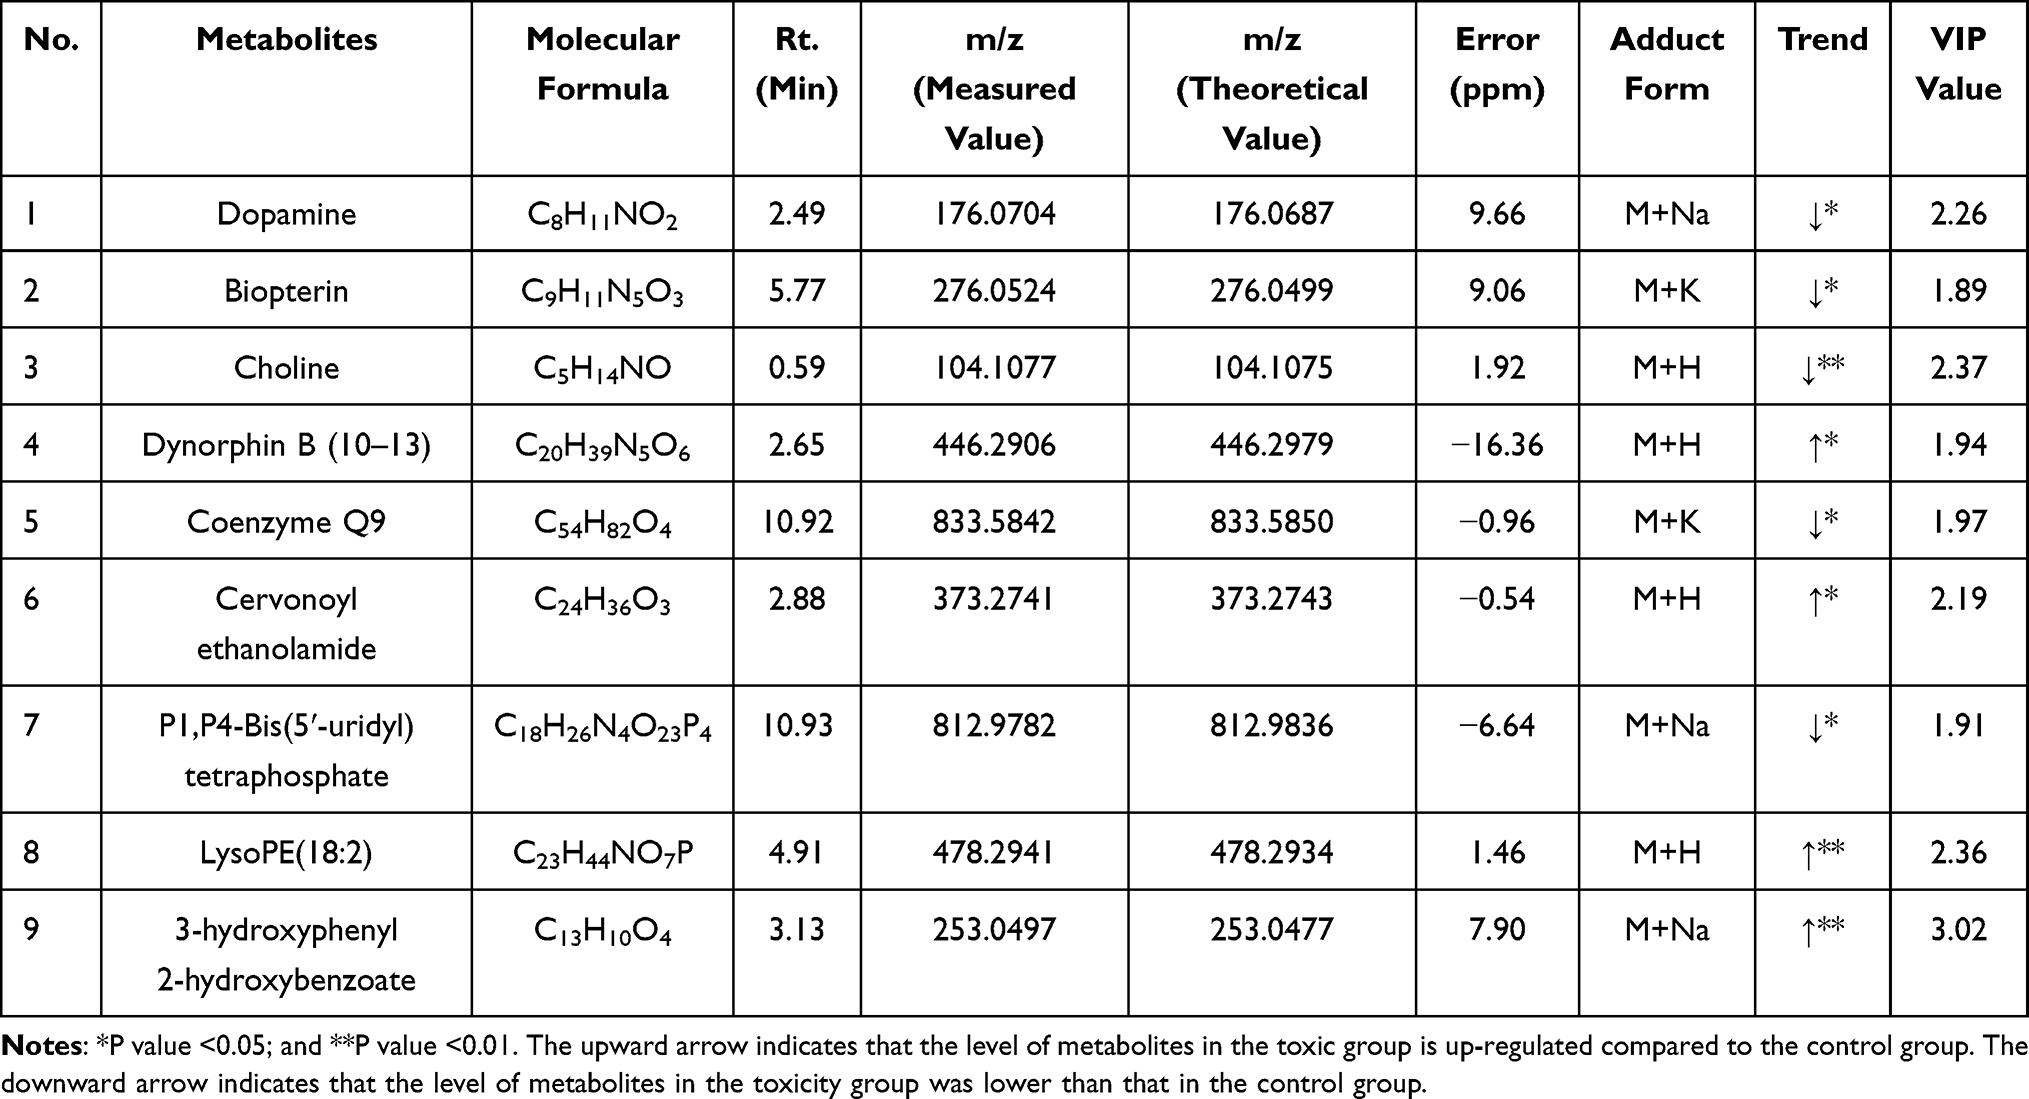 |
Table 3. Ionic Information for Potential Biomarkers for Liver Toxicity |
Marker Analysis
The heatmap and ROC curve were used to analyze and optimize the markers. Table 3 shows that a total of 9 hepatotoxicity biomarkers were screened out. The dopamine, biopterin, choline, coenzyme Q9, and P1, P4-Bis (5ʹ-uridyl) tetraphosphate metabolic markers decreased significantly compared to the normal control group, and the dynorphin B (10–13), cervonoyl ethanolamide, lysoPE (18: 2), and 3-hydroxyphenyl 2-hydroxybenzoate metabolic markers increased significantly compared to the normal control group.
The hierarchical cluster analysis method (heatmap) was used to analyze the markers. Figure 5 shows the content differences of nine the metabolic markers in the hepatotoxicity group. Taking the variable information as the ordinate and the sample information as the abscissa, the depth of the color reflects the size of the variable value. The closer the bifurcation of the variable information in the vertical axis is, the higher the similarity of the substances; that is, they may be derived from metabolites of the same substance. In the present study, the heatmap colors indicated a significant difference between the normal control group and toxic group.
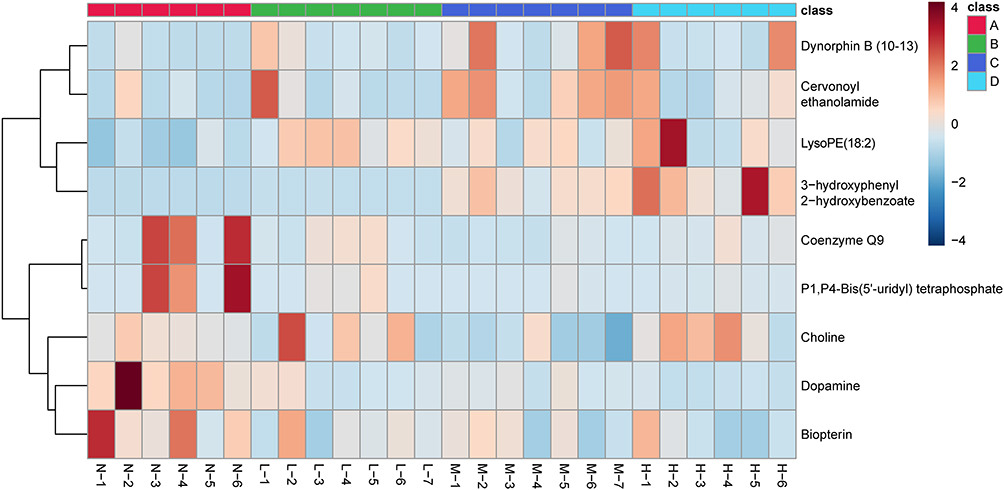 |
Figure 5 Heatmap of metabonomic data depicting the data structure of nine biomarkers. Notes: The columns represent differentiating metabolites, and the rows indicate the samples. C1-C6, LI-L7, M1-M7 and H1-H7 belong to the normal control group, low-dose group, medium-dose group and high-dose group, respectively. The depth of the color represents the size of the variable. |
The ROC curve was used to optimize the nine markers in Figure 6. The AUCs of three biomarkers were greater than 0.9, indicating that they had a good diagnostic ability for rhubarb-induced liver toxicity. The AUCs of six biomarkers were greater than 0.7, indicating good diagnostic capabilities as well. Information on the area under the curve of the nine metabolites is provided in the Supplementary Information.
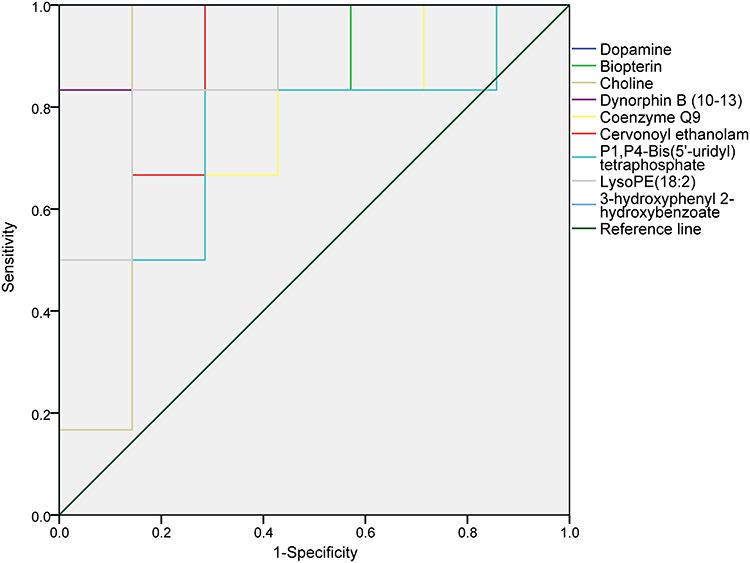 |
Figure 6 ROC curve for evaluating the predictive ability of nine rhubarb hepatotoxicity biomarkers. |
Network Pharmacology Analysis
Target Prediction of Rhubarb Composition
In this study, 28 chemical components of rhubarb were obtained by measurement. The structural formulas of these components were obtained through PubChem, and 242 targets of components were obtained by importing them into the STP database. The component-target interaction network of rhubarb constructed by Cytoscape software is shown in Figure 7.
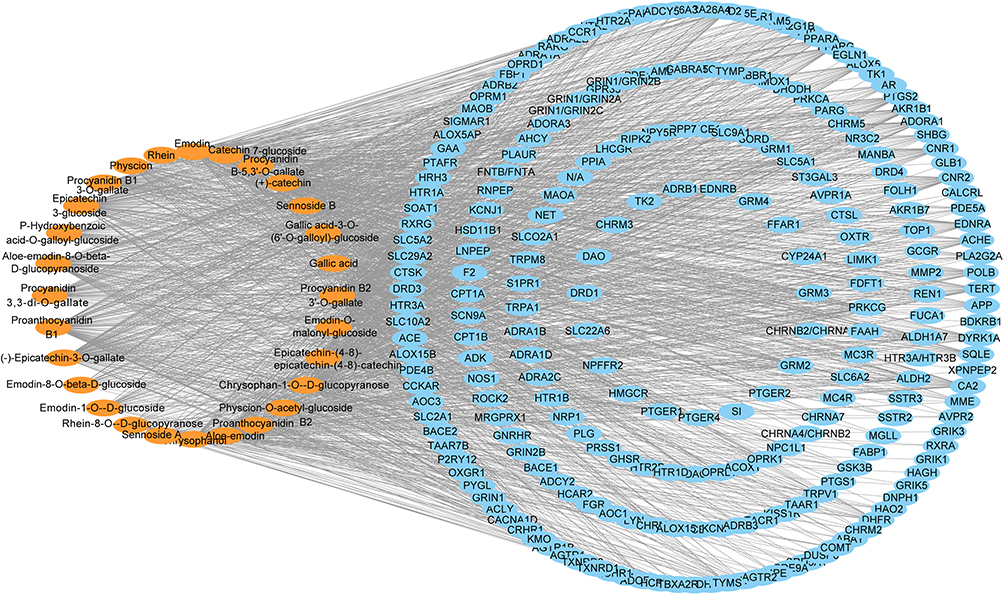 |
Figure 7 Rhubarb “ingredient-target” network diagram. Note: Orange represents the rhubarb component, and blue represents the target. |
Target Prediction of Hepatotoxic Metabolites Caused by Rhubarb
Based on the UPLC-Q-TOF/MS metabolomics technology in the rat liver toxicity studies, nine hepatotoxicity metabolic biomarkers were screened. In total, 282 targets corresponding to nine metabolites were obtained from the STP database, and the “metabolite-target” interaction network was constructed as shown in Figure 8.
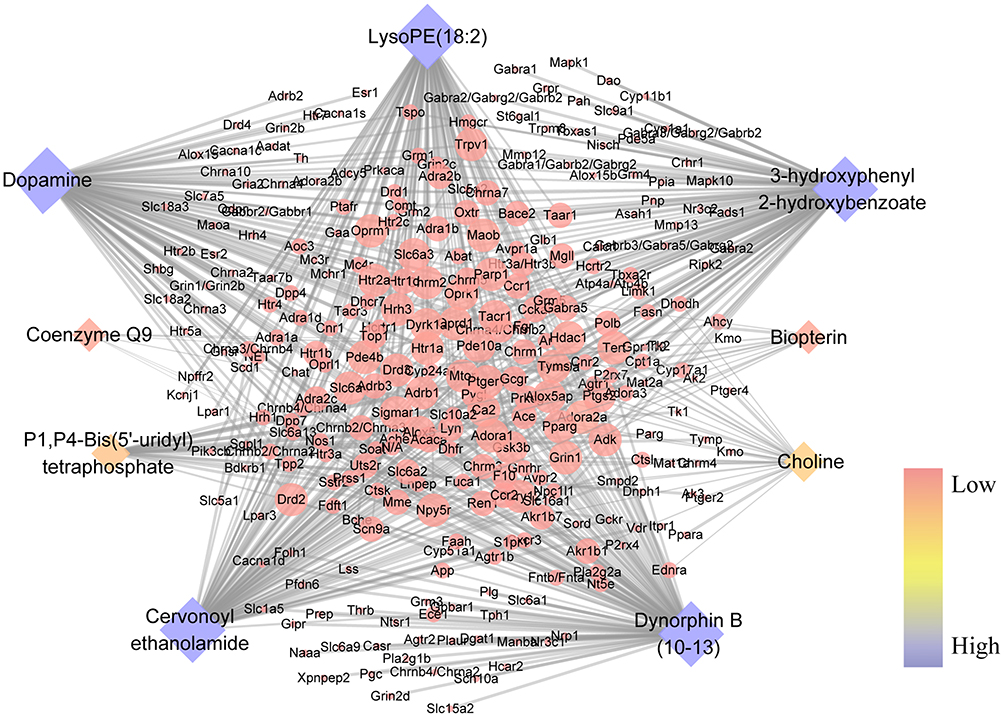 |
Figure 8 “Metabolite-target” network diagram. Notes: Diamonds represent metabolic markers, and circles represent targets. The color from pink to blue represents the correlation from low to high. |
Rhubarb Potential Hepatotoxicity Target Protein Network Analysis
Intersecting 242 rhubarb component targets with 282 metabolite targets generated 184 copredicted targets. After intersecting with the “chemical and drug-induced liver damage” targets in the CTD database, 166 common targets were obtained. Using these 166 targets as potential targets for hepatotoxicity of rhubarb, the target-protein interaction network map of 166 potential toxic targets of rhubarb was drawn using the String database (protein–protein interaction, PPI) as shown in Figure 9. The required interaction score was set to 0.400. The PPI network contained 166 nodes, 4247 edges, and an average node degree of 50.9. Each node in the figure represents a protein, and the connections between the nodes represent the interaction between the proteins. The common target may be related to the mechanism of hepatotoxicity caused by rhubarb. The network diagram of protein interaction relationships helps to more intuitively understand the functional relationships between proteins.
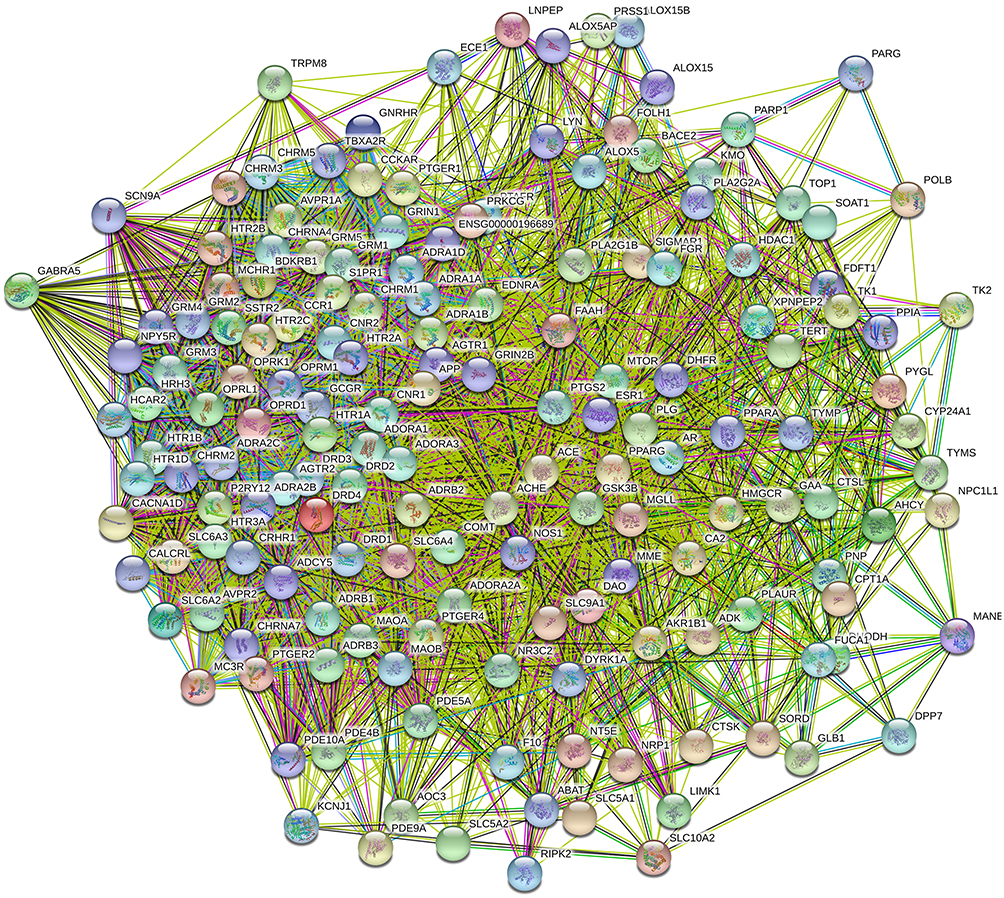 |
Figure 9 Rhubarb potential hepatotoxicity target PPI network. Note: The PPI network contained 166 nodes, 4147 edges, an average node degree of 50.9 and enrichment p value <0.05. |
GO Gene Enrichment Analysis and KEGG Pathway Analysis
To further discover the mechanism of hepatotoxicity caused by rhubarb, the 166 targets obtained above were analyzed for GO gene enrichment and KEGG pathway analysis using the DAVID database. The GO gene enrichment analysis of the targets was mainly divided into the following three parts: biological process (BP), cellular component (CC), and molecular function (MF). The GO analysis results showed that the biological process (BP) obtained a total of 149 enrichment results, mainly including the adenylate cyclase-inhibiting G-protein coupled receptor signaling pathway, adenylate cyclase-activating adrenergic receptor signaling pathway, phospholipase C-activating G-protein coupled receptor signaling pathway, sensory perception of pain, and locomotory behavior. Cell composition (CC) obtained 24 enrichment results, mainly including integral components of the plasma membrane, postsynaptic membrane, neuron projections, dendrites, and cell junctions. Molecular function (MF) obtained 34 enrichment results, mainly including serotonin binding, drug binding, G-protein coupled acetylcholine receptor activity, neuropeptide binding, and peptide binding. The enriched results were ranked by P value, and the R programming language was used to plot the analysis results of the top 10 rankings of the three parts as shown in Figure 10.
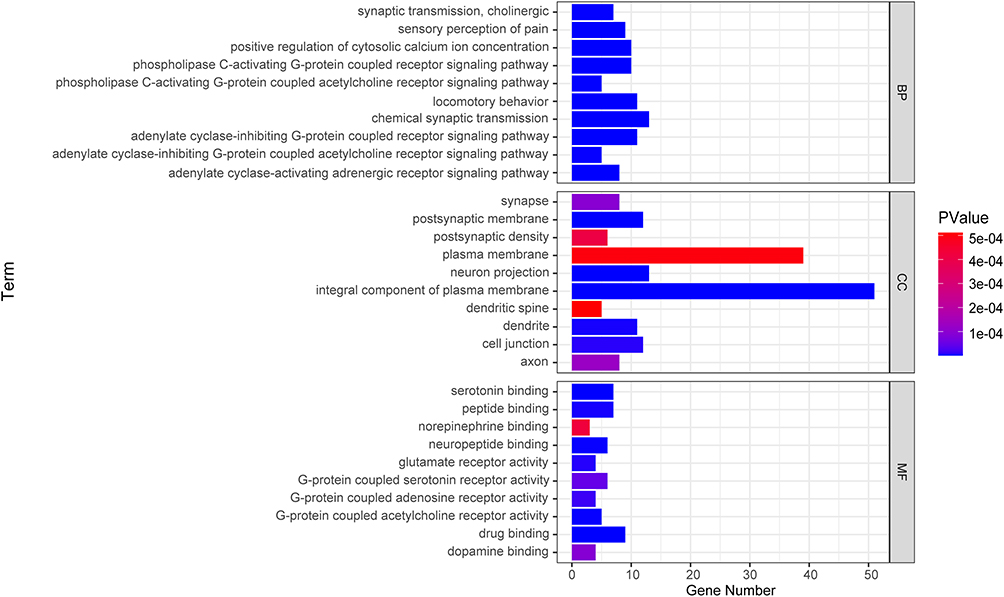 |
Figure 10 GO gene enrichment function analysis diagram. Notes: The Y axis represents the name of the gene enrichment result, and the X axis represents the number of genes. The graphic color represents the significance of the enrichment, that is, the magnitude of the P value. |
Through the enrichment analysis of target pathways related to KEGG gene annotation function analysis, 46 pathways were obtained. Among them, there were 46 pathways with P value <0.05. These pathways mainly included neuroactive ligand-receptor interactions, calcium signaling pathways, serotonergic synapses, cAMP signaling pathways, cocaine addiction, and cGMP-PKG signaling pathways. The results of the visual enrichment analysis, which were the first 20 channels of the P value in the KEGG analysis results, are shown in Figure 11.
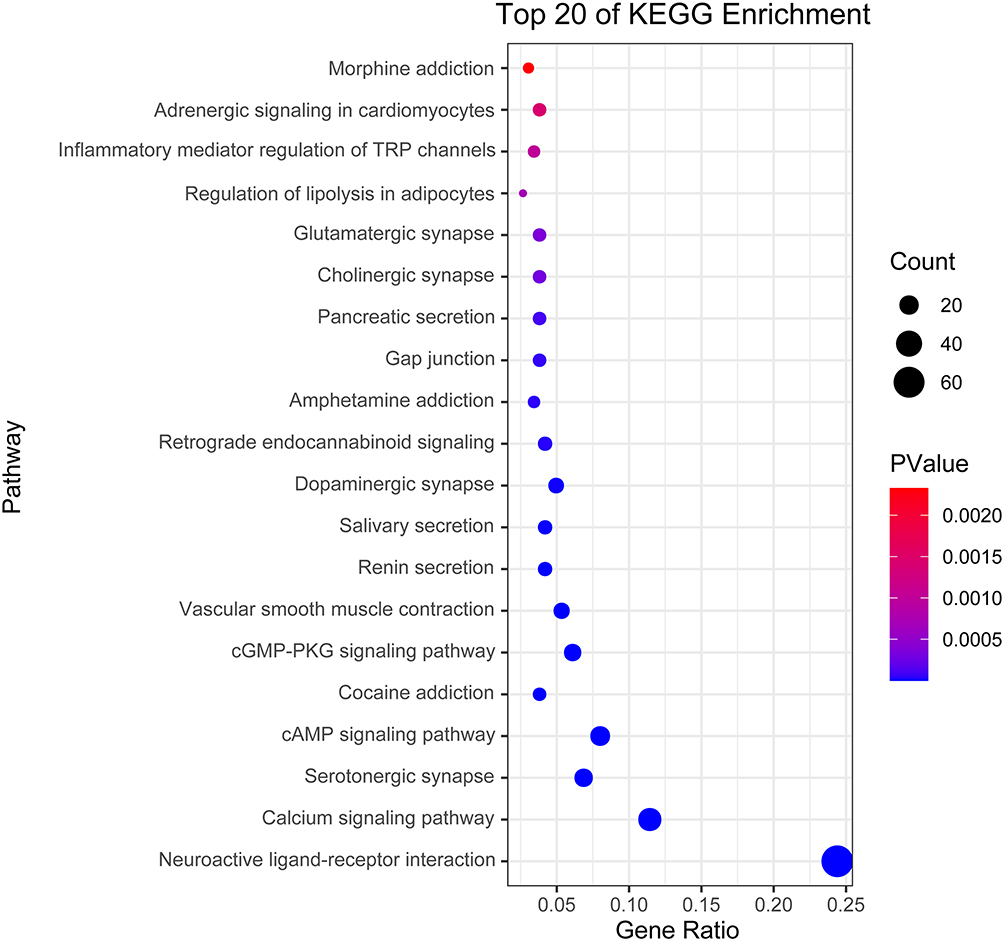 |
Figure 11 KEGG pathway enrichment analysis diagram. Notes: The Y axis represents the name of the pathway, and the X axis represents RichFactor, that is, the number of genes belonging to the pathway in the target gene/the number of all genes in the pathway in the background gene set. The size of the bubble area represents the pathway belonging to the target gene set and the number of genes. The bubble color represents the significance of enrichment, that is, the magnitude of the P value. |
Discussion
Clinical Liver Injury of Rhubarb
In addition to being used in clinical practice for constipation, rhubarb is also widely used in the clinical treatment of chronic hepatitis, cholecystitis, diabetic nephropathy, renal failure, and other diseases.38,39 However, in recent years, it has been reported that certain components in rhubarb can cause liver damage to the body, and long-term or unreasonable clinical application may cause drug-induced liver damage.40 The literature has conducted statistics on cases of TCM causing DILI in hospitals in recent years.41–44 In these studies, liver injury was determined based on the causal relationship between drugs and liver injury assessed by the RUCAM scale, which is recommended in the Guidelines for the Diagnosis and Treatment of Drug-induced Liver Injury. The proportion of DILI caused by taking Chinese herbal medicine and proprietary Chinese medicine was the highest in the cases, and the Chinese medicinal preparation containing Radix Polygoni Multiflori, Radix Notoginseng, and Radix et Rhizoma Rhei was the most likely to cause drug-induced liver injury.41 The medication time and dose should be strictly controlled in clinical use, and liver function should be closely monitored during medication.
Potential Toxic Ingredients in Rhubarb
In the present study, data mining was performed by summarizing the mass spectrum information of rhubarb components mentioned in the literature and combining with UPLC-Q-TOF/MS technology and a data postprocessing strategy, which identified 28 rhubarb components by comparing the ion fragment information of the components.45–49 Aloe-emodin, emodin, rhein, chrysophanol and physcion were found to be the main anthraquinones in rhubarb. It has been reported that anthraquinone is an effective component of rhubarb and may also be its toxic component.50 Gallic acid-3-O-(6ʹ-O-galloyl)-glucoside and procyanidin B-5,3ʹ-O-gallate are tannin components in rhubarb and are also components that cause hepatotoxicity in Polygonum multiflorum.51,52 It has been demonstrated that gallic acid is a substance that causes hepatocyte damage and may also be a potentially toxic ingredient triggering hepatotoxicity in rhubarb.53 However, the hepatotoxicity of other components in rhubarb is not clear. Therefore, the intersection targets of component targets, metabolite targets and liver injury targets in the database were used as potential targets of liver toxicity to reverse explore the components.54 The results showed that some targets of the 28 components were in the liver toxicity intersection targets.
Target Prediction of Metabolite Markers Related to Rhubarb-Induced Hepatotoxicity
The rhubarb-induced hepatotoxicity in rats can be markedly observed through biochemical and pathological results. In addition, nine biomarkers related to hepatotoxicity caused by rhubarb were obtained through metabolomics. Among them, dopamine, biopterin, choline, coenzyme Q9, cervonoyl ethanolamide and lysoPE (18:2) have been demonstrated to be related to liver injury in the literature.55–60 A previous study has shown that the incidence of liver tissue lesions and plasma aminotransferase in rats after dopamine treatment are reduced and that the survival rate is improved, suggesting that the increase in dopamine may reduce fulminant liver injury in mice.61 At the same time, experiments have shown that in liver injury caused by liver ischemia, the excitatory neurotransmission caused by norepinephrine and dopamine is suppressed.62 These results are consistent with the results of the decrease in dopamine content after liver injury in this experiment. In the present study, the choline content decreased significantly. A previous study has used methionine-choline deficiency and a high-fat diet to induce fatty liver injury, and some animal models of chronic liver injury have been generated using methionine-choline deficiency in the experiments.63,64 In a previous study, the damage to liver cells mediated by oxidative stress was prevented through the addition of coenzyme Q9, which has antioxidant activity.27 These findings also indirectly suggested that the decrease in coenzyme Q9 content in the results is correct. Biomarkers are endogenous changes in the body when affected by external factors, and they can be used as abnormal signal indicators at different biological levels.65 Therefore, the rhubarb-induced liver toxicity of the body was reflected by changes in metabolic markers, and the targets related to metabolic markers were predicted via network pharmacology.
Potential Targets of Rhubarb Hepatotoxicity and Protein–Protein Interactions
The rhubarb component targets, hepatotoxicity metabolic marker targets, and liver injury-related targets in the CTD database were crossed to obtain the potential targets of rhubarb hepatotoxicity that were used for protein interaction analysis. Protein–protein interactions (PPIs) are the basis of intracellular biological processes.66 The protein–protein interaction (PPI) network was constructed using the STRING database for potential hepatotoxic targets of rhubarb in the results. The interaction network among proteins is useful for deciphering the molecular mechanism of biological functions. In addition, the protein interaction diagram also contains systematic information and related signaling pathways.67 Through node data analysis, we identified that DRD1, DRD2, PDE4B, TRPV1, TRPM8, TRPA1, PTGER2, and CHRM3 are important nodes. GO function analysis and KEGG pathway enrichment analysis were performed on the potential targets of rhubarb-induced hepatotoxicity after protein interaction, and pathways enriched by potential targets of hepatotoxicity were analyzed.
Rhubarb-Induced Hepatotoxicity Analysis of Common Potential Targets in the KEGG Prediction Pathway
cAMP Signaling Pathway and Liver Injury
cAMP is a key second messenger molecule that regulates various cell functions, including inflammation and cell damage, by affecting gene/protein expression and function. Dopamine receptors (DRs) belong to the G-protein coupled receptor family (GPCR). Both dopamine receptor D1 (DRD1) and dopamine receptor D2 (DRD2) are expressed in hepatocytes, and their receptor agonists can increase cyclic adenosine phosphate (cAMP).68 Increased cAMP inhibits apoptosis induced by the JNK or PI3K/Akt pathway through the key conversion factor of guanine nucleotides to protect liver cells.69 Stimulating DRD1 negatively regulates the activation of NLRP3 inflammatory bodies through cAMP, thereby regulating the occurrence of inflammation.70 In addition, DR exists in a variety of immune cells, such as regulatory T cells (Tregs), effector T cells (Teffs), and NK cells. DRD1 involves the inhibition of CD4+ and CD8+ T cells. Treg cells and Teff cells produce dopamine, possibly through DRD2, to inhibit the function of their cells so that Teff cells are activated and proliferate.71 Cyclic nucleotide phosphodiesterase (PDE) regulates cAMP and cGMP levels as well as signals through its hydrolysis, thereby affecting cAMP and cGMP-dependent processes.72 The PDE4 family (PDE4B) is widely expressed in cAMP-specific PDEs, accounting for the majority of intracellular cAMP hydrolytic activity, and it is used as a target for various inflammatory diseases. The ingredients of rhubarb may inhibit DRs and PDE to promote the occurrence of inflammation and aggravate liver damage, resulting in liver toxicity.
Cholinergic Synaptic and Liver Injury
Acetylcholine (ACh) is a neurotransmitter widely distributed in the central nervous system (CNS).73 When ACh is released in a synaptic cleft, it can bind to two different types of receptors as follows: the ionic nicotinic acetylcholine receptor (nAChR) and the metabolic muscarinic acetylcholine receptor (mAChR).74 The activation of mAChRs by ACh is relatively slow, but through the subtypes of mAChRs (M1-M5), it can directly change the cellular homeostasis of phospholipase C, inositol triphosphate, cAMP, and free calcium. The key cholinergic receptor, muscarinic subtype 3 (Chrm3), is a specific gene that induces liver injury. The Chrm3 muscarinic receptor inhibits hepatocyte proliferation and increases hepatic nodules, apoptosis, and fibrosis. At the same time, Chrm3 regulates hepatocyte proliferation and apoptosis in the liver injury response.75
TRP Channel Inflammatory Mediators and Liver Injury
TRPV1, TRPM8, and TRPA1 in the TRP channel can be expressed in a subset of nociceptive ganglion neuronal cell bodies (DRGs). These channels can be indirectly regulated by inflammatory mediators (such as PGE2, NGF, and proinflammatory cytokines) produced during liver tissue damage. Prostaglandin E receptor 2 (EP2) and prostaglandin E receptor 4 (EP4) are immunomodulatory receptors with prostaglandin E2 (PGE2), which is a ligand. PGE2 inhibits the expression of cirrhotic macrophages through EP2. After liver injury, the level of PGE2 increases, and EP2 exerts an immunosuppressive effect on cirrhotic macrophages.76 Under cell death conditions, the induction of the cyclooxygenase 2 gene (COX2) increases the secretion of PGE2, which is more closely related to liver failure and the severity of liver disease.77 EP2 also plays an important role in the early stage of liver failure. As EP2 further blocks PBMCs, liver failure is negatively correlated with EP2 expression. In addition, the expression of EP2 is negatively correlated with MIP-1β. The blockade of EP2 increases the secretion of MIP-1β, indicating that the downregulation of EP2 leads to an increase in the liver failure index, MIP-1β.78 It has also been reported that during acute liver injury or liver failure, hepatocytes die and release DAMPs in the pathway to trigger further injury.79,80
Conclusion
In the present study, we found that rats treated with rhubarb extract showed a certain degree of liver damage. The metabolomics results indicated that nine metabolic biomarkers were related to hepatotoxicity caused by rhubarb. On the basis of the network pharmacology results, it can be inferred that rhubarb may cause liver toxicity due to its action on DRD1, DRD2, PDE4B, TRPV1, TRPM8, TRPA1, PTGER2, ACHE, and CHRM3 through the cAMP signaling pathway, cholinergic synapses, and inflammatory mediators that regulate TRP channels. This study provides a reference for research on rhubarb-induced hepatotoxicity and provides a basis for the safe application of rhubarb. However, the mechanism between the target and the metabolite pathway needs to be further studied.
Abbreviations
UPLC-Q-TOF/MS, ultrahigh-performance liquid chromatography-tandem quadrupole/time-of-flight mass spectrometry; DRD1, dopamine D1 receptor; DRD2, dopamine D2 receptor; PDE4B, phosphodiesterase 4B; TRPV1, vanilloid receptor; TRPM8, transient receptor potential cation channel subfamily M member 8; TRPA1, transient receptor potential cation channel subfamily A member 1; PTGER2, prostanoid EP2 receptor; ACHE, acetylcholinesterase; CHRM3, muscarinic acetylcholine receptor M3; TCM, traditional Chinese medicine; ALT, alanine aminotransferase; AST, aspartate aminotransferase; GO, gene ontology; PCA, principal component analysis; KEGG, Kyoto Encyclopedia of Genes and Genomes; PLS-DA, partial least squares discriminant analysis; PCA, principal component analysis; RSD, relative standard deviation; VIP, importance in projection; QC, quality control; ROC, receiver operating characteristic; AUC, area under curve.
Acknowledgment
This work was supported by the National Natural Science Foundation of China No. 81873194, Tianjin Talent Development Special Support Project for High Level Innovation and Entrepreneurship, and the National Natural Science Foundation of China NO. 81903933.
Disclosure
The authors declare no conflicts of interest in this work.
References
1. National Pharmacopoeia Commission. Pharmacopoeia of the People’s Republic of China. Chinese Medical Sciences and Technology Press; 2020:23–24.
2. Guo P, Zhang T, Zhu X, et al. Modern research of rhubarb toxicity and attenuating countermeasures. Chin Tradit Herb Drugs. 2009;40:1671–1674.
3. Wei L, Liu L. The toxic and side effects of rhubarb and its reasonable application in nephropathy. Chin J Nephrol Res. 2018;7:13–16.
4. Dai Z. Effects of rhubarb processed products and processing methods on its main chemical components. J Clin Ration Drug Use. 2012;5:23.
5. Dou Z, Xu B, Shi Z, et al. Hepatorenal toxicity and effect substances of rhubarb anthraquinones. J Clin Pharmacol. 2018;34:1214–1217.
6. Wan B, Zhang H, Yin JT, et al. Rhubarb vs. glycerin enema for treatment of critically ill patients with intra-abdominal hypertension. Exp Ther Med. 2017;14(1):855–861. doi:10.3892/etm.2017.4556
7. Liu D. Active Parts of Rhubarb in the Treatment of Chronic Kidney Disease and Its Mechanism of Action Against Renal Fibrosis [dissertation]. Northwest University; 2019.
8. Zhao PP, Tong JM, Zhang SF, et al. Research progress of rhubarb toxicity and its reasonable application. J Hunan Univ Tradit Chin Med. 2016;36:93–97.
9. Zhang L, Chang JH, Zhang BQ, et al. The pharmacokinetic study on the mechanism of toxicity attenuation of rhubarb total free anthraquinone oral colon-specific drug delivery system. Fitoterapia. 2015;104:86–96. doi:10.1016/j.fitote.2015.05.018
10. Hu YF, Xiang L, Wang P, et al. Modern research progress of rhubarb liver and kidney toxicity and its attenuating methods. Chin J Exp Tradit Med Formul. 2019;25:34–41.
11. Zhang PJ, Li YM, Zhang YN, et al. Application and prospect of toxicity quality markers of Chinese materia medica based on metabolomics. Chin Herb Med. 2018;10(2):108–116. doi:10.1016/j.chmed.2018.02.001
12. Liu P, Wei H, Chang J, et al. Oral colon-specific drug delivery system reduces the nephrotoxicity of rhubarb anthraquinones when they produce purgative efficacy. Exp Ther Med. 2017;14(4):3589–3601. doi:10.3892/etm.2017.4959
13. Ma LP. The Interaction Between Anthraquinones and Renal OATs and the Interaction Between Aristolochic Acid A and Intestinal Efflux Transporters [dissertation]. Zhejiang University; 2015.
14. Ren L, Zeng BY, Zhang ST, et al. Toxic effect of Rhubarb total anthraquinone on human renal tubular epithelial cells and related mechanisms. Pharmacol Clin Chin Mater Med. 2015;31:79–83.
15. Deng N, Yi Y, Liang AH. Mechanism of nephrotoxicity of rhubarb in rats. J Chin Mater Med. 2018;43:2777–2783.
16. Ren HB, Wang YY, Wang TJ. Rhubarb total anthraquinone to rat acute renal toxicity research. J Liaoning Univ Tradit Chin Med. 2012;14:69–71.
17. Wang JB, Kong WJ, Wang HJ, et al. Toxic effects caused by rhubarb (Rheum palmatum L.) are reversed on immature and aged rats. J Ethnopharmacol. 2011;134(2):216–220. doi:10.1016/j.jep.2010.12.008
18. Li SN, Yuan YF. Application of metabolomics technology in hepatotoxicity biomarkers screening. Med Recapitulate. 2017;23:
19. Chen JQ, Chen YY, Tao HJ, et al. An integrated metabolomics strategy to reveal dose-effect relationship and therapeutic mechanisms of different efficacy of rhubarb in constipation rats. J Pharm Biomed Anal. 2020;177:112837. doi:10.1016/j.jpba.2019.112837
20. Zhang CE, Niu M, Li RY, et al. Untargeted metabolomics reveals dose-response characteristics for effect of rhubarb in a rat model of cholestasis. Front Pharmacol. 2016;7:85. doi:10.3389/fphar.2016.00085
21. Zhang J, Liang R, Wang L, et al. Effects and mechanisms of Danshen-Shanzha herb-pair for atherosclerosis treatment using network pharmacology and experimental pharmacology. J Ethnopharmacol. 2019;229:104–114. doi:10.1016/j.jep.2018.10.004
22. Wu CW, Lu L, Liang SW, et al. Application of drug target prediction technology in the pharmacology of TCM networks. J Chin Mater Med. 2016;3:377–382.
23. Song W, Ni S, Fu Y, et al. Uncovering the mechanism of Maxing Ganshi decoction on asthma from a systematic perspective: a Network Pharmacology Study. Sci Rep. 2018;8(1):17362. doi:10.1038/s41598-018-35791-9
24. Ning ZC, Wang C, Liu Y, et al. A integrating strategies of herbal metabolomics, network pharmacology, and experiment validation to investigate frankincense processing effects. Front Pharmacol. 2018;9:1482. doi:10.3389/fphar.2018.01482
25. Hao J, Gao Z, Gao H, et al. Discussion on the nephrotoxicity mechanism of Tripterygium wilfordii based on network pharmacology. Chin J Exp Formul. 2019;16:142–151.
26. Wang X, Wang ZB, Luo C, et al. The prospective value of dopamine receptors on bio-behavior of tumor. J Cancer. 2019;10(7):1622–1632. doi:10.7150/jca.27780
27. Wahlang B, McClain C, Barve S, et al. Role of cAMP and phosphodiesterase signaling in liver health and disease. Cell Signal. 2018;49:105–115. doi:10.1016/j.cellsig.2018.06.005
28. Li J. Discussion on the Effect and Mechanism of Zhixiong Capsule in Treating Cerebral Arteriosclerosis Based on Network Pharmacology and Metabonomics [dissertation]. Shaanxi Academy of Traditional Chinese Medicine; 2020.
29. Cheng B. Research on the Mechanism of Danggui Sini Decoction on Rheumatoid Arthritis Disease Based on Metabolomics and Network Pharmacology [dissertation]. Guangxi Medical University; 2018.
30. Li Q. Rhubarb pharmacology and clinical applicatio. Mod J Integr Tradit Chin West Med. 2011;5:165–166.
31. Huang Q, Lu GD, Shen HM, et al. Anti-cancer properties of anthraquinones from rhubarb. Med Res Rev. 2007;27(5):609–630. doi:10.1002/med.20094
32. Bai J, Sun X, Liu Q, et al. Research on rhubarb hepatotoxicity and attenuation strategies. J Harbin Univ Commer. 2014;30:529–531.
33. Hong M, Li S, Tan HY, et al. A network-based pharmacology study of the herb-induced liver injury potential of traditional hepatoprotective chinese herbal medicines. Molecules. 2017;22(4):632. doi:10.3390/molecules22040632
34. Wang J, Song YY, Li Y, et al. Analysis of 104 cases of drug-induced liver injury. Chin Drug Appl Monit. 2020;1:
35. Li N, Lv Y, Hua H. Analysis of 152 cases of drug-induced liver injury. Chin Drug Eval. 2019;36:53–56.
36. Sun C, Xu J. Clinical analysis of 152 cases of drug-induced liver injury. Chin J Pharmacoepidemiol. 2017;26:413–416.
37. Yao F, Wang Y. Comprehensive analysis of 9355 cases of drug-induced liver injury. Anhui Med. 2011;15:1313.
38. Cai LQ. Analysis of drug-induced liver injury cases. Strait Pharm J. 2014;26:183–185.
39. Jin W, Wang YF, Ge RL, et al. Simultaneous analysis of multiple bioactive constituents inRheum tanguticum Maxim. ex Balf. by high-performance liquid chromatography coupled to tandem mass spectrometry. Rapid Commun Mass Spectrom. 2007;21(14):2351–2360. doi:10.1002/rcm.3086
40. Liu Y, Li L, Xiao YQ, et al. Global metabolite profiling and diagnostic ion filtering strategy by LC–QTOF MS for rapid identification of raw and processed pieces of Rheum palmatum L. Food Chem. 2016;192:531–540. doi:10.1016/j.foodchem.2015.07.013
41. Jiang HQ, Rong R, Lv QT. Identification of the chemical constituents of rhubarb by liquid chromatography-mass spectrometry. Lishizhen Med Mater Med Res. 2011;22:1705–1706.
42. Liu MJ, Wang Y, Li LY, et al. UPLC-Q-TOF-MS/MS rapid identification analysis of chemical constituents of Sanhuang tablets. China J Chin Mater Med. 2017;42:1685–1692.
43. Shan L, Yang N, Zhao N, et al. A rapid classification and identification method applied to the analysis of glycosides in Bupleuri radix and liquorice by ultra high performance liquid chromatography coupled with quadrupole time-of-flight mass spectrometry. J Sep Sci. 2018;41(19):3791–3805. doi:10.1002/jssc.201800619
44. Ye ZG, Zhang GP. Development, current situation and countermeasures of safety evaluation of traditional Chinese medicine. Chin J Exp Pharmacol. 2014;20:1–6.
45. Yang M. Fundamental Research on Hepatotoxicity of Polygonum Multiflorum Based on Precise Liver Sectioning Technology [dissertation]. Shanxi Medical University; 2016.
46. Song J, Ma ZJ, Wang JB, et al. Study on the effect of Polygonum multiflorum and its main components on normal human L02 hepatocyte injury. Beijing J Tradit Chin Med. 2016;35:694–697.
47. Yang X, Liu C, Yuan F, et al. Study on the mechanism of pokeweed-induced kidney injury in rats based on network toxicology. Chin Herb Med. 2019;50:4974–4984.
48. Wen FF, Xu Z, Liu LP, et al. Effect of dopamine on intracerebral glutamate uptake ability in rats with minimal hepatic encephalopathy and the pathogenesis of minimal hepatic encephalopathy. Chin J Hepatol. 2018;26:48–53.
49. Gracia-Sancho J, Maeso-Díaz R, Fernández-Iglesias A, et al. New cellular and molecular targets for the treatment of portal hypertension. Hepatol Int. 2015;9(2):183–191. doi:10.1007/s12072-015-9613-5
50. Sumioka S, Matsura T, Kasuga S, et al. Mechanisms of protection by S-allylmercaptocysteine against acetaminophen-induced liver injury in mice. Jpn J Pharmacol. 1998;78:199–207. doi:10.1254/jjp.78.199
51. Yu J, He JQ, Chen DY, et al. Dynamic changes of key metabolites during liver fibrosis in rats. World J Gastroenterol. 2019;25(8):941–954. doi:10.3748/wjg.v25.i8.941
52. Ahmad MI, Umair IM, Hussain M, et al. High fat diet incorporated with meat proteins changes biomarkers of lipid metabolism, antioxidant activities, and the serum metabolomic profile in Glrx1 −/− mice. Food Funct. 2020;11(1):236–252. doi:10.1039/C9FO02207D
53. Zhou H, Tang L, Yang Y, et al. Dopamine alleviated acute liver injury induced by lipopolysaccharide/d-galactosamine in mice. Int Immunopharmacol. 2018;61:249–255. doi:10.1016/j.intimp.2018.06.004
54. Adachi N, Inoue H, Arai T. Changes in the brain monoamine metabolism in acute liver failure produced by ischemia-reperfusion injury in rats. Crit Care Med. 1998;26(4):717–722. doi:10.1097/00003246-199804000-00021
55. Yang J, Chang N, Yang L, et al. Sphingosine 1-phosphate receptor blockade affects pro-inflammatory bone marrow-derived macrophages and relieves mouse fatty liver injury. Int J Mol Sci. 2019;20(19):4695. doi:10.3390/ijms20194695
56. Bartneck M, Fech V, Ehling J, et al. Histidine-rich glycoprotein promotes macrophage activation and inflammation in chronic liver disease. Hepatology. 2016;63(4):1310–1324. doi:10.1002/hep.28418
57. Kusumoto C, Kinugawa T, Morikawa H, et al. Protection by exogenously added coenzyme Q(9) against free radical-induced injuries in human liver cells. J Clin Biochem Nutr. 2010;46(3):244–251. doi:10.3164/jcbn.09-128
58. Li Y, Ju L, Hou Z, et al. Screening; verification; and optimization of biomarkers for early prediction of cardiotoxicity based on metabolomics. J Proteome Res. 2015;14(6):2437–2445. doi:10.1021/pr501116c
59. Olayan RS, Ashoor H, Bajic VB, Wren J. DDR: efficient computational method to predict drug-target interactions using graph mining and machine learning approaches. Bioinformatics. 2018;34(7):1164–1173. doi:10.1093/bioinformatics/btx731
60. Reddy H, Zhang S. Polypharmacology: drug discovery for the future. Expert Rev Clin Pharmacol. 2013;6(1):41–47. doi:10.1586/ecp.12.74
61. Naveed H, Hameed US, Harrus D, et al. An integrated structure and system-based framework to identify new targets of metabolites and known drugs. Bioinformatics. 2015;31:3922–3929. doi:10.1093/bioinformatics/btv477
62. Qi YJ, Balem F, Faloutsos C, et al. Protein complex identification by supervised graph local clustering. Bioinformatics. 2008;24(13):i250–258. doi:10.1093/bioinformatics/btn164
63. Lemer C, Antezana E, Couche F, et al. The aMAZE LightBench: a web interface to a relational database of cellular processes. Nucleic Acids Res. 2004;32(90001):D443–448. doi:10.1093/nar/gkh139
64. Xu JJ, Wang SY, Chen Y, et al. Dopamine D1 receptor activation induces dehydroepiandrosterone sulfotransferase (SULT2A1) in HepG2 cells. Acta Pharmacol Sin. 2014;35(7):889–898. doi:10.1038/aps.2014.19
65. Yan Y, Jiang W, Liu L, et al. Dopamine controls systemic inflammation through inhibition of NLRP3 inflammasome. Cell. 2015;160(1–2):62–73. doi:10.1016/j.cell.2014.11.047
66. Kimura H, Imura YK, Tomiyasu H, et al. Neural anti-inflammatory action mediated by two types of acetylcholine receptors in the small intestine. Sci Rep. 2019;9(1):5887. doi:10.1038/s41598-019-41698-w
67. Khurana S, Shah N, Cheng K, et al. Scopolamine treatment and muscarinic receptor subtype-3 gene ablation augment azoxymethane-induced murine liver injury. J Pharmacol Exp Therapeutics. 2010;333(3):639–649. doi:10.1124/jpet.109.165118
68. O’Brien AJ, Fullerton JN, Massey KA, et al. Immunosuppression in acutely decompensated cirrhosis is mediated by prostaglandin E2. Nat Med. 2014;20(5):518–523. doi:10.1038/nm.3516
69. Claria J, Stauber RE, Coenraad MJ, et al. Systemic infammation in decompensated cirrhosis: characterization and role in acute-on-chronic liver failure. Hepatology. 2016;64(4):1249–1264. doi:10.1002/hep.28740
70. Wang Y, Chen C, Qi J, et al. Altered PGE2-EP2 is associated with an excessive immune response in HBV-related acute-on-chronic liver failure. J Transl Med. 2019;17(1):93. doi:10.1186/s12967-019-1844-0
71. Zheng SJ, Liu S, Liu M, et al. Prognostic value of m30/m65 for outcome of hepatitis b virus-related acute-on-chronic liver failure. World J Gastroenterol. 2014;20(9):2403–2411. doi:10.3748/wjg.v20.i9.2403
72. Hangai S, Ao T, Kimura Y, et al. PGE2 induced in and released by dying cells functions as an inhibitory DAMP. Proc Natl Acad Sci USA. 2016;113(14):3844–3849. doi:10.1073/pnas.1602023113
73. Chai BJ, Li X, Su JW. Subacute toxicity of Rhubarb total extract in rats. Pharm Clin Res. 2011;19:322–324.
74. Lou YH, Wang JS, Dong G, et al. The acute hepatotoxicity of tacrine explained by 1H NMR based metabolomic profiling. Toxicol Res. 2015;4(6):1465–1478. doi:10.1039/C5TX00096C
75. Li Y, Wang L, Ju L, et al. A systematic strategy for screening and application of specific biomarkers in hepatotoxicity using metabolomics combined with ROC curves and SVMs. Toxicol Sci. 2016;150(2):390–399. doi:10.1093/toxsci/kfw001
76. Liu YT, Jia HM, Chang X, et al. Metabolic pathways involved in Xin-Ke-Shu protecting against myocardial infarction in rats using ultra high-performance liquid chromatography coupled with quadrupole time-of-flflight mass spectrometry. J Pharm Biomed Anal. 2014;90:35–44. doi:10.1016/j.jpba.2013.11.008
77. Duan L, Guo L, Liu K, et al. Characterization and classifification of seven citrus herbs by liquid chromatography-quadrupole time-of-flflight mass spectrometry and genetic algorithm optimized support vector machines. J Chromatogr A. 2014;1339:118–127. doi:10.1016/j.chroma.2014.02.091
78. Liu L, Xu SX, Zhang JP, et al. Based on the network pharmacology method to explore the mechanism of treatment of atherosclerosis with Simiao Yongan decoction. Chin J Tradit Med. 2019;37:
79. Xie J, Dong W, Liu R, et al. Research on the hepatotoxicity mechanism of citrate-modified silver nanoparticles based on metabolomics and proteomics. Nanotoxicology. 2018;12(1):18–31. doi:10.1080/17435390.2017.1415389
80. Zeng J, Yin PY, Tan YX, et al. Metabolomics study of hepatocellular carcinoma: discovery and validation of serum potential biomarkers by using capillary electrophoresis-mass spectrometry. J Proteome Res. 2014;13(7):3420–3431. doi:10.1021/pr500390y
 © 2021 The Author(s). This work is published and licensed by Dove Medical Press Limited. The
full terms of this license are available at https://www.dovepress.com/terms
and incorporate the Creative Commons Attribution
- Non Commercial (unported, 3.0) License.
By accessing the work you hereby accept the Terms. Non-commercial uses of the work are permitted
without any further permission from Dove Medical Press Limited, provided the work is properly
attributed. For permission for commercial use of this work, please see paragraphs 4.2 and 5 of our Terms.
© 2021 The Author(s). This work is published and licensed by Dove Medical Press Limited. The
full terms of this license are available at https://www.dovepress.com/terms
and incorporate the Creative Commons Attribution
- Non Commercial (unported, 3.0) License.
By accessing the work you hereby accept the Terms. Non-commercial uses of the work are permitted
without any further permission from Dove Medical Press Limited, provided the work is properly
attributed. For permission for commercial use of this work, please see paragraphs 4.2 and 5 of our Terms.