Back to Journals » Neuropsychiatric Disease and Treatment » Volume 14
Structural and functional brain abnormalities in drug-naive, first-episode, and chronic patients with schizophrenia: a multimodal MRI study
Authors Wu F ![]() , Zhang Y, Yang Y, Lu X, Fang Z, Huang J, Kong L, Chen J, Ning Y, Li X, Wu K
, Zhang Y, Yang Y, Lu X, Fang Z, Huang J, Kong L, Chen J, Ning Y, Li X, Wu K ![]()
Received 16 May 2018
Accepted for publication 16 August 2018
Published 30 October 2018 Volume 2018:14 Pages 2889—2904
DOI https://doi.org/10.2147/NDT.S174356
Checked for plagiarism Yes
Review by Single anonymous peer review
Peer reviewer comments 3
Editor who approved publication: Dr Roger Pinder
Fengchun Wu,1,2,* Yue Zhang,2,3,* Yongzhe Yang,2–4 Xiaobing Lu,1,2 Ziyan Fang,1 Jianwei Huang,1 Lingyin Kong,3 Jun Chen,5,6 Yuping Ning,1,2 Xiaobo Li,7,8 Kai Wu2,3,5,6,9
1Department of Psychiatry, The Affiliated Brain Hospital of Guangzhou Medical University (Guangzhou Huiai Hospital), Guangzhou, China; 2Guangdong Engineering Technology Research Center for Translational Medicine of Mental Disorders, Guangzhou, China; 3Department of Biomedical Engineering, School of Materials Science and Engineering, South China University of Technology (SCUT), Guangzhou, China; 4School of Medicine, South China University of Technology (SCUT), Guangzhou, China; 5Guangdong Engineering Technology Research Center for Diagnosis and Rehabilitation of Dementia, Guangzhou, China; 6National Engineering Research Center for Healthcare Devices, Guangzhou, China; 7Department of Biomedical Engineering, New Jersey Institute of Technology, NJ, USA; 8Department of Electric and Computer Engineering, New Jersey Institute of Technology, NJ, USA; 9Department of Nuclear Medicine and Radiology, Institute of Development, Aging and Cancer, Tohoku University, Sendai, Japan
*These authors contributed equally to this work
Background: Structural and functional brain abnormalities in schizophrenia (SZ) have been widely reported. However, a few studies have investigated both structural and functional characteristics in SZ patients at different stages to understand the neuropathology of SZ.
Methods: In this study, we recruited 44 first-episode drug-naive SZ (FESZ) patients, 44 medicated chronic SZ (CSZ) patients, and 56 normal controls (NCs) and acquired their structural and resting-state functional magnetic resonance imaging (MRI). We then made group comparisons on structural and functional characteristics, including regional gray matter volume (GMV), regional homogeneity, amplitude of low-frequency fluctuation, and degree centrality. A linear support vector machine (SVM) combined with a recursive feature elimination (RFE) algorithm was implemented to discriminate three groups.
Results: Our results indicated that the regional GMV was significantly decreased in patients compared with that in NCs; CSZ patients have more diffused GMV decreases primarily involved in the frontal and temporal lobes when compared with FESZ patients. Both FESZ and CSZ patients showed significant functional alterations compared with NCs; when compared with FESZ patients, CSZ patients showed significant reductions in functional characteristics in several brain regions associated with auditory, visual processing, and sensorimotor functions. Moreover, a linear SVM combined with a RFE algorithm was implemented to discriminate three groups. The accuracies of the three classifiers were 79.80%, 83.16%, and 81.71%, respectively. The performance of classifiers in this study with multimodal MRI was better than that of previous discriminative analyses of SZ patients with single-modal MRI.
Conclusion: Our findings bring new insights into the understanding of the neuropathology of SZ and contribute to stage-specific biomarkers in diagnosis and interventions of SZ.
Keywords: multimodal MRI, schizophrenia, support vector machine, SVM, classification
Introduction
Schizophrenia (SZ) is a chronic psychiatric disorder with a heterogeneous genetic and neurobiological background that influences early brain development and is expressed as a combination of psychotic symptoms such as hallucinations, delusions, and cognitive dysfunction.1,2 With the advances in noninvasive brain imaging technologies, such as multimodal magnetic resonance imaging (MRI), structural and functional brain abnormalities have been increasingly reported in both first-episode and chronic stages of SZ.3–7
A number of structural MRI studies have reported that first-episode drug-naive SZ (FESZ) patients have enlarged lateral and third ventricles, increased basal ganglia volume, and reduced gray matter volume (GMV) of the whole brain, corpus callosum, hippocampus, and frontal and temporal lobes compared with normal controls (NCs),8–12 whereas the most frequently reported functional alterations in FESZ are located in medial and dorsolateral prefrontal areas, thalamus (THA), and superior temporal gyrus (STG).13–16 Numerous structural MRI studies have demonstrated that chronic SZ (CSZ) patients have abnormalities in the frontal and temporal lobes, hippocampus, and amygdala and exclusively in the basal ganglia.17–25 Importantly, these commonly observed structural abnormalities in CSZ patients are found to be associated with the usage of antipsychotic medication17,26,27 and illness duration without the confounding effects of antipsychotic medication.28,29 On the other hand, numerous existing functional MRI (fMRI) studies have demonstrated widespread cortical and subcortical functional alterations in CSZ patients, which are associated with cognitive and behavioral impairments.30,31
A meta-analysis of 27 structural MRI studies have indicated that SZ is associated with progressive structural brain abnormalities affecting both gray and white matter (WM).32 A multisite cross-sectional voxel-based morphometry (VBM) study in first-episode and CSZ patients have showed that structural brain abnormalities are more widespread in CSZ compared to first-episode patients, suggesting the potential impact of antipsychotic medication on structural brain abnormalities.33 Recently, a structural MRI study has indicated that accelerated gray and WM deterioration with age is found in SZ and suggested that SZ is characterized by an initial, rapid rate of gray matter (GM) loss that is slow in middle life, followed by the emergence of a deficit in WM that progressively worsens with age at a constant rate.34 Moreover, a resting-state fMRI (rs-fMRI) study has found a focal area of functional anomaly in the left inferior frontal gyrus (IFG; Broca’s area) in FESZ patients, whereas many other cortical and subcortical areas have functional alterations, prominently involving the THA, in CSZ patients.35
However, a few studies have investigated both structural and functional characteristics in SZ patients at different stages to understand the neuropathology of SZ. More recently, a meta-analysis of multivariate pattern recognition (MPR) studies has indicated the utility of MPR approaches for the identification of reliable neuroimaging-based biomarkers and suggested that brain functional and structural alterations differentiate SZ patients from healthy controls with 80% sensitivity and specificity.36 The aims of this study are to 1) analyze both structural and functional characteristics in three groups (FESZ, CSZ, and NCs), including regional GMV, regional homogeneity (ReHo), amplitude of low-frequency fluctuation (ALFF), and degree centrality (DC), and 2) discriminate the three groups by using a linear support vector machine (SVM) combined with a recursive feature elimination (RFE) algorithm. We hypothesize that 1) structural and functional brain abnormalities are widespread in both the FESZ and CSZ groups and 2) these abnormalities are critical for the discrimination of three groups.
Materials and methods
Subjects
Forty-four FESZ patients (the FESZ group), 44 CSZ patients (the CSZ group), and 56 NCs (the NC group) were included in this study. The SZ patients were diagnosed by trained and experienced clinical psychiatrists according to the structured clinical interview according to Diagnostic and Statistical Manual of Mental Disorders-IV-Text Revision (DSM-IV-TR) (SCID) criteria.37 The FESZ, CSZ, and NC groups were recruited from Guangzhou Brain Hospital and the local community, respectively. All subjects were aged between 18 and 45 years, and their biological parents were Han Chinese. Before scanning, a clinical assessment was performed by psychiatrists using the Positive and Negative Syndrome Scale (PANSS).38 The subjects obtained a consensus score for each item on all three subscales (positive symptoms, negative symptoms, and general psychopathology) that were based on a seven-point scale indicating the severity of the symptom (1=absent; 2=minimal; 3=mild; 4=moderate; 5=moderate severe; 6=severe; 7=extreme).39 The inclusion criteria for all SZ patients were 1) a total score of at least 60 for the three PANSS subscales and 2) at least three positive symptom items on the PANSS with a score of at least 4. In addition, the FESZ patients were recruited the first time when they were seeking help because of psychotic symptoms and did not take any antipsychotic drugs, and all CSZ patients were taking antipsychotic drugs and the course of disease is more than 2 years.
The exclusion criteria for all subjects included: 1) any other psychiatric Axis I disorder meeting DSM-IV criteria, including schizoaffective disorders, mental retardation, major depressive disorder, bipolar disorder, delirium, dementia, memory disorder, and other cognitive disorders; 2) mental disorder due to substance dependence, a seriously unstable somatic disease, definite diabetes, thyroid diseases, hypertension, or heart disease; 3) narrow-angle glaucoma; 4) a history of epilepsy, except for febrile convulsions; 5) alcohol dependence meeting DSM-IV-TR criteria (excluding nicotine dependence); 6) having received electroconvulsive therapy in the past six months; 7) a contraindication for MRI; 8) medical resource neuroleptic malignant syndrome or serious tardive dyskinesia; 9) a serious suicide attempt or an irritative state; 10) noncompliant drug administration or a lack of legal guardians; or 11) lactating, pregnant, or planning to become pregnant. In addition, the NCs were excluded if they had a first- or second-degree relative with a psychiatric Axis I disorder according to the DSM-IV criteria. Before enrollment, all subjects or their legal guardians provided written informed consent. In case of a patient in acute stage and without the capacity for civil conduct diagnosed by a professional psychiatrist, the legal guardian of the patient was permitted to provide the informed consent on behalf of the patient. These studies were performed according to the Declaration of Helsinki and approved by the ethics committees of the Guangzhou Brain Hospital.
MRI data acquisition
MRIs were acquired using a Philips 3T MR system (Philips, Achieva, the Netherlands) located at Guangzhou Brain Hospital. The participants were instructed to keep their eyes closed, to relax but not fall asleep, and to move as little as possible. For each subject, the rs-fMRI data were collected using an echo-planar imaging (EPI) sequence (64×64×33 matrix with 3.44×3.44×4.6 mm3 spatial resolution, echo time=30 ms, time to repeat=9,000 ms, acquisition time=2,000 ms, flip angle=90°, field of view=211×211 mm2). The structural MRI data were obtained using a sagittal three-dimensional gradient-echo T1-weighted sequence (256×256×188 matrix with the spatial resolution of 1×1×1 mm3, repetition time=8.2 ms, echo time=3.8 ms, flip angle=7°).
Image processing
Unless otherwise stated, all T1-weighted MRI data processing was performed using the SPM8 software package (http://www.fil.ion.ucl.ac.uk/spm; Institute of Neurology, University College London, London, UK). First, each T1-weighted MRI was segmented into three tissue maps, including GM, WM, and cerebrospinal fluid (CSF) by using the new segmentation algorithm from SPM8. Second, a customized, population-specific template was created from the segmented tissue maps using the DARTEL template creation tool. Third, all GM maps were warped to the custom template space, using its corresponding smooth, reversible deformation parameters. A modulation was applied by locally multiplying tissue values by the Jacobian determinants derived from the special normalization step.40 Finally, all warped, modulated GM and WM images were smoothed with an 8 mm full width at half maximum (FWHM) Gaussian kernel. Next, we parcellated the entire cerebrum into 1,024 regions of interest (ROIs) with equal sizes using a high-resolution automated anatomical labeling (AAL) atlas,41 which was defined from the standard AAL atlas including 90 cerebral regions.42 We then calculated the regional GMV in each of the 1,024 ROIs from the modulated GM images.
Individual rs-fMRIs were preprocessed using SPM8 (http://www.fil.ion.ucl.ac.uk/spm; Institute of Neurology, University College London) and Data Processing & Analysis for Brain Imaging (DPABI).43 First, the first 10 volumes of each functional time series were discarded because the initial signal is unstable. Second, the remaining volumes were corrected for different signal acquisition times and realigned to the first volume to correct for head motion. Then, all functional volumes were normalized using EPI templates and resampled to 3 mm isotropic voxels. The resampled data were bandpass (0.01–0.08 Hz) filtered to reduce low-frequency drift and high-frequency physiological noise and spatially smoothed with a 4 mm FWHM Gaussian kernel. Five CSZ patients and one FESZ patient were excluded from further analyses due to excessive head motion (>2 mm or 2° during realignment) and mean motion (>0.2 mm during framewise assessment).
The ReHo method was used to measure the functional synchronization of a voxel with its close neighbors during resting state.44 In our study, the ReHo value of each voxel was denoted by the Kendall’s coefficient of concordance (KCC) of the time series of this voxel with its 26 nearest neighbors.45 The raw ReHo value of each voxel was then divided by the global mean ReHo value for each subject to reduce the global effects of variability across participants.46 Next, the individual ReHo maps were partitioned into 1,024 ROIs, and the mean ReHo value of each region was acquired by averaging the ReHo values within that region.
The ALFF measured the regional spontaneous neuronal activity.47 Each preprocessed fMRI data set was transformed to a frequency domain with a fast Fourier Transform (FFT). The square root of the power spectrum was calculated, and the ALFF was obtained as the averaged square root across 0.01–0.08 Hz. The ALFF value of each voxel was then divided by the global mean ALFF value for each participant to reduce the global effects. Regional ALFF values in each of the 1,024 ROIs were calculated in the same way as ReHo analyses.
The DC measured the mean correlation between a given ROI and all other ROIs in the functional brain network.44 Before DC analysis, the WM, CSF, and global signals were regressed out from smoothed and filtered time series to reduce respiratory and cardiac effects. Then, a Pearson correlation coefficient-based pairwise functional connectivity map among the 1,024 ROIs (as stated above) was created. The DC of ROI i was defined as follows:
|
|
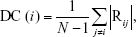
where Rij is the functional connectivity among ROI i and ROI j, and N is the number of ROIs. An ROI with a higher DC value means that this ROI was functionally more connected with other ROIs than an ROI with a lower DC value.
Statistical analyses
Group differences in age, years of education, and total brain volume (TBV) were analyzed using one-way ANOVA with SPSS 22.0 software. Post hoc analysis was performed using Scheffé’s method. Chi-squared tests were used to analyze gender data. Statistical significance was set at P<0.05. Regional GMV, ReHo, ALFF, and DC differences in the 1,024 ROIs among three groups were tested by ANCOVA. The covariates included age, gender, years of education, and TBV in this model. The significance level of the resulting statistical map was P<0.05, corrected by the false discovery rate (FDR).
Discrimination analyses
The analytical pipeline for the classification approach is shown in Figure 1. In this study, SVM with RFE was applied to discriminate FESZ patients from NCs, CSZ patients from NCs, and FESZ patients from CSZ patients. The mean GMV, ReHo, ALFF, and DC of the 1,024 ROIs from each subject were used as input features for learning. SVM is an effective classification method based on the structural risk minimization principle,48 which initially places the input features in a high-dimension feature space.49 In the feature space, the machine searches for an optimal hyperplane, which maximizes the distance from the hyperplane to the closest examples in each class to classify different groups. Once the hyperplane is found, it can be used to predict the group label of a new testing example. The symbols (+) and (−) are used to represent two classes. Given the nature of the input features, a linear decision function was applied. The weight vector and bias value are represented by w and b, respectively.
 | Figure 1 Flow diagram of the classification approach employed in this study. |
The decision function is expressed as follows:
|
|

If D(x)>0, x belonged to class (+); if D(x)<0, x belonged to class (−), or else x was on the decision boundary. A linear kernel SVM implemented in the Library for Support Vector Machines toolbox was used in this study.50
In machine learning, some features are uninformative, irrelevant, or redundant for classification, and too many features may cause “overfitting”. Therefore, eliminating a number of features not only simplifies the classification model but also improves the classification accuracy.51 The SVM-RFE algorithm uses the SVM classifier to iteratively remove redundant features while preserving discriminative features. RFE is an iterative procedure that trains the classifier and removes the smallest ranking criterion feature after ranking.52 We chose the square of the feature weights wi  of the decision function as the ranking criterion. Clearly, the smaller weight of a feature means less contribution to the decision function. In each iteration, we computed the ranking criteria for all features and eliminated the feature corresponding to the smallest . We obtained a discriminate feature list after n iterations.
In our study, 10-fold cross-validation was used to evaluate the performance of the SVM-RFE algorithm. In machine learning, 10-fold cross-validation is the most common method53 because it depends less on sample characteristics.54 Briefly, in each trial, input features were partitioned into 10 equal-sized subsamples. The SVM-RFE classifier used 9-folds of data to learn a model, and subsequently, the trained model was used to predict the labels of data in the validation fold.
For each classifier, the classification rule is based on the determination of the separating hyperplane. It has been shown that the coefficients of the discrimination hyperplane quantify the amount of discriminative feature information.55,56 We then normalized the coefficients by dividing by the maximum coefficient value. Finally, we averaged the ROI weights in each type of feature (GMV, ReHo, ALFF, and DC). The higher the feature weights were determined to be, the more discriminative the corresponding features. The most discriminative features were restricted to those that appeared in every fold of cross-validation. Each classifier feature weight was an average of all folds of cross-validation. Thus, for all 1,024 ROIs, we obtained the order of their contribution to the classification.
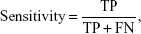
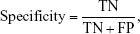
Furthermore, we plotted the receiver operating characteristic (ROC) curves and calculated the area under the ROC curve (AUC) to examine the possibility of correctly discriminating FESZ patients from NCs, CSZ patients from NCs, and FESZ patients from CSZ patients. The AUC value is between 0 and 1. It is generally believed that a value close to 1 indicates better prediction performance. In addition to the accuracy and AUC, we measured the sensitivity and specificity to quantify the performance of the SVM. The definitions of sensitivity, specificity, and accuracy are as follows:
|
|
|
|
|
|
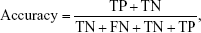
where TP is true positive, the number of positive subjects classified as positive; FN is false negative, the number of positive subjects classified as negative; TN is true negative, the number of negative subjects classified as negative; and FP is false positive, the number of negative subjects classified as positive.
A permutation test was applied to evaluate the statistical significance of the classification results.57 A permutation test is a type of nonparametric test and can be used to test a null hypothesis.58 In our analysis, we permuted the class labels of the training data 1,000 times randomly and performed all classification processes with each set of permuted class labels. Based on the probability distributions, it is possible to test the null hypothesis indicated by a small P-value. The P-value was computed as the proportion of accuracies that were not less than the accuracy obtained by the original data. The statistical significance was set at P<0.05.
Results
Clinical and demographic characteristics
The clinical and demographic characteristics of all subjects are shown in Table 1. There was no significant difference in gender or TBV among the FESZ, CSZ, and NC groups (P>0.05). However, there was significant difference in age between NC and CSZ groups (P<0.05); there was significant difference in years of education between FESZ and NC groups (P<0.05). The positive, negative, general, and total scores of the PANSS in the FESZ and CSZ groups were significantly higher than those in the NC group (P<0.0001).
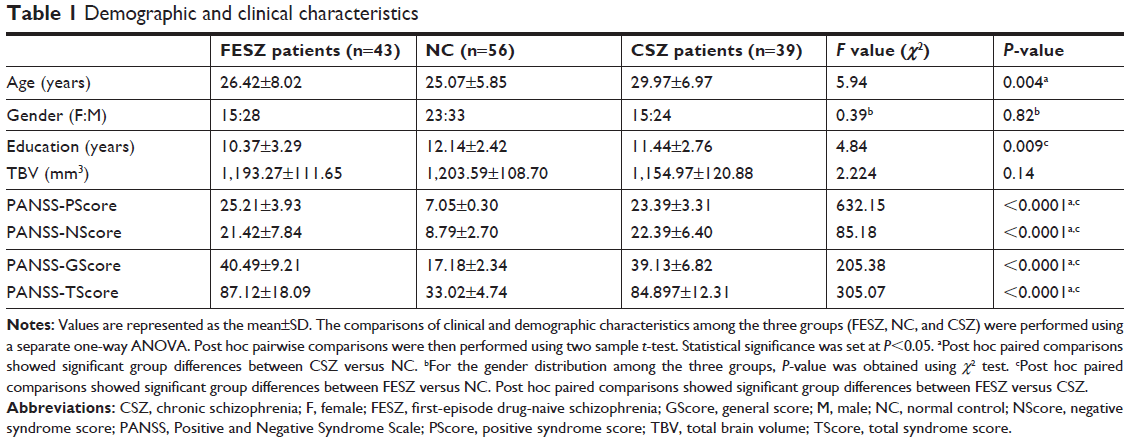 | Table 1 Demographic and clinical characteristics |
ROI analysis of GMV
The ROI analysis indicated that the FESZ group showed significant GMV reductions in the right fusiform gyrus (FFG), the left middle occipital gyrus (MOG), the left posterior cingulate gyrus (PCG), and the left parahippocampal gyrus (PHG) as well as significant GMV increases in the left postcentral gyrus (PoCG) and the right cuneus (CUN) when compared with the NC group (Figure 2I-A; Table S1). The CSZ group showed significant GMV reductions in the left STG, the right lingual gyrus (LING), the bilateral MOG, the left PCG, and the left superior frontal gyrus (SFG) as well as significant GMV increases in the left THA, the left PoCG, and the right precuneus (PCUN), when compared with the NC group (Figure 2II-A; Table S1). The CSZ group showed significant GMV reductions in the left STG and the right medial superior frontal gyrus (SFGmed) when compared with the FESZ group (Figure 2III-A; Table S1).
 | Figure 2 Between-group differences in the regional GMV (A), ReHo (B), ALFF (C), and DC (D). |
ROI analysis of ReHo
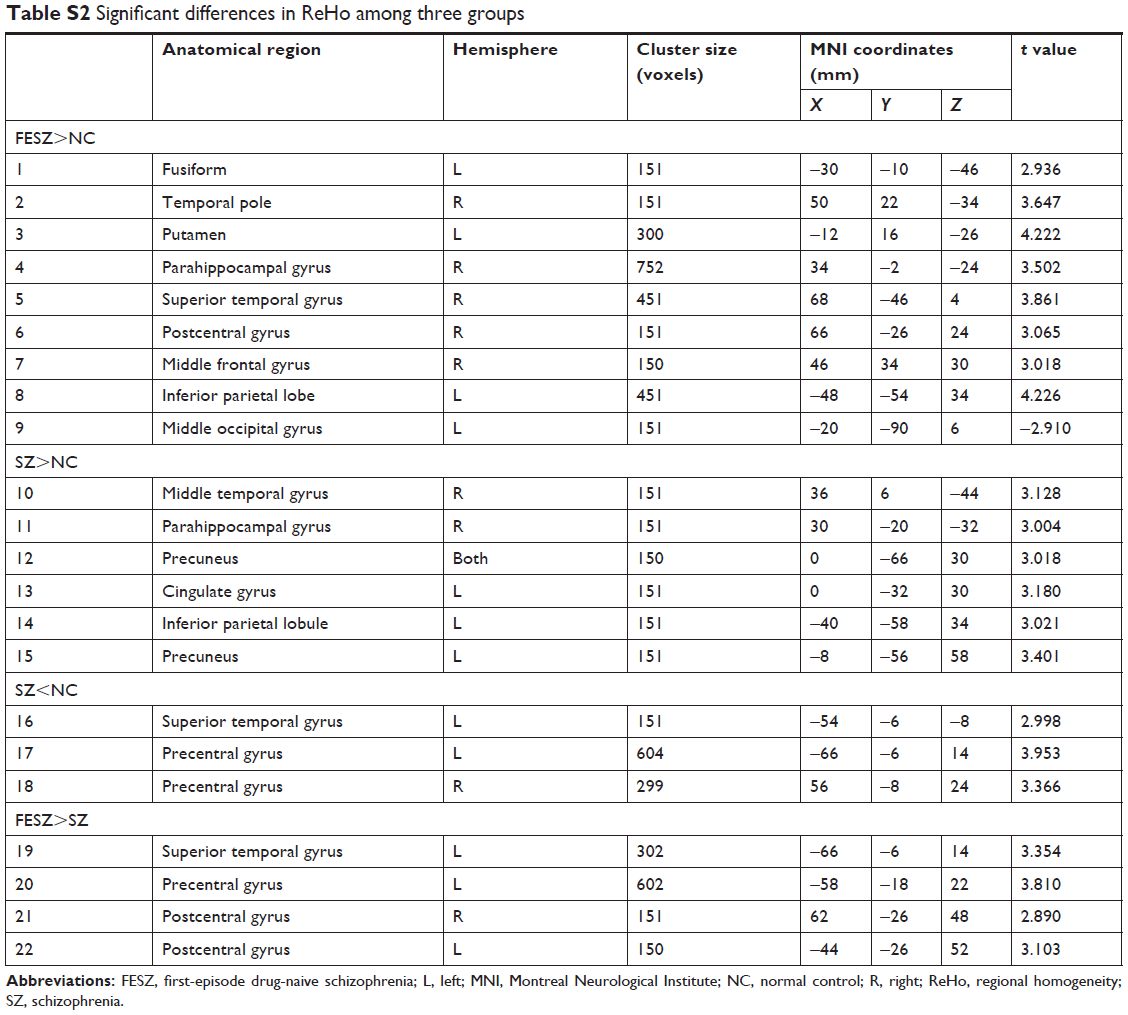
The ROI analysis indicated that the FESZ group showed significant ReHo reductions in the left MOG as well as significant ReHo increases in the left FFG, the right temporal pole (TPO), the left putamen (PUT), the right PHG, the right STG, the right PoCG, the right middle frontal gyrus (MFG), and the left inferior parietal lobule (IPL) when compared with the NC group (Figure 2I-B; Table S2). The CSZ group showed significant ReHo reductions in the left STG and the bilateral precentral gyrus (PreCG) as well as significant ReHo increases in the right middle temporal gyrus (MTG), the right PHG, the right PCUN, the left PCG, the left IPL, and the left PCUN when compared with the NC group (Figure 2II-B; Table S2). The CSZ group showed significant ReHo reductions in the left STG, the left PreCG, and the bilateral PoCG when compared with the FESZ group (Figure 2III-B; Table S2).
ROI analysis of ALFF
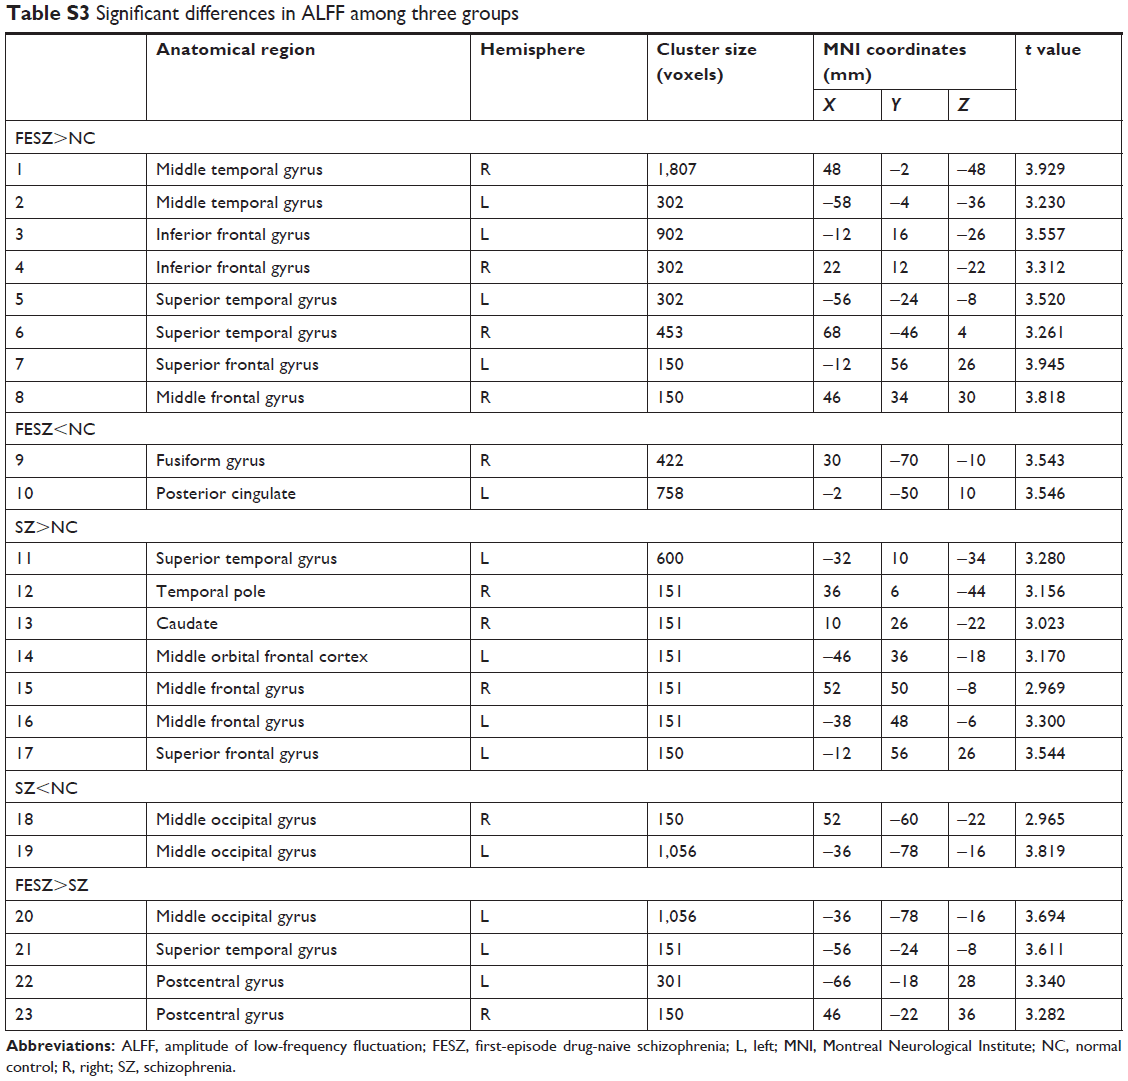
The ROI analysis indicated that the FESZ group showed significant ALFF reductions in the right FFG and the left PCG as well as significant ALFF increases in the bilateral MTG, the bilateral IFG, the bilateral STG, and the bilateral SFG when compared with the NC group (Figure 2I-C; Table S3). The CSZ group showed significant ALFF reductions in the bilateral MOG as well as significant ALFF increases in the left STG, the right TPO, the right caudate (CAU), the left middle orbital frontal cortex (ORB), the bilateral MFG, and the bilateral SFG when compared with the NC group (Figure 2II-C; Table S3). The CSZ group showed significant ALFF reductions in the left MOG, the left STG, and the bilateral PoCG when compared with the FESZ group (Figure 2III-C; Table S3).
ROI analysis of DC
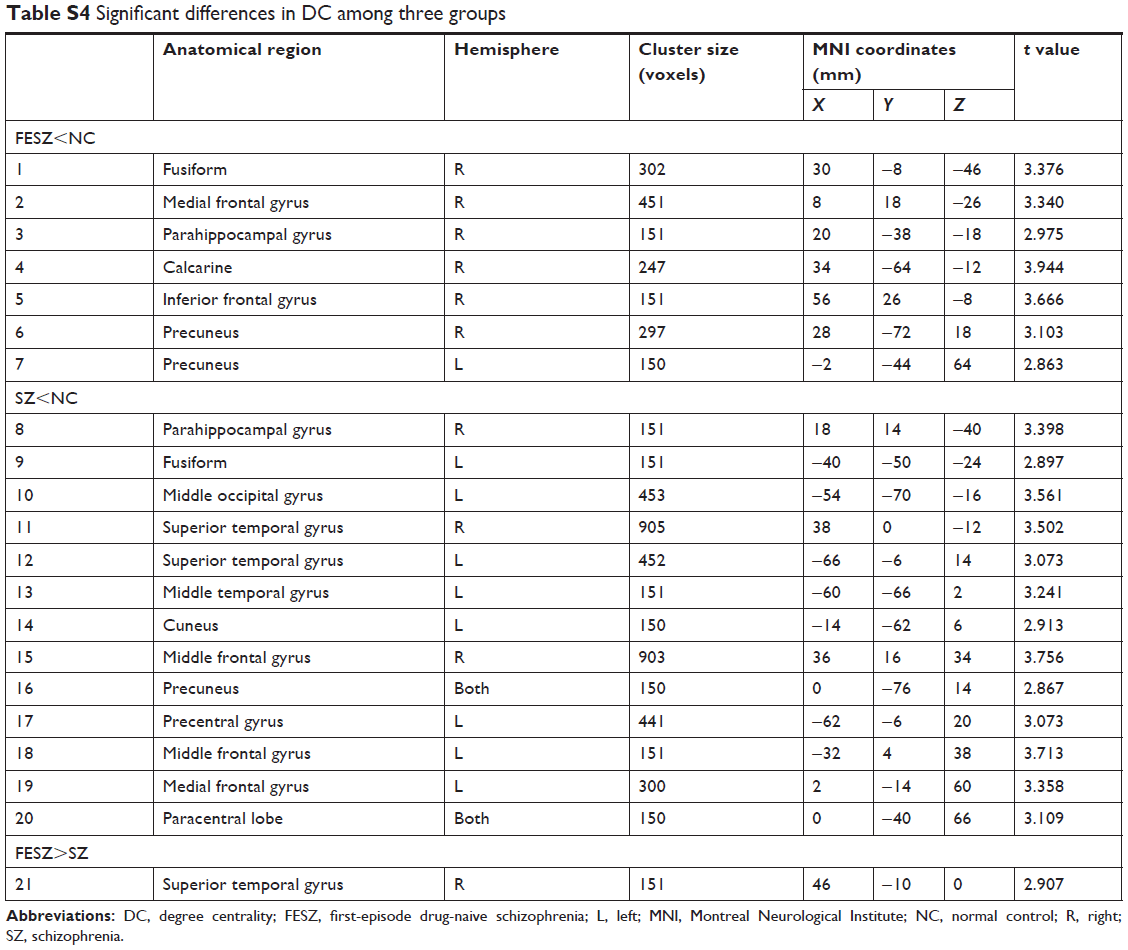
The ROI analysis indicated that the FESZ group showed significant DC reductions in the right FFG, the right SFGmed, the right PHG, the right calcarine (CAL) cortex, the right IFG, and the bilateral PCUN when compared with the NC group (Figure 2I-D; Table S4). The CSZ group showed significant DC reductions in the right PHG, the left FFG, the left MOG, the bilateral STG, the left MTG, the left CUN, the bilateral MFG, the bilateral PCUN, the left PreCG, the left SFGmed, and paracentral lobule (PCL) when compared with the NC group (Figure 2II-D; Table S4). The CSZ group showed significant DC reductions in the right STG when compared with the FESZ group (Figure 2III-D; Table S4).
Discriminative analyses
Automatic classifications were performed to distinguish any two groups among the FESZ, CSZ, and NC groups. We combined the measurements of GMV, ReHo, ALFF, and DC in the 1,024 ROIs as the input features of the classifiers. In the classification between the FESZ and NC groups, the linear SVM with RFE classifier achieved an accuracy of 79.80%, a sensitivity of 72.09%, and a specificity of 85.71% (P<0.05). In the classification between the CSZ and NC groups, the linear SVM with RFE classifier yielded better classification performance with an accuracy of 83.16%, a sensitivity of 71.79%, and a specificity of 91.07% (P<0.05). In the classification between the FESZ and CSZ groups, the linear SVM with RFE classifier achieved classification performance with an accuracy of 81.71%, a sensitivity of 88.37%, and a specificity of 74.36% (P<0.05). Taking each testing subject’s discriminative score as a threshold, the ROC curves are shown in Figure 3. AUCs of the three classifiers were 0.88, 0.92, and 0.87, respectively (Table 2).
 | Figure 3 Classification results. |
 | Table 2 Classification performances |
Discussion
Our main findings were as follows: 1) the regional GMV was significantly decreased in patients compared with NCs, and the CSZ patients have more diffused GMV decreases compared with FESZ patients; 2) both FESZ and CSZ patients showed significant functional alterations compared with NCs; especially, CSZ patients showed significant reductions in functional characteristics in the auditory, visual processing, and sensorimotor systems when compared with FESZ patients; 3) the accuracies of the classifications among three groups exceeded 79%, which were better than those of previous discriminative analyses of SZ patients with single-modal MRI data.59,60
Structure brain abnormalities in both FESZ and CSZ patients were consistent with previous multimodal MRI studies, in which regional GMV abnormalities in the FFG, MOG, PHG, STG, SFGmed, and insula25,61–63 were found. Nevertheless, we found significant regional GMV abnormalities between FESZ and CSZ patients, primarily involved in the STG and SFGmed, which were consistent with previous studies.64–66 The STG plays an important role in the recognition of learned social-emotional values and nonverbal cues,67 it is one of the most consistent regions showing significant structural abnormalities in SZ patients.4 Previous imaging studies provide evidences, which suggest that antipsychotics can reduce regional brain volumes in STG and SFG.64,68,69 We speculated that antipsychotic drugs in CSZ patients may cause GMV loss in the frontal and temporal lobes.
Both FESZ and CSZ patients showed significant functional alterations in many brain regions involved in auditory, sensorimotor, and visual systems, which were consistent with previous studies.70–72 Moreover, when compared with CSZ patients, FESZ patients showed significant functional alterations in several important brain regions related to auditory, visual processing, and sensorimotor functions, such as the left STG, bilateral PreCG, left MOG, and bilateral PoCG. It has been reported that there are pronounced deficits in auditory processing, which affects the daily life of both FESZ and CSZ patients.73 Importantly, the FESZ patients showed increased ReHo values in the left STG when compared with CSZ patients. The STG connects to the limbic system (hippocampus and amygdala), the THA, and parts of the prefrontal cortex, which have been thought to be related to the pathophysiology of SZ, particularly in auditory hallucinations and disordered thoughts.74,75
Recently, the machine learning method of SVM has been widely used for the diagnosis of psychiatric diseases and addictions.76–78 But a few studies have investigated both structural and functional alterations of SZ patients in the same study cohort.78 The current study demonstrated the potential value of multimodal MRI in differentiating individual SZ patients from NCs. Moreover, the discriminative analyses of SZ patients with multimodal MRIs achieved better performance, compared with previous studies with single-modal MRI.59,60 In a recent study, they proposed a multimodality multi-atlas feature representation and a multi-kernel learning method (MMM) to perform SZ/NCs classification, and this MMM method achieved an accuracy of 91.28% for SZ/NCs classification.79
Several issues need to be addressed in the present study. First, the sample size was modest. The ROI analyses with relatively small sample sizes in this study might not have sufficient statistical power and were at risk for false-positive errors. Moreover, a large number of subjects can train a more robust classifier and improve its generalizability. Second, this study suffered from the fact that neuropsychological tests were not performed. In the future, we expect to collect data using the Measurement and Treatment Research to Improve Cognition in Schizophrenia (MATRICS) Consensus Cognitive Battery (MCCB),80 which provides a reliable and valid assessment of cognition across major cognitive domains. Finally, we used the AAL atlas to parcellate the brain into 1,024 ROIs. Currently, there are different structurally81,82 and functionally83,84 defined brain atlases, and different parcellation schemes could generate different results. Recently, the Human Connectome Project investigators published maps of the cortical brain regions at the highest resolution85 to evaluate the effects of the brain parcellation methods on our study results. In the future, we plan to compare the effects among different brain atlases.
Conclusion
In this study, we demonstrated that SZ patients showed both structural and functional characteristics in different regions of the brain, primarily in the auditory, sensorimotor, and visual systems, at different stages. The SVM-RFE classification showed good performance in distinguishing FESZ and CSZ patients from NCs by using multiple features from structural and fMRI data. Distinct neuroanatomical profiles associated with SZ patients may provide a potential biomarker for disease diagnosis.
Abbreviations
ALFF, amplitude of low-frequency fluctuation; CSZ, chronic schizophrenia; DC, degree centrality; FESZ, first-episode drug-naive schizophrenia; GMV, gray matter volume; PANSS, positive and negative symptoms scale; ReHo, regional homogeneity; RFE, recursive feature elimination; SVM, support vector machine; VBM, voxel-based morphometry.
Ethics approval and consent to participate
The study was performed according to the Declaration of Helsinki and approved by the ethics committees of the Guangzhou Brain Hospital.
Availability of data and materials
Methodologically sound proposals to gain access to the data sets used for the presented analyses should be directed to Dr Wu ([email protected]) and will be assessed by the primary investigators of the study. On approval, signing a data use agreement will be necessary.
Acknowledgment
This work was supported by the National Natural Science Foundation of China (NSFC; 31400845, 31771074), the National Key Technology Research and Development Program of the Ministry of Science and Technology of China (2015BAI13B01, 2015BAI13B02), the Guangdong Natural Science Foundation (2015A030313800), the Science and Technology Program of Guangdong (2016B010108003, 2016A020216004), the Science and Technology Program of Guangzhou (201604020170, 2017010160496, 201704020168, 201807010064), and the Guangzhou Medical and Health Science and Technology Project (20171A011268, 20171A010283).
Author contributions
All authors contributed toward data analysis, drafting and critically revising the paper, gave final approval of the version to be published, and agree to be accountable for all aspects of the work.
Disclosure
The authors report no conflicts of interest in this work.
References
Mcglashan TH, Fenton WS. The positive-negative distinction in schizophrenia. Review of natural history validators. Arch Gen Psychiatry. 1992;49(1):63–72. | ||
Hoekert M, Kahn RS, Pijnenborg M, Aleman A. Impaired recognition and expression of emotional prosody in schizophrenia: review and meta-analysis. Schizophr Res. 2007;96(1–3):135–145. | ||
Brent BK, Thermenos HW, Keshavan MS, Seidman LJ. Gray matter alterations in schizophrenia high-risk youth and early-onset schizophrenia: a review of structural MRI findings. Child Adolesc Psychiatr Clin N Am. 2013;22(4):689–714. | ||
Shenton ME, Dickey CC, Frumin M, McCarley RW. A review of MRI findings in schizophrenia. Schizophr Res. 2001;49:1–52. | ||
Cookey J, Bernier D, Tibbo PG. White matter changes in early phase schizophrenia and cannabis use: an update and systematic review of diffusion tensor imaging studies. Schizophr Res. 2014;156(2–3):137–142. | ||
Kubicki M, Mccarley R, Westin CF, et al. A review of diffusion tensor imaging studies in schizophrenia. J Psychiatr Res. 2007;41(1–2):15–30. | ||
Mccarley RW, Wible CG, Frumin M, et al. MRI anatomy of schizophrenia. Biol Psychiatry. 1999;45(9):1099–1119. | ||
Steen RG, Mull C, Mcclure R, Hamer RM, Lieberman JA. Brain volume in first-episode schizophrenia: systematic review and meta-analysis of magnetic resonance imaging studies. Br J Psychiatry. 2006;188:510–518. | ||
Guo X, Li J, Wang J, et al. Hippocampal and orbital inferior frontal gray matter volume abnormalities and cognitive deficit in treatment-naive, first-episode patients with schizophrenia. Schizophr Res. 2014;152(2–3):339–343. | ||
Guo W, Liu F, Liu J, et al. Abnormal causal connectivity by structural deficits in first-episode, drug-naive schizophrenia at rest. Schizophr Bull. 2015;41(1):57–65. | ||
Hu M, Li J, Eyler L, et al. Decreased left middle temporal gyrus volume in antipsychotic drug-naive, first-episode schizophrenia patients and their healthy unaffected siblings. Schizophr Res. 2013;144(1–3):37–42. | ||
Vita A, de Peri L, Silenzi C, Dieci M. Brain morphology in first-episode schizophrenia: a meta-analysis of quantitative magnetic resonance imaging studies. Schizophr Res. 2006;82(1):75–88. | ||
Gong Q, Lui S, Sweeney JA. A Selective Review of Cerebral Abnormalities in Patients With First-Episode Schizophrenia Before and After Treatment. Am J Psychiatry. 2016;173(3):232–243. | ||
Huang XQ, Lui S, Deng W, et al. Localization of cerebral functional deficits in treatment-naive, first-episode schizophrenia using resting-state fMRI. Neuroimage. 2010;49(4):2901–2906. | ||
Zhang R, Wei Q, Kang Z, et al. Disrupted brain anatomical connectivity in medication-naïve patients with first-episode schizophrenia. Brain Struct Funct. 2015;220(2):1145–1159. | ||
Yang Z, Xu Y, Xu T, et al. Brain network informed subject community detection in early-onset schizophrenia. Sci Rep. 2014;4:5549. | ||
Glahn DC, Laird AR, Ellison-Wright I, et al. Meta-analysis of gray matter anomalies in schizophrenia: application of anatomic likelihood estimation and network analysis. Biol Psychiatry. 2008;64(9):774–781. | ||
Gupta CN, Calhoun VD, Rachakonda S, et al. Patterns of Gray Matter Abnormalities in Schizophrenia Based on an International Mega-analysis. Schizophr Bull. 2015;41(5):1133–1142. | ||
Xu L, Groth KM, Pearlson G, Schretlen DJ, Calhoun VD. Source-based morphometry: the use of independent component analysis to identify gray matter differences with application to schizophrenia. Hum Brain Mapp. 2009;30(3):711–724. | ||
Antonova E, Kumari V, Morris R, et al. The relationship of structural alterations to cognitive deficits in schizophrenia: a voxel-based morphometry study. Biol Psychiatry. 2005;58(6):457–467. | ||
Kreczmanski P, Heinsen H, Mantua V, et al. Volume, neuron density and total neuron number in five subcortical regions in schizophrenia. Brain. 2007;130(Pt 3):678–692. | ||
Nakamura M, Salisbury DF, Hirayasu Y, et al. Neocortical gray matter volume in first-episode schizophrenia and first-episode affective psychosis: a cross-sectional and longitudinal MRI study. Biol Psychiatry. 2007;62(7):773–783. | ||
Ellison-Wright I, Glahn DC, Laird AR, Thelen SM, Bullmore E. The anatomy of first-episode and chronic schizophrenia: an anatomical likelihood estimation meta-analysis. Am J Psychiatry. 2008;165(8):1015–1023. | ||
Meisenzahl EM, Koutsouleris N, Bottlender R, et al. Structural brain alterations at different stages of schizophrenia: a voxel-based morphometric study. Schizophr Res. 2008;104(1–3):44–60. | ||
Ho BC, Andreasen NC, Ziebell S, Pierson R, Magnotta V. Long-term antipsychotic treatment and brain volumes: a longitudinal study of first-episode schizophrenia. Arch Gen Psychiatry. 2011;68(2):128–137. | ||
Moncrieff J, Leo J. A systematic review of the effects of antipsychotic drugs on brain volume. Psychol Med. 2010;40(9):1409–1422. | ||
van Haren NE, Hulshoff Pol HE, Schnack HG, et al. Focal gray matter changes in schizophrenia across the course of the illness: a 5-year follow-up study. Neuropsychopharmacology. 2007;32(10):2057–2066. | ||
Zhang W, Deng W, Yao L, et al. Brain Structural Abnormalities in a Group of Never-Medicated Patients With Long-Term Schizophrenia. Am J Psychiatry. 2015;172(10):995–1003. | ||
Chiapponi C, Piras F, Fagioli S, Piras F, Caltagirone C, Spalletta G. Age-related brain trajectories in schizophrenia: a systematic review of structural MRI studies. Psychiatry Res. 2013;214(2):83–93. | ||
Turner JA, Damaraju E, van Erp TG, et al. A multi-site resting state fMRI study on the amplitude of low frequency fluctuations in schizophrenia. Front Neurosci. 2013;7:137. | ||
Czepielewski LS, Wang L, Gama CS, Barch DM. The Relationship of Intellectual Functioning and Cognitive Performance to Brain Structure in Schizophrenia. Schizophr Bull. 2017;43(2):355–364. | ||
Olabi B, Ellison-Wright I, Mcintosh AM, Wood SJ, Bullmore E, Lawrie SM. Are there progressive brain changes in schizophrenia? A meta-analysis of structural magnetic resonance imaging studies. Biol Psychiatry. 2011;70(1):88–96. | ||
Torres US, Duran FL, Schaufelberger MS, et al. Patterns of regional gray matter loss at different stages of schizophrenia: A multisite, cross-sectional VBM study in first-episode and chronic illness. Neuroimage Clin. 2016;12:1–15. | ||
Cropley VL, Klauser P, Lenroot RK, et al. Accelerated Gray and White Matter Deterioration With Age in Schizophrenia. Am J Psychiatry. 2017;174(3):286–295. | ||
Li T, Wang Q, Zhang J, et al. Brain-Wide Analysis of Functional Connectivity in First-Episode and Chronic Stages of Schizophrenia. Schizophr Bull. 2017;43(2):436–448. | ||
Kambeitz J, Kambeitz-Ilankovic L, Leucht S, et al. Detecting neuroimaging biomarkers for schizophrenia: a meta-analysis of multivariate pattern recognition studies. Neuropsychopharmacology. 2015;40(7):1742–1751. | ||
First MB. User’s Guide for the Structured Clinical Interview for DSM-IV Axis II Personality Disorders: SCID-II. Arlington, VA: American Psychiatric Press; 1997. | ||
Kay SR, Fiszbein A, Opler LA. The positive and negative syndrome scale (PANSS) for schizophrenia. Schizophr Bull. 1987;13(2):261–276. | ||
van Tol MJ, van der Meer L, Bruggeman R, Modinos G, Knegtering H, Aleman A. Voxel-based gray and white matter morphometry correlates of hallucinations in schizophrenia: The superior temporal gyrus does not stand alone. Neuroimage Clin. 2014;4:249–257. | ||
Good CD, Johnsrude I, Ashburner J, Henson RN, Friston KJ, Frackowiak RS. Cerebral asymmetry and the effects of sex and handedness on brain structure: a voxel-based morphometric analysis of 465 normal adult human brains. Neuroimage. 2001;14(3):685–700. | ||
Zalesky A, Fornito A, Harding IH, et al. Whole-brain anatomical networks: does the choice of nodes matter? Neuroimage. 2010;50(3):970–983. | ||
Tzourio-Mazoyer N, Landeau B, Papathanassiou D, et al. Automated anatomical labeling of activations in SPM using a macroscopic anatomical parcellation of the MNI MRI single-subject brain. Neuroimage. 2002;15(1):273–289. | ||
Yan CG, Wang XD, Zuo XN, Zang YF. DPABI: Data Processing & Analysis for (Resting-State) Brain Imaging. Neuroinformatics. 2016;14(3):339–351. | ||
Zang Y, Jiang T, Lu Y, He Y, Tian L. Regional homogeneity approach to fMRI data analysis. Neuroimage. 2004;22(1):394–400. | ||
Kendall MG. Rank Correlation Methods. 5th ed. Oxford: Oxford University Press; 1990. | ||
Dai Z, Yan C, Wang Z, et al. Discriminative analysis of early Alzheimer’s disease using multi-modal imaging and multi-level characterization with multi-classifier (M3). Neuroimage. 2012;59(3):2187–2195. | ||
Zang YF, He Y, Zhu CZ, et al. Altered baseline brain activity in children with ADHD revealed by resting-state functional MRI. Brain Dev. 2007;29(2):83–91. | ||
Yoon S, Kim S. Mutual information-based SVM-RFE for diagnostic classification of digitized mammograms. Pattern Recognit Lett. 2009;30(16):1489–1495. | ||
Cortes C, Vapnik V. Support-vector networks. Mach Learn. 1995;20(3):273–297. | ||
Chang CC, Lin CJ. LIBSVM: A Library for Support Vector Machines. Acm T Intel Syst Tec. 2011;2:27. | ||
Ding J, Shi J, Wu FX. SVM-RFE based feature selection for tandem mass spectrum quality assessment. Int J Data Min Bioinform. 2011;5(1):73–88. | ||
Guyon I, Weston J, Barnhill S, Vapnik V. Gene selection for cancer classification using support vector machines. Mach Learn. 2002;46(1–3):389–422. | ||
Refaeilzadeh P, Tang L, Liu H. Cross-validation. In: Liu L, Özsu MT, editors. Encyclopedia of Database Systems. New York, NY: Springer US; 2009:532–538. | ||
van der Gaag M, Hoffman T, Remijsen M, et al. The five-factor model of the Positive and Negative Syndrome Scale II: a ten-fold cross-validation of a revised model. Schizophr Res. 2006;85(1–3):280–287. | ||
Mourão-Miranda J, Bokde AL, Born C, Hampel H, Stetter M. Classifying brain states and determining the discriminating activation patterns: Support Vector Machine on functional MRI data. Neuroimage. 2005;28(4):980–995. | ||
Thomaz CE. A multivariate statistical analysis of the developing human brain in preterm infants. Image Vision Comput. 2007;25:981–994. | ||
Golland P, Fischl B. Permutation tests for classification: towards statistical significance in image-based studies. Inf Process Med Imaging. 2003;18:330–341. | ||
Liu F, Guo W, Fouche JP, et al. Multivariate classification of social anxiety disorder using whole brain functional connectivity. Brain Struct Funct. 2015;220(1):101–115. | ||
Greenstein D, Malley JD, Weisinger B, Clasen L, Gogtay N. Using multivariate machine learning methods and structural MRI to classify childhood onset schizophrenia and healthy controls. Front Psychiatry. 2012;3:53. | ||
Nieuwenhuis M, van Haren NE, Hulshoff Pol HE, Cahn W, Kahn RS, Schnack HG. Classification of schizophrenia patients and healthy controls from structural MRI scans in two large independent samples. Neuroimage. 2012;61(3):606–612. | ||
Leung M, Cheung C, Yu K, et al. Gray matter in first-episode schizophrenia before and after antipsychotic drug treatment. Anatomical likelihood estimation meta-analyses with sample size weighting. Schizophr Bull. 2011;37(1):199–211. | ||
Smieskova R, Fusar-Poli P, Allen P, et al. The effects of antipsychotics on the brain: what have we learnt from structural imaging of schizophrenia? – a systematic review. Curr Pharm Des. 2009;15(22):2535–2549. | ||
Goghari VM, Smith GN, Honer WG, et al. Effects of eight weeks of atypical antipsychotic treatment on middle frontal thickness in drug-naïve first-episode psychosis patients. Schizophr Res. 2013;149(1–3):149–155. | ||
Moncrieff J, Leo J. A systematic review of the effects of antipsychotic drugs on brain volume. Psychol Med. 2010;40(9):1409–1422. | ||
Arango C, Rapado-Castro M, Reig S, et al. Progressive brain changes in children and adolescents with first-episode psychosis. Arch Gen Psychiatry. 2012;69(1):16–26. | ||
Asami T, Bouix S, Whitford TJ, et al. Longitudinal loss of gray matter volume in patients with first-episode schizophrenia: DARTEL automated analysis and ROI validation. Neuroimage. 2012;59(2):986–996. | ||
Ochsner KN. The social-emotional processing stream: five core constructs and their translational potential for schizophrenia and beyond. Biol Psychiatry. 2008;64(1):48–61. | ||
Fusar-Poli P, Smieskova R, Kempton MJ, et al. Progressive brain changes in schizophrenia related to antipsychotic treatment? A meta-analysis of longitudinal MRI studies. Neurosci Biobehav Rev. 2013;37(8):1680–1691. | ||
Haijma SV, van Haren N, Cahn W, Koolschijn PC, Hulshoff Pol HE, Kahn RS. Brain volumes in schizophrenia: a meta-analysis in over 18,000 subjects. Schizophr Bull. 2013;39(5):1129–1138. | ||
Ren W, Lui S, Deng W, et al. Anatomical and functional brain abnormalities in drug-naive first-episode schizophrenia. Am J Psychiatry. 2013;170(11):1308–1316. | ||
He Z, Deng W, Li M, et al. Aberrant intrinsic brain activity and cognitive deficit in first-episode treatment-naive patients with schizophrenia. Psychol Med. 2013;43(4):769–780. | ||
Bastos-Leite AJ, Ridgway GR, Silveira C, Norton A, Reis S, Friston KJ. Dysconnectivity within the default mode in first-episode schizophrenia: a stochastic dynamic causal modeling study with functional magnetic resonance imaging. Schizophr Bull. 2015;41(1):144–153. | ||
Brown KJ. Beyond the P300: target and non-target ERP components in schizophrenia. 2004. | ||
Kim JJ, Crespo-Facorro B, Andreasen NC, O’Leary DS, Magnotta V, Nopoulos P. Morphology of the lateral superior temporal gyrus in neuroleptic nai;ve patients with schizophrenia: relationship to symptoms. Schizophr Res. 2003;60(2–3):173–181. | ||
Allen P, Larøi F, Mcguire PK, Aleman A. The hallucinating brain: a review of structural and functional neuroimaging studies of hallucinations. Neurosci Biobehav Rev. 2008;32(1):175–191. | ||
Lu X, Yang Y, Wu F, et al. Discriminative analysis of schizophrenia using support vector machine and recursive feature elimination on structural MRI images. Medicine. 2016;95(30):e3973. | ||
Ding X, Yang Y, Stein EA, Ross TJ. Multivariate classification of smokers and nonsmokers using SVM-RFE on structural MRI images. Hum Brain Mapp. 2015;36(12):4869–4879. | ||
Wolfers T, Buitelaar JK, Beckmann CF, Franke B, Marquand AF. From estimating activation locality to predicting disorder: A review of pattern recognition for neuroimaging-based psychiatric diagnostics. Neurosci Biobehav Rev. 2015;57:328–349. | ||
Liu J, Wang X, Zhang X, Pan Y, Wang X, Wang J. MMM: classification of schizophrenia using multi-modality multi-atlas feature representation and multi-kernel learning. Multimedia Tools and Applications. 2017:1–17. | ||
August SM, Kiwanuka JN, Mcmahon RP, Gold JM. The MATRICS Consensus Cognitive Battery (MCCB): clinical and cognitive correlates. Schizophr Res. 2012;134(1):76–82. | ||
Collins DL, Holmes CJ, Peters TM, Evans AC. Automatic 3-D model-based neuroanatomical segmentation. Hum Brain Mapp. 1995;3(3):190–208. | ||
Makris N, Meyer JW, Bates JF, Yeterian EH, Kennedy DN, Caviness VS. MRI-Based topographic parcellation of human cerebral white matter and nuclei II. Rationale and applications with systematics of cerebral connectivity. Neuroimage. 1999;9(1):18–45. | ||
Craddock RC, James GA, Holtzheimer PE 3rd, Hu XP, Mayberg HS. A whole brain fMRI atlas generated via spatially constrained spectral clustering. Hum Brain Mapp. 2012;33:1914–1928. | ||
de Luca M, Beckmann CF, de Stefano N, Matthews PM, Smith SM. fMRI resting state networks define distinct modes of long-distance interactions in the human brain. Neuroimage. 2006;29(4):1359–1367. | ||
Glasser MF, Coalson TS, Robinson EC, et al. A multi-modal parcellation of human cerebral cortex. Nature. 2016;536(7615):171–178. |
Supplementary materials
 | Table S1 Significant differences in GMV among three groups |
 | Table S2 Significant differences in ReHo among three groups |
 | Table S3 Significant differences in ALFF among three groups |
 | Table S4 Significant differences in DC among three groups |
 © 2018 The Author(s). This work is published and licensed by Dove Medical Press Limited. The
full terms of this license are available at https://www.dovepress.com/terms
and incorporate the Creative Commons Attribution
- Non Commercial (unported, 3.0) License.
By accessing the work you hereby accept the Terms. Non-commercial uses of the work are permitted
without any further permission from Dove Medical Press Limited, provided the work is properly
attributed. For permission for commercial use of this work, please see paragraphs 4.2 and 5 of our Terms.
© 2018 The Author(s). This work is published and licensed by Dove Medical Press Limited. The
full terms of this license are available at https://www.dovepress.com/terms
and incorporate the Creative Commons Attribution
- Non Commercial (unported, 3.0) License.
By accessing the work you hereby accept the Terms. Non-commercial uses of the work are permitted
without any further permission from Dove Medical Press Limited, provided the work is properly
attributed. For permission for commercial use of this work, please see paragraphs 4.2 and 5 of our Terms.