")
Back to Journals » Diabetes, Metabolic Syndrome and Obesity » Volume 16
Stronger Associations of TyG Index with Diabetes Than TyG-Obesity-Related Parameters: More Pronounced in Young, Middle-Aged, and Women
Authors Xing Y, Liu J, Gao Y, Zhu Y, Zhang Y, Ma H
Received 30 August 2023
Accepted for publication 7 November 2023
Published 22 November 2023 Volume 2023:16 Pages 3795—3805
DOI https://doi.org/10.2147/DMSO.S433493
Checked for plagiarism Yes
Review by Single anonymous peer review
Peer reviewer comments 2
Editor who approved publication: Prof. Dr. Antonio Brunetti
Yuling Xing,1 Jing Liu,1 Yu Gao,2 Yajun Zhu,1 Yunjia Zhang,1 Huijuan Ma3
1Department of Endocrinology, Hebei General Hospital, Shijiazhuang, People’s Republic of China; 2Department of Endocrinology, Affiliated Hospital of Chengde Medical University, Chengde, People’s Republic of China; 3Department of Endocrinology, The First Hospital of Hebei Medical University, Shijiazhuang, People’s Republic of China
Correspondence: Huijuan Ma, Department of Endocrinology, The First Hospital of Hebei Medical University, Shijiazhuang, 050051, People’s Republic of China, Tel +86 18032838686, Email [email protected]
Purpose: The triglyceride glucose (TyG) index and TyG-related indicators have been proposed as a marker of insulin resistance. It is unclear which is the best indicator to predict diabetes mellitus (DM) in Chinese. This study aimed to investigate the predictive value of different biomarkers for the incidence of DM.
Patients and methods: Between January 2017 and December 2020, 5575 subjects who underwent health examinations in Hebei General Hospital were retrospectively included. The primary endpoint was new onset DM.
Results: During a median follow-up of 3.03 years, 133(2.39%) individuals developed DM. Multivariable cox proportional hazards models revealed that TyG index and TyG-related parameters were positively associated with DM risk. As the interaction analyses showed, there were significant interactions with sex and age levels in relation to DM risk (both P for interaction < 0.05). Risk prediction for DM was significantly improved by adding TyG index to the baseline model using conventional diabetic risk factors in predicting DM at follow-up.
Conclusion: This population-based cohort study suggested a causal relationship between TyG index and DM after adjusting for other confounding factors. This independent and significant association was more apparent in females and subjects younger than 65 years. Compared with the TyG-BMI, TyG-WC, TyG-WHtR, the TyG index was a more effective predictor of DM.
Keywords: diabetes mellitus, TyG index, cohort study
Introduction
Diabetes mellitus (DM) represents a metabolic disorder stemming from irregular glucose metabolism, ranking as one of the most prevalent chronic ailments worldwide.1 According to the International Diabetes Federation, 2021 recorded 536.6 million people living with DM, with predictions anticipating a rise to 783.2 million by 2045.2 DM has been associated with both microvascular and macrovascular complications, which not only inflict physical and psychological suffering upon patients but also impose a heavy burden on the healthcare system.3 Numerous studies affirm that DM is associated with elevated overall mortality and cardiovascular risks.4 Consequently, early diagnosis and effective screening of high-risk populations for DM emerge as vital imperatives. However, the core of DM’s pathophysiology is Insulin resistance (IR).5 The triglyceride glucose (TyG) index has been demonstrated as an effective predictor of IR in previous studies.6,7 Nevertheless, TyG has not consistently exhibited a predictive capacity for DM. Notably, an Iranian study found that incorporating TyG into a predictive model for DM did not enhance its prognostic rate.8 In the extensive prospective cohort study conducted by Lopez-Jaramillo et al, encompassing 22 countries across five continents, it was observed that the TyG index exhibited a significant correlation with the occurrence of cardiovascular diseases such as myocardial infarction and stroke, cardiovascular mortality, as well as the development of type 2 DM.9 Recently, in light of the close relationship between obesity and IR, studies have reported that TyG-related indices, including TyG index and obesity-related anthropometric parameters, such as TyG-body mass index (TyG-BMI), TyG-waist circumference (TyG-WC), and TyG-waist to height ratio (TyG-WHtR), have a strong correlation with IR.10–12 Subsequent studies also establish links between TyG-WHtR, TyG-BMI, and TyG-WC with DM.13–15 Despite these findings, controversies persist concerning which marker serves as the most effective and optimal choice for screening DM risk. However, to the best of our knowledge, no prior studies have examined the comparative predictive potential of TyG and other TyG-related parameters for incident DM within a Chinese population. This existing diversity in conclusions underscores the ongoing debate regarding the indicator most closely associated with DM risk. Thus, our study aims to explore the relationship between the TyG index and incident DM, further comparing TyG with other parameters (TyG-WHtR, TyG-WC, and TyG-BMI) for predicting DM in a Chinese cohort.
Methods
Study Population
This retrospective, observational, single-center cohort study was conducted using participants from a comprehensive health check-up program at the Health Examination Center, Hebei General Hospital, spanning from January 2017 to December 2020. Follow-up visits occurred at least once a year and were primarily conducted at the Health Examination Center. Exclusion criteria encompassed: (1) individuals with a pre-existing diagnosis of DM at baseline. (2) Participants with unknown status of DM during follow-up or missing data.(3) Individuals with an estimated glomerular filtration rate (eGFR) less than 30 mL/min/1.73m2, chronic dialysis, severe hepatic insufficiency, acute infection, malignancy, or familial hypertriglyceridemia. (4) Participants undergoing treatment with TG-lowering drugs (eg, fenofibrate) before the baseline examination. The follow-up commencement was marked by the point at which clinicians collected complete data and assessed the DM status. The follow-up endpoint was the occurrence of incident DM. All participants were followed from the date of the baseline examination until they received a DM diagnosis or until the conclusion of the four-year follow-up survey, whichever transpired first. Finally, 5,575 eligible participants were enrolled in the cohort.
Data Collection and Definitions
The data collection process was approved by the Institutional Review Board of Hebei General Hospital and performed in accordance with the Declaration of Helsinki. Trained research staff conducted physical examinations following standardized procedures. During each visit to the health check center, participants were requested to complete a detailed questionnaire covering demographic characteristics, lifestyle factors, personal medical history, family history of chronic disease, and medication history. Height, weight, and WC were measured twice, with participants wearing light clothing and no shoes. An automated sphygmomanometer (OMRON, HEM-7125, Dalian, China) measured systolic and diastolic blood pressures (SBP and DBP), with the mean values used for subsequent analyses. Fasting (≥ 8 h) blood samples were collected for standard hematologic and biochemical assessments. Biochemical parameters, including total cholesterol (TC), triglyceride (TG), high-density lipoprotein cholesterol (HDL-C), low-density lipoprotein cholesterol (LDL-C), blood urea nitrogen (BUN), creatinine (Cr), and uric acid (UA), were analyzed using a Hitachi 7600–110 automatic biochemical analyzer. DM was defined based on self-reported physician-diagnosed DM, or fasting plasma glucose (FPG) ≥7 mmol/L twice. Hypertension was defined as SBP ≥140 mmHg and/or DBP ≥90 mmHg, or the use of antihypertensive therapy. The diagnosis of fatty liver was made based on abdominal ultrasound results.
The indices were calculated using the following formulations.


Statistical Analysis
Continuous variables were expressed as mean ± standard deviation or as median and interquartile range based on their distribution. Group comparisons were analyzed using independent samples t-tests or the Mann–Whitney U-test. Categorical variables were presented as counts (percentages) and assessed using the χ2 test or Fisher’s exact test. The Pearson correlation was employed for variables with a h normal distribution, whereas the Spearman correlation was used for variables without a normal distribution. In multivariate Cox proportional hazards analyses, three models were established to evaluate the predictive value of the TyG index and TyG-related indicators for DM: (1) Model I: crude model; (2) Model II: adjusted for age, sex, BMI, smoking, drinking, hypertension, fatty liver, and (3) Model III: further adjusted for variables included in Model II and UA, UREA/CREA, TC, HDL-C. TG and FPG were not adjusted as they are components of the TyG formula. The Cox proportional hazard models are presented as hazard ratios and 95% confidence intervals (CI). To assess predictive validity and establish optimal cutoff values for TyG and TyG-related indices, we used Receiver Operating Characteristic (ROC) curves. Stratified analyses were performed within age, sex, hypertension, fatty liver, smoking, drinking, metabolic syndrome (MS), TG, HDL-C, and FPG subgroups to assess the consistency of the TyG index’s prognostic impact on DM. The stratified analyses used all covariates in Model III, except those used for stratification. A likelihood ratio test was used to investigate interactions between the TyG index and the stratification variables. The value of adding TyG to conventional risk factors for the prediction of DM was evaluated by calculating measures of discrimination (C-index) and net reclassification improvement (NRI). The area under the ROC curve (AUC) was compared using the DeLong test. Statistical analyses were performed using SPSS 23.0 (SPSS Inc., Chicago, Illinois, USA), R Programming Language (version 3.5.1), and MedCalc 19.1 (MedCalc Software, Belgium). A P-value < 0.05 was considered statistically significant.
Results
A total of 5,575 participants, with a mean age of 41 years, were enrolled in this study (Figure 1). Over the four-year follow-up period, 133 participants (2.39% of the total population) developed DM.
 |
Figure 1 Flow chart of the study population enrollment. |
Baseline Characteristic of the Study Population
The baseline characteristics of the entire population, stratified by the development of DM, are presented in Table 1. Participants who developed DM during follow-up exhibited higher baseline TyG, TyG-BMI, TyG-WC, and TyG-WHtR compared to those who remained non-diabetic. The former group also had higher proportions of males, smokers, and drinkers, along with an elevated prevalence of hypertension and fatty liver. Furthermore, they displayed higher levels of BMI, WC, TG, TC, and FPG at baseline compared to those who did not develop DM.
 |
Table 1 Baseline Clinical Characteristics of Participants with and without DM |
The AUCs of the TyG index for predicting the occurrence of DM was 0.758 (95% CI: 0.746–0.769, P <0.001). Considering the most effective threshold of the TyG index as the cutoff (9.22, sensitivity == 52.63%, specificity =84.06%), the values were divided into high and low TyG indices. Baseline characteristics, grouped according to the optimal cutoff point of the TyG index, are presented in Table 2. The incidence of DM increased significantly in participants with a higher TyG index compared to those with a lower TyG index. Overall, compared to participants with a low TyG index, participants with a high TyG index had a greater proportion of men, smokers, and drinkers, along with a high prevalence of hypertension and fatty liver, advanced age, BMI, WC, TG, TC, UA, and FPG levels. Additionally, HDL-C and UREA/CREA were significantly lower in participants with a high TyG index.
 |
Table 2 Baseline Clinical Characteristics of Participants Stratified by the Optimal Cutoff Point of TyG Index |
Correlation Between the TyG Index and DM Risk Factors
Spearman correlation analysis revealed a positive association between the TyG index and variables relevant to DM risk, including age, WC, BMI, UA, and TC. In contrast, the TyG index exhibited a negative correlation with HDL-C and UREA/CREA (Figure 2).
 |
Figure 2 Correlations between the TyG index and traditional DM risk factors. |
Cox Proportional Hazard Analyses to Evaluate the Prognostic Implication of TyG Index and TyG-Related Indicators
Multivariate Cox proportional hazard analysis, utilizing three models (as described above, models I–III), was employed to assess the predictive potential of the TyG index and TyG-related indicators for DM. After adjusting for confounding variables, higher levels of the TyG index and TyG-related indicators were found to be independently associated with a higher risk of DM. In summary, the TyG index exhibited the strongest association with the incidence of DM compared to the TyG-related indicators. Notably, TyG-WHtR outperformed TyG-BMI and TyG-WC in detecting DM (Table 3).
 |
Table 3 Predictive Value of TyG Index and TyG-Related Indexes for DM in Different Cox Proportional Hazards Models |
To explore the influence of other risk factors on the correlation between the TyG index and future DM risk, subgroup analyses were conducted based on stratification variables: sex, age, BMI, smoking, drinking, hypertension, fatty liver, MS, WC, TG, HDL-C, and FPG. The results of these subgroup analyses, along with interaction analyses, are summarized in Figure 3. A significant interaction was observed between TyG index and sex, and age with regard to DM risk. The association of the TyG index with the risk of DM was stronger among individuals under the age of 65 years and among women. No other significant interactions were observed in the subgroup analyses.
 |
Figure 3 Subgroup analyses and interaction analyses evaluating DM of TyG index in various stratifications: (A) Subgroup analyses of sex, age, smoking, drinking, hypertension, fatty liver, (B) Subgroup analyses of BMI, WC, HDL-C, TG, FPG. |
The TyG Index Exhibits the Highest Ability to Predict DM Incidence
The AUC results for the TyG index and TyG-related indicators, as indicators of DM, are presented in Table 4. The TyG index showed the highest AUC (AUC: 0.758, 95% CI 0.746–0.769), followed by TyG-WHtR (AUC: 0.747, 95% CI 0.735–0.758) and TyG-WC (AUC: 0.746, 95% CI 0.734–0.758). The AUC for TyG-BMI was 0.716 (0.704–0.728), for TG was 0.745 (0.733–0.756) and for FPG was 0.668 (0.656–0.681). The optimal cutoff points of indexes to predict DM were 9.22 (TyG), 229.05 (TyG-BMI), 839.44 (TyG-WC), and 4.77 (TyG-WHtR).
 |
Table 4 Performance of the Indices in Predicting the Incidence of DM |
TyG Index Improves the Predictive Ability of Conventional Risk Factors for DM
The addition of the TyG index significantly improved the AUC of the baseline risk model (AUC: baseline risk model, 0.836 vs baseline risk model +TyG index, 0.862, P for comparison =0.014, Table 5, Figure 4). The baseline risk model included age, sex, BMI, smoking, drinking, hypertension, fatty liver, UA, UREA/CREA, TC, and HDL-C. Furthermore, the category-free NRI analysis revealed that the inclusion of the TyG index led to a significant improvement in net risk reclassification by 14% (P <0.05). The addition of TG and FPG to the baseline risk model also significantly enhanced DM prediction (AUC: baseline risk model, 0.836 vs baseline risk model + TG, 0.855; AUC: baseline risk model, 0.836 vs baseline risk model + FPG, 0.846, both P for comparison < 0.05, Table 5, Figure 4). Notably, the improvement was more significant with the addition of the TyG index to the baseline risk model compared to the addition of TyG-related indexes, including TyG-BMI, TyG-WC, and TyG-WHtR, to the baseline risk model.
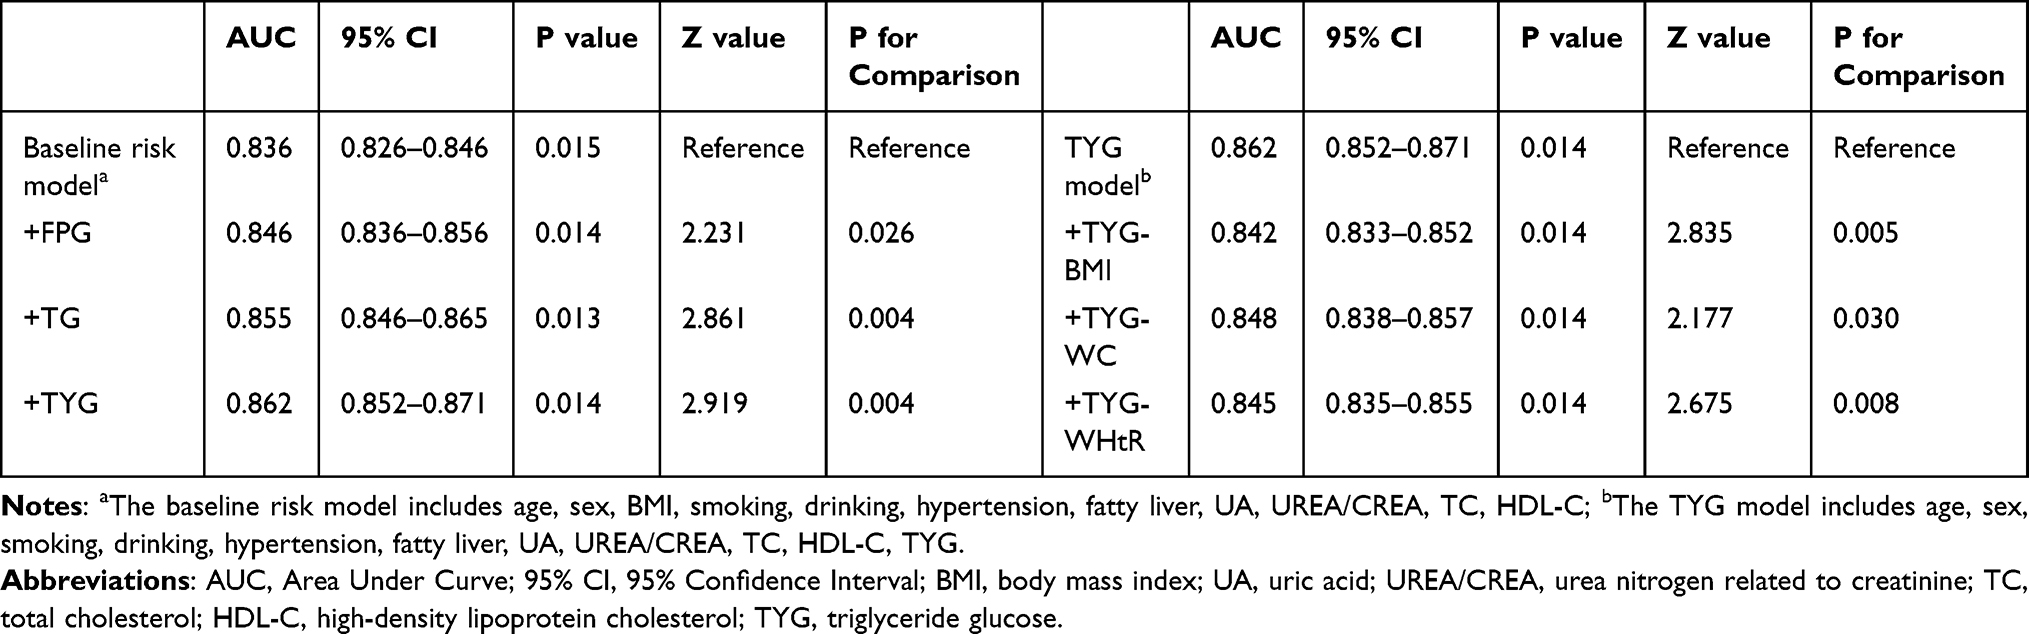 |
Table 5 Improvement in Predicting Prediabetes by Adding the Indices to the Conventional Risk Factors |
 |
Figure 4 Improvement in predicting DM by adding the indices to the risk model: (A) a Baseline risk model vs +FPG, (B) Baseline risk model vs +TG, (C) Baseline risk model vs +TYG, (D) Baseline risk model vs +TYGBMI, (E) Baseline risk model vs +TYGWC, (F) Baseline risk model vs +TYGWHtR. |
Discussion
DM is a critical public health concern with severe health implications, warranting extensive attention to early prevention and screening.3 While HIEC technology testing is available, the quest for simple and practical clinical markers is paramount. This study, therefore, examined the predictive potential of the TyG index and TyG-related indicators for DM, unveiling significant associations between TyG and multiple risk factors.
Our results demonstrated that participants with a higher baseline TyG index had a significantly higher risk of developing DM during the follow-up period compared to those with lower TyG index values. The TyG index emerged as the most powerful predictor of DM onset, maintaining its predictive power even after adjustments for confounding factors. The addition of the TyG index to a baseline risk model, which incorporated conventional risk factors significantly improved the predictive ability of the model.
IR and the deterioration of β-cell function play pivotal roles in the development of T2DM.16 It has been reported that the TyG index specifically reflects muscle-related IR.17,18 Additionally, the predictive value of the TyG index for IR has been shown to surpass that of the HOMA-IR.19 Beyond assessing IR, the TyG index can also measure the susceptibility of β-cells to glucotoxicity and lipotoxicity. Islet TG overload can disrupt glucose metabolism and lead to elevated levels of circulating free fatty acids (FFAs) through lipolysis, impairing β cell function.20 Moreover, hyperglycemia, despite lower antioxidant capacity, exposes islet cells to continuous oxidative stress,21 exacerbating β-cell failure.22 Elevated lipid and/or glucose levels contribute to an increased TyG index, indicating a heightened risk of incident DM.
The results from subgroup analysis and interaction analyses revealed noteworthy disparities in the relationship between the TyG index and DM risk based on age and sex. The current study identified a significant association of the TyG index with incident DM, with this association being particularly pronounced among women, aligning with the findings of Zhang et al.23 These differences may be attributed to variations in abdominal fat distribution across age groups and sexes. Furthermore, females often exhibit higher hepatocellular lipids, both in fasting and post-glucose and lipid loading, compared to males.24 Distinct body composition and metabolic distinctions exist between men and women, with men generally possessing greater muscle mass and faster metabolism.25 Notably, the incidence of DM related to the TyG index saw a significant increase in younger and middle-aged populations, which mirrors the findings of Wang et al.26 This phenomenon can be attributed to the rapid development of society and the economy, as well as shifting demographics, where an aging population and reduced labor force add to the social pressures experienced by, young and middle-aged individuals.27 Furthermore, scholarly investigations have revealed a correlation between TYG and the susceptibility to diabetes, which is contingent upon income level. In the PURE study, subgroup analyses revealed that the relationship between the TyG index and the risk of type 2 DM exhibited variations based on the income level of the countries. This phenomenon could potentially be elucidated by an augmented susceptibility of these populations to the presence of IR.9 Moreover, the study compared the predictive abilities of the TyG index with TyG-related indexes. The results indicated that the TyG index outperformed others in predicting DM. A few prospective studies26,28 have demonstrated an association between the TyG index and new-onset DM. Moreover, in cross-sectional studies, the TyG index has shown superior predictive ability for DM compared to other TyG-related parameters.13 However, Er-LK et al found that TyG-BMI and TyG-WC were significantly better predictors of DM risk in the Korean population than TyG.29 Additionally, evidence suggests that WHtR may perform better than BMI and WC in predicting DM.30,31 Among TyG-related indexes, all, including TyG-WHtR, TyG-BMI, and TyG-WC, exhibited predictive power for DM, with the TyG-WHtR index possibly being the best-performed. Coincidentally, findings by Xuan W indicated that TyG-WHtR is superior to other parameters in predicting DM.32 A meta-analysis that included 31 studies and 123,231 participants showed that WHtR had the largest AUC for predicting DM compared to WC and BMI.33 Similar results were obtained by Petermann-Rocha et al, who analyzed data from 13,044 participants and found that WHtR was a better predictor of T2DM than BMI or WC.31 These results may be attributed to the different roles BMI, WC, and WHtR play in the evaluation of obesity. BMI, based on height and weight, identifies obesity but does not differentiate between obesity and lean body mass, nor can it assess the impact of adipose tissue on metabolism.34 Moreover, WC cannot differentiate visceral from subcutaneous fat tissue and does not account for individual height and body size variations. A growing body of evidence suggests that visceral fat contributes more to the development of DM risk than subcutaneous fat.14 Nevertheless, it should be noted that WHtR has been reported to be more sensitive than WC to reflect stature.14
This study has various strengths. It establishes an independent relationship between DM and TyG after sufficient model adjustment. ROC analysis also indicated TyG as the favorable marker over TyG-related indexes for predicting DM. Notably, high-risk populations were identified through subgroup analysis, adding to the robustness of the study. Moreover, the findings of the study can be generalized and applied to identify high-risk groups for DM in the Chinese population. Despite its strengths, this study has limitations. It could not distinguish between type 1 and type 2 DM. However, our results may be more suitable for predicting the risk of type 2 mellitus (T2DM), which accounts for 90% of all diabetes cases. DM was diagnosed based on FPG ≥ 7 mmol/L, or self-reporting, which could have resulted in an underestimation of the true prevalence of DM. Although we adjusted for many potential confounders, we cannot rule out residual confounding or the effect of unmeasured confounders, such as hemoglobin A 1c, exercise habits, and other variables. Finally, the participants were all Chinese, limiting the generalizability of its conclusion to other populations.
Conclusion
In this cohort study involving Chinese patients, we established a causal association between the TyG index and DM, and this independent association was more obvious in young, middle-aged, and female individuals. The TyG index outperformed other parameters (TyG-BMI, TyG-WC, TyG-WHtR) in predicting the risk of DM in the Chinese population. These findings offer compelling support for the utility of the TyG index in the assessment of DM and offer a practical and affordable method for the early detection and management of DM.
Given the retrospective nature of this study and the use of anonymized patient data, the requirement for informed consent was waived. This study was approved by the Institutional Review Board of Hebei General Hospital, which waived the requirement for patients’ consent. Data has been handled confidentially.
Data Sharing Statement
The original data can be available by email request at any time (Yuling Xing:[email protected]).
Funding
This study was supported by Central Committee Guides Local Science and Technology Development Project (No. 226Z7721G).
Disclosure
The authors declare that they have no conflicts of interest in this work.
References
1. Chan JC, Malik V, Jia W, et al. Diabetes in Asia: epidemiology, risk factors, and pathophysiology. JAMA. 2009;301(20):2129–2140. doi:10.1001/jama.2009.726
2. Sun H, Saeedi P, Karuranga S, et al. IDF diabetes Atlas: global, regional and country-level diabetes prevalence estimates for 2021 and projections for 2045. Diabetes Res Clin Pract. 2022;183:109119. doi:10.1016/j.diabres.2021.109119
3. Chatterjee S, Khunti K, Davies MJ. Type 2 diabetes. Lancet. 2017;389(10085):2239–2251. doi:10.1016/S0140-6736(17)30058-2
4. GBD 2016 Disease and Injury Incidence and Prevalence Collaborators. Global, regional, and national incidence, prevalence, and years lived with disability for 328 diseases and injuries for 195 countries, 1990–2016: a systematic analysis for the Global Burden of Disease Study 2016. Lancet. 2017;390(10100):1211–1259. doi:10.1016/S0140-6736(17)32154-2
5. Paneni F, Costantino S, Cosentino F. Insulin resistance, diabetes, and cardiovascular risk. Curr Atheroscler Rep. 2014;16(7):419. doi:10.1007/s11883-014-0419-z
6. Dikaiakou E, Vlachopapadopoulou EA, Paschou SA, et al. Τriglycerides-glucose (TyG) index is a sensitive marker of insulin resistance in Greek children and adolescents. Endocrine. 2020;70(1):58–64. doi:10.1007/s12020-020-02374-6
7. Fritz J, Bjørge T, Nagel G, et al. The triglyceride-glucose index as a measure of insulin resistance and risk of obesity-related cancers. Int J Epidemiol. 2020;49(1):193–204. doi:10.1093/ije/dyz053
8. Janghorbani M, Almasi SZ, Amini M. The product of triglycerides and glucose in comparison with fasting plasma glucose did not improve diabetes prediction. Acta Diabetol. 2015;52(4):781–788. doi:10.1007/s00592-014-0709-5
9. Lopez-Jaramillo P, Gomez-Arbelaez D, Martinez-Bello D, et al. Association of the triglyceride glucose index as a measure of insulin resistance with mortality and cardiovascular disease in populations from five continents (PURE study): a prospective cohort study. Lancet Healthy Longev. 2023;4(1):e23–e33. doi:10.1016/S2666-7568(22)00247-1
10. Lim J, Kim J, Koo SH, Kwon GC, Guerrero-Romero F. Comparison of triglyceride glucose index, and related parameters to predict insulin resistance in Korean adults: an analysis of the 2007–2010 Korean National Health and Nutrition Examination Survey. PLoS One. 2019;14(3):e0212963. doi:10.1371/journal.pone.0212963
11. Zeng ZY, Liu SX, Xu H, Xu X, Liu XZ, Zhao XX. Association of triglyceride glucose index and its combination of obesity indices with prehypertension in lean individuals: a cross-sectional study of Chinese adults. J Clin Hypertens. 2020;22(6):1025–1032. doi:10.1111/jch.13878
12. Sheng G, Lu S, Xie Q, Peng N, Kuang M, Zou Y. The usefulness of obesity and lipid-related indices to predict the presence of Non-alcoholic fatty liver disease. Lipids Health Dis. 2021;20(1):134. doi:10.1186/s12944-021-01561-2
13. Ke P, Wu X, Xu M, et al. Comparison of obesity indices and triglyceride glucose-related parameters to predict type 2 diabetes mellitus among normal-weight elderly in China. Eating and weight disorders. EWD. 2022;27(3):1181–1191. doi:10.1007/s40519-021-01238-w
14. Zheng S, Shi S, Ren X, et al. Triglyceride glucose-waist circumference, a novel and effective predictor of diabetes in first-degree relatives of type 2 diabetes patients: cross-sectional and prospective cohort study. J Transl Med. 2016;14(1):260. doi:10.1186/s12967-016-1020-8
15. Mirr M, Skrypnik D, Bogdański P, Owecki M. Newly proposed insulin resistance indexes called TyG-NC and TyG-NHtR show efficacy in diagnosing the metabolic syndrome. J Endocrinol Invest. 2021;44(12):2831–2843. doi:10.1007/s40618-021-01608-2
16. Alejandro EU, Gregg B, Blandino-Rosano M, Cras-Méneur C, Bernal-Mizrachi E. Natural history of β-cell adaptation and failure in type 2 diabetes. Mol Aspects Med. 2015;42:19–41. doi:10.1016/j.mam.2014.12.002
17. Han T, Cheng Y, Tian S, et al. Changes in triglycerides and high-density lipoprotein cholesterol may precede peripheral insulin resistance, with 2-h insulin partially mediating this unidirectional relationship: a prospective cohort study. Cardiovasc Diabetol. 2016;15(1):154. doi:10.1186/s12933-016-0469-3
18. Riboldi BP, Luft VC, de Castilhos CD, et al. Glucose and triglyceride excursions following a standardized meal in individuals with diabetes: ELSA-Brasil study. Cardiovasc Diabetol. 2015;14:21. doi:10.1186/s12933-015-0181-8
19. Park HM, Lee HS, Lee YJ, Lee JH. The triglyceride-glucose index is a more powerful surrogate marker for predicting the prevalence and incidence of type 2 diabetes mellitus than the homeostatic model assessment of insulin resistance. Diabetes Res Clin Pract. 2021;180:109042. doi:10.1016/j.diabres.2021.109042
20. Unger RH. Lipotoxicity in the pathogenesis of obesity-dependent NIDDM. Genetic and clinical implications. Diabetes. 1995;44(8):863–870. doi:10.2337/diab.44.8.863
21. Robertson RP, Harmon J, Tran PO, Poitout V. Beta-cell glucose toxicity, lipotoxicity, and chronic oxidative stress in type 2 diabetes. Diabetes. 2004;53(Suppl 1):S119–24. doi:10.2337/diabetes.53.2007.S119
22. DeFronzo RA, Ferrannini E, Groop L, et al. Type 2 diabetes mellitus. Nat Rev Dis Primers. 2015;1:15019. doi:10.1038/nrdp.2015.19
23. Zhang M, Wang B, Liu Y, et al. Cumulative increased risk of incident type 2 diabetes mellitus with increasing triglyceride glucose index in normal-weight people: the Rural Chinese Cohort Study. Cardiovasc Diabetol. 2017;16(1):30. doi:10.1186/s12933-017-0514-x
24. Machann J, Thamer C, Schnoedt B, et al. Age and gender related effects on adipose tissue compartments of subjects with increased risk for type 2 diabetes: a whole body MRI/MRS study. Magma. 2005;18(3):128–137. doi:10.1007/s10334-005-0104-x
25. Zeng Y, Nie C, Min J, et al. Sex differences in genetic associations with longevity. JAMA Netw Open. 2018;1(4):e181670. doi:10.1001/jamanetworkopen.2018.1670
26. Wang X, Liu J, Cheng Z, Zhong Y, Chen X, Song W. Triglyceride glucose-body mass index and the risk of diabetes: a general population-based cohort study. Lipids Health Dis. 2021;20(1):99. doi:10.1186/s12944-021-01532-7
27. Eriksson M, Ng N. Changes in access to structural social capital and its influence on self-rated health over time for middle-aged men and women: a longitudinal study from northern Sweden. Soc Sci Med. 2015;130:250–258. doi:10.1016/j.socscimed.2015.02.029
28. Song B, Zhao X, Yao T, et al. Triglyceride glucose-body mass index and risk of incident type 2 diabetes mellitus in Japanese people with normal glycemic level: a population-based longitudinal cohort study. Front Endocrinol (Lausanne). 2022;13:907973. doi:10.3389/fendo.2022.907973
29. Er LK, Wu S, Chou HH, et al. Triglyceride glucose-body mass index is a simple and clinically useful surrogate marker for insulin resistance in nondiabetic individuals. PLoS One. 2016;11(3):e0149731. doi:10.1371/journal.pone.0149731
30. Zhang FL, Ren JX, Zhang P, et al. Strong association of waist circumference (WC), body mass index (BMI), waist-to-height ratio (WHtR), and waist-to-hip ratio (WHR) with diabetes: a population-based cross-sectional study in Jilin Province, China. J Diabetes Res. 2021;2021:8812431. doi:10.1155/2021/8812431
31. Petermann-Rocha F, Ulloa N, Martínez-Sanguinetti MA, et al. Is waist-to-height ratio a better predictor of hypertension and type 2 diabetes than body mass index and waist circumference in the Chilean population? Nutrition. 2020;79–80:110932. doi:10.1016/j.nut.2020.110932
32. Xuan W, Liu D, Zhong J, Luo H, Zhang X. Impacts of triglyceride glucose-waist to height ratio on diabetes incidence: a secondary analysis of A population-based longitudinal data. Front Endocrinol (Lausanne). 2022;13:949831. doi:10.3389/fendo.2022.949831
33. Ashwell M, Gunn P, Gibson S. Waist-to-height ratio is a better screening tool than waist circumference and BMI for adult cardiometabolic risk factors: systematic review and meta-analysis. Obes Rev. 2012;13(3):275–286. doi:10.1111/j.1467-789X.2011.00952.x
34. Lee DH, Keum N, Hu FB, et al. Predicted lean body mass, fat mass, and all cause and cause specific mortality in men: prospective US cohort study. BMJ. 2018;362:k2575. doi:10.1136/bmj.k2575
 © 2023 The Author(s). This work is published and licensed by Dove Medical Press Limited. The full terms of this license are available at https://www.dovepress.com/terms.php and incorporate the Creative Commons Attribution - Non Commercial (unported, v3.0) License.
By accessing the work you hereby accept the Terms. Non-commercial uses of the work are permitted without any further permission from Dove Medical Press Limited, provided the work is properly attributed. For permission for commercial use of this work, please see paragraphs 4.2 and 5 of our Terms.
© 2023 The Author(s). This work is published and licensed by Dove Medical Press Limited. The full terms of this license are available at https://www.dovepress.com/terms.php and incorporate the Creative Commons Attribution - Non Commercial (unported, v3.0) License.
By accessing the work you hereby accept the Terms. Non-commercial uses of the work are permitted without any further permission from Dove Medical Press Limited, provided the work is properly attributed. For permission for commercial use of this work, please see paragraphs 4.2 and 5 of our Terms.