
Back to Journals » Journal of Inflammation Research » Volume 18
Stress-Induced Hyperglycemia as an Independent Predictor of Infectious Pancreatic Necrosis in Acute Pancreatitis: A Machine Learning-Driven Prognostic Model
Authors Zhao X  , Xu J, Hu C , Xue W, Che Z , Ling R , Chen H , Feng Y, Li X, Mo S, Tian Y
Received 30 July 2025
Accepted for publication 31 October 2025
Published 12 November 2025 Volume 2025:18 Pages 15761—15777
DOI https://doi.org/10.2147/JIR.S553311
Checked for plagiarism Yes
Review by Single anonymous peer review
Peer reviewer comments 4
Editor who approved publication: Dr Nadia Andrea Andreani
Xuchen Zhao,1,* Jiale Xu,2,* Congzhong Hu,1,* Wei Xue,1 Zongyuan Che,1 Ruiqi Ling,1 Haoyang Chen,1 Yulin Feng,1 Xiaolong Li,1 Shaojian Mo,1 Yanzhang Tian1
1Department of Biliary and Pancreatic Surgery, The Third Hospital of Shanxi Medical University (Shanxi Bethune Hospital, Shanxi Academy of Medical Sciences, Tongji Shanxi Hospital), Taiyuan, Shanxi, People’s Republic of China; 2Department of General Surgery, General Hospital of Tisco (The Sixth Hospital of Shanxi Medical University), Taiyuan, Shanxi, People’s Republic of China
*These authors contributed equally to this work
Correspondence: Yanzhang Tian, Department of Biliary and Pancreatic Surgery, The Third Hospital of Shanxi Medical University (Shanxi Bethune Hospital, Shanxi Academy of Medical Sciences, Tongji Shanxi Hospital), Taiyuan, Shanxi, People’s Republic of China, Email [email protected] Shaojian Mo, Department of Biliary and Pancreatic Surgery, The Third Hospital of Shanxi Medical University (Shanxi Bethune Hospital, Shanxi Academy of Medical Sciences, Tongji Shanxi Hospital), Taiyuan, Shanxi, People’s Republic of China, Email [email protected]
Objective: To investigate the impact of stress-induced hyperglycemia (SHG) at admission on clinical outcomes in acute pancreatitis (AP) by collecting and analyzing relevant clinical data.
Methods: This study enrolled AP patients diagnosed at Shanxi Bethune Hospital from January 1, 2017, to December 31, 2022. Clinical data and 24-h laboratory indicators were retrospectively collected. We employed propensity score matching (PSM) to compare the impact of SHG on AP clinical outcomes before and after matching. A temporal split allocated patients into training/validation cohorts for developing and validating a clinical prediction model for infected pancreatic necrosis (IPN).
Results: This study included 1343 acute pancreatitis patients, with 348 having SHG at admission. Before PSM, SHG patients showed significantly longer hospital stays (13.8 vs 12.28 days, p< 0.001), higher ICU admission rates (6% vs 2%, p< 0.001), and increased infected pancreatic necrosis (IPN) (15% vs.6%). After using PSM to control for confounding factors, SHG patients maintained longer hospitalizations (13.61 vs 12.28 days, p=0.004), higher ICU admissions (6% vs 2%, p=0.005), and IPN rates (15% vs 6%, p< 0.001). These results confirm SHG as an independent poor prognostic factor for AP rather than a reflection of baseline differences. In the training cohort, seven independent IPN predictors were identified: hyperlipidemia, SHG, modified CT severity index (MCTSI), systemic inflammatory response syndrome (SIRS), Prothrombin Time Activity (PT%), LDL-C, and peripancreatic effusion. The clinical prediction model demonstrated good performance in the validation cohort, with an area under the receiver operating characteristic curve (AUC) of 0.891.
Conclusion: PSM confirmed that SHG adversely impacts clinical outcomes in acute pancreatitis. The prediction model incorporating seven variables—hyperlipidemia, SHG, MCTSI, SIRS, PT%, LDL-C, and peripancreatic effusion—demonstrated favorable predictive performance and clinical utility for infected pancreatic necrosis (IPN) in acute pancreatitis patients. Meanwhile, we developed a web-based calculator to enhance its clinical utility.
Keywords: acute pancreatitis, stress-induced hyperglycemia, propensity score matching, clinical prediction model
Introduction
Acute pancreatitis (AP), one of the most common digestive emergencies requiring urgent hospitalization, has a global annual incidence of approximately 34 per 100,000. Approximately 20% progress to severe acute pancreatitis (SAP), characterized by multiple organ dysfunction syndrome (MODS) with mortality up to 30%.1 In recent years, the incidence of AP has been increasing at an annual rate of 3.07%,2 highlighting significant health risks.
Infected pancreatic necrosis (IPN) is defined as secondary bacterial or fungal infection occurring in the context of pancreatic parenchymal or peripancreatic tissue necrosis, representing a severe local complication.3 Approximately 30% of acute necrotizing pancreatitis (ANP) patients progress to IPN,4,5 which leads to serious systemic complications such as sepsis and multiple organ failure, with mortality rates ranging between 20% and 30%.6 Early accurate IPN prediction is clinically critical, but current approaches (eg, modified CT severity index MCTSI, procalcitonin, C-reactive protein)7–10 lack a comprehensive, standardized model integrating clinical, laboratory, and radiological data.
Stress-induced hyperglycemia (SHG), transient hyperglycemia in critical illness that resolves with recovery, is an emerging prognostic biomarker linked to systemic inflammation and insulin resistance,11 which can independently predict adverse clinical outcomes in hospitalized patients.12 In AP, SHG can worsen prognosis: transient SHG on admission and first-week persistent hyperglycemia independently deteriorate outcomes,13 and it is associated with persistent organ failure, necrotic collections, severe infections, and mortality.14 Previous studies have shown that the maximum blood glucose level can be used as a predictor of infection in critically ill patients with AP.15 This suggests an association between SHG and the development of IPN. Experimental and clinical evidence indicates that SHG induces a cascade of pathological reactions such as oxidative stress and inflammatory responses through intracellular glucose overload and acute glucotoxicity, which increases the risks of organ failure, infection, and mortality, thereby exacerbating the condition of AP patients.
Current evidence on SHG in AP primarily derives from retrospective studies, which are prone to confounding factors and suffer from insufficient evidence (eg, lack of adjustment analysis, failure to balance the effects of covariates). A more accurate and clinically accessible prediction model for IPN remains to be developed and optimized. Building on our prior work on AP-related persistent organ failure (POF) risk factors and predictive models,16,17 this study adopts propensity score matching (PSM) to balance baseline data, thereby reducing confounding bias and enhancing statistical power. Meanwhile, it innovatively incorporates SHG into a machine learning (ML) model for IPN prediction in AP to improve model prediction accuracy, using large cohort data from tertiary centers. We aim to confirm SHG as a poor prognostic factor for AP and develop an ML-based IPN prediction model to guide clinical decision-making.
Methods and Materials
Study Population and Ethical Approval
This retrospective study was conducted in compliance with the principles of the Declaration of Helsinki. The study protocol was approved by the Institutional Ethics Committee of Shanxi Bethune Hospital (Approval No. YXLL-2023-237), which granted a waiver of informed consent due to the retrospective design. Data were collected from AP patients admitted to Shanxi Bethune Hospital between January 1, 2017, and December 31, 2022. All data were anonymized to protect patient privacy.
Eligibility Criteria
All patients diagnosed with AP according to the Revised Atlanta Classification (RAC)18 were meticulously screened. Inclusion required meeting both criteria: (1) hospital admission within 48 hours of abdominal pain onset; (2) age 18–80 years. Exclusion criteria: (1) Incomplete clinical data; (2) Recurrent AP hospitalization; (3) Pre-admission glucocorticoid use; (4) Chronic/traumatic/pregnancy-associated pancreatitis; (5) Malignancy; (6) Severe pre-existing cardiopulmonary/renal/cerebral comorbidities.
Study Endpoints
The primary endpoint was the development of IPN during hospitalization. Secondary endpoints included length of hospital stay, ICU admissions, and in-hospital mortality.
Treatment Protocol for Acute Pancreatitis
Patients with acute pancreatitis were managed according to current international guidelines. The cornerstone of initial management consisted of supportive care with intravenous fluids and analgesia. A moderately aggressive, goal-directed fluid resuscitation strategy was employed, and we preferentially used Lactated Ringer’s solution, with targets including a urine output of >0.5 mL/kg/hr and a decreasing blood urea nitrogen. Pain was managed with a multimodal approach, primarily using intravenous opioids such as hydromorphone or fentanyl. Nutritional support was initiated early; patients with mild pancreatitis were started on a low-fat oral diet as tolerated within 24–48 hours, while those with moderately severe or severe pancreatitis unable to tolerate oral intake received enteral nutrition via a nasogastric tube. Parenteral nutrition was avoided. Prophylactic antibiotics were not administered for sterile necrosis. Intervention for pancreatic necrosis was reserved for patients with confirmed/suspected infection or persistent symptoms (eg, gastric outlet obstruction) and was delayed for at least four weeks whenever clinically feasible to allow for walled-off necrosis formation. The intervention followed a minimally invasive, step-up approach, beginning with endoscopic or percutaneous catheter drainage, followed by direct endoscopic or surgical necrosectomy only if drainage was insufficient.
Sample Size Estimation
Sample size estimation followed the events-per-variable (EPV) principle for logistic regression, mandating ≥10 outcome events per predictor.19,20 Given 89 IPN events in the training cohort (8.3% incidence) and 7 candidate predictors, the minimum sample size was calculated as:

Our training cohort (n=1074) exceeded this threshold, ensuring model stability.
Data Collection
Data collection followed a protocol similar to that of previous studies by our team,16 with special attention paid to variables and outcomes related to infectious diseases. Data encompass four domains: (1) Demographics: age, sex, body mass index (BMI), etiology of acute pancreatitis, smoking/alcohol history, hypertension (HTN), hyperlipidemia (HPL), fatty liver, and chronic comorbidities medical history; (2) Clinical outcomes: SIRS incidence, multiple organ failure rates, local complications, surgical interventions, feeding tube placement, hospital length of stay, ICU admissions, and mortality; (3) 24-hour post-admission laboratory profiles including hepatobiliary parameters (ALT, AST, ALB, TBIL, DBIL), metabolic markers (TG, HDL-C, LDL-C, Urea, SCr, Glu), pancreatic enzymes (AMY, LPS), electrolytes (K, Na, Cl, P, Mg, Ca), coagulation indices (PT, PT%, APTT, TT, FIB, D-Dimer), and hematologic measures (WBC, NEUT, LYMPH, MONO, RBC, HGB, HCT, MCV, MCH, MCHC, RDW, PCT, PLT, PDW, MPV); (4) Inflammatory/clinical scores comprising derived indices - PLR (platelet-to-lymphocyte ratio), NLR (neutrophil-to-lymphocyte ratio), OPNI (Onodera’s prognostic nutritional index) - and validated scores: MCTSI (modified CT severity index), BISAP (Bedside Index for Severity in Acute Pancreatitis), with calculation protocols specifying: PLR/NLR/OPNI from laboratory parameters ≤24h post-admission; BISAP from EMR-documented mental status/clinical parameters ≤24h; MCTSI via CT/CECT imaging ≤48h.
Core Terminology Definitions
Acute pancreatitis diagnosis adhered to the 2012 Revised Atlanta Classification,18 requiring ≥2 of the following criteria: (1) Persistent epigastric pain; (2) Biochemical evidence (serum amylase and/or lipase >3× upper limit of normal); (3) Characteristic imaging findings on cross-sectional abdominal studies.
Acute pancreatitis severity was classified per the Revised Atlanta Classification (RAC)18: (1) Mild acute pancreatitis (MAP): No organ dysfunction or local/systemic complications; (2) Moderately severe acute pancreatitis (MSAP): Transient organ dysfunction (≤48h) and/or local complications; (3) Severe acute pancreatitis (SAP): Persistent organ dysfunction (>48 h).
Stress-induced hyperglycemia (SHG): Currently, no consensus exists on the diagnostic threshold for SHG in AP. Based on existing evidence, this study defined SHG as: Random blood glucose >10 mmol/L (180 mg/dL) within 24h of admission in non-diabetic patients, Random blood glucose >16.67 mmol/L (300 mg/dL) within 24h of admission in diabetic patients.13,14,21
Organ failure was defined per the modified Marshall scoring system as a score ≥2 in any single organ system.3
The Modified CT Severity Index (MCTSI) comprises three components: Calculated based on pancreatic inflammation, necrosis, and extrapancreatic complications. All patients underwent abdominopelvic CT on Siemens SOMATOM Definition Flash or Siemens SOMATOM Definition AS 128-slice CT scanners within 48 hours of admission, with scans independently reviewed by two experienced radiologists.
Peripancreatic effusion: Fluid accumulation around the pancreas confirmed by abdominal CT within 48 hours of admission.
Infected pancreatic necrosis (IPN) was diagnosed by the presence of gas bubbles within pancreatic or peripancreatic effusion on contrast-enhanced CT.3
The Bedside Index for Severity in Acute Pancreatitis (BISAP) incorporates five clinical parameters: (1) Blood urea nitrogen (BUN) >25 mg/dL; (2) Impaired mental status (Glasgow Coma Scale <15); (3) Systemic inflammatory response syndrome (SIRS); (4) Age >60 years; (5) Pleural effusion on imaging. Each parameter present assigns 1 point, yielding a total score range of 0–5.
Systemic inflammatory response syndrome (SIRS) is defined by the presence of ≥2 criteria: (1) Heart rate >90 beats/min; (2) Temperature <36°C or >38°C; (3) White blood cell count <4×10⁹/L or >12×109/L; (4) Respiratory rate >20 breaths/min or PaCO2 < 32 mmHg.
The Onodera Prognostic Nutritional Index (OPNI) is defined as: OPNI = Serum albumin level (g/L) + 5 × peripheral lymphocyte count (109/L).
Data Processing and Statistical Analysis
Statistical analyses were performed using R software (version 4.4.2). Variables with >25% missing data were excluded. For variables with ≤25% missingness, multiple imputation was implemented via the mice package. Continuous variables meeting assumptions of normality (Shapiro–Wilk test), independence, and homogeneity of variance (Levene’s test) are expressed as mean ± standard deviation and compared using independent samples t-tests. Non-normally distributed continuous variables are presented as median (interquartile range; IQR) and analyzed with Mann–Whitney U-tests. Categorical variables are reported as frequencies (percentages), with between-group comparisons performed using χ2 or Fisher’s exact tests. A two-tailed P-value <0.05 defined statistical significance.
We implemented propensity score matching (PSM) using the R package MatchIt. Patients were stratified based on the presence of SHG at admission. Matching covariates included gender, age, BMI, smoking status, alcohol use, hypertension, hyperlipidemia, fatty liver, chronic comorbidities medical history, and etiology of acute pancreatitis. A 1:2 optimal nearest neighbor matching algorithm was applied, though matching ratios varied due to cohort size constraints. To ensure match quality, a caliper width of 0.02 standard deviations was enforced. Correlation heatmaps visualizing variable relationships were generated using ggplot2 and corrplot packages.
Patients were stratified by IPN occurrence. Variable selection employed least absolute shrinkage and selection operator (LASSO) regression. Predictors with non-zero coefficients in LASSO underwent multivariable logistic regression (retention threshold: P<0.05) to identify independent risk factors. Receiver operating characteristic (ROC) curves quantified model discrimination in training/validation cohorts, reporting area under the curve (AUC) with 95% confidence intervals. Calibration curves and decision curve analysis (DCA) assessed clinical utility. We implemented internal validation in the training cohort through 10-fold cross-validation and 1000-iteration bootstrap resampling, then constructed a clinically deployable nomogram to visualize the prediction model for point-of-care application.
Results
From an initial cohort of 1586 acute pancreatitis patients, 243 cases were excluded, yielding 1343 patients for final analysis. Missing data patterns are detailed in Supplementary Figure 1. The patient enrollment flowchart is shown in Figure 1.
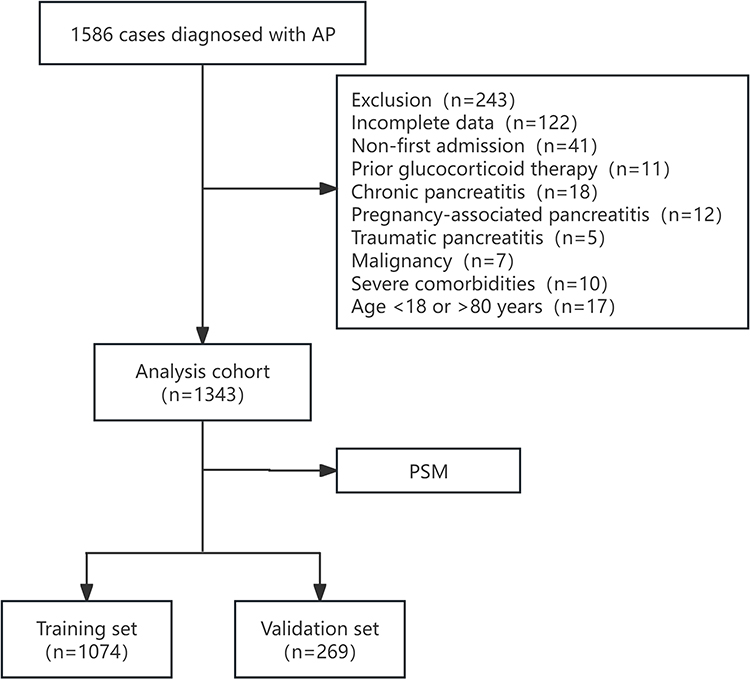 |
Figure 1 Flowchart of patient enrollment. |
To Study the Effect of SHG on the Clinical Outcomes of AP Based on PSM
Comparison of Clinical Features Between Groups Before PSM
Among 1343 patients in the analysis cohort, 348 (25.9%) presented with SHG at hospital admission.
As shown in Table 1, patients with SHG at admission demonstrated significantly higher BMI (26.33 vs 25.57; p=0.003), greater prevalence of hyperlipidemia (32% vs 20%; p<0.001) and fatty liver (35% vs 21%; p<0.001) medical history compared to non-SHG patients. Moreover, the SHG group had a higher proportion of hyperlipidemic pancreatitis. However, no significant differences were observed in gender, age, smoking/alcohol history, hypertension, or other chronic comorbidities medical history.
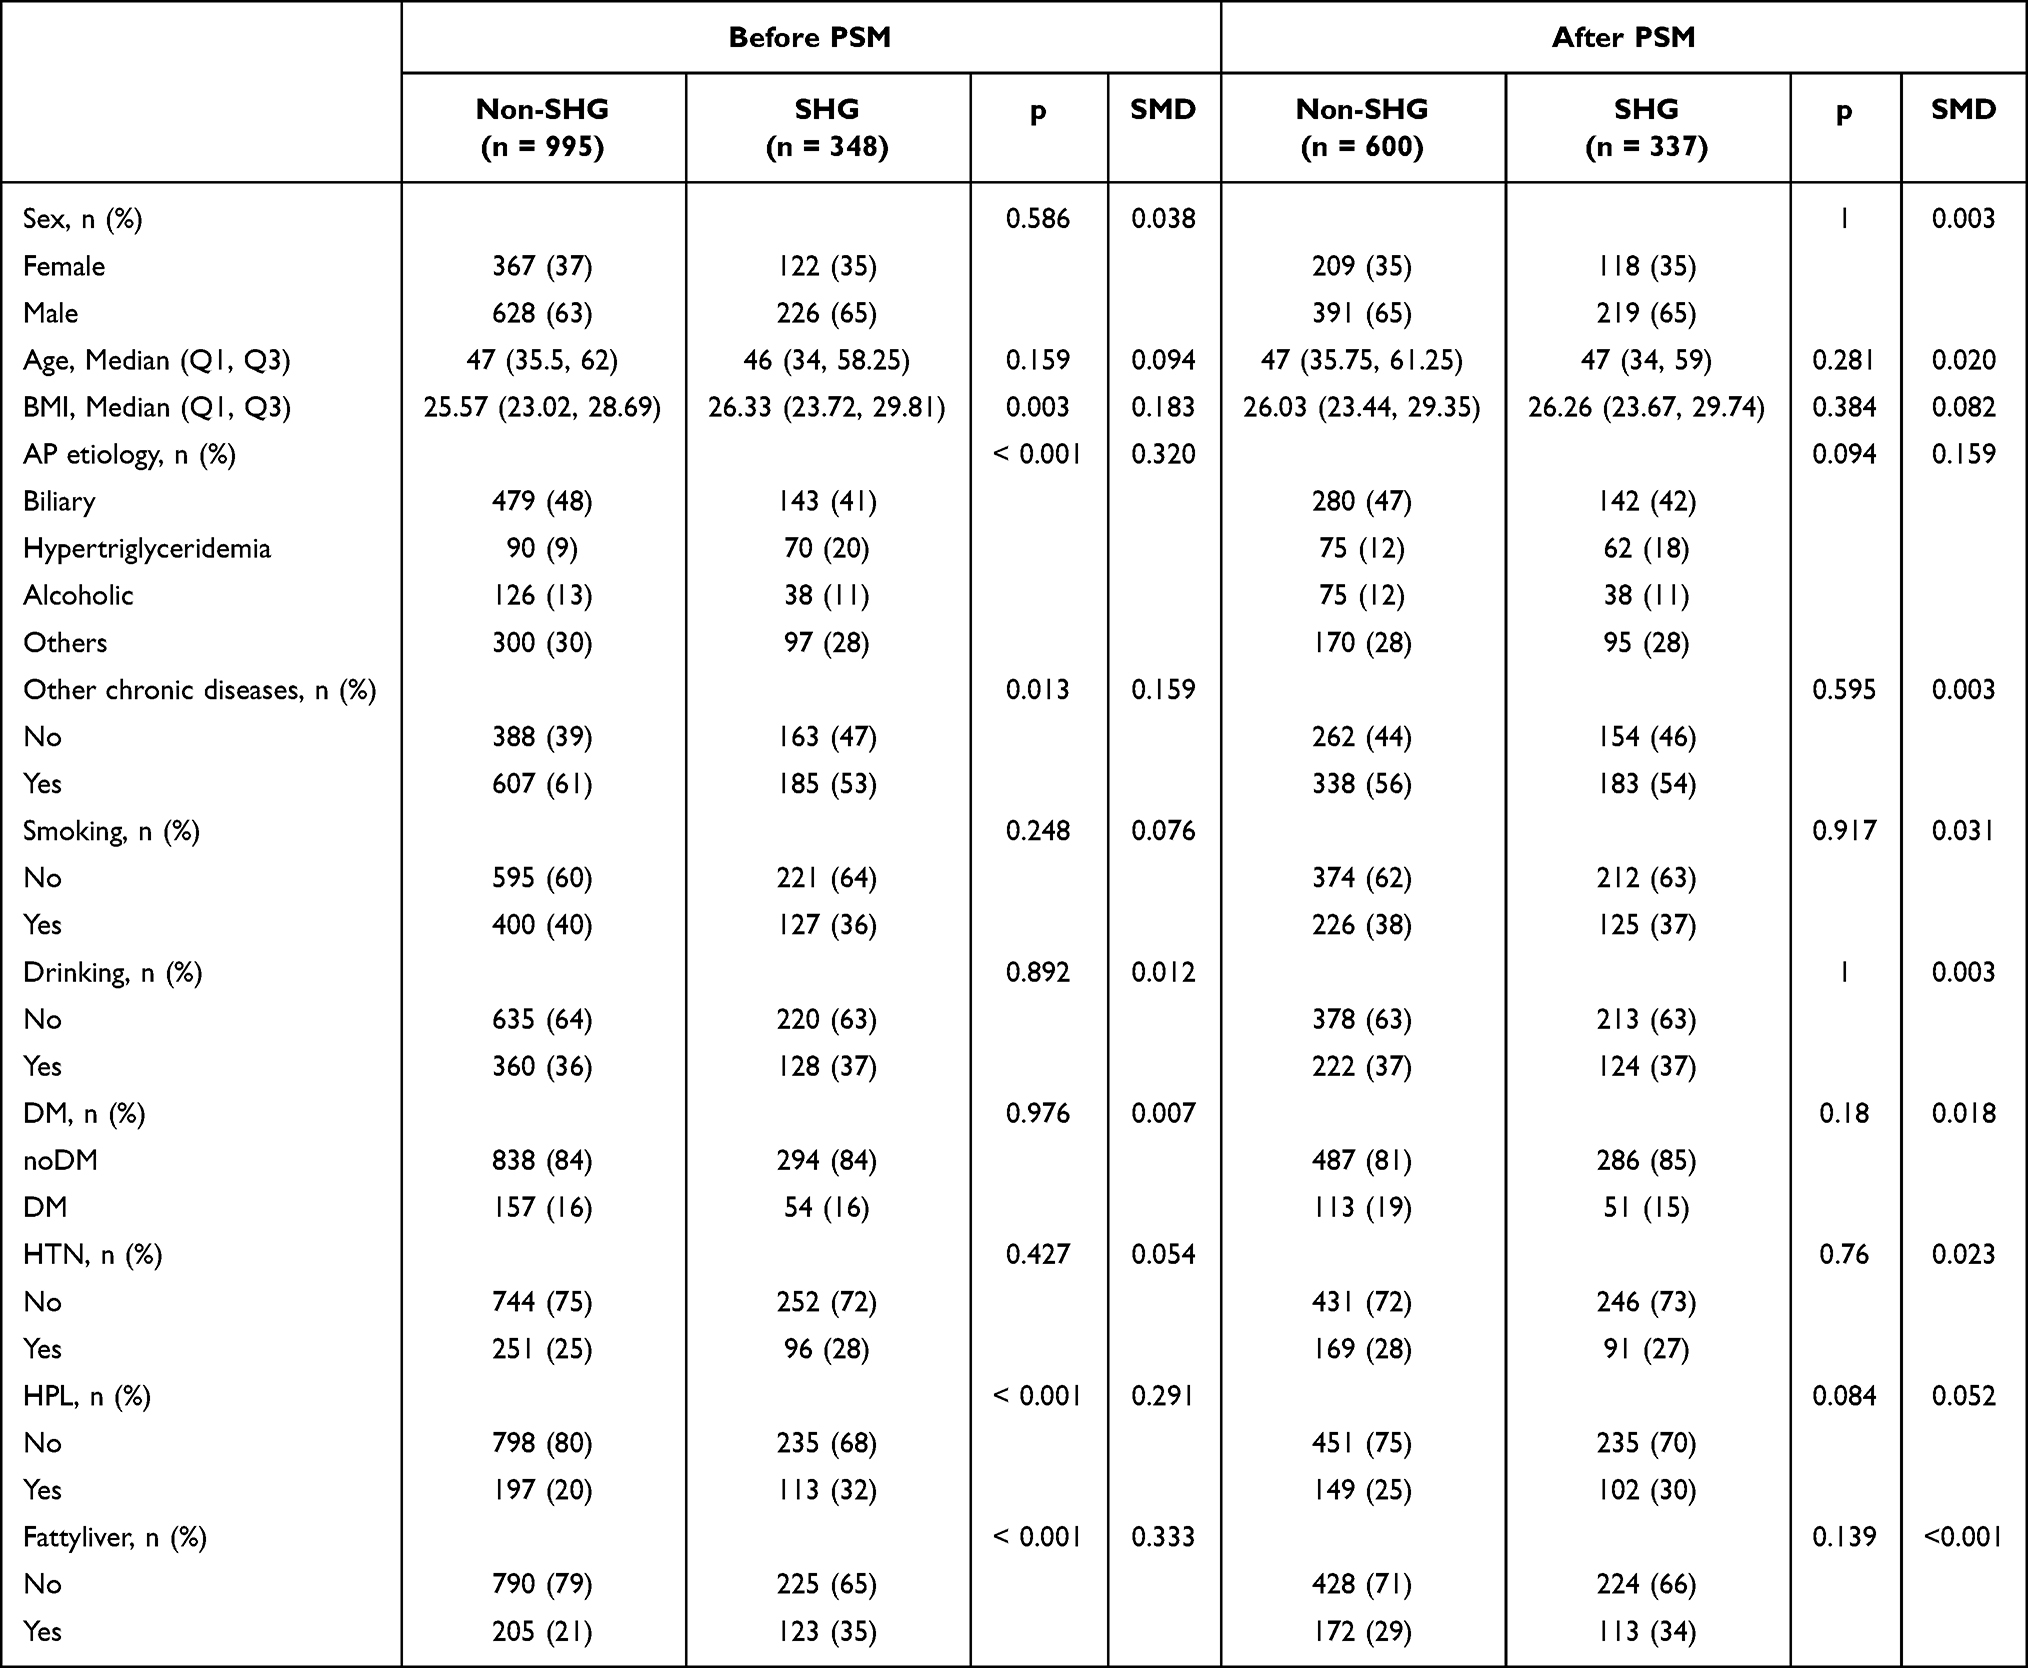 |
Table 1 Baseline Characteristics of SHG and Non-SHG Groups Before and After Propensity Score Matching (PSM) |
Table 2 demonstrates that patients with SHG had significantly worse clinical outcomes: prolonged hospitalization (13.8 vs 12.28 days; p<0.001), higher ICU admission rates (6% vs 2%; p<0.001), increased moderate-severe AP incidence (50% vs 35%; p<0.001), and elevated complications including SIRS (54% vs 38%; p<0.001), MODS (37% vs 23%; p<0.001), peripancreatic effusion (44% vs 34%; p=0.001), IPN (15%vs.6%; p<0.001), and percutaneous drainage requirements (9% vs 4%; p<0.001).
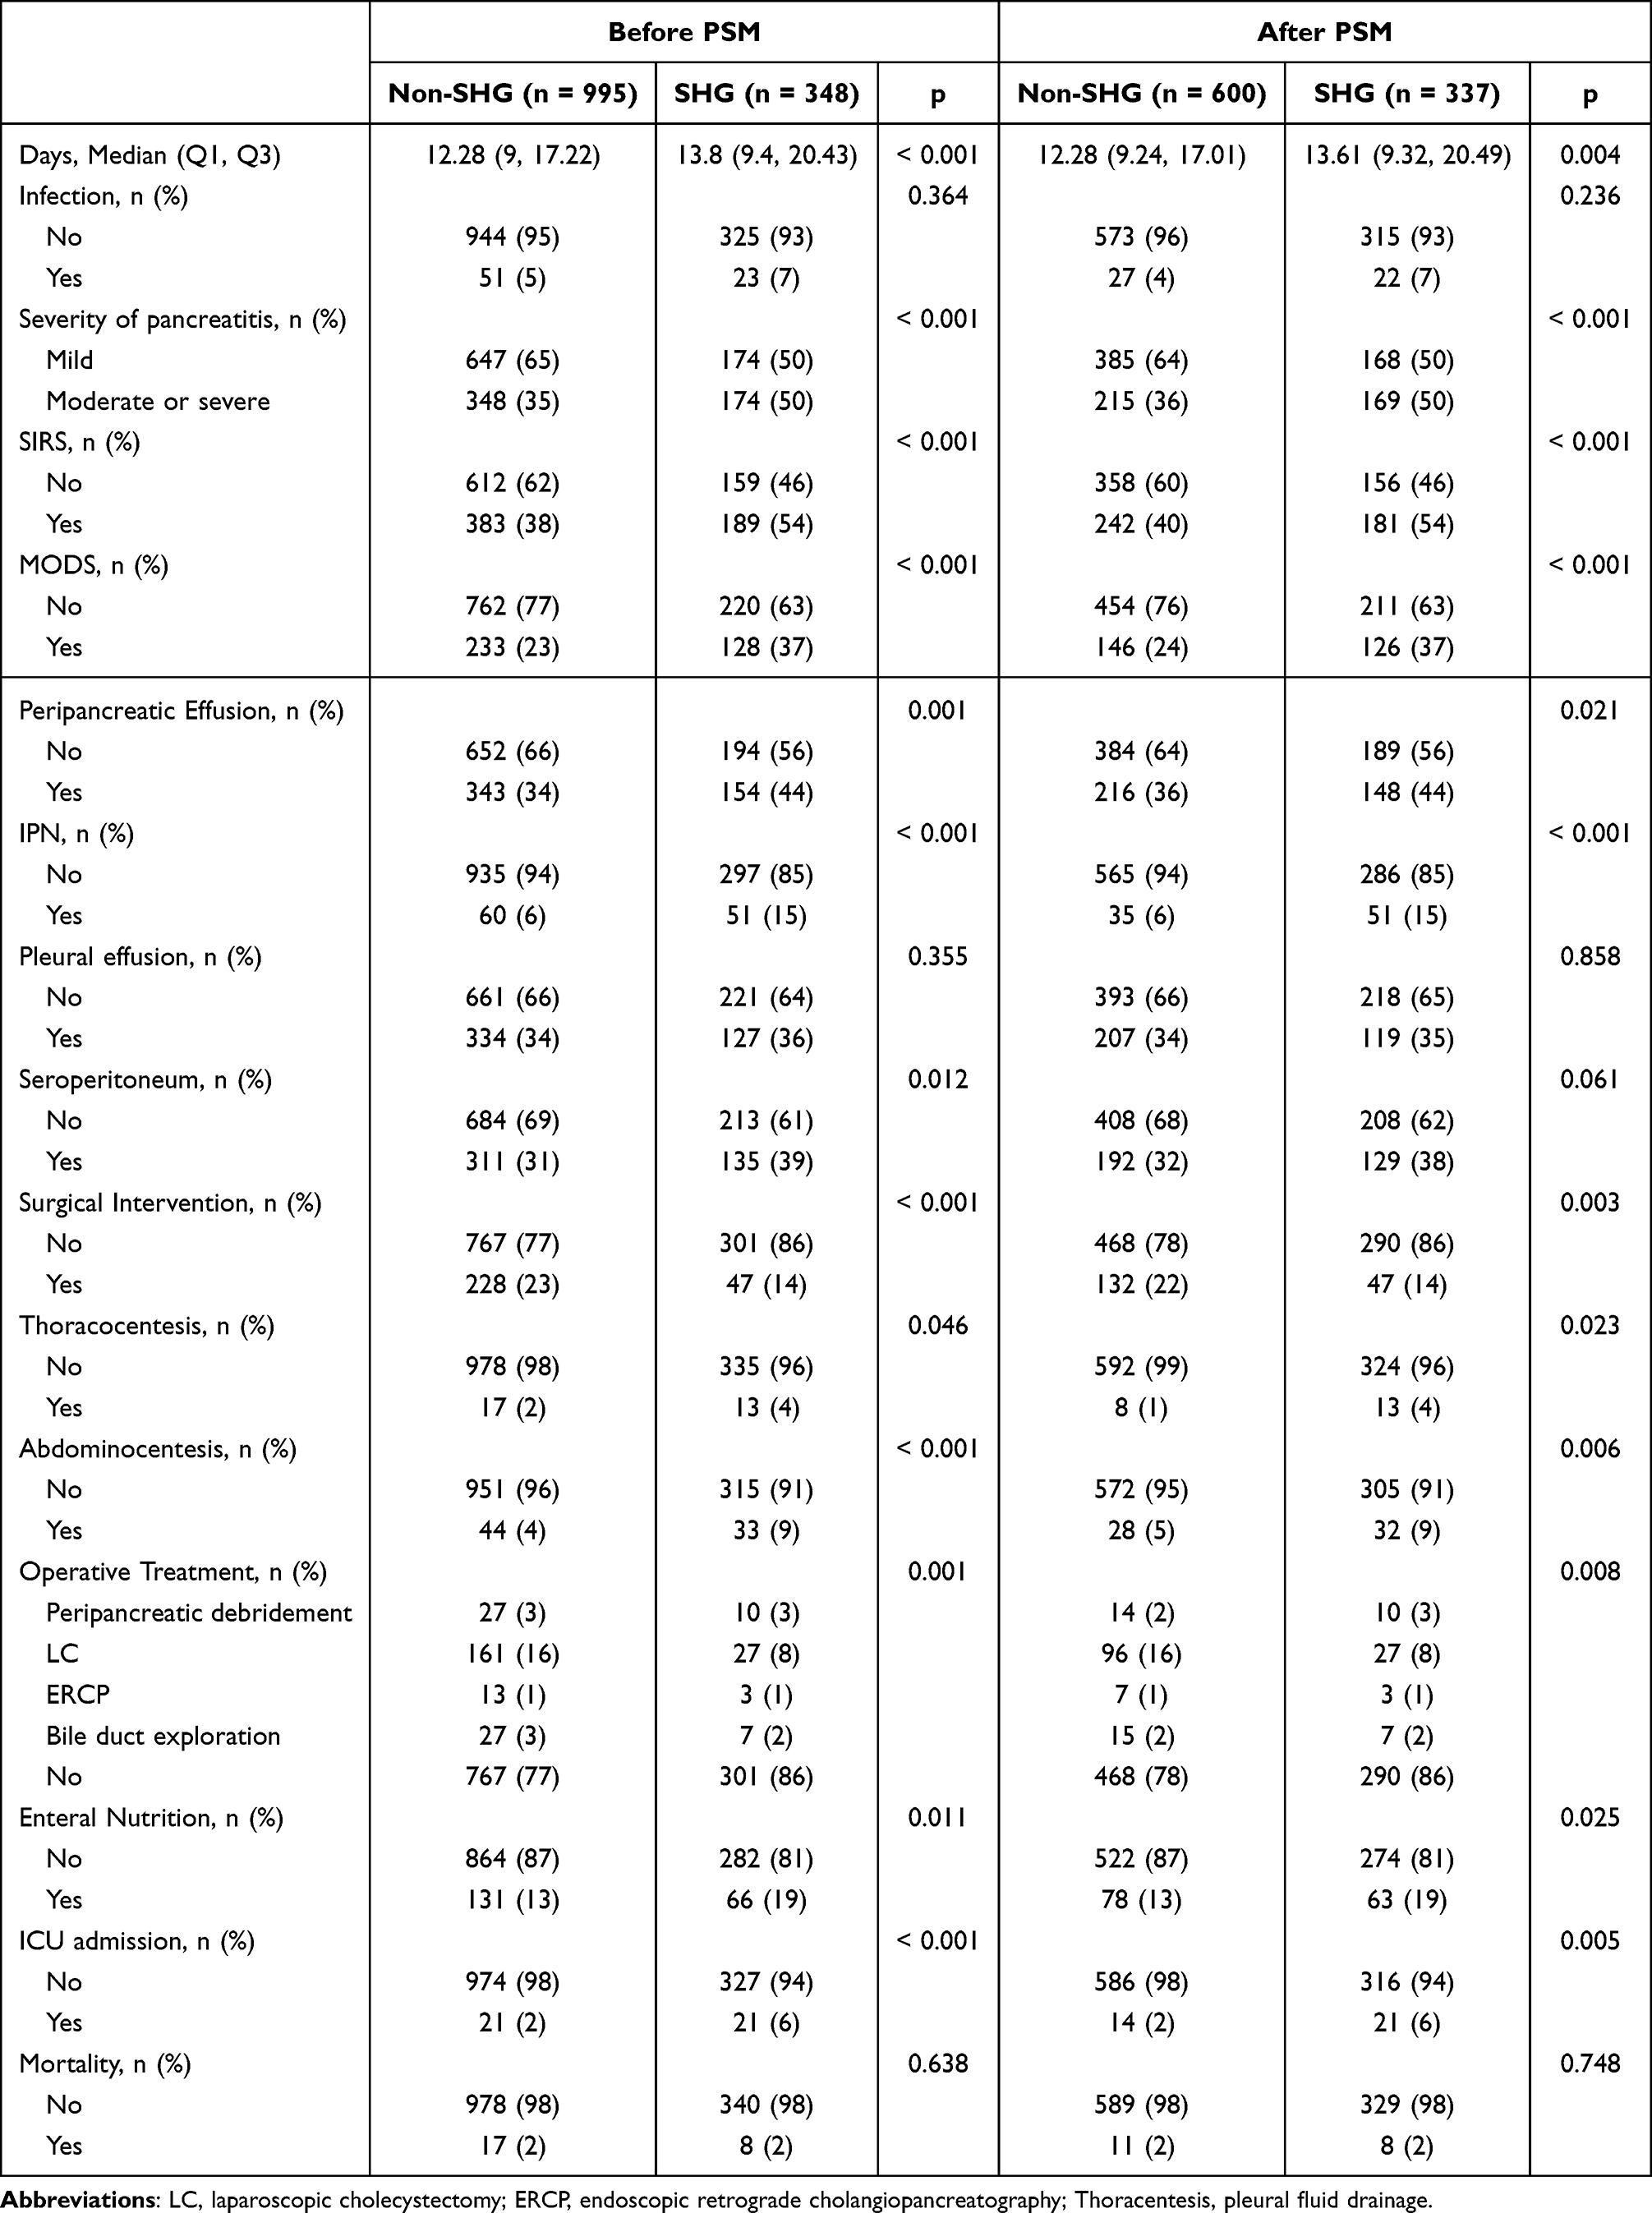 |
Table 2 Clinical Characteristics of SHG and Non-SHG Groups Before and After Propensity Score Matching (PSM) |
Comparison of Clinical Features Between Groups After PSM
Given pre-match disparities in BMI, hyperlipidemia, fatty liver history, and AP etiology distribution that could confound outcomes, we performed PSM to minimize confounding bias. Using 1:2 optimal nearest neighbor matching with a caliper width of 0.02 (SHG group as reference), covariates included gender, age, BMI, AP etiology, smoking, alcohol use, hypertension, hyperlipidemia, diabetes, fatty liver, and chronic comorbidities medical history. Due to cohort size limitations, unmatched cases were excluded, yielding 937 successfully matched cases (Table 1). Post-match probability density plots (Figure 2) demonstrated balanced propensity score distributions, indicating adequate matching quality. After PSM, significant differences in clinical outcomes were still observed between the two groups (Table 2).
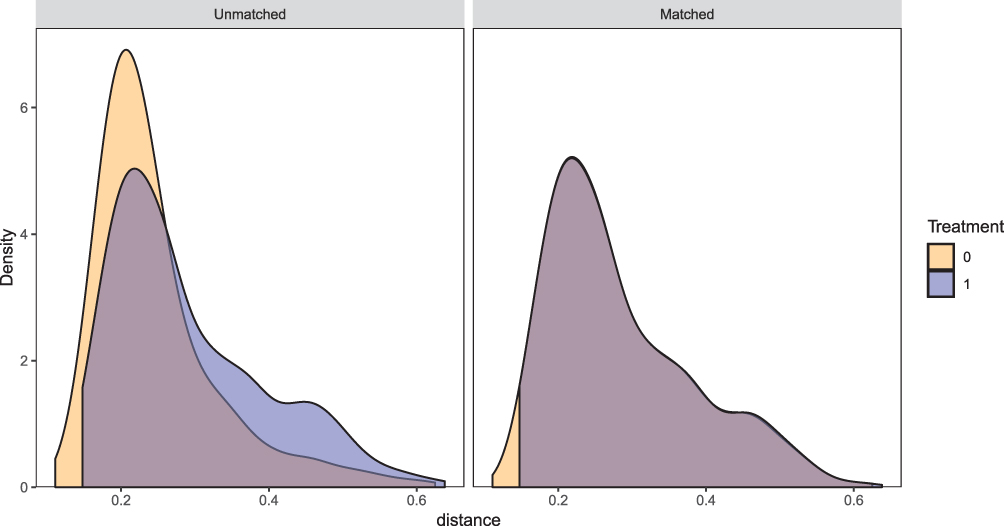 |
Figure 2 Probability density curves before and after matching. Purple: Patients with SHG. Yellow: Patients without SHG. The curves demonstrate good matching of demographic characteristics between the two groups after propensity score matching. |
We assessed the balance of baseline covariates between the two groups before and after PSM by calculating the standardized mean difference (SMD). As shown in Figure 3, significant imbalances were present in several baseline characteristics prior to matching, including fatty liver, AP etiology, and HPL. After PSM, the SMDs for all covariates were substantially reduced, indicating that a good balance was achieved across all baseline variables. This result demonstrates that the PSM procedure effectively minimized the selection bias and confounding effects from the observed covariates.
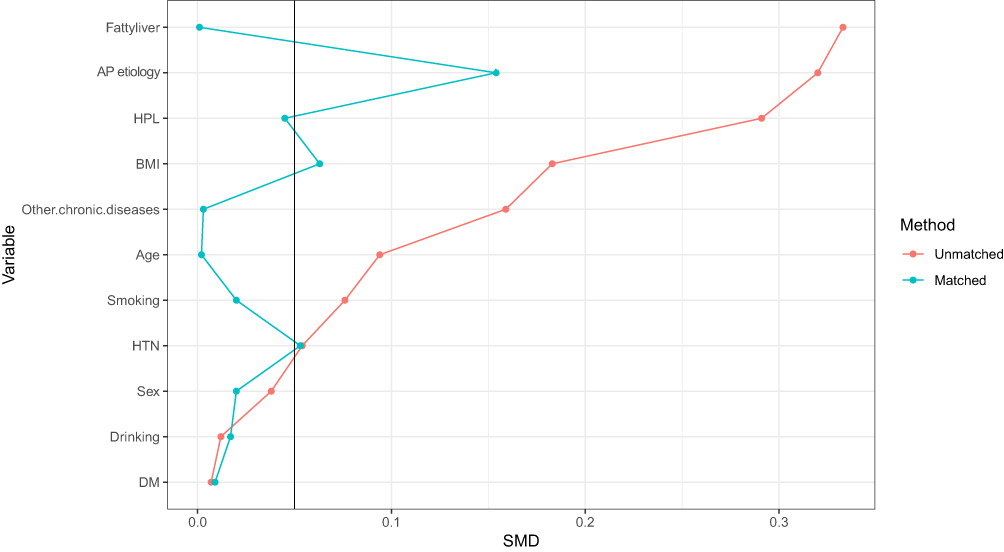 |
Figure 3 Standardized mean differences (SMDs) of baseline characteristics before and after propensity score matching. The vertical line indicates an SMD of 0.1. After matching, the SMDs for all covariates were substantially reduced, suggesting a good balance was achieved between the groups. |
Establishment of a Clinical Prediction Model for Infected Pancreatic Necrosis
The 1343 eligible AP patients were temporally split into training and validation sets. The training cohort consisted of 1074 patients admitted to Shanxi Bethune Hospital from January 2017 to December 2021, while the validation cohort comprised 269 patients admitted to Shanxi Bethune Hospital from January 2022 to December 2022.
Comparison of Baseline Traits in Training and Validation Sets
Supplementary Table 1 shows the baseline characteristics and clinical parameters of all patients in the training and validation cohorts. Among the variables in the two cohorts, four variables showed significant differences between the training cohort and the validation cohort: high-density lipoprotein cholesterol, low-density lipoprotein cholesterol, blood urea, and amylase.
Supplementary Table 2 shows the general characteristics of the overall study population grouped by IPN. It can be observed that the clinical outcomes of the IPN group were significantly worse. At the same time, there were also significant differences in various clinical parameters between the two groups.
Correlation Heatmap Analysis of Predictive Variables in the Training Cohort
Figure 4 displays the correlation matrix of the training cohort to illustrate the relationships between various predictive variables. Light-colored cells mainly indicate weak interactions between variables, while dark blue and red areas represent strong positive and negative correlations, respectively. For example, there is a significant positive correlation between plateletcrit (PCT) and RBC, while MCTSI shows a negative correlation with serum calcium. These patterns highlight how research variables are interrelated and influence each other, thus reinforcing the necessity of considering these relationships during the analysis.
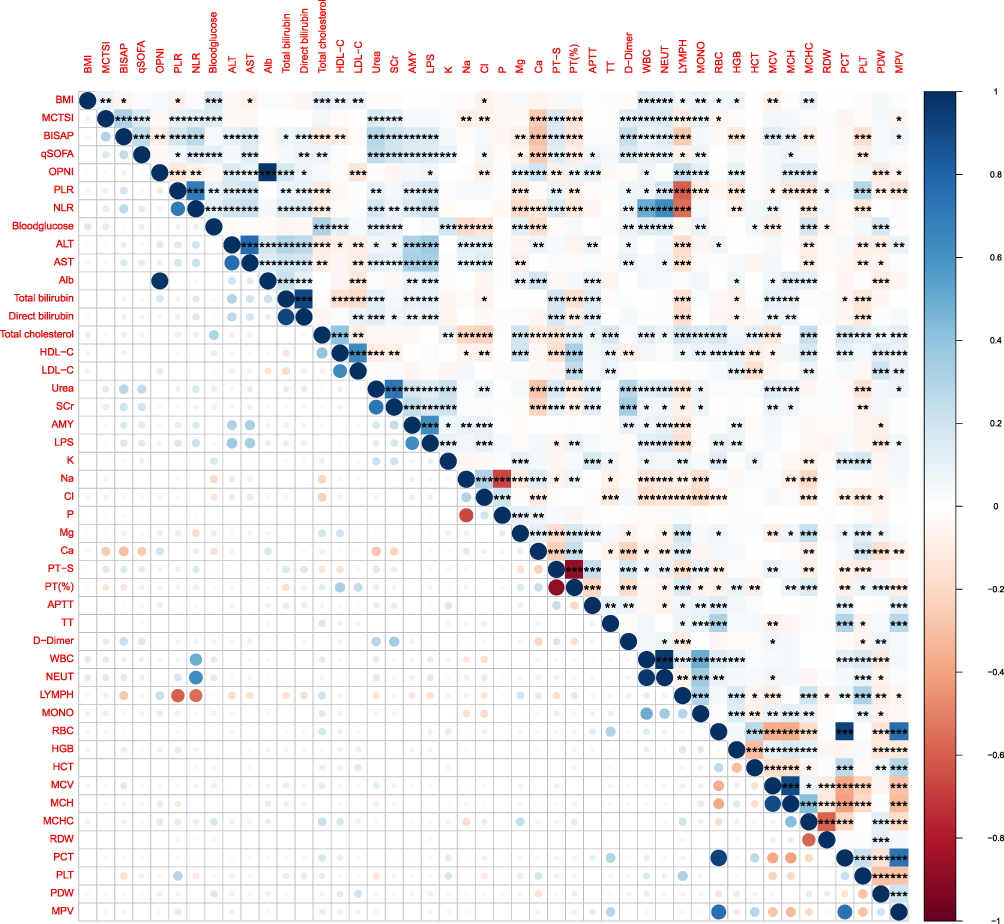 |
Figure 4 Correlation heatmap of baseline clinical and laboratory parameters. The correlation coefficient between variables is represented by the shade of grey in each cell, corresponding to the scale at the bottom, which ranges from −1 (strong negative correlation) to +1 (strong positive correlation). The asterisks denote the level of statistical significance: * p<0.05, ** p<0.01, and *** p<0.001. |
Predictor Screening and Construction of Prediction Model
We initially selected meaningful predictive factors using LASSO regression. Then, we further selected independent predictive factors by excluding confounding factors through multivariate Logistic regression.
We used 10-fold cross-validation to determine the optimal tuning parameter λ for the model and identified 11 variables with non-zero coefficients: MCTSI, LDL-C, PT (%), serum calcium, history of hyperlipidemia at admission, stress-induced hyperglycemia, SIRS, MODS, peripancreatic effusion, pleural effusion, and ascites (Figure 5A and B). These variables demonstrated good predictive ability in the model. Using these important indicators, we further constructed a multivariate logistic regression model, which identified seven key risk factors for acute pancreatitis complicated with IPN: MCTSI, LDL-C, PT (%), history of hyperlipidemia at admission, stress-induced hyperglycemia, SIRS, and peripancreatic effusion. These seven factors were statistically significant (p<0.05), verifying their importance in predicting IPN complicated by AP. The OR values, 95% confidence intervals, and forest plot of the seven final predictive variables for the outcome are shown in Figure 6.
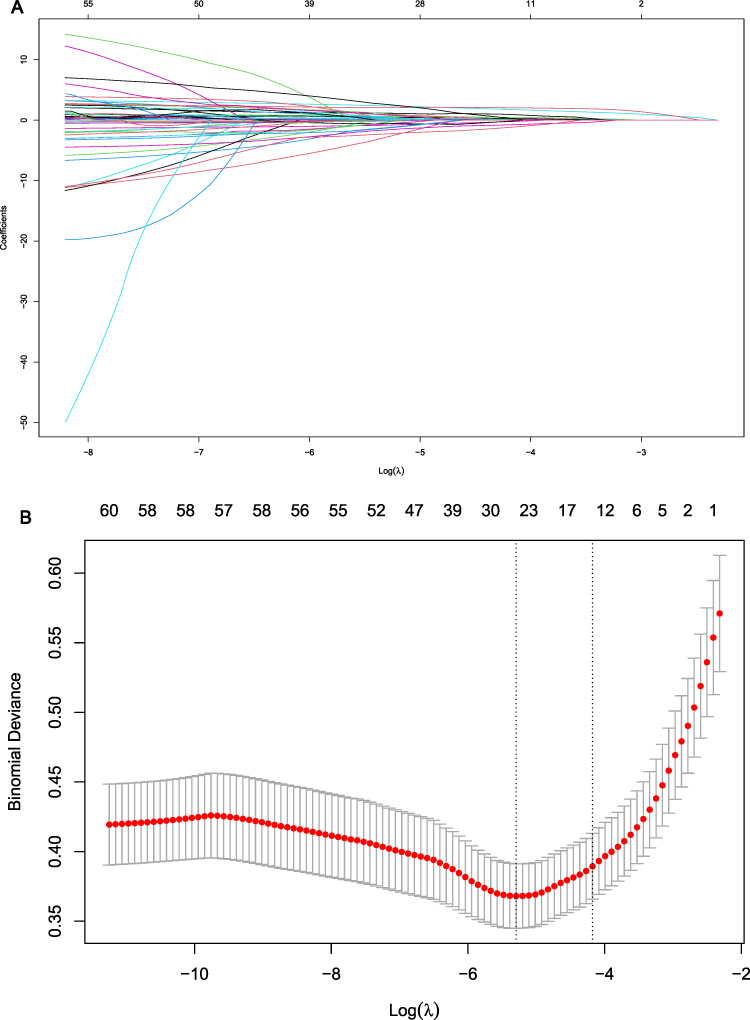 |
Figure 5 Screening of predictive variables using LASSO regression. (A) Coefficient paths of various variables: The X-axis represents Log(λ), and the Y-axis represents variable coefficients. Lines of different colors denote distinct variables. As Log(λ) changes, most variable coefficients approach zero. Eventually, 11 variables with non-zero coefficients are identified, highlighting their importance in the model. (B) Relationship between binomial deviance and Log(λ): Each red dot represents the binomial deviance for a specific λ value, with error bars indicating the standard error of deviance. The figure shows that as Log(λ) increases, the binomial deviance first decreases and then increases, reaching a minimum point to determine the optimal λ. |
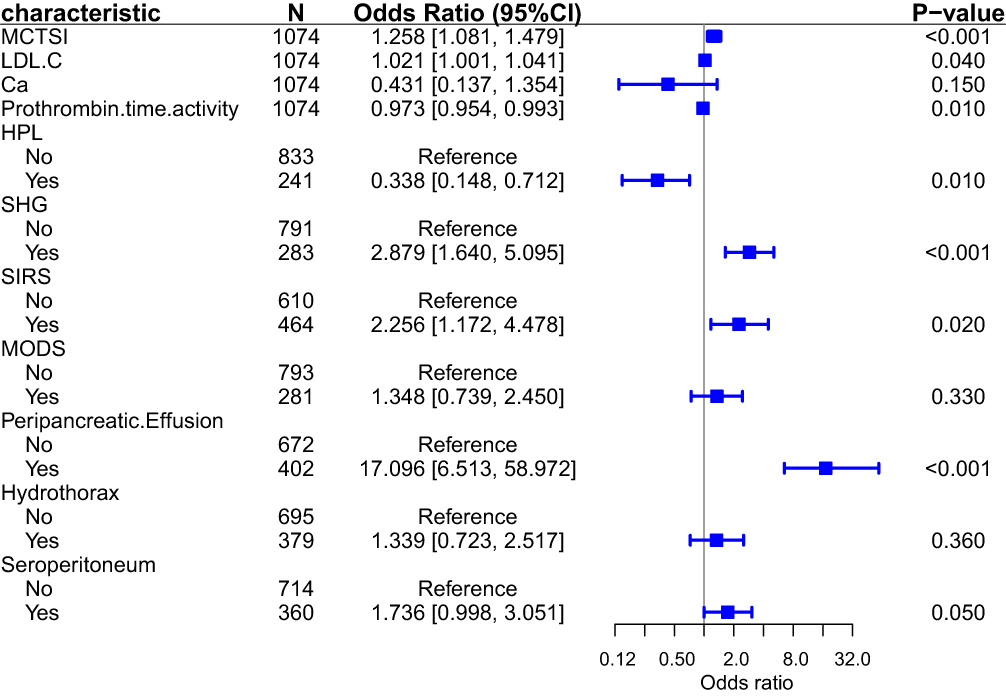 |
Figure 6 Forest plot of multivariate logistic regression analysis for risk factors. The plot displays the odds ratios (squares) and 95% confidence intervals (horizontal lines) for each characteristic. Statistical significance was defined as a P-value < 0.05; P-values < 0.001 indicate strong statistical significance. |
Model Visualization
Using R software, we visualized the model based on these seven predictive factors and constructed a nomogram to predict IPN (Figure 7A). Meanwhile, we developed a web calculator based on the nomogram to simplify the calculation process and generate more accurate predictive values for clinical use (Figure 7B). For details, please visit the following website (https://zxc102609.shinyapps.io/dynnomapp/). The nomogram provides a visual representation of the impact of each predictive factor, which is helpful for clinicians to conduct individualized risk assessments in clinical practice.
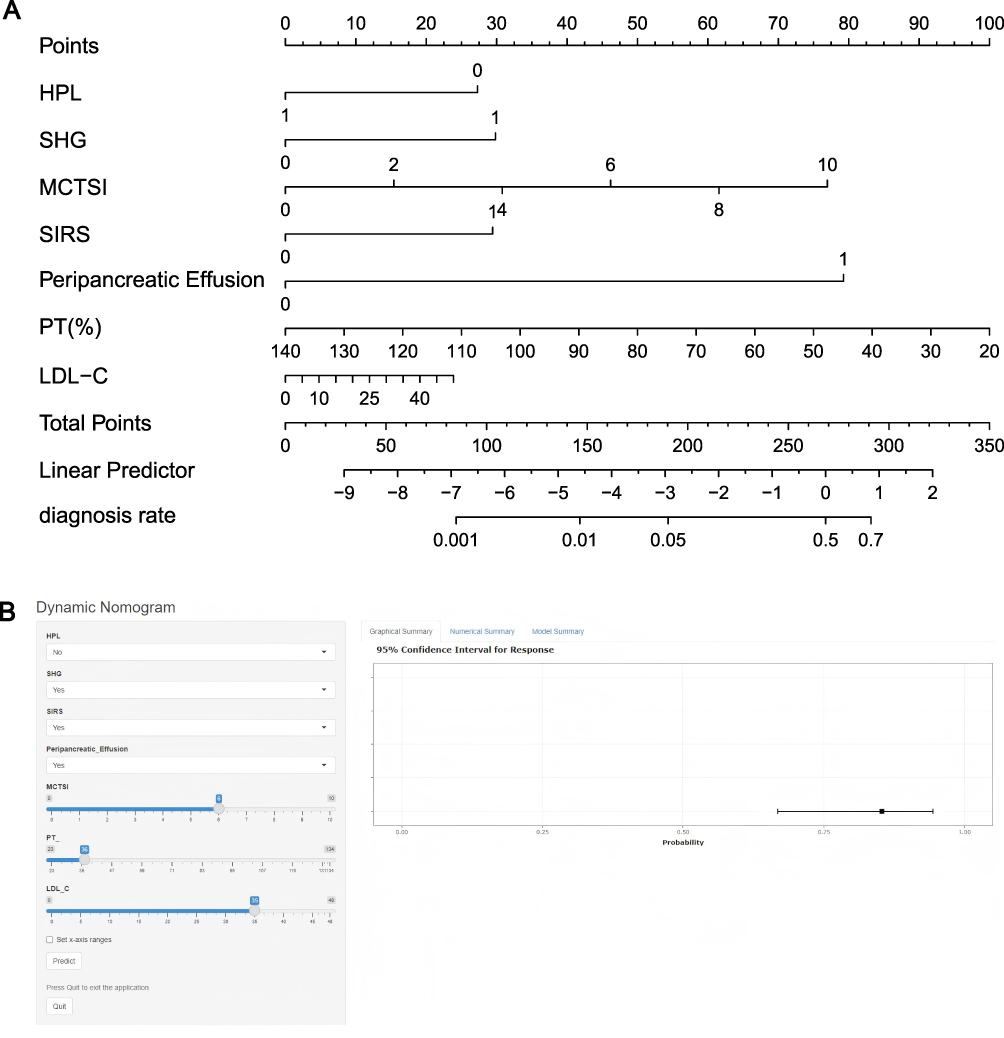 |
Figure 7 Model Visualization: (A) Nomogram for predicting IPN in AP patients; (B) Web calculator for predicting IPN in AP patients. |
Model Prediction Performance Evaluation
To comprehensively evaluate the model’s performance, we assessed its performance from three aspects (discriminative ability, calibration, and clinical decision-making efficacy) in both the training and validation cohorts.
In the Training Cohort, The model demonstrated excellent predictive accuracy with an AUC of 0.917 (Figure 8A). In the calibration curve, the model’s calibration curve showed good agreement with the ideal diagonal line (Figure 8B), reflecting the consistency between predicted probabilities and actual outcomes. To reduce the impact of randomness in data partitioning and fully utilize the dataset, we performed internal validation using both the Bootstrap method (1000 iterations) and 10-fold cross-validation. The results showed that the model’s C-index stabilized above 0.85, indicating good predictive consistency and stable predictive ability across different data subsets (Supplementary Figure 2).
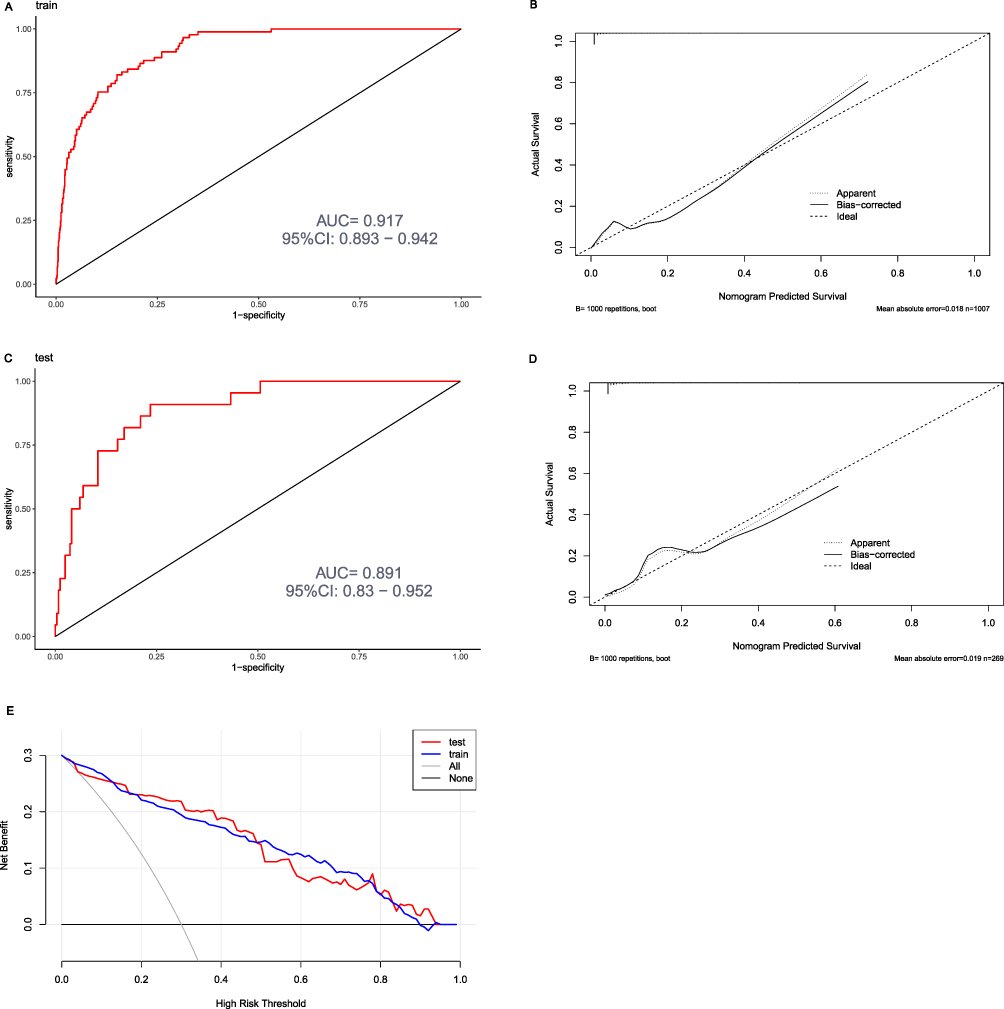 |
Figure 8 Model Performance Evaluation: (A) ROC curve for the training cohort with an area under the curve (AUC) of 0.917 (95% confidence interval [CI]: 0.893–0.942); (B) Calibration curve for predicting infectious pancreatic necrosis (IPN) in the training cohort; (C) ROC curve for the validation cohort with an AUC of 0.891 (95% CI: 0.830–0.952); (D) Calibration curve for predicting IPN in the validation cohort; (E) Decision curve analysis (DCA) for the training and validation cohorts. The blue curve (train) represents the training cohort, and the red curve (test) represents the validation cohort. |
To validate the model, we used 269 cases from the validation cohort to assess its accuracy. The model achieved an AUC of 0.891 in the validation cohort (Figure 8C), demonstrating good predictive efficacy for new datasets. The calibration curve also showed good consistency, indicating accurate prediction (Figure 8D). Furthermore, the decision curve analysis (DCA) of the training and validation cohort showed that within a wide range of threshold probabilities, the model’s net benefit consistently exceeded that of two extreme strategies (including all variables or no variables), demonstrating its potential clinical utility (Figure 8E).
Discussion
Principal Findings and Context
This study successfully developed and validated a machine learning-driven prognostic model identifying SHG as a significant independent predictor for infectious pancreatic necrosis (IPN) in AP. It is important to contextualize these findings in relation to our group’s prior work. Our previous research developed a clinical prediction model for AP complicated with persistent organ failure (POF)17 and compared the advantages and disadvantages of different statistical modeling methods.16 Building on this research foundation and in line with the purpose of this study, we innovatively applied propensity score matching (PSM) to control for confounding bias and differences in baseline variables. This analysis identified SHG as a significant risk factor for poor prognosis in AP, and developed a clinical prediction model for IPN that differs from previous studies. We also made innovations in statistical methods by employing the Bootstrap method and 10-fold cross-validation for internal data validation to fully utilize the data in the training set. Both the PSM-derived evidence and the inclusion of SHG as a predictor in the IPN prediction model illustrate the adverse impact of SHG on AP from two distinct perspectives, thereby strengthening the persuasiveness of the study results. Our research is expected to draw clinicians’ attention to AP complicated with stress-induced hyperglycemia and provide them with a novel and potentially more accurate tool for the early identification of high-risk IPN patients.
Pathophysiological Mechanisms Linking SHG to Adverse Outcomes in AP
This study provides new insights into the negative impact of stress-induced hyperglycemia (SHG) on the clinical outcomes of acute pancreatitis (AP), particularly IPN. Unlike previous studies that have focused more on the development of persistent organ failure in patients with AP complicated by SHG,14,22 our study centers on predicting the occurrence of IPN. The key findings indicate that SHG at admission is not only associated with worse clinical outcomes in AP patients but also independently predicts the occurrence of IPN through a predictive model integrating lipid metabolism disorders and systemic inflammation markers. To the best of our knowledge, this is the first study to incorporate SHG as an independent predictor into a clinical prediction model for AP prognosis. These results, together with emerging evidence, suggest a key role of glycemic dysregulation in the pathogenesis of pancreatic infection.15
Current studies on SHG in patients with AP are limited, and its underlying pathophysiological mechanisms remain poorly understood. Existing clinical research has shown that transient SHG at admission and persistent SHG during the first week of admission exacerbate the clinical prognosis of AP patients.13 SHG is also independently associated with persistent organ failure, acute necrotic collection, severe infection, and mortality in AP patients.14 Our study confirms the association between SHG and poor prognosis in AP. Shao et al reported that in an AP mouse model, the nuclear factor kappa-B (NF-κB) pro-inflammatory signaling pathway is activated during AP onset, promoting the recruitment of M1-polarized macrophages in the pancreas. This process induces M1 macrophages to release inflammatory extracellular vesicles (EVs) containing specific microRNAs (miRNAs), which in turn trigger pancreatic β-cell dysfunction and apoptosis, ultimately leading to hyperglycemia.23 Additionally, hyperglycemia induces excessive Notch signaling after AP, further worsening acute pancreatitis by promoting M1 phenotypic polarization of pancreatic macrophages while inhibiting their M2 polarization.23 M1-polarized macrophages represent an inflammatory response, promoting apoptosis and exacerbating AP progression by expressing inducible nitric oxide synthase (iNOS) and producing pro-inflammatory cytokines (eg, interleukin-1β, interleukin-6, and tumor necrosis factor-α).24 The interplay between immunological disruption and metabolic dysregulation facilitates the colonization of opportunistic bacteria in otherwise sterile necrotic tissue, ultimately leading to IPN.
Interpretation of the Multifactorial Prediction Model
Researchers have debated whether hyperglycemia during AP is a cause of severe disease or a consequence of its severity.25 In the early stage of AP, the body initiates systemic stress responses and autonomic nervous system–mediated stress adaptation mechanisms, increasing peripheral resistance in organ circulation to prevent excessive blood pressure drop. This vasoconstriction of resistance vessels in the systemic circulation reduces organ blood flow, including that to the gastrointestinal tract and pancreas, with the degree of reduction proportional to the intensity of the stress response. Clinical observations indicate that pancreatic blood flow disorders and pancreatic ischemia play a crucial role in the development of human AP.26–30 When pancreatic blood flow is reduced, elevated blood glucose may protect the pancreas. Under hypoxic conditions, increased glucose concentration facilitates adenosine triphosphate (ATP) formation via anaerobic glycolysis. ATP provides essential energy for intracellular activities, whereas other energy substrates require aerobic conditions for metabolism. Thus, pancreatic hyperglycemia may enhance the body’s stress adaptation. In summary, the pathophysiological relationship between SHG and AP warrants further exploration.
The Modified CT Severity Index (MCTSI) can intuitively reflect the inflammatory status of pancreatitis through imaging features, aiding in the assessment of the severity and prognosis of acute pancreatitis (AP). In our study, MCTSI emerged as an independent risk factor for infectious pancreatic necrosis (IPN), consistent with previous research.31–34 Although peripancreatic effusion is a component of MCTSI, our analysis using LASSO regression and multivariate logistic regression demonstrated its independent predictive value for IPN, effectively increasing its weight within the MCTSI framework. Clinically, MCTSI reflects the severity of overall organ structural and functional loss, while peripancreatic effusion represents a local pathological manifestation. Their combination enhances the predictive contribution to IPN.
Our study shows that elevated LDL-C is associated with the occurrence of IPN, which is different from previous studies. Khan et al demonstrated that lower serum LDL-C levels measured within 2 days of admission are closely associated with higher severity of pancreatitis.35 Other studies have shown that elevated serum triglycerides and reduced high-density lipoprotein cholesterol (HDL-C) levels are associated with persistent organ failure (POF) in acute pancreatitis.36,37 Building on case studies by other researchers involving patients with poorly controlled type 2 diabetes mellitus (T2DM) complicated by hyperlipidemic pancreatitis,38 combined with the findings in our article that SHG and HPL are independent predictors of IPN, we speculate that elevated LDL-C primarily acts as an important risk marker and “accelerator” of the pathophysiological process, representing abnormalities in lipid metabolism and disorders in glucose metabolism. It increases the risk of secondary infection in necrotic pancreatic tissue through indirect but critical pathways, such as exacerbating the inflammatory cytokine storm, microcirculatory disorders, promoting bacterial translocation, and possibly affecting the clearance of necrotic tissue.
Existing studies have shown that persistent systemic inflammatory response syndrome (SIRS) is associated with multiple organ dysfunction syndrome (MODS) and mortality in patients with AP.39 The cytokine storm associated with SIRS (eg, IL-6, TNF-α) induces endothelial cell apoptosis and activation of the coagulation system, exacerbating pancreatic microcirculatory dysfunction and forming a hypoxic microenvironment. Hypoxia further promotes bacterial translocation, ultimately leading to IPN while triggering coagulation dysfunction, causing prolonged prothrombin time (PT). Coagulation abnormalities further aggravate microcirculatory disorders, forming an “inflammation-coagulation vicious cycle” with SIRS. The inclusion of both SIRS and PT in our predictive model highlights their synergistic roles in AP progression.
Clinical Implications
The findings of this study have direct implications for clinical practice. The presence of SHG on admission should be regarded as a “red flag” for a complicated disease course, prompting heightened clinical vigilance. Our web-based calculator provides a practical tool for early risk stratification. Patients identified as high-risk for IPN could benefit from more intensive monitoring, such as serial inflammatory marker measurements and earlier consideration for contrast-enhanced CT scans to assess the extent of necrosis. While definitive guidelines are lacking, these high-risk patients may also be candidates for early transfer to a specialized high-volume center or ICU admission for aggressive supportive care. Furthermore, these results underscore the importance of attentive glycemic management in AP, although the optimal glucose targets in critically ill patients remain a subject of debate, requiring a balance to avoid iatrogenic hypoglycemia.
Strengths and Limitations
This study has several strengths, including its large cohort size, the use of PSM to control for confounding, and the development of a clinically applicable web-based tool. However, certain limitations must be acknowledged. First, as a retrospective, single-center study, our findings require external validation in diverse populations to ensure generalizability. Second, we relied on admission glucose levels and could not assess the impact of dynamic glucose fluctuations or glycemic variability, which may hold additional prognostic value. Third, the absence of glycated hemoglobin (HbA1c) data limited our ability to precisely distinguish between pre-existing undiagnosed diabetes and true, transient SHG. Additionally, patients with severe pre-existing cardiopulmonary, renal, cerebral comorbidities or malignancy were excluded from our study and our study cohort predominantly comprised patients with mild acute pancreatitis (MAP). This may have resulted in a relatively healthier study population, potentially underestimating the incidence and risk of SHG in real-world clinical settings. Finally, potential unmeasured confounders, such as variations in initial fluid resuscitation or nutritional support strategies, could not be fully accounted for. These limitations highlight important avenues for future prospective research.
Conclusion
After controlling for the effects of confounding factors using propensity score matching (PSM), our study shows that stress-induced hyperglycemia (SHG) adversely impacts multiple clinical outcomes in AP, including longer hospital stays, higher ICU admission rates, and increased IPN risk. The nomogram and web calculator—built from seven variables (SHG, hyperlipidemia, MCTSI, SIRS, PT%, LDL-C, peripancreatic effusion)—not only predict IPN with high accuracy but also reflect the overall severity of AP, providing comprehensive clinical guidance for risk stratification.
Data Sharing Statement
The data of this study are available from the corresponding author, Yanzhang Tian, upon reasonable request.
Author Contributions
All authors made a significant contribution to the work reported, whether that is in the conception, study design, execution, acquisition of data, analysis and interpretation, or in all these areas; took part in drafting, revising or critically reviewing the article; gave final approval of the version to be published; have agreed on the journal to which the article has been submitted; and agree to be accountable for all aspects of the work.
Funding
This work was supported by the Science and Technology Cooperation and Exchange Project of Shanxi Province (202104041101024) and the Central Guidance on Local Science and Technology Development Fund (YDZJSX2025D075).
Disclosure
The authors declare no competing interest in this work.
References
1. Boxhoorn L, Voermans RP, Bouwense SA, et al. Acute pancreatitis. Lancet. 2020;396(10252):726–734. doi:10.1016/S0140-6736(20)31310-6
2. Iannuzzi JP, King JA, Leong JH, et al. Global incidence of acute pancreatitis is increasing over time: a systematic review and meta-analysis. Gastroenterology. 2022;162(1):122–134. doi:10.1053/j.gastro.2021.09.043
3. Chinese Pancreatic Surgery Association, Chinese Medical Association. Guidelines for diagnosis and treatment of acute pancreatitis in China (2021). Zhonghua Wai Ke Za Zhi. 2021;59(7):578–587. doi:10.3760/cma.j.cn112139-20210416-00172
4. Banks PA, Freeman ML. Practice guidelines in acute pancreatitis. Am J Gastroenterol. 2006;101(10):2379–2400. doi:10.1111/j.1572-0241.2006.00856.x
5. Besselink MG, van Santvoort HC, Boermeester MA, et al. Timing and impact of infections in acute pancreatitis. Br J Surg. 2009;96(3):267–273. doi:10.1002/bjs.6447
6. Petrov MS, Shanbhag S, Chakraborty M, Phillips AR, Windsor JA. Organ failure and infection of pancreatic necrosis as determinants of mortality in patients with acute pancreatitis. Gastroenterology. 2010;139(3):813–820. doi:10.1053/j.gastro.2010.06.010
7. Zou M, Yang Z, Fan Y, et al. Gut microbiota on admission as predictive biomarker for acute necrotizing pancreatitis. Front Immunol. 2022;13:988326. doi:10.3389/fimmu.2022.988326
8. Mao W, Li K, Zhou J, et al. Prediction of infected pancreatic necrosis in acute necrotizing pancreatitis by the modified pancreatitis activity scoring system. United European Gastroenterol J. 2023;11(1):69–78. doi:10.1002/ueg2.12353
9. Samanta J, Dhar J, Birda CL, et al. Dynamics of serum procalcitonin can predict outcome in patients of infected pancreatic necrosis: a prospective analysis. Dig Dis Sci. 2023;68(5):2080–2089. doi:10.1007/s10620-022-07758-4
10. Rau B, Steinbach G, Baumgart K, Gansauge F, Grünert A, Beger HG. The clinical value of procalcitonin in the prediction of infected necrosis in acute pancreatitis. Intensive Care Med. 2000;26 Suppl 2(S2):S159–164. doi:10.1007/s001340051136
11. Dungan KM, Braithwaite SS, Preiser JC. Stress hyperglycaemia. Lancet. 2009;373(9677):1798–1807. doi:10.1016/S0140-6736(09)60553-5
12. Vedantam D, Poman DS, Motwani L, Asif N, Patel A, Anne KK. Stress-induced hyperglycemia: consequences and management. Cureus. 2022;14(7):e26714. doi:10.7759/cureus.26714
13. Yang X, Shi N, Yao L, et al. Impact of admission and early persistent stress hyperglycaemia on clinical outcomes in acute pancreatitis. Front Endocrinol. 2022;13:998499. doi:10.3389/fendo.2022.998499
14. Yang X, Zhang R, Jin T, et al. Stress hyperglycemia is independently associated with persistent organ failure in acute pancreatitis. Dig Dis Sci. 2022;67(5):1879–1889. doi:10.1007/s10620-021-06982-8
15. Jin Y, Tao S, Yu G, Li C, Hu Z, Jiang L. Predictive value of hyperglycemia on infection in critically ill patients with acute pancreatitis. Sci Rep. 2023;13(1):4106. doi:10.1038/s41598-023-30608-w
16. Gao X, Xu J, Xu M, et al. Nomogram and web calculator based on lasso-logistic regression for predicting persistent organ failure in acute pancreatitis patients. J Inflamm Res. 2024;17:823–836. doi:10.2147/JIR.S445929
17. Xing J, Xu M, Xu J, Liu J, He F. Development and validation of a nomogram combining pain score with laboratory indicators for predicting persistent organ failure in acute pancreatitis: a retrospective cohort study. Front Med. 2024;11:1411288. doi:10.3389/fmed.2024.1411288
18. Banks PA, Bollen TL, Dervenis C, et al. Classification of acute pancreatitis--2012: revision of the Atlanta classification and definitions by international consensus. Gut. 2013;62(1):102–111. doi:10.1136/gutjnl-2012-302779
19. Vittinghoff E, McCulloch CE. Relaxing the rule of ten events per variable in logistic and Cox regression. American J Epidemiol. 2007;165(6):710–718. doi:10.1093/aje/kwk052
20. van Smeden M, Moons KG, de Groot JA, et al. Sample size for binary logistic prediction models: beyond events per variable criteria. Statistical Methods Med Res. 2019;28(8):2455–2474. doi:10.1177/0962280218784726
21. Guan Y, Liu G, Tang F, Wu X, Shi J, Huang Q. Stress hyperglycemia in acute pancreatitis: from mechanisms to prognostic implications. Life Sci. 2025;365:123469. doi:10.1016/j.lfs.2025.123469
22. Zhu P, Wang X, Hu C, et al. The stress hyperglycemia ratio as a predictor of clinical outcomes in acute pancreatitis: a retrospective cohort study. J Clin Med. 2025;14(14):4970. doi:10.3390/jcm14144970
23. Shao Y, Wu W, Fan F, et al. Extracellular vesicle content changes induced by melatonin promote functional recovery of pancreatic beta cells in acute pancreatitis. J Inflamm Res. 2023;16:6397–6413. doi:10.2147/JIR.S430916
24. Hu N, Zhang X, Zhang X, et al. Inhibition of Notch activity suppresses hyperglycemia-augmented polarization of macrophages to the M1 phenotype and alleviates acute pancreatitis. Clin Sci. 2022;136(7):455–471. doi:10.1042/CS20211031
25. Marik PE, Bellomo R. Stress hyperglycemia: an essential survival response! Critical Care. 2013;17(2):305. doi:10.1186/cc12514
26. Bukowczan J, Warzecha Z, Ceranowicz P, Kusnierz-Cabala B, Tomaszewska R, Dembinski A. Therapeutic effect of ghrelin in the course of ischemia/reperfusion-induced acute pancreatitis. Curr Pharm Des. 2015;21(17):2284–2290. doi:10.2174/1381612821666150105152553
27. Warzecha Z, Ceranowicz P, Dembinski A, et al. Therapeutic effect of ghrelin in the course of cerulein-induced acute pancreatitis in rats. J Physiol Pharmacol. 2010;61(4):419–427.
28. Warshaw AL, O’Hara PJ. Susceptibility of the pancreas to ischemic injury in shock. Ann Surg. 1978;188(2):197–201. doi:10.1097/00000658-197808000-00012
29. Lonardo A, Grisendi A, Bonilauri S, Rambaldi M, Selmi I, Tondelli E. Ischaemic necrotizing pancreatitis after cardiac surgery. A case report and review of the literature. Italian J Gastroenterol Hepatol. 1999;31(9):872–875.
30. Gullo L, Cavicchi L, Tomassetti P, Spagnolo C, Freyrie A, D’Addato M. Effects of ischemia on the human pancreas. Gastroenterology. 1996;111(4):1033–1038. doi:10.1016/S0016-5085(96)70072-0
31. Xu J, Xu M, Gao X, et al. Clinical outcomes of diabetes mellitus on moderately severe acute pancreatitis and severe acute pancreatitis. J Inflamm Res. 2024;17:6673–6690. doi:10.2147/JIR.S478983
32. Xu L, Yu H, Chen L, et al. The modified computed tomography severity index combined with low skeletal muscle mass can better predict the severity of hypertriglyceridemia-induced pancreatitis. J Hepato-Biliary-Pancreatic Sci. 2022;29(12):1336–1345. doi:10.1002/jhbp.1198
33. Zhang R, Yin M, Jiang A, Zhang S, Liu L, Xu X. Application value of the automated machine learning model based on modified computed tomography severity index combined with serological indicators in the early prediction of severe acute pancreatitis. J Clin Gastroenterol. 2024;58(7):692–701. doi:10.1097/MCG.0000000000001909
34. Zhao X, Mao TY, Jiang KY, et al. Analysis of risk factors for acute pancreatitis complicated with pancreatic sinistral portal hypertension and construction of predictive model. Front Physiol. 2023;14:1256615. doi:10.3389/fphys.2023.1256615
35. Khan J, Nordback I, Sand J. Serum lipid levels are associated with the severity of acute pancreatitis. Digestion. 2013;87(4):223–228. doi:10.1159/000348438
36. Peng YS, Chen YC, Tian YC, et al. Serum levels of apolipoprotein A-I and high-density lipoprotein can predict organ failure in acute pancreatitis. Critical Care. 2015;19(1):88. doi:10.1186/s13054-015-0832-x
37. Nawaz H, Koutroumpakis E, Easler J, et al. Elevated serum triglycerides are independently associated with persistent organ failure in acute pancreatitis. Am J Gastroenterol. 2015;110(10):1497–1503. doi:10.1038/ajg.2015.261
38. Ahmed HM, Osman MH, Hassan SA, Dirie HM, Mohamed MA. Hypertriglyceridemia-induced acute pancreatitis with lipemic samples in a type 2 diabetic patient: a case report in a resource-limited setting. Int Med Case Reports J. 2025;18:645–649. doi:10.2147/IMCRJ.S516349
39. Mofidi R, Duff MD, Wigmore SJ, Madhavan KK, Garden OJ, Parks RW. Association between early systemic inflammatory response, severity of multiorgan dysfunction and death in acute pancreatitis. Br J Surg. 2006;93(6):738–744. doi:10.1002/bjs.5290
 © 2025 The Author(s). This work is published and licensed by Dove Medical Press Limited. The
full terms of this license are available at https://www.dovepress.com/terms
and incorporate the Creative Commons Attribution
- Non Commercial (unported, 4.0) License.
By accessing the work you hereby accept the Terms. Non-commercial uses of the work are permitted
without any further permission from Dove Medical Press Limited, provided the work is properly
attributed. For permission for commercial use of this work, please see paragraphs 4.2 and 5 of our Terms.
© 2025 The Author(s). This work is published and licensed by Dove Medical Press Limited. The
full terms of this license are available at https://www.dovepress.com/terms
and incorporate the Creative Commons Attribution
- Non Commercial (unported, 4.0) License.
By accessing the work you hereby accept the Terms. Non-commercial uses of the work are permitted
without any further permission from Dove Medical Press Limited, provided the work is properly
attributed. For permission for commercial use of this work, please see paragraphs 4.2 and 5 of our Terms.