
Back to Journals » International Journal of General Medicine » Volume 19
Stress Hyperglycemia Ratio Outperforms Admission Glucose in Predicting Coronary Slow Flow in Patients with Type 2 Diabetes Mellitus

Received 10 April 2026
Accepted for publication 25 June 2026
Published 7 July 2026 Volume 2026:19 615891
DOI https://doi.org/10.2147/IJGM.S615891
Checked for plagiarism Yes
Review by Single anonymous peer review
Peer reviewer comments 2
Editor who approved publication: Professor Arthur E. Frankel
Ömer Bedir1, İsmail Polat2
1Department of Cardiology, Adana City Training and Research Hospital, Adana, Türkiye; 2Department of Cardiology, Elazığ Fethi Sekin City Hospital, Elazığ, Türkiye
Correspondence: Ömer Bedir, Department of Cardiology Adana City Training and Research Hospital, Adana, Türkiye, Email [email protected]
Background: The coronary slow flow phenomenon (CSFP) is delayed contrast progression through the epicardial coronary arteries in the absence of significant stenosis. The stress hyperglycemia ratio (SHR) normalizes admission glucose to the estimated average glucose derived from HbA1c, separating acute glycemic excursion from chronic hyperglycemia. Whether the SHR is independently associated with CSFP in patients with type 2 diabetes mellitus (T2DM) is not known.
Methods: This retrospective case-control study enrolled 235 consecutive patients with T2DM who underwent coronary angiography between January 2022 and January 2025. Patients with epicardial stenosis exceeding 40% in any vessel, prior revascularization, or acute coronary syndrome within 30 days were excluded. Among the remaining patients, those with a corrected TIMI frame count (CTFC) above 27 in any epicardial vessel were classified as CSFP (n=112) and the rest as normal coronary flow (NCF) (n=123). The SHR was calculated as admission blood glucose (mmol/L) divided by (1.59 × HbA1c% − 2.59).
Results: The SHR was higher in the CSFP group than in the NCF group (1.42 ± 0.31 vs. 1.08 ± 0.24, p<0.001). After multivariate adjustment, it remained independently associated with CSFP (odds ratio [OR] 2.84, 95% confidence interval [CI] 1.92–4.21, p<0.001). On receiver operating characteristic analysis the area under the curve (AUC) was 0.819 (95% CI 0.760–0.876); a cutoff of 1.21 gave 78.6% sensitivity and 74.0% specificity. The SHR correlated with mean CTFC (r=0.621, p<0.001) and outperformed admission glucose alone (AUC 0.724, p=0.003).
Conclusion: In this cohort, the SHR was independently associated with CSFP and discriminated it better than admission glucose alone. Because it is calculated from two values routinely available at catheterization, admission glucose and HbA1c, the SHR is a practical candidate marker that warrants prospective validation for risk stratification in patients with T2DM undergoing coronary evaluation.
Keywords: coronary slow flow phenomenon, stress hyperglycemia ratio, type 2 diabetes mellitus, corrected TIMI frame count, coronary microvascular dysfunction
Introduction
The coronary slow flow phenomenon (CSFP) was first described by Tambe et al in 1972 as delayed angiographic contrast progression through epicardial coronary arteries despite the absence of significant stenosis.1 Among patients undergoing coronary angiography, its reported incidence ranges from 1% to 7%, and it can present as stable angina or, less commonly, as acute coronary syndrome.2,3 Despite decades of investigation, the pathophysiology of CSFP remains incompletely understood. Proposed mechanisms include microvascular dysfunction, endothelial injury, subclinical atherosclerosis, and inflammatory activation.4,5
Stress hyperglycemia — a transient rise in blood glucose during physiologic stress or acute illness — is a well-recognized predictor of adverse cardiovascular outcomes.6 In patients with established diabetes mellitus, distinguishing stress-induced from chronic hyperglycemia is not straightforward using glucose alone. The SHR addresses this limitation by normalizing admission glucose to estimated average glucose derived from HbA1c, thereby quantifying the magnitude of acute glycemic excursion above an individual’s own chronic baseline.7 SHR has since been associated with increased mortality and major adverse cardiovascular events in myocardial infarction, heart failure, and critical illness.8–10
Glucose metabolism and coronary microvascular function are closely linked. Acute hyperglycemia impairs endothelial function via oxidative stress, reduced nitric oxide bioavailability, protein kinase C activation, and a prothrombotic milieu,11,12 mechanisms plausibly underlying the disordered microvascular flow seen in CSFP. Despite this, the specific association between stress hyperglycemia and CSFP — particularly in a population where chronic hyperglycemia is ubiquitous — has not been examined.
In T2DM patients, where HbA1c reflects years of cumulative glycemic burden, the SHR uniquely captures the additional acute metabolic stress superimposed on this background. We hypothesized that the SHR, precisely because it accounts for chronic glycemic status, would be more informative than admission glucose alone in identifying T2DM patients with CSFP. This study aimed to evaluate the association between SHR and CSFP and to assess the discriminatory performance of SHR for identifying CSFP in patients with T2DM.
Materials and Methods
Study Design and Population
This retrospective case-control study was conducted at a single tertiary cardiac center between January 2022 and January 2025. The study complied with the Declaration of Helsinki and was approved by the Ethics Committee of Adana City Training and Research Hospital, Adana, Türkiye (approval no: 2025–15/616). Informed consent was waived given the retrospective design. Of 1,847 consecutive T2DM patients who underwent diagnostic coronary angiography, 235 met inclusion criteria and were enrolled. T2DM was defined per American Diabetes Association standards: fasting plasma glucose ≥126 mg/dL (≥7.0 mmol/L), HbA1c ≥6.5%, or established diagnosis with ongoing antidiabetic treatment.13 Significant epicardial stenosis was defined as a reduction in luminal diameter greater than 40% in any major coronary artery, following the adapted diagnostic criteria for CSFP.14
Inclusion criteria were: (1) confirmed T2DM with disease duration ≥6 months; (2) diagnostic coronary angiography with adequate image quality for CTFC assessment; (3) admission blood glucose and HbA1c available within 24 hours of angiography; and (4) complete clinical and laboratory data. We screened 1,847 patients, of whom 235 met all inclusion criteria and 1,612 were excluded (Figure 1). Each patient was assigned to a single exclusion category, as follows: significant coronary stenosis (>40% luminal diameter reduction; n=527), acute coronary syndrome within the preceding 30 days (n=324), missing admission glucose or HbA1c (n=96), prior coronary intervention or bypass surgery (n=156), left ventricular ejection fraction below 40% (n=87), severe chronic kidney disease with eGFR below 30 mL/min/1.73 m2 (n=72), coronary ectasia or aneurysm (n=238), severe valvular heart disease (n=38), active infection or malignancy (n=29), medications known to affect coronary flow (n=18), inadequate angiographic image quality for CTFC measurement (n=15), and diabetes duration shorter than 6 months (n=12).
 |
Figure 1 Patient selection. Of 1,847 consecutive patients with type 2 diabetes mellitus (T2DM) who underwent coronary angiography, 1,612 were excluded and 235 met the inclusion criteria. The final cohort comprised 112 patients with coronary slow flow phenomenon (CSFP) and 123 with normal coronary flow (NCF). The exclusion criteria and the number excluded under each are shown in the diagram. Abbreviations: CSFP, coronary slow flow phenomenon; CTFC, corrected TIMI frame count; eGFR, estimated glomerular filtration rate; NCF, normal coronary flow; T2DM, type 2 diabetes mellitus. |
Coronary Angiography and TIMI Frame Count
All procedures used standard radial or femoral access with acquisition at 30 frames per second. Two experienced interventional cardiologists, blinded to clinical data and SHR values, independently reviewed all angiograms. In cases of discrepancy between the two blinded reviewers, a consensus review was performed to establish the final CTFC measurement. CTFC was calculated according to Gibson et al15 Standard distal landmarks were: left anterior descending artery (LAD), distal bifurcation (“pitchfork”); left circumflex (LCX), distal bifurcation of the longest obtuse marginal branch; right coronary artery (RCA), first posterolateral branch. The LAD frame count was divided by 1.7 to correct for vessel length. Mean CTFC was averaged across all three vessels. In patients without significant epicardial stenosis, CSFP was defined as a CTFC >27 frames in at least one epicardial artery, following the adapted criteria of Beltrame.14 Interobserver agreement for CTFC was excellent in a 50-angiogram sample (intraclass correlation coefficient = 0.92, 95% confidence interval [CI]: 0.87–0.95).
Laboratory Measurements
Venous blood samples were collected after a minimum eight-hour overnight fast. Admission glucose was measured within one hour of arrival using the hexokinase method. HbA1c was determined by high-performance liquid chromatography (National Glycohemoglobin Standardization Program-certified). Additional parameters — complete blood count, lipid profile, renal function tests, and high-sensitivity C-reactive protein (hs-CRP) — were measured using standard laboratory methods.
Calculation of the Stress Hyperglycemia Ratio
SHR was calculated using the validated formula: SHR = admission blood glucose (mmol/L)/(1.59 × HbA1c% − 2.59), as originally described and validated in cardiovascular populations.7 An SHR >1.0 indicates acute hyperglycemia above expected chronic levels.
Statistical Analysis
Analyses were conducted using SPSS version 29.0 (IBM Corp., Armonk, NY, USA). Sample size was calculated to detect a 0.3 difference in mean SHR between groups (80% power, α = 0.05), requiring a minimum of 90 patients per group. Continuous variables are expressed as means ± standard deviations or medians (interquartile ranges) after normality assessment by the Shapiro–Wilk test. Categorical variables are reported as frequencies and percentages. Between-group comparisons used the independent t test or Mann–Whitney U-test for continuous variables and the chi-square or Fisher’s exact test for categorical variables. Pearson or Spearman coefficients assessed SHR–CTFC correlations.
Univariate and multivariate logistic regression identified factors independently associated with CSFP. Variables with p<0.10 in univariate analysis were entered into the multivariate model. Collinearity was assessed by variance inflation factors (all <5.0). ROC curves evaluated discriminatory performance; the optimal cutoff was determined by Youden’s index. Subgroup analyses were conducted by HbA1c level (<7% vs. ≥7%), diabetes duration (<5 vs. ≥5 years), and insulin use. A sensitivity analysis excluded patients with SHR values above the 99th percentile. Two-tailed p<0.05 was the threshold for statistical significance.
Results
Baseline Characteristics
Of 1,847 screened patients, 235 met inclusion criteria (Figure 1). Mean age was 58.4 ± 9.2 years; 154 patients (65.5%) were male. The groups were well balanced for age, sex, and established cardiovascular risk factors (Table 1).
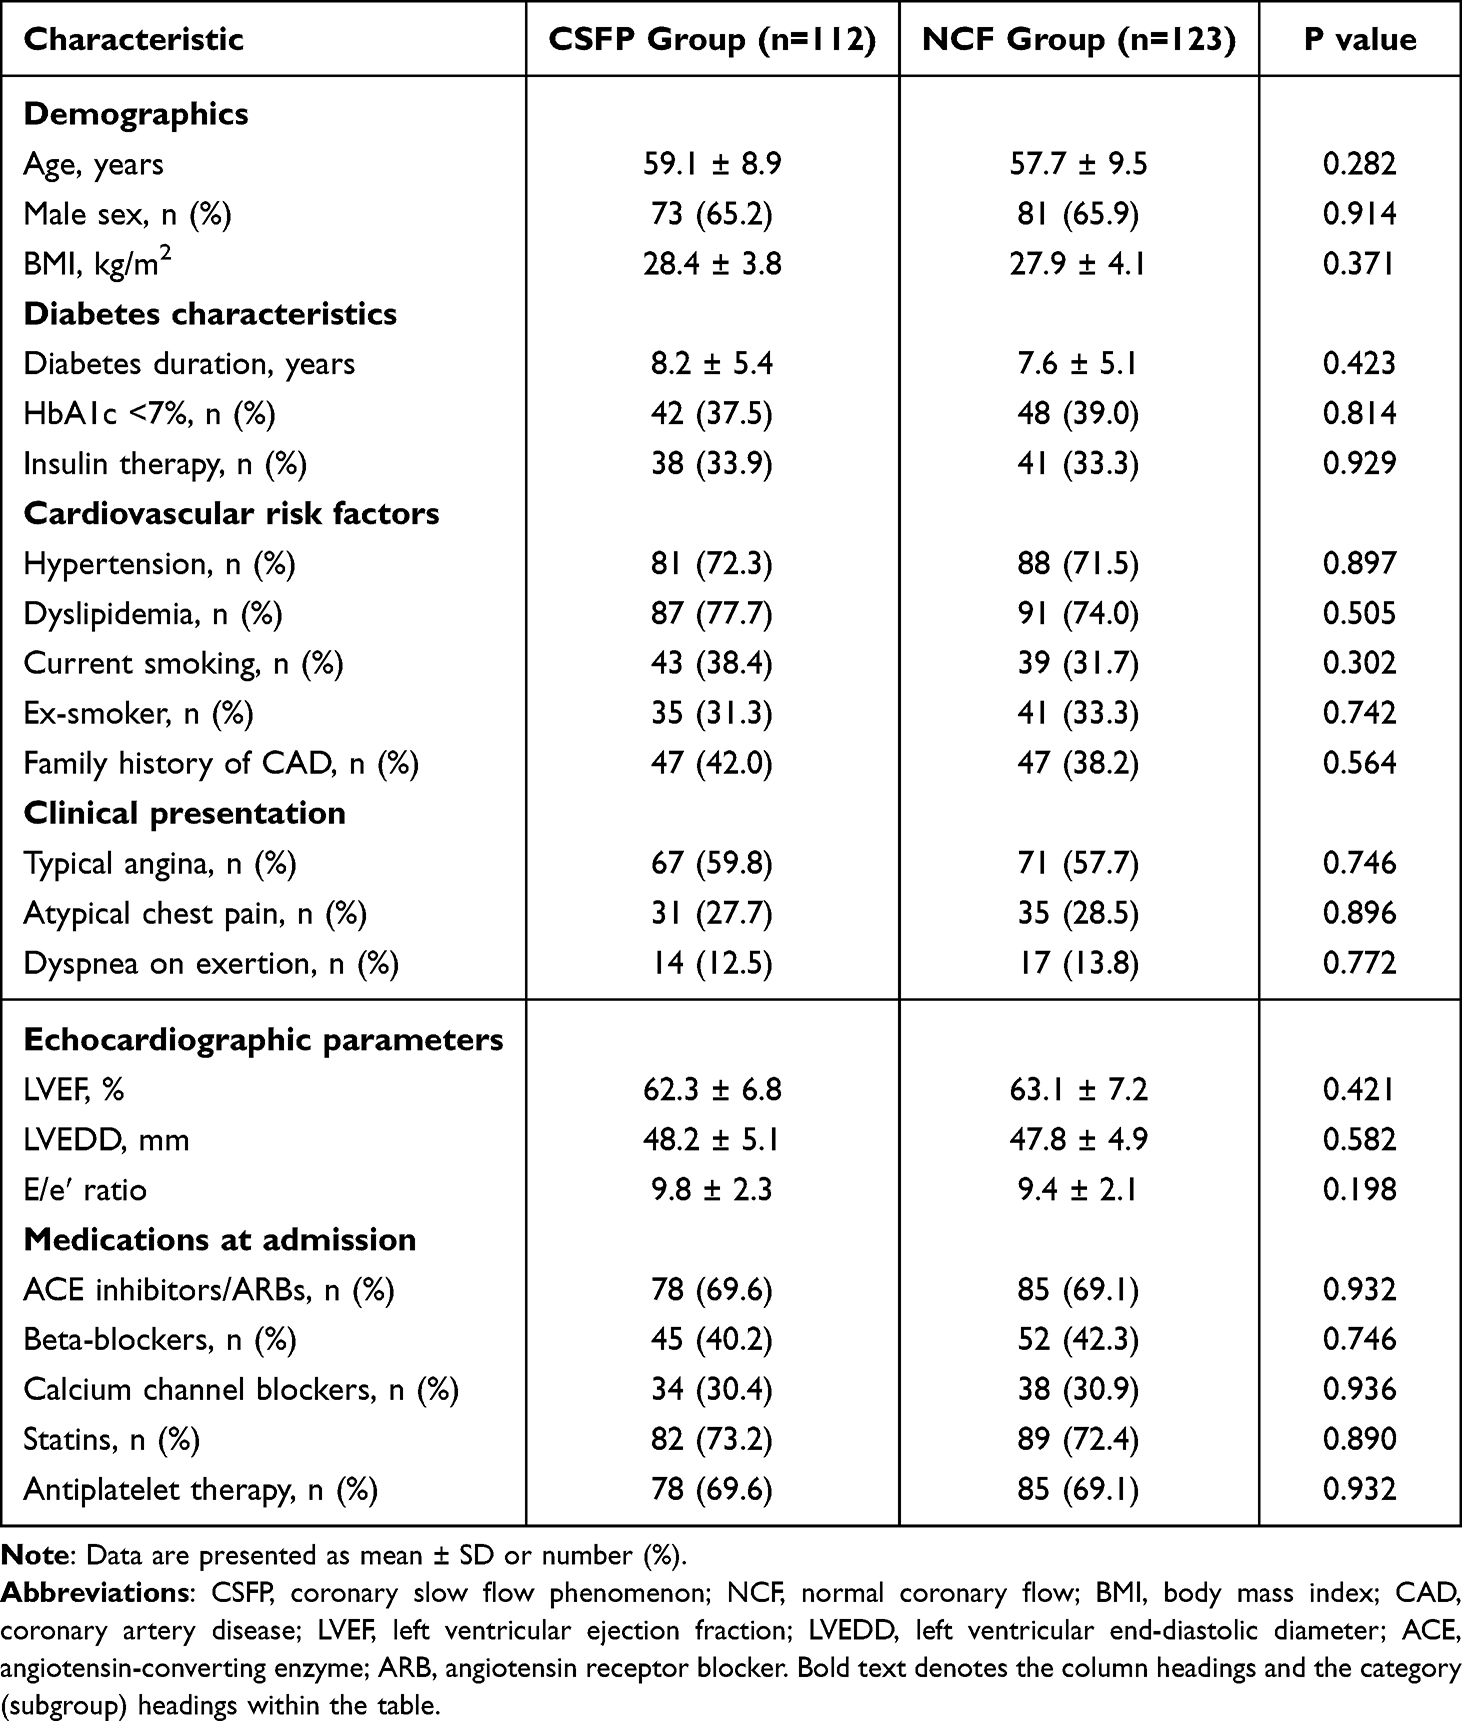 |
Table 1 Baseline Clinical Characteristics |
Laboratory Parameters
Patients with CSFP had higher admission glucose (9.8 ± 2.4 vs. 8.2 ± 1.9 mmol/L, p<0.001) and higher SHR (1.42 ± 0.31 vs. 1.08 ± 0.24, p<0.001) than those with NCF, despite similar HbA1c levels (7.8 ± 1.2% vs. 7.6 ± 1.1%, p=0.226). The CSFP group also showed higher hs-CRP and fibrinogen levels and a less favorable lipid profile (Table 2). SHR distribution by group is shown in Figure 2.
 |
Table 2 Laboratory and Biochemical Parameters |
 |
Figure 2 Distribution of the stress hyperglycemia ratio (SHR) by group. Box plots show SHR in the NCF (n=123) and CSFP (n=112) groups. Boxes span the interquartile range (IQR, 25th to 75th percentiles), the horizontal line within each box is the median, and whiskers extend to 1.5 times the IQR; open circles are values beyond the whiskers. Red triangles mark group means. Median SHR was 1.09 (IQR 0.87–1.23) in the NCF group and 1.38 (IQR 1.25–1.62) in the CSFP group; group means were 1.08 ± 0.24 and 1.42 ± 0.31, respectively (p<0.001). Abbreviations: CSFP, coronary slow flow phenomenon; IQR, interquartile range; NCF, normal coronary flow; SHR, stress hyperglycemia ratio. |
Angiographic Findings
Mean CTFC was significantly higher in the CSFP group across all three coronary arteries. Slow flow involved the LAD most frequently (91 patients, 81.3%), followed by the RCA (76 patients, 67.9%) and LCX (72 patients, 64.3%). Multi-vessel involvement (≥2 vessels) was present in 65 patients (58.0%) (Table 3).
 |
Table 3 Angiographic Characteristics and Coronary Flow Parameters |
Correlation Analysis
SHR was positively correlated with mean CTFC (r=0.621, p<0.001) and with individual vessel CTFC values (LAD: r=0.598; LCX: r=0.572; RCA: r=0.589; all p<0.001). This relationship persisted after adjustment for age, sex, body mass index (BMI), and hs-CRP (partial r=0.542, p<0.001) (Figure 3).
 |
Figure 3 Relationship between the stress hyperglycemia ratio (SHR) and mean corrected TIMI frame count (CTFC). Each point is one patient (n=235). The red line is the linear regression fit (y = 3.15 + 19.78x) with its 95% confidence interval (shaded). SHR correlated with mean CTFC (r = 0.621, p<0.001), and the association persisted after adjustment for age, sex, body mass index, and high-sensitivity C-reactive protein (partial r = 0.542, p<0.001). Abbreviations: CTFC, corrected TIMI frame count; SHR, stress hyperglycemia ratio. |
Predictors of CSFP
In univariate analysis, SHR, admission glucose, high-density lipoprotein cholesterol (HDL-C), triglycerides, hs-CRP, and current smoking were associated with CSFP. After multivariate adjustment, SHR was the strongest independently associated factor (odds ratio [OR]: 2.84, 95% CI: 1.92–4.21, p<0.001), followed by hs-CRP (OR: 1.28, 95% CI: 1.09–1.51, p=0.003) and current smoking (OR: 2.13, 95% CI: 1.08–4.21, p=0.029) (Table 4).
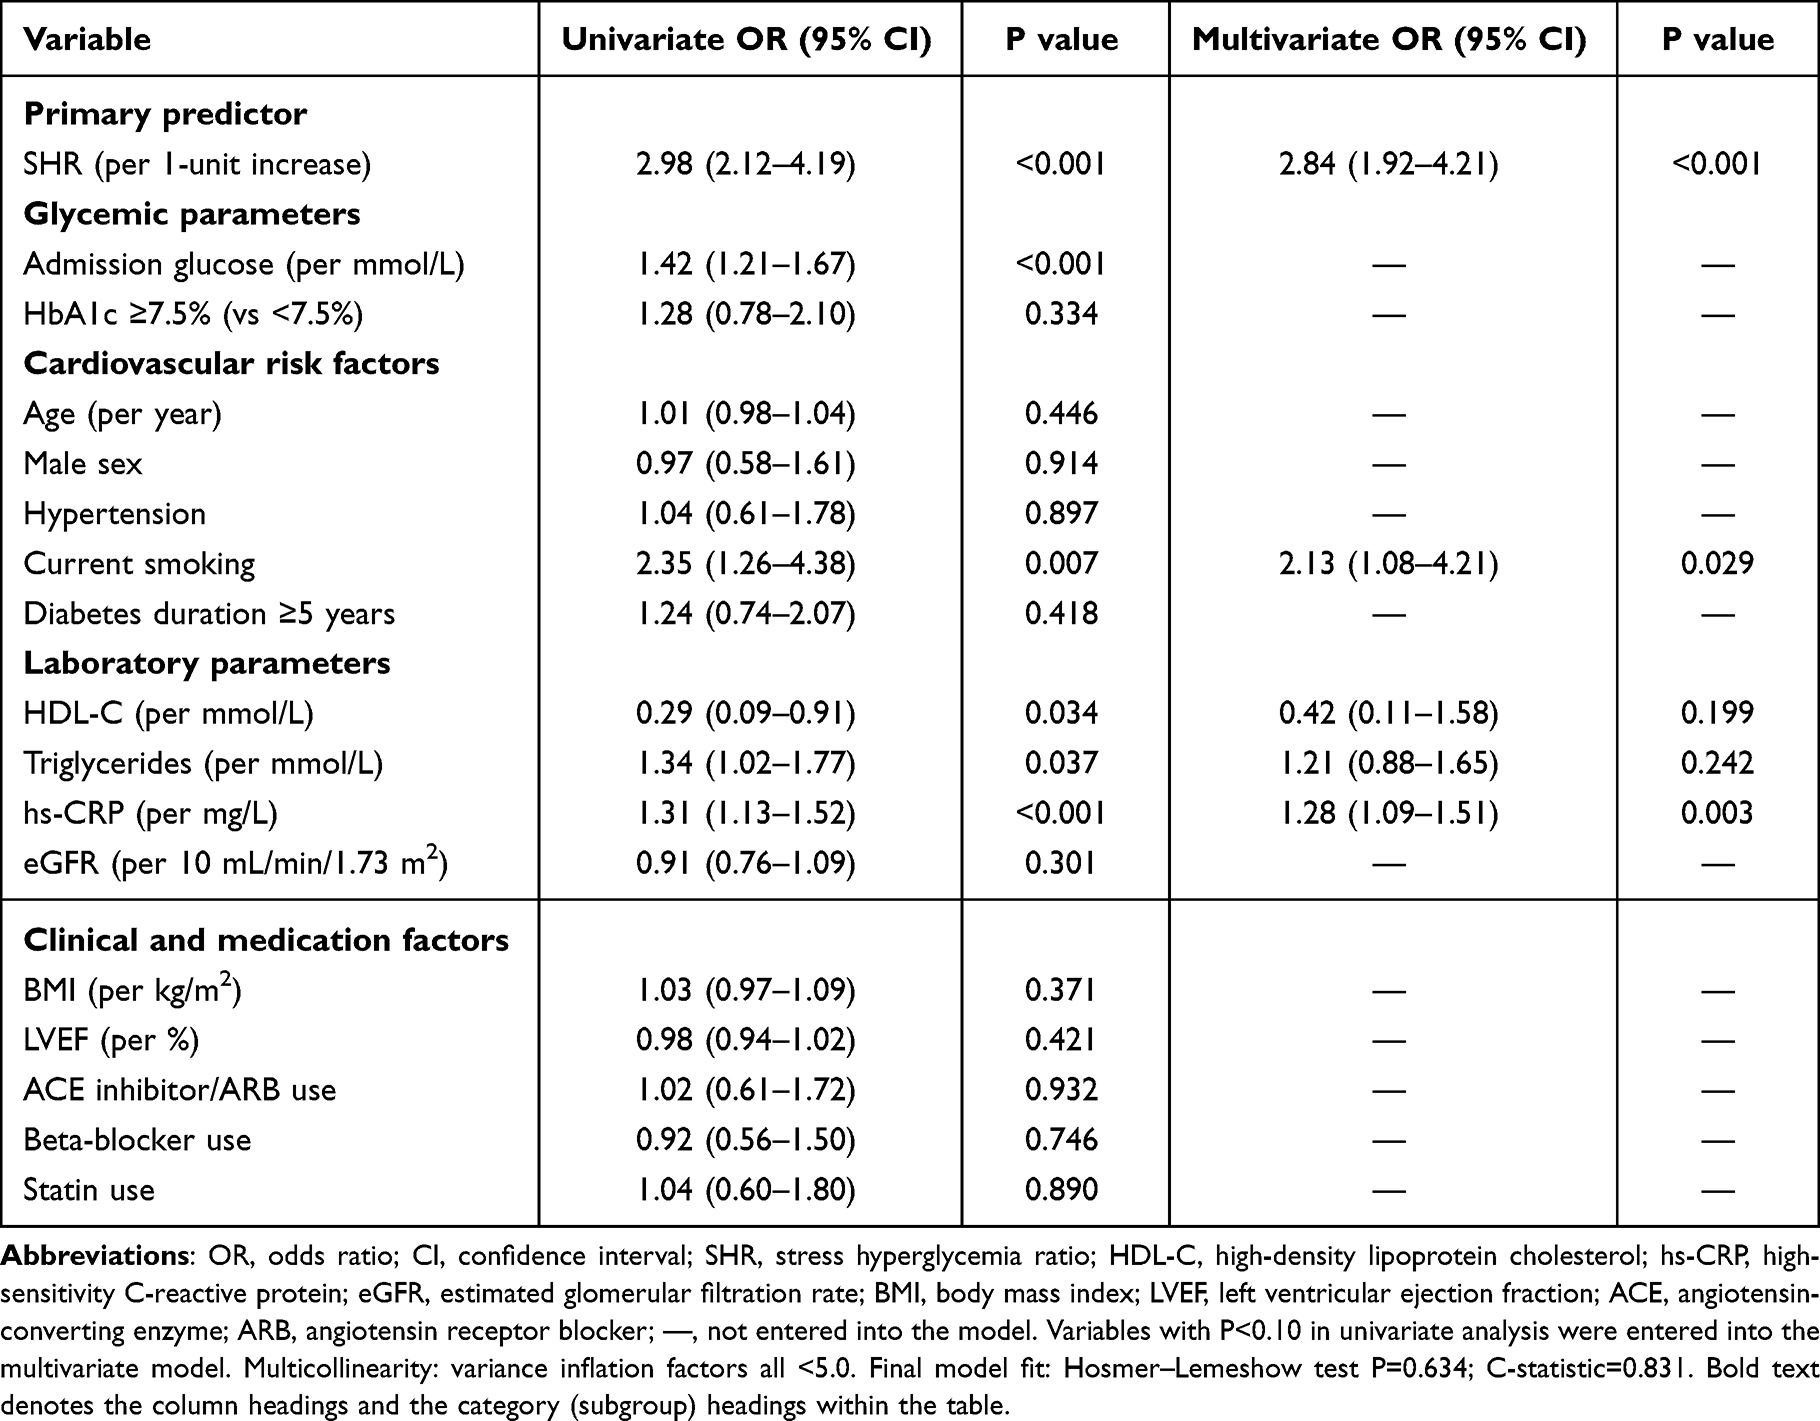 |
Table 4 Univariate and Multivariate Analysis of Factors Associated with Coronary Slow Flow Phenomenon |
Diagnostic Performance of the SHR
The SHR demonstrated good discriminatory performance for CSFP detection (AUC: 0.819, 95% CI: 0.760–0.876, p<0.001). At the optimal cutoff of 1.21, sensitivity was 78.6%, specificity 74.0%, positive predictive value 75.7%, and negative predictive value 77.1%. SHR outperformed admission glucose alone (AUC 0.724, p=0.003 by DeLong test) and hs-CRP alone (AUC 0.678, p<0.001), and performed comparably to a combined clinical risk score (AUC 0.795, p=0.412) (Figure 4 and Table 5).
 |
Table 5 Diagnostic Performance of the Stress Hyperglycemia Ratio for Identifying Coronary Slow Flow Phenomenon |
 |
Figure 4 Receiver operating characteristic (ROC) curve for the stress hyperglycemia ratio (SHR) in identifying CSFP. The area under the curve (AUC) was 0.819 (95% CI 0.760–0.876, p<0.001). At the cutoff selected by the Youden index (1.21), sensitivity was 78.6% and specificity 74.0%. The diagonal line corresponds to an AUC of 0.5 (no discrimination). Abbreviations: AUC, area under the curve; CI, confidence interval; CSFP, coronary slow flow phenomenon; ROC, receiver operating characteristic; SHR, stress hyperglycemia ratio. |
Subgroup Analyses
The association between SHR and CSFP was consistent across all predefined subgroups. Point estimates were similar regardless of glycemic control (HbA1c <7%: OR 2.76, 95% CI 1.54–4.94; HbA1c ≥7%: OR 2.91, 95% CI 1.73–4.89; p for interaction=0.821), diabetes duration (<5 years: OR 2.88, 95% CI 1.45–5.72; ≥5 years: OR 2.81, 95% CI 1.68–4.70; p for interaction=0.905), and insulin use (users: OR 2.79, 95% CI 1.42–5.48; non-users: OR 2.87, 95% CI 1.71–4.81; p for interaction=0.863) (Figure 5).
 |
Figure 5 Subgroup analysis of the association between the stress hyperglycemia ratio (SHR) and coronary slow flow phenomenon (CSFP). Each row shows the odds ratio for CSFP per 1-unit increase in SHR, estimated separately within subgroups defined by glycemic control (HbA1c <7% vs ≥7%), diabetes duration (<5 vs ≥5 years), and insulin use (yes vs no). Green circles are the point estimates and horizontal lines the 95% confidence intervals. The dashed vertical line marks an odds ratio of 1.0; estimates to its right favor CSFP and those to its left favor normal coronary flow. For each subgroup pair, the odds ratio with its 95% confidence interval and the p value for interaction are listed in the columns at right. Bold text (the right-hand column headings and the x-axis title) is used for emphasis only and does not indicate statistical significance. Abbreviations: CI, confidence interval; CSFP, coronary slow flow phenomenon; OR, odds ratio; SHR, stress hyperglycemia ratio. |
Discussion
In this case-control study of T2DM patients undergoing coronary angiography, the SHR was independently associated with CSFP. Despite comparable HbA1c levels, patients with CSFP had substantially higher SHRs, indicating that the degree of acute glycemic excursion — rather than chronic glycemic burden — distinguished the two groups. The strong correlation between SHR and CTFC (r=0.621) and the AUC of 0.819 support its value as a discriminator of coronary microvascular dysfunction.
The mechanistic basis of the SHR-CSFP association likely involves microvascular injury through several parallel pathways. Acute hyperglycemia increases reactive oxygen species, reduces nitric oxide bioavailability, and activates protein kinase C, impairing endothelium-dependent vasodilation.16 Concurrently, it promotes a prothrombotic state through platelet activation, thrombin generation, and impaired fibrinolysis,17 which may cause disturbed coronary microvascular regulation. These mechanisms are consistent with the CSFP pattern of preserved epicardial anatomy alongside disordered microvascular flow.
SHR outperformed admission glucose alone in identifying CSFP (AUC 0.819 vs. 0.724, p=0.003). This is pathophysiologically coherent: in patients with T2DM, absolute glucose values conflate chronic and acute glycemic states. The SHR isolates the acute component by adjusting for estimated average glucose. Previous work has associated SHR with poor outcomes in acute myocardial infarction,8 decompensated heart failure,9,10 and critical illness. The present data extend these observations by showing that SHR identifies microvascular dysfunction in clinically stable diabetic patients undergoing elective coronary angiography — a population not previously studied in this context. Altınkaya et al18 recently reported a similar finding in patients with MINOCA: SHR was independently associated with CSFP and identified it better than admission glucose did. Their cohort differed from ours, presenting acutely with MINOCA rather than undergoing elective angiography in a stable state, yet the result held in both settings. That two clinically distinct populations point the same way makes it more likely that the relevant factor is the acute rise in glucose above a patient’s usual level, not the chronic glycemic burden.
The SHR-CSFP association was consistent across subgroups defined by glycemic control, diabetes duration, and insulin use. Acute glycemic stress was not a proxy for poor chronic control or longer disease duration — the effect size was similar regardless of baseline HbA1c or treatment intensity. SHR appears to capture a pathophysiological process distinct from cumulative metabolic burden, one that operates irrespective of background glycemic status. This has practical implications: targeting acute glycemic excursions may complement standard long-term glycemic management in reducing microvascular complications.
The optimal threshold of 1.21 requires external validation before clinical adoption. That said, the ratio has clear practical appeal: it is computed from two values routinely available at coronary angiography — admission glucose and HbA1c — without additional cost or delay. With an accuracy of 76.2% and performance on par with a combined clinical risk score (AUC 0.795, p=0.412), SHR offers a single-variable shortcut for bedside risk assessment. The alternative cutoff of 1.15 may be preferred when high sensitivity is needed (86.6%), while 1.30 may be preferable when specificity is the priority (82.1%).
Although additional metabolic covariates such as adiponectin, insulin resistance indices, or glycemic variability metrics may further refine prediction, their incorporation was intentionally limited here to avoid model overfitting given the sample size. The SHR, by design, integrates both acute and chronic glycemic dimensions, thereby partly capturing broader metabolic burden within a single calculation. Future studies with larger, prospective cohorts should directly compare SHR with other metabolic indices and assess its ability to predict hard clinical endpoints in CSFP patients.
Limitations
The retrospective design precludes causal inference, although the strength and consistency of the association, together with its biological plausibility, are at least compatible with a causal link. Because patients with acute coronary syndrome were excluded, the findings do not extend to that higher-risk group.
The more consequential constraint is selection. We excluded 1,612 of 1,847 screened patients (87.3%), leaving a small cohort of clinically stable patients with T2DM who underwent elective angiography and had interpretable images for CTFC. This is not the broader diabetic population referred for coronary evaluation, and the resulting selection bias, combined with the single-center setting, limits how far the SHR–CSFP association can be generalized. Confirmation in less selected, multicenter cohorts is needed.
Two further gaps bear on interpretation. We obtained no invasive measures of coronary flow reserve or microcirculatory resistance, which would have characterized microvascular function more directly than the CTFC. We also have no follow-up data that link SHR to clinical outcomes, so the prognostic value of an elevated ratio in CSFP remains open.
Finally, our records did not reliably capture admission use of SGLT-2 inhibitors or GLP-1 receptor agonists. Both classes can improve coronary microvascular function, so uneven distribution between groups could have pushed the SHR–CSFP relationship in either direction. Prospective capture of these medications would help separate their effect from that of acute hyperglycemia.
Conclusions
In this single-center cohort of T2DM patients undergoing elective coronary angiography, the SHR was independently associated with CSFP and identified it better than admission glucose alone. The ratio is calculated from two values already obtained before angiography, admission glucose and HbA1c, so it adds no cost or delay and is readily applied at the bedside. Whether a high SHR also marks patients at greater downstream risk remains unknown. Prospective multicenter studies with clinical follow-up, and ideally an assessment of whether blunting acute glycemic excursions alters outcome, are the logical next step.
Abbreviations
ACE, angiotensin-converting enzyme; ARB, angiotensin receptor blocker; AUC, area under the curve; BMI, body mass index; CAD, coronary artery disease; CI, confidence interval; CSFP, coronary slow flow phenomenon; CTFC, corrected TIMI frame count; eGFR, estimated glomerular filtration rate; HbA1c, glycated hemoglobin; HDL-C, high-density lipoprotein cholesterol; hs-CRP, high-sensitivity C-reactive protein; ICC, intraclass correlation coefficient; IQR, interquartile range; LAD, left anterior descending artery; LCX, left circumflex artery; LDL, low-density lipoprotein; LVEDD, left ventricular end-diastolic diameter; LVEF, left ventricular ejection fraction; NCF, normal coronary flow; NT-proBNP, N-terminal pro-B-type natriuretic peptide; OR, odds ratio; RCA, right coronary artery; ROC, receiver operating characteristic; SHR, stress hyperglycemia ratio; T2DM, type 2 diabetes mellitus; TIMI, thrombolysis in myocardial infarction.
Data Sharing Statement
The data presented in this study are available on request from the corresponding author due to privacy and ethical restrictions.
Ethics Approval and Informed Consent
The study was conducted in accordance with the Declaration of Helsinki and was approved by the Ethics Committee of Adana City Training and Research Hospital, Adana, Türkiye (approval no: 2025–15/616). Patient consent was waived due to the retrospective nature of this study and in accordance with institutional guidelines. All patient data were anonymized and handled in strict confidentiality in accordance with institutional data-protection policies and applicable regulations.
Author Contributions
All authors made a significant contribution to the work reported, whether that is in the conception, study design, execution, acquisition of data, analysis and interpretation, or in all these areas; took part in drafting, revising or critically reviewing the article; gave final approval of the version to be published; have agreed on the journal to which the article has been submitted; and agree to be accountable for all aspects of the work.
Funding
This research did not receive any specific grant from funding agencies in the public, commercial, or not-for-profit sectors.
Disclosure
The authors declare no competing interests in this work.
References
1. Tambe AA, Demany MA, Zimmerman HA, Mascarenhas E. Angina pectoris and slow flow velocity of dye in coronary arteries—a new angiographic finding. Am Heart J. 1972;84:66–13. doi:10.1016/0002-8703(72)90307-9
2. Beltrame JF. Defining the coronary slow flow phenomenon. Circ J. 2012;76:818–820. doi:10.1253/circj.CJ-12-0205
3. Wang X, Nie SP. The coronary slow flow phenomenon: characteristics, mechanisms and implications. Cardiovasc Diagn Ther. 2011;1:37–43. doi:10.3978/j.issn.2223-3652.2011.10.01
4. Sezgin N, Barutcu I, Sezgin AT, et al. Plasma nitric oxide level and its role in slow coronary flow phenomenon. Int Heart J. 2005;46:373–382. doi:10.1536/ihj.46.373
5. Li JJ, Qin XW, Li ZC, et al. Increased plasma C-reactive protein and interleukin-6 concentrations in patients with slow coronary flow. Clin Chim Acta. 2007;385:43–47. doi:10.1016/j.cca.2007.05.024
6. Capes SE, Hunt D, Malmberg K, Gerstein HC. Stress hyperglycemia and increased risk of death after myocardial infarction in patients with and without diabetes: a systematic overview. Lancet. 2000;355:773–778. doi:10.1016/S0140-6736(99)08415-9
7. Roberts GW, Quinn SJ, Valentine N, et al. Relative hyperglycemia, a marker of critical illness: introducing the stress hyperglycemia ratio. J Clin Endocrinol Metab. 2015;100:4490–4497. doi:10.1210/jc.2015-2660
8. Yang Y, Kim TH, Yoon KH, et al. The stress hyperglycemia ratio, an index of relative hyperglycemia, as a predictor of clinical outcomes after percutaneous coronary intervention. Int J Cardiol. 2017;241:57–63. doi:10.1016/j.ijcard.2017.02.065
9. Zhou Q, Yang J, Wang W, et al. The impact of the stress hyperglycemia ratio on mortality and rehospitalization rate in patients with acute decompensated heart failure and diabetes. Cardiovasc Diabetol. 2023;22:189. doi:10.1186/s12933-023-01908-2
10. Zhou Y, Liu L, Huang H, et al. Stress hyperglycemia ratio and in-hospital prognosis in nonsurgical patients with heart failure and type 2 diabetes. Cardiovasc Diabetol. 2022;21:290. doi:10.1186/s12933-022-01728-w
11. Giacco F, Brownlee M. Oxidative stress and diabetic complications. Circ Res. 2010;107:1058–1070. doi:10.1161/CIRCRESAHA.110.223545
12. Paneni F, Beckman JA, Creager MA, Cosentino F. Diabetes and vascular disease: pathophysiology, clinical consequences, and medical therapy: part I. Eur Heart J. 2013;34:2436–2443. doi:10.1093/eurheartj/eht149
13. ElSayed NA, Aleppo G, Bannuru RR. American Diabetes Association. 2. Diagnosis and Classification of Diabetes: Standards of Care in Diabetes—2024. Diabetes Care. 2024;47(Suppl. 1):S20–S42. doi:10.2337/dc24-S002
14. Beltrame JF, Limaye SB, Horowitz JD. The coronary slow flow phenomenon: a new coronary microvascular disorder. Cardiology. 2002;97:197–202. doi:10.1159/000063121
15. Gibson CM, Cannon CP, Daley WL, et al. TIMI frame count: a quantitative method of assessing coronary artery flow. Circulation. 1996;93:879–888. doi:10.1161/01.CIR.93.5.879
16. Ceriello A, Esposito K, Piconi L, et al. Oscillating glucose is more deleterious to endothelial function and oxidative stress than mean glucose in normal and type 2 diabetic patients. Diabetes. 2008;57:1349–1354. doi:10.2337/db08-0063
17. Lemkes BA, Hermanides J, Devries JH, et al. Hyperglycemia: a prothrombotic factor? J Thromb Haemost. 2010;8:1663–1669. doi:10.1111/j.1538-7836.2010.03910.x
18. Altınkaya O, Aydemir S, Özmen M, Özkoç M, Macit R, Aksakal E. Association between stress hyperglycemia ratio and coronary slow flow phenomenon in patients with MINOCA. Int J Gen Med. 2026;19:592704. doi:10.2147/IJGM.S592704
 © 2026 The Author(s). This work is published and licensed by Dove Medical Press Limited. The
full terms of this license are available at https://www.dovepress.com/terms
and incorporate the Creative Commons Attribution
- Non Commercial (unported, 4.0) License.
By accessing the work you hereby accept the Terms. Non-commercial uses of the work are permitted
without any further permission from Dove Medical Press Limited, provided the work is properly
attributed. For permission for commercial use of this work, please see paragraphs 4.2 and 5 of our Terms.
© 2026 The Author(s). This work is published and licensed by Dove Medical Press Limited. The
full terms of this license are available at https://www.dovepress.com/terms
and incorporate the Creative Commons Attribution
- Non Commercial (unported, 4.0) License.
By accessing the work you hereby accept the Terms. Non-commercial uses of the work are permitted
without any further permission from Dove Medical Press Limited, provided the work is properly
attributed. For permission for commercial use of this work, please see paragraphs 4.2 and 5 of our Terms.
Recommended articles
Association Between Stress Hyperglycemia Ratio and Coronary Slow Flow Phenomenon in Patients with MINOCA
Altınkaya O, Aydemir S, Özmen M, Özkoç M, Macit R, Aksakal E
International Journal of General Medicine 2026, 19:592704
Published Date: 20 March 2026